Embed Size (px)
Citation preview

medicaid
kaiser commiss ion o nI
S
S
U
E
P
A
P
E
R
a n d t h e uninsured
1 3 3 0 G S T R E E T N W , W A S H I N G T O N , D C 2 0 0 0 5P H O N E : 2 0 2 - 3 4 7 - 5 2 7 0 , F A X : 2 0 2 - 3 4 7 - 5 2 7 4 , P U B L I C A T I O N S : 1 - 8 0 0 - 6 5 6 - 4 5 3 3W E B S I T E : W W W . K F F . O R G
September 2003
Medicaid Spending: What Factors Contributed to the Growth Between 2000 and 2002?
by John Holahan and Brian Bruen
Executive Summary
Total Medicaid spending rose by roughly 25% between federal fiscal year (FY) 2000 and FY 2002, increasing from $205.8 billion to $257.6 billion. At the same time, dramatic declines in state revenues have placed great pressure on state budgets, resulting in state efforts to curtail spending growth. Medicaid, the largest item in most state budgets after education, has been the target of cost-containment efforts in all 50 states and the District of Columbia.
This brief explores the factors underlying Medicaid spending growth. Rapid Medicaid spending growth has been driven, in part, by enrollment increases resulting from the loss of income and private insurance coverage during the current economic downturn, together with continued increases in hospital and prescription drug costs that have affected the entire health care sector. Despite slower enrollment growth for the aged and disabled than for children and nondisabled adults, the aged and disabled accounted for almost 60% of the spending growth. Although current growth rates may be high relative to state fiscal capacity, per enrollee spending growth is below levels seen in the private health care market.
Rapid enrollment growth among children and nondisabled adults can largely be attributed to the economic downturn, which resulted in declining incomes and lower rates of employer-sponsored insurance among low-income Americans. Medicaid enrollment grew in response. If Medicaid enrollment had not increased, the number of uninsured Americans would have increased sharply. As it was, data from the 2002 CPS (2001 data) showed that public program enrollment was sufficient to offset the decline in employer-sponsored insurance for children, but not for adults. As a result, the number of uninsured adults increased by 1.5 million, with further reported increases possible when the 2003 CPS is released (2002 data) later this month.

Medicaid spending per enrollee increased by 8.6% per year between 2000 and 2002. However, this is lower than the rates of increase in health care spending per person observed for those with private insurance and considerably lower than the rise in private health insurance premiums. Medicaid spending also increased because of rising health care costs in general. In particular, prescription drugs continue to increase at double-digit rates, with spending per enrollee increasing at about 15% per year. Medicaid is a large payer for prescription drugs because of the relatively poor health and levels of disability among its beneficiary population. Nearly half of all Medicaid drug spending went to elderly and disabled beneficiaries who were also covered by Medicare. Other acute care services such as outpatient hospitals, clinics, and prepaid managed care also had high rates of growth. In contrast, most long-term care services did not grow at particularly rapid rates. The exception was spending for home and community based services, which increased at about 12% per year.
While enrollment growth among children and nondisabled adults far exceeded the growth in the number of aged and disabled, the latter are far more expensive on a per enrollee basis. Increases in enrollment of the aged and disabled far exceeded growth in the general population, and this growth is likely to continue. Indeed, the program is affected by demographic changes that are outside of its control, such as increased rates of disability that are, in part, related to the aging of the population. Increased numbers of aged and disabled enrollees is leading to greater use of acute care and long-term care services. As a result, almost 60% of the growth in Medicaid spending over the last two years was due to increases in spending on aged and disabled individuals (Figure 1).
Interestingly, growth in acute care services among the aged and disabled was more of a contributor to growth in Medicaid spending for these populations than was growth in long-term care services (53% versus 47%), due to high use of prescription drugs and presumably technology-intensive acute care services.
Contributors to Medicaid Expenditure Growth by Enrollment Group, 2000-2002
DSH 0.7%
*Other 2.5%
Medicare Payments 2.1%
Total = $48.2 Billion
* Other = Administrative costs and adjustments.SOURCE: Urban Institute, 2003; estimates based on data from CMS, CMSO, Medicaid Statistical Information System (MSIS) and HCFA/CMS-64 Reports.
Children20.8%
Adults15.4% Disabled
34.3%
Aged24.3%
Aged and Disabled58.6%
Children and Adults
36.2%
Figure 1
2
Early indications are that spending growth in the program has moderated during FY 2003, with data through July 2003 suggesting an annual growth rate of 8.3%. State efforts to reduce the rate of enrollment growth through eligibility cutbacks, together with benefit reductions and provider payment freezes, have all likely contributed to this slowdown. State revenues have shown little signs of rebounding, however, and ongoing budget shortfalls will continue to place pressure on states to reduce spending growth in their Medicaid programs. While some of the factors that have driven Medicaid expenditures upward will fade as the economy improves – such as enrollment growth in response to the economic downturn – the effects of rising health care costs and demographic change on Medicaid expenditures will not. As a result, Medicaid will continue to place pressure on state budgets even with an economic recovery.
Overview
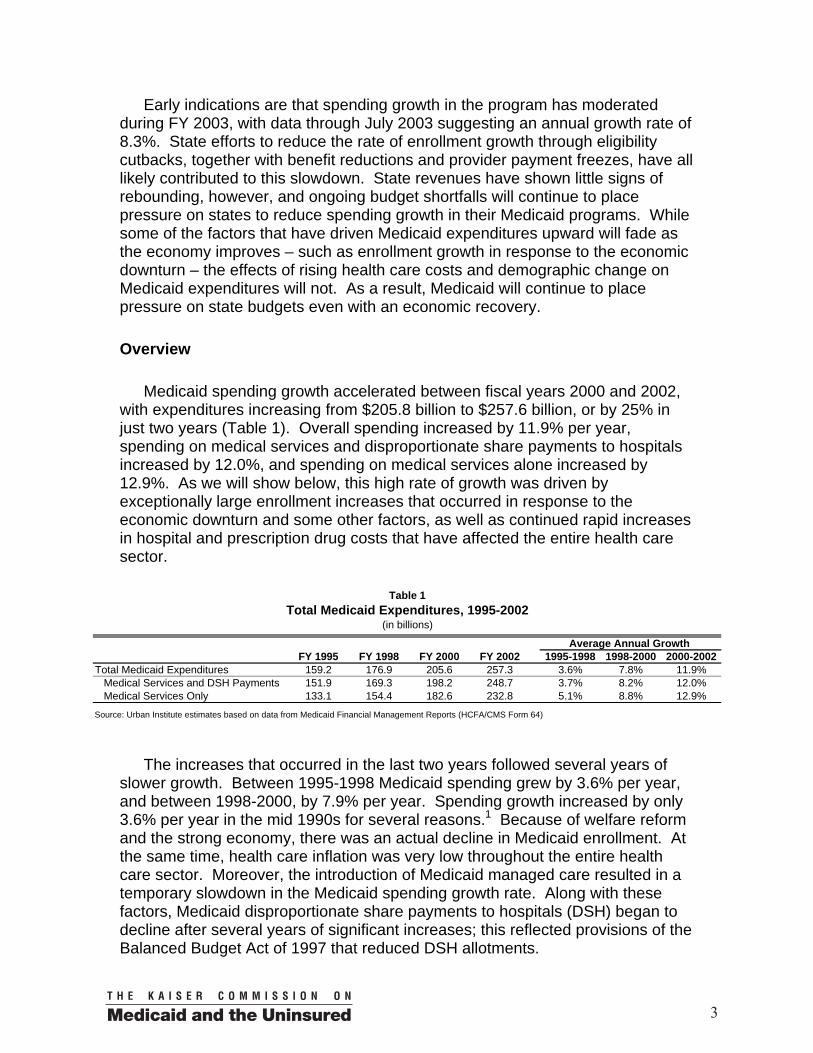
Medicaid spending growth accelerated between fiscal years 2000 and 2002, with expenditures increasing from $205.8 billion to $257.6 billion, or by 25% in just two years (Table 1). Overall spending increased by 11.9% per year, spending on medical services and disproportionate share payments to hospitals increased by 12.0%, and spending on medical services alone increased by 12.9%. As we will show below, this high rate of growth was driven by exceptionally large enrollment increases that occurred in response to the economic downturn and some other factors, as well as continued rapid increases in hospital and prescription drug costs that have affected the entire health care sector.
The increases that occurred in the last two years followed several years of slower growth. Between 1995-1998 Medicaid spending grew by 3.6% per year, and between 1998-2000, by 7.9% per year. Spending growth increased by only 3.6% per year in the mid 1990s for several reasons.1 Because of welfare reform and the strong economy, there was an actual decline in Medicaid enrollment. At the same time, health care inflation was very low throughout the entire health care sector. Moreover, the introduction of Medicaid managed care resulted in a temporary slowdown in the Medicaid spending growth rate. Along with these factors, Medicaid disproportionate share payments to hospitals (DSH) began to decline after several years of significant increases; this reflected provisions of the Balanced Budget Act of 1997 that reduced DSH allotments.
Table 1Total Medicaid Expenditures, 1995-2002
(in billions)
Average Annual Growth FY 1995 FY 1998 FY 2000 FY 2002 1995-1998 1998-2000 2000-2002
Total Medicaid Expenditures 159.2 176.9 205.6 257.3 3.6% 7.8% 11.9%Medical Services and DSH Payments 151.9 169.3 198.2 248.7 3.7% 8.2% 12.0%Medical Services Only 133.1 154.4 182.6 232.8 5.1% 8.8% 12.9%
Source: Urban Institute estimates based on data from Medicaid Financial Management Reports (HCFA/CMS Form 64)
3

In the late 1990s (1998-2000) Medicaid spending growth increased to 7.9% per year.2 Medicaid enrollment, which had fallen unintentionally following welfare reform, began to rebound after the Centers for Medicare and Medicaid Services (CMS) directed states to increase outreach and states improved enrollment procedures.3 Consistent with significant revenue growth experienced in the late 1990s, almost all states adopted the State Children’s Health Insurance Program (SCHIP) and several used Section 1931(b) provisions of welfare reform or Section 1115 waivers to expand coverage.4 States also expanded home and community based waiver programs and developed prescription drug programs for the elderly. Meanwhile, health care inflation began to increase, particularly for prescription drugs, which grew at double-digit rates. Hospital costs for both inpatient and outpatient care increased more rapidly than in the mid 1990s. Growing use of upper payment limit arrangements (programs in which hospitals and nursing homes transferred funds to the states with the states increasing provider reimbursement rates and collecting federal matching payments) also contributed to rising Medicaid expenditures.
As we will discuss in detail below, Medicaid spending growth accelerated after 2000. Medicaid enrollment increased considerably, for several reasons. Health care costs increased more rapidly, led by prescription drugs and hospital costs. Medicaid managed care was no longer providing states with the same savings that it was providing in the mid 1990s. At the same time, state revenues declined dramatically and severe budget shortfalls developed in many states. Large numbers of states have subsequently made cuts in benefits and provider payment rates, and some have reduced eligibility standards.5
Growth in Enrollment
Medicaid enrollment increased by 7.2% per year between 2000-2002, or 14.9% over the two-year period (Table 2). Enrollment (defined as those ever on the program during the federal fiscal year) increased from 44.2 million to 50.8 million in 2002. The highest rates in enrollment growth occurred among children (8.2% per year) and adults (10.3% per year). Enrollment of elderly and disabled individuals increased by 2.3% and 2.6%, respectively. These estimates are based on two different data sources. For 2000, we used data from the Medicaid Statistical Information System (MSIS) maintained by CMS. Because 2002 data are not yet available from MSIS, we use estimates for 2002 provided by the Congressional Budget Office (CBO) in their March 2003
Table 2Change in Medicaid Enrollment (Ever Enrolled),
2000-2002(in millions)
2000 2002
Average annual percentage
changePercentage
ChangeTotal Enrollment 44.2 50.8 7.2% 14.9%
Aged 4.3 4.5 2.3% 4.7%Disabled 7.5 7.9 2.6% 5.3%Children 21.8 25.5 8.2% 17.0%Adults 10.6 12.9 10.3% 21.7%
Sources: Urban Institute estimates based on data from the Medicaid Statistical Information
System (MSIS) and the Congressional Budget Office's March 2003 Baseline.
4

baseline.6 These data on enrollment growth are consistent with data provided by surveys conducted by Health Management Associates (HMA) for the Kaiser Commission on Medicaid and the Uninsured.7,8
The large enrollment growth seems to be due to a combination of the economic downturn, coupled with the increase in eligibility pathways that occurred because of SCHIP waivers, Section 1931(b) expansions, and Section 1115 waivers. These state expansions allowed more avenues for people to become eligible for Medicaid. Further, declining incomes after 2000 – i.e., increases in the number of people below the poverty level and below two times the poverty level – made more people eligible at all eligibility levels.9
The MSIS/CBO data are also consistent with analyses that we have presented in a previous paper.10 In that paper, we used Current Population Survey (CPS) data to calculate Medicaid, SCHIP, and state program enrollment growth between 2000 and 2001 (the most recent CPS year available). These data, shown in Table 3, indicate that Medicaid enrollment (all non-elderly beneficiaries) grew by 8.0% between 2000-2001. Enrollment increased by 9.4% for children and 6.1% for adults. Unlike the MSIS/CBO data in Table 2, enrollment growth was faster for children than for adults. However, the CPS data in Table 3 include SCHIP enrollment, and SCHIP experienced rapid rates of growth during this period because the program was in its relative infancy. Enrollment growth of adults below 100% of poverty, which is predominately Medicaid,11 was actually faster for adults than for children.
In the same paper, we showed a sharp drop in employer sponsored insurance (ESI) between 2000 and 2001, which seemingly led to increases in Medicaid coverage. Figure 2 shows some results from that analysis, which found that there was a decline of 1.3 percentage points in the rate of employer sponsored insurance among nonelderly individuals. Medicaid coverage increased by 0.8 percentage points for this population, offsetting some but not the entire decline in ESI. As a result, the number of uninsured increased. Figure 2 also shows that there were declines in ESI of 1.7 percentage points for children and 1.2 percentage points for adults. Medicaid and SCHIP enrollment increases seemed to fully offset the decline in ESI for children. Because there are fewer
Table 3Nonelderly Covered by Medicaid or State Programs, CPS 2000-2001
by Health Insurance Unit Income(in thousands)
Nonelderly Children Adults2000 2001 % Change 2000 2001 % Change 2000 2001 % Change
All Incomes 26,226 28,330 8.0% 15,627 17,089 9.4% 10,599 11,241 6.1%Less than 100% of FPL 14,461 15,229 5.3% 8,562 8,984 4.9% 5,898 6,245 5.9%100-199% of FPL 7,506 8,327 10.9% 4,686 5,277 12.6% 2,820 3,050 8.2%200% of FPL and above 4,259 4,775 12.1% 2,378 2,828 18.9% 1,881 1,947 3.5%
Source: Holahan, John, and Marie Wang. 2003. "Changes in Health Care Coverage, 2000-2001." Pub. no. 4089. Washington, D.C.: Kaiser Commission on Medicaid
and the Uninsured. March.
Note: Excludes persons aged 65 and older, those in the Armed Forces and the institutionalized population.
5

pathways to Medicaid eligibility for adults, Medicaid offset only part of the drop in ESI for adults. Consequently, the number of uninsured adults increased by 1.5 million.
Figure 3 shows that the drops in employer sponsored insurance were particularly sharp for children and adults under 200% of poverty. The rate of employer sponsored insurance
declined by 2.2 percentage points for children and 1.3 percentage points for adults. Exacerbating the problem was a large downward shift in the income distribution.12 Between 2000 and 2001, the number of Americans below 200% of poverty increased by 3.1 million, despite an increase of only 2.6 million in the overall population. Medicaid and SCHIP enrollment increased sharply in response to the decline in ESI for children. Although adult enrollment in public programs also increased, it only offset part of the decline for adults.
The growth in enrollment among the aged and disabled, while significantly slower than for children and nondisabled adults, is still important because of the high cost of serving these populations. These rates of growth, while relatively low, are still substantially faster than the rates of growth in the U.S. population. There are a number of reasons why enrollment of the aged and disabled populations continue to increase at 2.5% per year or higher. Increased enrollment of the aged is likely due to higher participation rates in Medicaid, possibly because the rapid rise in the cost of prescription drugs makes Medicaid participation more attractive. The enrollment in Medicaid of individuals using home and community based waiver services could also be a factor. Some share may be due to the effects of life saving medical technology
-1.6%**-2.2%**
-1.3%**
2.9%**
0.8%**0.5%
1.3%**
0.4%
-0.6%
Changes in Health Insurance Coverage AmongLow-Income* Nonelderly Americans, 2000-2001
(Percentage Point Differences)
Employer Medicaid/SCHIP/Other State
Uninsured
Change in Uninsured -0.0 Million1.3 Million 1.4 Million
Per
cen
tag
e P
oin
t C
han
ge
All Nonelderly Children Adults
* “Low income” defined as income less than 200% of poverty.** Indicates change is significant at the 95% confidence level.SOURCE: Holahan, John, and Marie Wang. 2003. “Changes in Health Care Coverage, 2000-2001.” Pub. no. 4089. Washington, D.C.: Kaiser Commission on Medicaid and the Uninsured. March.
Figure 3
-1.3%*
-1.7%*
-1.2%*
1.8%*
0.4%*0.4%*0.7%*0.8%*
-0.2%
Changes in Health Insurance Rates, 2000-2001(Percentage Point Differences)
Employer Medicaid/SCHIP/Other State
Uninsured
Change in Uninsured -0.1 Million1.4 Million 1.5 Million
Per
cen
tag
e P
oin
t C
han
ge
All Nonelderly Children Adults
* Indicates change is significant at the 95% confidence level.SOURCE: Holahan, John, and Marie Wang. 2003. “Changes in Health Care Coverage, 2000-2001.” Pub. no. 4089. Washington, D.C.: Kaiser Commission on Medicaid and the Uninsured. March.
Figure 2
6

that lengthens lives but may leave individuals with disabilities. Another factor may be increased recognition of chronic problems as disabilities. Finally, the baby boom that will eventually affect the size of the elderly population is now entering the 55-64 year old range, an age in which the likelihood of disabilities increases. Some combination of these factors is causing the aged and disabled populations to increase faster than the rate of overall population growth and, according to March 2003 CBO baseline projections, this trend is likely to continue over the rest of the decade.
Growth in Spending
As mentioned earlier, Medicaid spending increased by $51.7 billion, or by about 25.0%, between 2000-2002. Average annual growth rates increased from 7.8% between 1998-2000 to 11.9% between 2000-2002. Table 4 shows that the higher growth rates during the 2000-2002 period were fairly well spread across all services. Growth in acute care spending increased by 14.6% between 2000 and 2002 vs. 10.0% in the previous two years, while long term care spending increased by 10.7% between 2000-2002 vs. 7.6% in the previous two years.
Table 4Medicaid Expenditures by Type of Service and Year, 2000-2002
(in billions)
FFY 1998 FFY 2000 FFY 2002 1998-2000 2000-2002Total $176.9 $205.6 $257.3 7.8% 11.9%
Medical Services and DSH 169.3 198.2 248.7 8.2% 12.0%Medical Services Only 154.4 182.6 232.8 8.8% 12.9%
Acute Care 84.8 102.6 134.8 10.0% 14.6%Inpatient Hospital 24.1 26.5 32.7 4.8% 11.2%Physician/Lab/X-Ray 7.1 7.3 9.2 1.7% 12.6%Outpatient/Clinic 11.9 13.3 17.2 5.5% 13.7%Prescribed Drugs 11.7 16.6 23.4 19.1% 18.8%EPSDT 0.8 0.8 1.0 2.8% 10.2%Prepaid/Managed Care 19.6 26.5 35.8 16.4% 16.2%Other Services 9.8 11.7 15.5 9.5% 15.2%
Long Term Care 65.1 75.3 92.3 7.6% 10.7%Nursing Facility 34.4 39.6 47.5 7.4% 9.5%ICFMR1 10.0 10.2 11.2 1.0% 4.9%Mental Health Institutions2 3.1 3.3 4.0 2.9% 10.8%Home/Personal Care3 17.6 22.3 29.6 12.3% 15.2%
Payments to Medicare 4.4 4.6 5.7 2.5% 10.4%
DSH Payments 15.0 15.6 15.9 2.1% 1.1%Inpatient 11.7 11.6 12.5 -0.4% 4.2%Mental Health 3.3 4.0 3.4 10.6% -8.2%
Adjustments 0.7 -1.2 -3.3 -135.0% -166.0%
Administration 7.0 8.6 11.9 11.2% 17.6%
Sources: Urban Institute Estimates based on data from Medicaid Financial Management Reports (HCFA/CMS Form 64)
1) ICFMR = intermediate care facilities for the mentally retarded
3) Includes home health services, home- and community-based waiver services, personal care, and related services
Average Annual Growth
2) Includes inpatient psychiatric services for individuals under age 21 and other mental health facility services for individuals age 65 and older.
7

Medicaid payments to Medicare (i.e., premium and cost sharing assistance for people eligible for both programs) increased by 10.4%, substantially faster than in the previous two years, but DSH payments increased by only 1.1%.
The faster rate of growth in acute care spending relative to long term care was no doubt affected by the faster growth in enrollment among children and non disabled adults, groups that are far more likely to use acute care than long term care services. The distribution of spending by service and eligibility group is shown in Table 5. Children and families account for over 40% of spending on inpatient hospital, physician, lab and x-ray, and outpatient hospital services, over 60% of the spending on prepaid/ managed care, but only a small share of long term care spending. Aged and disabled enrollees account for over 70% of all spending, including 85% of spending on prescription drugs. Aged and disabled enrollees also account for over half the spending for hospital services (inpatient and outpatient) and nearly all expenditures for long term care services. As a result, the faster growth in enrollment among children and families will be particularly likely to affect acute care spending while growth in enrollment of aged and disabled enrollees would affect spending for nearly every type of service.
To analyze the relative contributions of enrollment growth and changes in spending per enrollee to overall Medicaid spending growth, we calculated a measure of spending per enrollee that controls for the effects of the changing composition of the Medicaid caseload. Simply dividing changes in expenditures by changes in enrollees would give a biased (downward) estimate of the growth in spending per beneficiary. Estimates would be biased downward because the caseload had shifted towards a less expensive group of people due to the faster enrollment growth among children and nondisabled adults.
Table 5Distribution of Medicaid Expenditures by Group and Type of Service, FFY 2000
Share of Expenditures for Each Group, by ServiceService Aged Blind & Disabled Adults ChildrenTotal 30.8% 41.7% 10.9% 16.6%
Inpatient Hospital 9.7% 45.8% 21.9% 22.6%Physician/Lab/X-Ray 11.0% 34.7% 27.1% 27.2%Outpatient/Clinic 9.9% 47.3% 19.1% 23.6%Prescribed Drugs 32.2% 52.8% 7.2% 7.8%Nursing Facility 83.7% 16.1% 0.1% 0.2%ICFMR1 8.0% 91.6% 0.0% 0.4%Mental Health Institutions2 21.5% 30.4% 1.5% 46.6%Home/Personal Care3 30.7% 62.7% 2.2% 4.4%Other Services 14.7% 48.3% 6.4% 30.6%Prepaid/Managed Care 8.9% 26.8% 23.7% 40.7%
Source: Urban Institute estimates based on data from the Medicaid Statistical Information System (MSIS)
General note: Excludes payments made under Title XXI (SCHIP), Medicare premiums paid by Medicaid (for persons eligible for
both programs), disproportionate share hospital payments, administrative costs, accounting adjustments, and the U.S. territories.
1) ICFMR = intermediate care facilities for the mentally retarded
2) Includes inpatient psychiatric services for individuals under age 21 and other mental health facility services for individuals age
65 and older.
3) Includes home health services, home- and community-based waiver services, personal care, and related services
8

We rely on MSIS for 2000 data on Medicaid expenditures. We project these expenditures to increase by the same growth rates that we observed in Medicaid Financial Management Reports from CMS (which show annualized data from CMS Form 64) for 2000 through 2002. The MSIS data have lower expenditure levels because some expenditures cannot be attributed to specific enrollees or, in other cases, to specific services. For this purpose we only use data that can be attributed to actual enrollees and to identifiable services.
To develop an unbiased measure of spending growth per enrollee, we divided the percentage change in spending for each service by a measure of aggregate enrollment growth that is weighted by the percentage of expenditures attributable to the eligibility group. For example, to calculate a measure of enrollment growth specific to prescription drugs, we used the data in Table 5 to derive weights for the aged (.322), the blind and disabled (.528), adults (.072) and children (.078). Multiplying these weights by the enrollment growth for the appropriate group gives us a measure of enrollment increases specific to the service. Dividing the expenditure weighted enrollment growth into the growth in expenditures for each service yields a measure of the percentage change in spending per enrollee for the service.13
The results of these calculations are shown in Table 6. Medicaid spending per enrollee increased by 5.3% per year for inpatient hospital care, 6.0% per year for physician, lab and x-ray services, and 7.8% per year for clinics. The growth in spending per enrollee for prescription drugs is noteworthy, averaging 14.8% per year. Other acute care services that grew rapidly were prepaid managed care (8.9% per year) and other services (10.0% per year). Spending for long-term care services on a per enrollee basis were somewhat lower, averaging 6.9% for nursing homes and 2.2% for ICFMRs, but home/personal care continued to increase sharply (11.9% per year).
Some of the increase in spending per enrollee, particularly for hospital inpatient care and nursing care, may reflect use of upper payment limit programs (UPL). UPL spending cannot be distinguished from other spending on services. The Congressional Budget Office estimates that UPL spending increased from $3.9 billion in 2000 to $7.4 billion in 2002. Recent work by Coughlin and Bruen suggests that these estimates of growth may be low.14 If the growth in UPL
Table 6Percentage Change in Spending Per Enrollee
By Service, 2000-2002Average Annual Total
Percentage Change Percentage Change2000-2002 2000-2002
Inpatient Hospital 5.3% 10.9%Physician/Lab/X-Ray 6.0% 12.4%Outpatient/Clinic 7.8% 16.3%Prescribed Drugs 14.8% 31.7%Nursing Facility 6.9% 14.3%ICFMR 2.2% 4.5%Mental Health Institutions 5.2% 10.8%Home/Personal Care 11.9% 25.3%Other Services 10.0% 20.9%Prepaid/Managed Care 8.9% 18.6%
Total 8.6% 17.8%
Sources: Urban Institute estimates based on data from Medicaid Financial Management Reports (HCFA/CMS Form 64)
9

payments was greater, then the growth in non-UPL Medicaid spending per enrollee would be lower than we have estimated.
This issue aside, we estimate that overall Medicaid spending per enrollee increased by 8.6%, a rate that compares favorably with increases in health care costs and private sector premiums. For example, estimates by CMS actuaries project that national health expenditures per capita increased by 7.8% in 2001 and 7.7% in 2002.15 But this includes a wide range of health care spending including public health activities and spending by the uninsured. A more recent paper by Strunk and Ginsburg estimates that health care spending per person with private insurance increased by 10.0% in 2001 and by 9.6% in 2002.16 They further estimate that hospital inpatient care grew by about 7.0% per year per person in 2001 and 2002. During the same years, hospital outpatient care grew by over 15.0% per year and prescription drugs by over 13.0% per year.
Strunk and Ginsburg further show that private insurance premiums increased by 13.0% in 2002, following a 12.0% increase in 2001. Other surveys conducted by the Kaiser Family Foundation and the Hospital Research and Educational Trust found that private health insurance premiums increased by 11.0% in 2001, followed by 12.7% in 2002.17 Some of this reflects rising health care costs, but some also reflects the health insurance underwriting cycle where insurers increase premiums a faster rate than underlying costs to make up for losses in previous years.
Growth in Spending By Eligibility Group
With estimates of the growth in spending per enrollee calculated for each service, we can then decompose the growth in spending for each of the eligibility groups into the change in enrollment and the change in spending per enrollee. The results are shown in Table 7. The growth in enrollment repeats the data provided in Table 2. The change in spending per enrollee for each of the eligibility groups ranges from 8.1% for adults to 8.7% for the disabled. The growth in spending per enrollee varies considerably across services. There is much less variation in the change in spending per enrollee for each eligibility
Table 7
Average Annual Percent Change in Enrollment and Spending by Group, 2000-2002Enrollment (in millions) Spending Per Enrollee Total Spending (in millions)
2000 2002 % Change 2000 2002 % Change 2000 2002 % Change
Children 21.8 25.5 8.2% 1,228 1,444 8.4% 26,780 36,819 17.3%Adults 10.6 12.9 10.3% 1,661 1,939 8.1% 17,602 25,015 19.2%Disabled 7.5 7.9 2.6% 8,998 10,634 8.7% 67,485 84,010 11.6%Aged 4.3 4.5 2.3% 11,596 13,682 8.6% 49,863 61,567 11.1%
Total 44.2 50.8 7.2% 3,659 4,083 5.6% 161,729 207,411 13.2%
Source: Urban Institute estimates based on data from the Medicaid Statistical Information System (MSIS) and HCFA/CMS-64 reports.
General note: Excludes payments made under Title XXI (SCHIP), Medicare premiums paid by Medicaid (for persons eligible for
both programs), disproportionate share hospital payments, administrative costs, accounting adjustments, and the U.S. territories.
10

group because each of the groups use services that were growing at fast and slow rates within their market basket. For example, the blind and disabled accounted for about 53.0% of spending on prescription drugs, the fastest increasing service, but also account for 92.0% of ICF-MR spending, the slowest growing service.
Because there were not great differences in the growth in spending per enrollee for each of the eligibility groups, changes in overall spending were largely driven by differences in enrollment growth. Thus, we estimate that spending grew by 17.3% for children and 19.2% for adults, compared to 11.6% for the blind and disabled and 11.1% for the aged.
Table 8 looks at spending growth for aged and disabled enrollees in more detail. As shown earlier, enrollment grew relatively slowly. But for each group, spending per enrollee grew faster for acute care than for long term care—by about 3 percentage points for the aged and about 2 percentage points for the disabled. Thus, while long-term care is important for the aged and disabled, particularly the former, it is acute care spending for these populations that is growing at faster rates.
A Decomposition of the Growth in Medicaid Expenditures
While data on relative growth rates are instructive, it is also useful to divide the growth in spending into each of its various components, particularly acute and long term care spending for each of the eligibility groups. These data, provided in Table 9, show that acute care spending accounted for 65.5% of Medicaid spending growth, while long-term care accounted for 29.3%. Increases in disproportionate share spending, payments to Medicare, and administrative costs accounted for about 5% of Medicaid spending growth over the period.
Table 8Average Annual Percentage Change in Enrollment and Spending, Acute and Long Term Care Spending for the Aged and Disabled
Enrollment (in millions) Spending Per Enrollee Total Spending (in millions)2000 2002 % Change 2000 2002 % Change 2000 2002 % Change
AgedAcute Care 4.3 4.5 2.3% 3,390 4,172 10.9% 14,576 18,774 13.5%Long Term Care 4.3 4.5 2.3% 8,206 9,510 7.6% 35,286 42,793 10.1%
DisabledAcute Care 7.5 7.9 2.6% 5,519 6,604 9.4% 41,389 52,172 12.3%Long Term Care 7.5 7.9 2.6% 3,479 4,030 7.6% 26,095 31,838 10.5%
All Aged and DisabledAcute Care 11.8 12.4 2.5% 4,743 5,721 9.8% 55,966 70,945 12.6%Long Term Care 11.8 12.4 2.5% 5,202 6,019 7.6% 61,382 74,632 10.3%
Source: Urban Institute estimates based on data from the Medicaid Statistical Information System (MSIS) and HCFA/CMS-64 reports.
General note: Excludes payments made under Title XXI (SCHIP), Medicare premiums paid by Medicaid (for persons eligible for both programs),
disproportionate share hospital payments, administrative costs, accounting adjustments, and the U.S. territories.
11

Increases in spending by children and nondisabled adults accounted for about 36% of Medicaid spending growth. Thus, while enrollment of children and adults increased at about four times the rate for the aged and the disabled, spending on children and adults accounted for a little more than one third of Medicaid spending increases that occurred between 2000 and 2002. Increased spending on the disabled accounted for about 34% of Medicaid spending growth, while another 24% was attributable to the aged. About two thirds of the spending growth for the disabled was for acute care services. We did not attempt to determine how much of Medicaid spending growth was attributable to dual eligibles; however 93 percent of Medicaid spending on the aged and 36 percent of spending on the disabled was for dual eligibles,18 so it is likely that about 30% to 35% of the growth was due to dual eligibles.
Projections for 2003
Figure 4 presents data on annual growth in federal outlays for Medicaid from 1998 to 2003, using data based on monthly statements from the U.S. Department of the Treasury.19 Growth rates roughly mirror the spending growth
described earlier in this paper. Spending growth accelerated each year, peaking at 14.0% growth in fiscal 2002. What is noteworthy is that spending growth seems to have fallen off to 8.3% for fiscal year 2003. Data are only available through July 2003; thus we estimated annual spending for 2003 based on outlays through July. That spending growth seems
Annual Growth in Federal Outlays for Medicaid
FFY 1998 – FFY 2003
5.9% 6.7%
9.1% 9.7%
14.0%
8.3%
0%
2%
4%
6%
8%
10%
12%
14%
16%
1998 1999 2000 2001 2002 2003*
Federal Fiscal Year
Per
cen
t C
han
ge
*All percentage change numbers reflect annual changes for the federal fiscal year. The 8.3% growth for FFY 2003 is an estimate for the fiscal year, based on 10 months of data (October 2002-July 2003).
Source: U.S. Department of the Treasury, Financial Management Service, Monthly Treasury Statements of Receipts and Outlays of the United States Government
Figure 4
Table 9
Contributions to Medicaid Expenditure Growth, 2000-2002
Expenditure Growth % of Total
(in millions) ChangeTotal Change $48,236 100.0%
Acute Care 31,572 65.5%Children 9,414 19.5%Adults 7,178 14.9%Blind/Disabled 10,782 22.4%Aged 4,197 8.7%
Long Term Care 14,110 29.3%Children 625 1.3%Adults 235 0.5%Blind/Disabled 5,743 11.9%Aged 7,507 15.6%
DSH 351 0.7%
Other1 1,188 2.5%
Medicare 1,014 2.1%
1) Administrative costs and adjustments.
Source: Urban Institute estimates based on data from the Medicaid Statistical Information System (MSIS) and HCFA/CMS-64 reports.
12

to have declined suggests that the large enrollment increases that we have observed may have peaked and that states have curtailed spending growth through benefit cuts and provider payment freezes (or reductions). Some states have cut eligibility for the program, which would reduce the rate of growth in enrollment. Some of the slowing of growth may also reflect cutbacks of UPL programs as required by the Medicare, Medicaid and SCHIP Benefits Improvement and Protection Act of 2000 (BIPA).
Conclusion
Medicaid spending increased by over $50 billion between 2000 and 2002, or by 25% in just two years. This growth has exacerbated the pressure on state budgets resulting from the rapid falloff in state revenues. The result has been extensive efforts by states to curtail Medicaid spending. It is important to understand the reasons for the rapid growth in these two years. The results from this paper will hopefully inform policymakers and help them avoid inappropriate policy choices.
Many factors contributed to this rapid growth. One factor, among many, for the increase in Medicaid spending was enrollment growth among children and nondisabled adults. Much of this growth seemed to be due to declining incomes and declining rates of employer sponsored insurance among low-income Americans. Medicaid enrollment increased in response.20 If Medicaid enrollment had not increased, the number of uninsured Americans would have increased sharply. As it was, data from the 2002 CPS (2001 data) showed that public program enrollment was sufficient to offset the decline in employer-sponsored insurance for children, but not for adults. As a result, the number of uninsured adults increased by 1.5 million and another increase in the number of uninsured adults is likely to be observed when the 2003 CPS is released (2002 data).
Medicaid spending per enrollee increased by 8.6% per year between 2000 and 2002. Importantly, this is lower than the rates of increase observed for those with private insurance. Some of the more than 8% increase may have been due to increased use of upper payment limit programs by states. Medicaid spending also increased because of rising health care costs in general. In particular, prescription drugs continue to increase at double-digit rates, with spending per enrollee increasing at about 15% per year. Medicaid is a large payer for prescription drugs because of the relatively poor health and levels of disability among its beneficiary population. Other acute care services such as outpatient and clinics and prepaid managed care also had high rates of growth. In contrast, long-term care in general did not grow at particularly rapid rates. The exception was spending for home and community based services, which increased at about 12% per year.
While enrollment growth among children and nondisabled adults far exceeded the growth in the number of aged and disabled, the latter are far more expensive
13

on the per enrollee basis. Increases in enrollment of the aged and disabled far exceeded growth in the population, and this growth is likely to continue for some time. As a result, almost 60% of the growth in Medicaid spending was due to increases in spending on aged and disabled individuals. Finally, growth in acute care services among the aged and disabled was more of a contributor to growth in Medicaid spending for these populations than was growth in long-term care services, due to high use of prescription drugs and presumably technology-intensive acute care services.
We conclude that the rapid growth in spending that occurred between 2000-2002 occurred for reasons that were largely out of states’ control. Medicaid enrollment grew largely in response to declines in incomes and declining rates of employer-sponsored insurance that occurred because of the economic downturn. State Medicaid programs played a role in softening the effect of the recession. Without this enrollment growth, the number of uninsured would have risen sharply. Some of the growth in enrollment occurred because states expanded coverage through SCHIP and other avenues to higher income levels for both children and parents. But this followed the intent of federal legislation that encouraged states to expand coverage as part of an effort at incremental health care reform.
States were also vulnerable to increases in health care costs, particularly because of the important role prescription drugs plays in the program. We have shown health care cost increases in Medicaid were high but nonetheless somewhat below those in the private sector. Finally, the program is affected by demographic changes that are outside of its control, such as increased rates of disability that are, in part, related to the aging of the population. Increased numbers of aged and disabled enrollees is leading to greater use of acute care and long-term care services.
While some of the factors that have driven Medicaid expenditures upward will fade as the economy improves – such as enrollment growth in response to the economic downturn – the effects of rising health care costs and demographic change on Medicaid expenditures will not. As a result, Medicaid will continue to place pressure on state budgets.
14

Endnotes
1 Bruen, Brian, and John Holahan. 2001. “Medicaid Spending Growth Remained Modest in 1998 But Likely Headed Upward.” Pub no. 2230. Washington, D.C.: Kaiser Commission on Medicaid and The Uninsured. February.
2 Bruen, Brian K., and John Holahan. 2002. “Acceleration of Medicaid Spending Reflects Mounting Pressures.” Pub no. 4056. Washington, D.C.: Kaiser Commission on Medicaid and the Uninsured. May.
3 Ellwood, Marilyn. 1999. “The Medicaid Eligibility Maze: Coverage Expands but Enrollment Problems Persist.” Washington, D.C.: The Urban Institute. Assessing the New Federalism Occasional Paper 30; Ellwood, Marilyn, and Kimball Lewis. 1999. “On and Off Medicaid: Enrollment Patterns for California and Florida in 1995.” Washington, D.C.: The Urban Institute. Assessing the New Federalism Occasional Paper 27; Ellwood, Marilyn, and Leighton Ku. 1998. “Welfare and Immigration Reforms: Unintended Side Effects for Medicaid.” Health Affairs 17(3): 137-51.
4 Section 1931 of the Social Security Act, which was established by the Personal Responsibility and Work Opportunity Reconciliation Act of 1996 (P.L. 104-193), allows states to expand eligibility for families and children by applying more generous methodologies when counting income and resources. Section 1115 of the Social Security Act was enacted in 1962, prior to the creation of Medicaid. It allows the Secretary of Health and Human Services to establish demonstration projects in individual states by waiving statutory and regulatory provisions for programs under the Social Security Act, including Medicaid and CHIP.
5 Smith, Vernon et al. 2003. States Respond to Fiscal Pressure: State Medicaid Spending Growth and Cost Containment – Results from a 2003 Survey. Washington, D.C.: Kaiser Commission on Medicaid and the Uninsured. September.
6 Congressional Budget Office, March 2003 baseline.
7 Ellis, Eileen R., Vernon K. Smith, Jason Jorkasky and David Rousseau. 2003. “Medicaid Enrollment in 50 States: June 2002 Data Update.” Washington, D.C.: Kaiser Commission on Medicaid and the Uninsured. July.
8 HMA data on enrollment growth for all 50 states showed that the number of Medicaid beneficiaries increased by 8.3% in 2001 and 9.2% in 2002. These rates are slightly faster than the growth rates based on the MSIS/CBO data shown in Table 2. Data provided by HMA indicated that families and children increased by
15

11.0% in 2001 and 13.0% in 2002. Enrollment growth of the aged and disabled increased by 3.1% in 2001 and 3.4% in 2002.
9 Holahan, John, and Marie Wang. 2003. “Changes in Health Care Coverage, 2000-2001.” Pub. no. 4089. Washington, D.C.: Kaiser Commission on Medicaid and the Uninsured. March.
10 Holahan and Wang, “Changes in Health Care Coverage, 2000-2001.”
11 The only exception would be parents covered under SCHIP waivers.
12 Holahan and Wang, “Changes in Health Care Coverage, 2000-2001.”
13 The weighted enrollment growth rate for prescription drug users would be much lower than the average growth rate in enrollment because the weights suggest that this service is predominately used by the aged and disabled. Dividing the growth in spending for prescription drugs by a measure of enrollment growth that reflects the actual users of prescription drugs yields a growth in spending per enrollee of 14.8%. If we had simply used an unweighted enrollment growth rate we would have calculated a slower growth in spending per enrollee for prescription drugs. This would have been misleading because it would reflect the shift in the composition of the enrollee population as well as the rising cost of prescription drugs.
14 Coughlin, Teresa A., Brian K. Bruen and Jennifer King. 2003. “State Use of Medicaid DSH and UPL Programs.” Final report submitted to Kaiser Commission on Medicaid and the Uninsured, Kaiser Family Foundation. January.
15 Heffler, Stephen, Sheila Smith, Sean Keehan, M. Kent Clemons, Greg Won and Mark Zezza. 2003. “Health Spending Projections for 2002-2012.” Health Affairs Web exclusive. February. http://www.healthaffairs.org/WebExclusives/2202Heffler.pdf. (Accessed August 29, 2003).
16 Strunk, Bradley C., and Paul B. Ginsburg. 2003. “Tracking Health Care Costs: Trends Stabilize But Remain High in 2002.” Health Affairs Web exclusive. June. http://www.healthaffairs.org/WebExclusives/2204Strunk.pdf. (Accessed August 29, 2003).
17 Gabel, Jon, Larry Levitt, et. al, “Job Based Health Benefits in 2002: Some Important Trends,” Health Affairs, 21(5), September/October 2002.
18 Urban Institute estimates from 2000 MMIS data.
16

19 U.S. Department of Commerce, Financial Management Service. 2003 and earlier. “Monthly Treasury Statement of Receipts and Outlays of the United States Government.” Washington, D.C.: FMS. July (2003) and September (1998 – 2002).
20 Garrett, Bowen, and John Holahan. 2001. “Rising Unemployment and Medicaid.” Health Policy Online No. 1. Washington, D.C.: The Urban Institute. October 16. http://www.urban.org/UploadedPDF/410306_HPOnline_1.pdf. (Accessed August 29, 2003).
17

1 3 3 0 G S T R E E T N W , W A S H I N G T O N , D C 2 0 0 0 5P H O N E : 2 0 2 - 3 4 7 - 5 2 7 0 , F A X : 2 0 2 - 3 4 7 - 5 2 7 4 , W E B S I T E : W W W . K F F . O R G
A d d i t i o n a l f r e e c o p i e s o f t h i s p u b l i c a t i o n a r e a v a i l a b l e o n o u r w e b s i t e
T h e K a i s e r C o m m i s s i o n o n M e d i c a i d a n d t h e U n i n s u r e d w a s e s t a b l i s h e d b y T h e H e n r y J . K a i s e rF a m i l y F o u n d a t i o n t o f u n c t i o n a s a p o l i c y i n s t i t u t e a n d f o r u m f o r a n a l y z i n g h e a l t h c a r ec o v e r a g e , f i n a n c i n g a n d a c c e s s f o r t h e l o w - i n c o m e p o p u l a t i o n a n d a s s e s s i n g o p t i o n s f o r r e f o r m .T h e H e n r y J . K a i s e r F a m i l y F o u n d a t i o n i s a n i n d e p e n d e n t n a t i o n a l h e a l t h c a r e p h i l a n t h r o p y a n di s n o t a s s o c i a t e d w i t h K a i s e r P e r m a n e n t e o r K a i s e r I n d u s t r i e s .