Embed Size (px)
Citation preview

Copyright © 2011 by the American Academy of ActuariesAll Rights Reserved. 1
Medicaid Rate Setting 101Medicaid Rate Setting 101
Capitation Rate DevelopmentCapitation Rate DevelopmentProcess and ConsiderationsProcess and Considerations
June 16, 2011
American Academy of ActuariesMedicaid Work Group

Copyright © 2011 by the American Academy of ActuariesAll Rights Reserved. 2
PresentersPresenters
Tim MahonyState Health Policy Analyst, American Academy of Actuaries
Rob Damler, FSA, MAAAMember, American Academy of Actuaries Medicaid Work Group
Kate Tottle, FSA, MAAAMember, American Academy of Actuaries Medicaid Work Group
Mike Nordstrom, ASA, MAAAChair, American Academy of Actuaries Medicaid Work Group

Copyright © 2011 by the American Academy of ActuariesAll Rights Reserved. 3
DisclaimerDisclaimer
Statements made by Academy members during this presentation are the personal opinions of the presenters and do not necessarily reflect the opinions or policy positions of their employers, the American Academy of Actuaries, the Actuarial Standards Board, or any of the Academy’s other boards, councils or committees.

Copyright © 2011 by the American Academy of ActuariesAll Rights Reserved. 4
Presentation Agenda / OutlinePresentation Agenda / Outline
Academy Overview and Certification Requirements—
Tim Mahony and Rob Damler
Capitation Rate Development—Rob Damler and Kate Tottle
Additional Financial Provisions—Mike Nordstrom
Q & A

Copyright © 2011 by the American Academy of ActuariesAll Rights Reserved.
Academy Overview and Certification Academy Overview and Certification RequirementsRequirements
Tim Mahony and Rob DamlerTim Mahony and Rob Damler

Copyright © 2011 by the American Academy of ActuariesAll Rights Reserved. 6
6
Public ActuaryPublic Actuary
American Academy of Actuaries Code of Professional Conduct
Professional Integrity Precept 1:
A public actuary shall act honestly, with integrity and competence, and in a manner to fulfill the profession’s responsibility to the public and to uphold the reputation of the actuarial profession.
________________________________________________________________
The Public Actuary can be considered to have a unique role, different from the role in the private sector. One example of this is the importance of balancing concerns regarding underfunding or overfunding of public programs.

Copyright © 2011 by the American Academy of ActuariesAll Rights Reserved. 7
7
Actuarial Soundness RequirementsActuarial Soundness Requirements
Medicaid Managed Care Final Rule; Effective August 13, 2002
Federal Register, Friday, June 14, 2002, 42 CFR 438.6(c)(1)(i)
Actuarially sound capitation rates means capitation rates that:A. Have been developed in accordance with generally accepted actuarial
principles and practices;B. Are appropriate for the populations to be covered, and the services to be
furnished under the contract; andC. Have been certified, as meeting the requirements of this paragraph (c),
by actuaries who meet the qualification standards established by the American Academy of Actuaries and follow the practice standards established by the Actuarial Standards Board.

Copyright © 2011 by the American Academy of ActuariesAll Rights Reserved. 8
8
Medicaid Actuarial Soundness Proposed DefinitionMedicaid Actuarial Soundness Proposed Definition
American Academy of Actuaries Practice Note, August 2005, “Actuarial Certification of Rates for Medicaid Managed Care Programs”http://www.actuary.org/pdf/practnotes/health_medicaid_05.pdf
- Proposed Definition of Actuarial Soundness:“Medicaid benefit plan premium rates are “actuarially sound” if, for business in the state for which the certification is being prepared and for the period covered by the certification, projected premiums, including expected reinsurance and governmental stop-loss cash flows, governmental risk adjustment cash flows, and investment income, provide for all reasonable, appropriate and attainable costs, including health benefits, health benefit settlement expenses, marketing and administrative expenses, any state-mandated assessments and taxes, and the cost of capital.”*Practice notes may be updated from time to time and readers are encouraged to consult the Academy website periodically (www.actuary.org).

Copyright © 2011 by the American Academy of ActuariesAll Rights Reserved. 9
9
Capitation Rate DevelopmentCapitation Rate DevelopmentRob Damler and Kate TottleRob Damler and Kate Tottle
Copyright © 2011 by the American Academy of ActuariesAll Rights Reserved. 10
10
Capitation Rate Development Capitation Rate Development -- OutlineOutline
Overview
Base Data and Adjustments
Program and Policy Changes
Medical Trend
Managed Care Adjustments
Administration, Profit, Risk & Contingency Adjustment
Premium Tax / Fees

Copyright © 2011 by the American Academy of ActuariesAll Rights Reserved. 11
Capitation Rate Development OverviewCapitation Rate Development Overview
Capitation Rate methodology can be applied to the following ratecertification processes:
Medical services / physical healthBehavioral healthIntegrated care model with long-term careHIO, PIHP or PAHP
Capitation rate development methods:Capitation rate rebasingCapitation rate update or trend and policy/program adjustment update

Copyright © 2011 by the American Academy of ActuariesAll Rights Reserved. 12
Capitation Rate Development OverviewCapitation Rate Development Overview
Capitation rate development considerations beyond Per Member Per Month (PMPM) capitation rate:
Maternity and/or Newborn “kick” payment
Risk Adjustment: Age / Gender only vs. adding Diagnosis and/or pharmacy based tools
Reinsurance (Commercial or State-sponsored)
Risk Pools
Risk Corridors
Performance Incentives and/or Withholds

Copyright © 2011 by the American Academy of ActuariesAll Rights Reserved. 13
Base Data and AdjustmentsBase Data and Adjustments
Base Data SourcesFee for Service (FFS) / PCCM Claims DataMCO Encounter DataMCO Medicaid-specific Financial Reports
State Plan Services and “in lieu of” services
ASOP No. 23, Data Quality. See Q&A #4, pages 4-6, of January 14, 2011 letter from the Academy Medicaid Work Group to CMS
Requires the actuary to review the appropriateness of the data sources

Copyright © 2011 by the American Academy of ActuariesAll Rights Reserved. 14
Base Data and AdjustmentsBase Data and Adjustments
Adjustments include:
Missing Data (data outside of claims processing system)
Incomplete Data (claims lag – unpaid claims liability, settlements)
Population Carve-Outs (nursing home residents, for example)
Funding/Service Carve-Outs (GME, DSH, MH/SA, LTC, for example)
Retroactive Eligibility (FFS/PCCM base data)
Program/Policy changes part way through the Base Data period (these can be Category of Service and/or Category of Aid specific)
Data Smoothing to address anomalies/distortions where member months are too small, or unusually high or low claims exist. Smoothing should be budget-neutral; i.e., no dollars gained or lost within the process.
Copyright © 2011 by the American Academy of ActuariesAll Rights Reserved. 15
15
Pricing AssumptionsPricing AssumptionsKate TottleKate Tottle

Copyright © 2011 by the American Academy of ActuariesAll Rights Reserved. 16
16
Capitation Rate Development Capitation Rate Development -- OutlineOutline
Base Data and Adjustments
Program and Policy Changes
Medical Trend
Managed Care Adjustments
Administration, Profit, Risk & Contingency Adjustment
Premium Tax/Fees

Copyright © 2011 by the American Academy of ActuariesAll Rights Reserved. 17
17
Program and Policy ChangesProgram and Policy Changes
These may include changes required by State or Federal mandates:State fee schedule adjustments
Actuaries should build in their expectation of the MCOs’ ability to attain unit cost changes
Benefit changesExplicit calculation should be performed to determine the value of the benefit changeAre there credible data sources for new benefits?
Eligibility changesConsider how new members might have different health care needs than current population
Federal mandatesHealth care reform implications – impact on pharmacy rebates
State legislative actionsState imposed budget cuts (see first three bullets above) or target medical loss ratiosWhat do actuaries do if statutory changes are counter to her/his pricing assumptions?

Copyright © 2011 by the American Academy of ActuariesAll Rights Reserved. 18
18
Program and Policy ChangesProgram and Policy Changes
Program changes can have a huge impact on rate setting process.
Some additional considerations:The actuary should consider an independent review of assumptionsrelative to reliance upon legislative program change estimates
The actuary should consider practical realities of when the statutory changes can effectively be implemented by the MCOs
Need to avoid double counting impact on trend or other assumptions
Copyright © 2011 by the American Academy of ActuariesAll Rights Reserved. 19
19
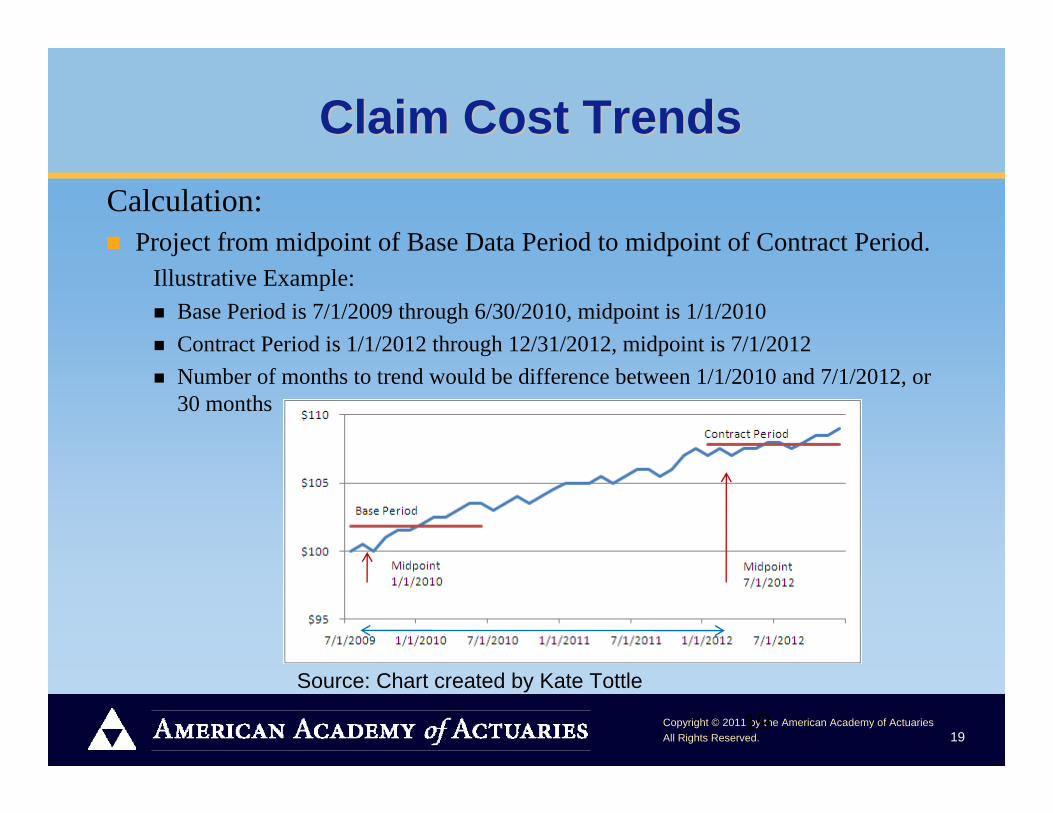
Claim Cost TrendsClaim Cost TrendsCalculation:
Project from midpoint of Base Data Period to midpoint of Contract Period.Illustrative Example:
Base Period is 7/1/2009 through 6/30/2010, midpoint is 1/1/2010Contract Period is 1/1/2012 through 12/31/2012, midpoint is 7/1/2012Number of months to trend would be difference between 1/1/2010 and 7/1/2012, or 30 months
Source: Chart created by Kate Tottle

Copyright © 2011 by the American Academy of ActuariesAll Rights Reserved. 20
20
Claim Cost TrendsClaim Cost Trends
Calculation:Typically displayed as an annualized amount. Trend is compounded over time.
For example, a 4% annual trend for 2.5 years (30 months) from the Base Data period to the Contract period has the following impact on the capitation rates:
[(1+.04) ^ (30/12)] = 1.103019901 or a rough +10.3%Trend can be applied to Utilization and Unit Cost separately or to the Per Member Per Month (PMPM) costs
If applied separately, the utilization and unit cost trends would be multiplicative. For example, if you had a 2% trend for utilization and a 3% trend on unit cost, the combined trend would be: (1 +.02) x (1+.03) = 1.0506

Copyright © 2011 by the American Academy of ActuariesAll Rights Reserved. 21
Trend ConsiderationsTrend Considerations
Are the sources for the claim cost trend factors described?
Are the sources appropriate predictors for Medicaid trend?
Are the trends based on medical costs that may persist in the future (e.g., H1N1)?
How have the actual and projected trends changed over time? Fairly consistent, or significant swings?
Do trend rates include changes in state Medicaid fee schedules?
How to avoid double-counting program changes, managed care adjustments and trend?
Copyright © 2011 by the American Academy of ActuariesAll Rights Reserved. 22
Managed Care AdjustmentsManaged Care Adjustments
Common Practices: Can target poor performing MCOs and remove their higher expense and member months from the base experience
Can target specific adjustment to what a moderately or aggressively managed MCO could attain
For example, can target specific emergency room utilization reductions to what a well managed plan may be able to attainThe actuary does not always identify what services are being targeted for reductions; could be overall savings targetDebate over whether the target needs to be attainable for the MCOs doing business in that state during the rate period
The rate setting model application of program/policy changes, claim cost trend, and managed care adjustments are often multiplicative in nature (independent variables).

Copyright © 2011 by the American Academy of ActuariesAll Rights Reserved. 23
Claims w/ MC Savings
Claims w/o MC Savings
Year 1 $100 $101Year 2 $102 $104
Trend net of MC Savings 2.0%Trend gross of MC Savings 3.0%
Managed Care ConsiderationsManaged Care Considerations
How to interpret attainable in definition of actuarial soundness?How should provider reimbursement differences be considered if using health plan cost data?Does the documentation of the managed care adjustment provide authoritative support (data and information driven) rather than being more general in nature, insufficient, or non-existent?
How does the actuary avoid potential double-counting of previously attained managed care savings and normal trend?Illustrative Example:
23
For a detailed discussion, see Q&A #8b, pages 9-11, of January 14, 2011 letter from the Academy Medicaid Work Group to CMS. http://www.actuary.org/pdf/health/American_Academy_of_Actuaries_Letter_on_Rate_Setting_Checklist_to_CMS.pdf
Source: Table created by Kate Tottle

Copyright © 2011 by the American Academy of ActuariesAll Rights Reserved. 24
24
MCO Administration LoadMCO Administration Load
Like with medical assumptions, the administration load should bereasonable, appropriate and attainable
Can use a flat percentage across all Categories of Aid, or utilize a Fixed & Variable (F&V) approach
F&V provides a higher overall Administration % for lower cost Categories of Aid, and a lower overall Administration % for higher cost Categories of Aid. Modeled to be projected to be equal to the flat percentage approach.
Typically (but not always) displayed as a percentage of the total capitation rate (before any Premium Tax). For example, 9.0% Administration on a $100 PMPM capitation rate = $9.00 PMPM for Administration

Copyright © 2011 by the American Academy of ActuariesAll Rights Reserved. 25
Administrative ConsiderationsAdministrative Considerations
How balanced are the assumptions? If there is an increase in managed care efficiencies, the administrative load may be higher to implement new savings programs
If a portion of the administrative load is at risk based on contract considerations, are the expected administrative dollars appropriate for the risk?
How should the actuary treat caps on administrative loads based on state legislative or regulatory actions? For a detailed discussion, see Q&A #13, pages 14-16, of January 14, 2011 letter from the Academy Medicaid Work Group to CMS. http://www.actuary.org/pdf/health/American_Academy_of_Actuaries_Letter_on_Rate_Setting_Checklist_to_CMS.pdf

Copyright © 2011 by the American Academy of ActuariesAll Rights Reserved. 26
26
Profit/ Risk/ Contingency Load Profit/ Risk/ Contingency Load
Typically (but not always) displayed as a percentage of the total capitation rate (before any Premium Tax). For example, 3.0% Underwriting Profit/Risk/Contingency on a $100 PMPM capitation rate = $3.00
Investment Income generated by the MCO typically implicitly considered when developing this load
Risk-Based Capital (RBC) requirements should be considered in setting profit/risk/contingency load
For a detailed discussion, see Q&A #13, pages 14-16, of January 14, 2011 letter from the Academy Medicaid Work Group to CMS http://www.actuary.org/pdf/health/American_Academy_of_Actuaries_Letter_on_Rate_Setting_Checklist_to_CMS.pdf

Copyright © 2011 by the American Academy of ActuariesAll Rights Reserved. 27
27
Premium Tax LoadPremium Tax Load
State-mandated assessments and taxes (these are non-income related)
The full amount of the tax should be built into the ratesFor example, if there is a $100 premium rate, upon which a 2% tax is levied, the rates must be increased to $100 / (1 – 0.02) = $102.04The tax is 2% of $102.04, which is $2.04, so the $100 premium rate is still paid in full to the MCO
For changes to premium tax rates, the capitation should considerthe effective date for the MCO actually owing premium tax

Copyright © 2011 by the American Academy of ActuariesAll Rights Reserved. 28
28
Additional Financial ProvisionsAdditional Financial ProvisionsMike NordstromMike Nordstrom
Copyright © 2011 by the American Academy of ActuariesAll Rights Reserved. 29
29
Risk AdjustmentRisk Adjustment
Not mandatory, but incrementally improves the matching of payment to risk. Many methodologies, based upon enrollees’ health status, diagnosis and/or pharmacy usage. If the State uses a statistical methodology to calculate health risk, they should use generally accepted groupers. Documentation should:
Explain the risk assessment methodology chosenIndicate how payments will be adjusted to reflect the actuarially sound cost of the applicable populationDemonstrate how the particular methodology used is cost-neutralOutline periodic monitoring and/or rebasing to ensure that the overall payment rates do not artificially increase due to providers finding more creative ways to classify individuals with more severe diagnoses (also called upcoding or diagnosis creep)

Copyright © 2011 by the American Academy of ActuariesAll Rights Reserved. 30
30
Risk AdjustmentRisk Adjustment
Risk adjustment must be cost-neutral. It cannot add cost to the program; it can only distribute cost differently amongst contracting entities and delivery systems
A general description of the steps followed should includeThe system usedAny calibration or adjustments made to the system specific to the StateAny additional adjuster methodologies employed by the StatePopulations risk adjustedAny population or service carve-outHow the payment system works

Copyright © 2011 by the American Academy of ActuariesAll Rights Reserved. 31
31
Risk AdjustmentRisk Adjustment
The overview should also describe the methodology for addressing payment for members that do not have sufficient experience to assess their health risk (such as new members) and the point at which the risk adjustmentmethodology will be applied. Finally, the overview should describe how the State will determine/review the model for recalibrations/updates to ensure validity.
Points of Interest/Considerations include (but are not limited to):Personal Health Information (PHI) involved, so protections requiredModels include demographic (Category of Aid, Age, Gender) infoIndividual or Aggregate systems for risk factor determinationProspective or Concurrent (Retrospective) models

Copyright © 2011 by the American Academy of ActuariesAll Rights Reserved. 32
32
Additional Financial ProvisionsAdditional Financial Provisions
Maternity Supplemental (Lump Sum) Payment: What’s included besides the delivery event? Pre-natal care? Post-partum care? Expenses not included here should remain within the other applicable Category of Aid rate cells. Cesarean assumption key.
Reinsurance (Commercial or State-sponsored): If Commercial, does the price appear commensurate with the risk? Given the high risk to the reinsurer, there are typically significant non-claims related loads to the reinsurance rate.
Risk Pools: A set-aside where MCOs contribute to a pool for coverage of higher cost individuals or higher cost services based upon projections, and draw (proportionately) from the pool based upon actual experience. Set-aside amount = total drawn amount in aggregate across all MCOs.

Copyright © 2011 by the American Academy of ActuariesAll Rights Reserved. 33
33
Additional Financial ProvisionsAdditional Financial Provisions
Risk Corridors: Always recommend discussing in advance with CMS any desire for flexibility on regulatory valuation limit. Otherwise there’s the “risk”to risk corridors. Can non-symmetrical risk corridors be proven to be actuarially sound?
Performance Incentives/Withholds: All payments under the risk contract must be actuarially sound. 5% limitation in 42 CFR. Why 5% and not 6%?
TPL/COB: Typically reflected in the MCO base data. Can become a rating consideration if MCO/state responsibilities shift.
Rate Ranges: Consider the natural statistical variation associated with several components of the rate development, as well as a more-aggressive and less-aggressive assumption approach. Also affords states the ability to pay different rates to different MCOs based on negotiations, or for a wide variety of reasons.
Copyright © 2011 by the American Academy of ActuariesAll Rights Reserved. 34
34
More Intricate TopicsMore Intricate Topics
Retroactive Rate Changes: For a detailed discussion, see Q&A #5, pages 6-7, of January 14, 2011 letter from the Academy Medicaid Work Group to CMS. http://www.actuary.org/pdf/health/American_Academy_of_Actuaries_Letter_on_Rate_Setting_Checklist_to_CMS.pdf
Provider Directed Payments, Supplemental Payments , IGTs, etc.: On these complex contractual arrangements the state and CMS need to be in agreement on terms and conditions. Minimum Medical Loss Ratios (MLRs), Profit Caps/Sharing: What are included/excluded in the numerator and denominator? Better when viewed over multiple years? The minimum MLR or Profit Caps limit MCO’s“upside,” while not limiting their “downside.”

Copyright © 2011 by the American Academy of ActuariesAll Rights Reserved. 35
35
Role of State PersonnelRole of State Personnel
Partnership with the actuary (of course, the actuary may be part of “state personnel”).
Provide data and information responsive to actuarial requests
Provide detailed knowledge of programs
Identify program/policy changes
Provide approval of work product
Point of contact with MCOs throughout the process
Submission of capitation rates to CMS

Copyright © 2011 by the American Academy of ActuariesAll Rights Reserved. 36
Q&AQ&A

Copyright © 2011 by the American Academy of ActuariesAll Rights Reserved. 37
AppendicesAppendices

Copyright © 2011 by the American Academy of ActuariesAll Rights Reserved. 38
Robert Damler, FSA, MAAAPrincipal and Consulting Actuary
24 years experience with Milliman, Inc. providing health care consulting services
Member, American Academy of Actuaries Medicaid Work Group
Contributing author to the American Academy of Actuaries Practice Note on Capitation Rate Setting
http://www.actuary.org/pdf/practnotes/health_medicaid_05.pdf
PresentersPresenters

Copyright © 2011 by the American Academy of ActuariesAll Rights Reserved. 39
PresentersPresenters
Mike Nordstrom, ASA, MAAAChairperson, American Academy of Actuaries Medicaid Work Group
Chairperson, Actuarial Standards Board (ASB) Task Force on Medicaid-specific Actuarial Standard of Practice (ASOP)
10.5 years with Mercer Government Human Services Consulting
17.5 years with Commercial/TRICARE health insurers encompassing varying lines of business

Copyright © 2011 by the American Academy of ActuariesAll Rights Reserved. 40
Kathleen A. Tottle, FSA, MAAASenior Vice President and Chief Actuary, AmerigroupCorporation, Virginia Beach, VA
9 years of Medicaid experience; 17 years of health experience
Active participation in Medicaid for 11 states
Member, American Academy of Actuaries Medicaid Work Group
PresentersPresenters

Copyright © 2011 by the American Academy of ActuariesAll Rights Reserved. 41
Building BlocksBuilding Blocks
Member Months (Exposure in Evaluation Period) =[(Last – Initial) Eligibility Date] x 12 months / 365 days
So maximum Member Months (MM) per individual in a year = 12
Annual Utilization per 1,000 Members =Total # of Units for a Service Category x 12 x 1,000
Total # of Member Months
Unit Cost =Total Cost for a Service Category
Total # of Units for a Service Category

Copyright © 2011 by the American Academy of ActuariesAll Rights Reserved. 42
Building BlocksBuilding Blocks
Per Member Per Month (PMPM) Cost for a Service Category =Total Cost for a Service Category / Total # of Member Months
Also, PMPM Cost =
[Annual Utilization per 1,000 Members] x Unit Cost / (12 x 1000)
Sometimes Base Data is broken down into Utilization and Unit Costcomponents, and sometimes it is just shown as a PMPM. Eitherapproach is appropriate.

Copyright © 2011 by the American Academy of ActuariesAll Rights Reserved. 43
43
Building BlocksBuilding Blocks
Rate Categories (Categories of Aid): Medicaid Eligibility Category or Group potentially further refined by Age, Gender, Geographic Region, Maternity Supplemental (Lump Sum) Payment, etc.
Benefit Packages: Mandatory, Optional, CHIP/Expansion program, cost sharing differentials, etc.
Service Categories (Categories of Service): Hospital Inpatient, Hospital Outpatient, Emergency Room, Primary Care Physician, Physician Specialist, Pharmacy, FQHC/RHC, Lab & X-ray, Transportation, Family Planning, Health Home, All Other, etc.

Copyright © 2011 by the American Academy of ActuariesAll Rights Reserved. 44
Base Data Sources: (Some) Base Data Sources: (Some) Advantages/Disadvantages of Each Advantages/Disadvantages of Each FFS/PCCM Claims Data
Advantages:
- If new managed care program, may be only available data
- Tremendous detail available
- Useful for program/policy change modeling
- State Plan Services Only, by definition
Disadvantages:
- If existing managed care program, may be old data
- Need to convert category of service costs to managed care environment via significant assumptions
- Selection concerns (adverse or positive) if voluntary program
Copyright © 2011 by the American Academy of ActuariesAll Rights Reserved. 45
Base Data Sources: (Some) Base Data Sources: (Some) Advantages/Disadvantages of EachAdvantages/Disadvantages of EachMCO Encounter Data
Advantages:
- Actual managed care experience
- Can break into utilization & unit cost components, as with FFS, PCCM
- Useful for program/policy change modeling, as with FFS, PCCM
- Used for quality measures analysis as well
Disadvantages:
- Missing encounters
- “Unencounterable” costs need to be considered
- Unit Cost data can be incomplete or inaccurate
- Sub capitation costs are often a challenge

Copyright © 2011 by the American Academy of ActuariesAll Rights Reserved. 46
Base Data Sources: (Some) Base Data Sources: (Some) Advantages/Disadvantages of EachAdvantages/Disadvantages of EachMCO Medicaid-specific Financial Reports
Advantages:
- Actual managed care experience
- Captures all expenses, unlike MCO encounter data
- Verifiable/auditable
Disadvantages:
- Utilization/Unit Cost detail often unavailable
- MCO reporting differences
- Expensive for the state to verify/audit, so can have transparency concerns
- State Plan Services Only are often a challenge to segment
- Need to overcome “cost plus” rate setting concerns

Copyright © 2011 by the American Academy of ActuariesAll Rights Reserved. 47
Base Data Sources: (Some) Base Data Sources: (Some) Advantages/Disadvantages of EachAdvantages/Disadvantages of EachFor both Claims and Administration, requirement of Medicaid Services for Medicaid Eligibles
Which Base Data source is the best? Impossible to answer without knowledge of specific circumstances. Most states that have managed care programs in place for three or more years have migrated away from FFS/PCCM as the sole Base Data source.
Use combination of sources if readily available and appropriate. Compare each source for reasonableness.