Embed Size (px)
Citation preview

Medicaid in New York: The Continuing Challenge
to Improve Care and Control Costs
March 2015
Thomas P. DiNapoli New York State Comptroller

Prepared by the Office of Budget and Policy Analysis Additional copies of this report may be obtained from:
Office of the State Comptroller Public Information Office 110 State Street Albany, New York 12236 (518) 474-4015
Or through the Comptroller’s website at: www.osc.state.ny.us
Table of Contents EXECUTIVE SUMMARY ......................................................................................................... 1
NEW YORK’S MEDICAID PROGRAM BY THE NUMBERS ................................................... 5
MAJOR MEDICAID CHANGES UNDERWAY ....................................................................... 11
Context for Reform ............................................................................................................. 11 New York’s Medicaid Redesign Team ................................................................................ 13 Medicaid Spending Cap ..................................................................................................... 14 Impact of the Affordable Care Act ...................................................................................... 16 Transition to Medicaid Managed Care ................................................................................ 17 Federal Reinvestment in New York’s Medicaid Program .................................................... 21
OPPORTUNITIES, CHALLENGES AND RISKS AHEAD...................................................... 25


Executive Summary New York’s Medicaid program is undergoing major changes, with ambitious plans for further modifications just ahead. The State’s efforts to slow spending growth are showing measurable progress, with average beneficiary costs declining while enrollment continues to grow. Still, State Funds spending for Medicaid is projected to rise by nearly $700 million annually through State Fiscal Year (SFY) 2018-19, and improving the quality of New York’s health care system remains a challenge after more than two decades of reforms. The Executive’s Medicaid Redesign Team (MRT) initiative represents the most comprehensive restructuring of New York’s Medicaid system since the program began in 1966. The MRT has advanced significant steps intended to slow the growth of costs, accommodate increased enrollment, and improve the quality of care and health outcomes for beneficiaries. A federal waiver may bring up to $8 billion in additional funding over the next five years to drive further, dramatic changes in New York’s system of care for the needy. Medicaid spending in New York, $54.5 billion in Federal Fiscal Year (FFY) 2013, has long been among the highest in the nation, both in absolute dollars and on a per enrollee basis. On a FFY basis, overall spending on the State’s program rose by an average 5.3 percent annually from 2001 through 2010. But from 2010 through 2013, New York held average annual increases in such spending to 1.7 percent. Adjusted for medical inflation, overall Medicaid spending increased by an annual average of 1.3 percent from 2001 through 2010 and decreased by an average of 1.4 percent a year from 2010 through 2013. From Calendar Year (CY) 2010 to CY 2013, State Department of Health (DOH) Medicaid enrollment rose by over 580,000 enrollees, or 12.3 percent, reaching 5.3 million – or more than one in four New Yorkers. Total enrollment is expected to exceed 6.4 million in SFY 2016-17, according to the State Division of the Budget (DOB). Such enrollment has been rising steadily – particularly among children and nondisabled, nonelderly adults, who incur relatively lower costs compared to aged and disabled beneficiaries. From CY 2010 to CY 2013, average annual spending per enrollee among the aged, disabled, and children declined, but rose slightly among nonelderly, nondisabled adults. On the whole, spending per DOH Medicaid enrollee in New York has trended downward in recent years. Much work remains to rein in costs as well as to improve the quality of care. DOB projects the State’s share of annual Medicaid expenditures will rise by nearly $2.8 billion, to just below $25 billion, from the current State fiscal year to SFY 2018-19. In addition, DOH says the Medicaid program and New York’s entire health care system have “significant quality issues” that must be addressed. These include high rates of avoidable hospital use and emergency room visits, and potentially preventable readmissions and complications, as well as significant disparities in health outcomes among racial, ethnic and socioeconomic groups. Despite comparatively high costs, the State’s overall health system ranked 19th among the states in one independent scorecard, based primarily on national data from 2012 that measured health care access, quality, costs and outcomes.

The Medicaid waiver amendment that the federal Centers for Medicare and Medicaid Services (CMS) approved in April 2014 is intended to drive a broad restructuring of New York State’s system of health care for Medicaid beneficiaries and low income, uninsured individuals. The primary goals are to reduce avoidable hospital admissions and expand access to primary care and outpatient services, encourage collaboration among providers treating Medicaid patients, and improve health outcomes for the State’s Medicaid population. CMS, DOH and many health care researchers believe such changes could ultimately improve health outcomes while reducing growth in the State’s Medicaid costs. The State’s reform efforts build on a quarter-century of steps to restrain costs by managing beneficiaries’ care more effectively. Since the late 1980s, the State has gradually moved over three-quarters of its Medicaid population from the fee-for-service delivery system into managed care. Both the MRT initiative and the federal waiver seek to continue this movement to its fullest extent, with the goal of enrolling 95 percent of Medicaid recipients in managed care by April 2018. DOH says its “Care Management for All” initiative will improve coordination and quality of care, and thus lead to better health outcomes, while restraining costs. These goals are similar to those the State has outlined in previous expansions of managed care. To assure maximum impact of these important initiatives, DOH will need to build on its existing assessment efforts to analyze its progress in meeting these goals, and develop a more comprehensive and public program of assessment going forward. One unfortunate side effect of the State’s move to managed care has been reduced transparency with regard to the use of Medicaid dollars. DOH makes readily available on its website detailed data on fee-for-service expenditures. The Department also collects and maintains extensive data on managed care plans’ enrollment and expenditures. However, compared to the data on the fee-for-service delivery system, detailed expenditure data for managed care plans, both individually and collectively, is less readily available to the public. To assure maximum accountability in a system increasingly dominated by managed care, DOH should provide detailed, publicly accessible information on how Medicaid managed care plans are spending the premiums they are paid. The State’s plans for further Medicaid transformation include the creation of a new health care provider type called performing provider systems (PPSs), which will be charged with meeting certain milestones, including reducing avoidable emergency room visits and hospitalizations, and improving treatments for diabetes and asthma patients. Relationships among the new provider systems, health insurance plans and the State will have important and perhaps hard-to-predict ramifications for Medicaid beneficiaries and, potentially, for purchasers and purveyors of commercial health insurance. Accordingly, DOH must carefully monitor both the new provider systems and the managed care organizations as this transformation unfolds. The anticipated increase in federal funding associated with the new waiver amendment increases the State’s fiscal incentive to restrain growth in Medicaid spending in coming years. It comes with performance goals known as “milestones” aimed at both the statewide Medicaid system and the new health care provider systems required by the
2

waiver. If New York fails to improve efficiency and reduce average costs as required by these benchmarks, new federal funding would be reduced by hundreds of millions of dollars, potentially increasing budgetary pressure to reduce services. DOH has already taken steps to achieve cost savings through restrictions in services, setting new limits in recent years in areas such as home care. Going forward, policy choices that seek to balance cost control and quality enhancement must be made transparently with full public discussion of the potential tradeoffs inherent in that balance. The State also faces the challenge of a CMS action to disallow and require repayment of $1.26 billion in federal payments made to New York for services to the developmentally disabled in SFY 2010-11. The State’s request for reconsideration of the disallowance was denied by CMS in November 2014. However, the State filed a notice of appeal with a federal appeals board in January 2015, and has indicated it may challenge the disallowance in federal court, if necessary.1 Statistical highlights of this report include:
• From CY 2000 through CY 2013, DOH Medicaid enrollment in New York nearly doubled, rising by more than 2.5 million. Overall DOH spending on the program doubled over the period.
• Services for aged and disabled beneficiaries represented approximately 60 percent of DOH Medicaid expenditures, at an average cost of more than $22,000 per recipient in CY 2013, although only about one in four beneficiaries are in these categories.
• The federal government paid 51.7 percent of New York’s $55.3 billion in Medicaid spending during SFY 2013-14, according to expense reports DOH filed with CMS.2 While federal aid for the State’s program has risen in recent years, New York’s base federal Medicaid matching rate of 50 percent is at the statutory minimum. The State paid $18.0 billion or 32.5 percent, while New York City and county governments paid $8.8 billion, or 15.9 percent.
• Federal support for Medicaid in New York is projected to rise by $6.9 billion, or 25 percent, over the four years ending in SFY 2018-19, largely because of additional funding associated with the Affordable Care Act, or ACA, and the Federal Medicaid waiver. DOB projects that overall local Medicaid costs will decline modestly starting in SFY 2016-17.
1 See http://publications.budget.ny.gov/eBudget1516/financialPlan/FinPlan.pdf, page 44. 2 The State reports several differing measures of Medicaid spending for differing purposes. DOH’s filings with CMS reflect expenditures for which the State is entitled to federal reimbursement under Title XIX (Grants to States for Medical Assistance Programs) of the Social Security Act. Medicaid expenditure figures reported by the Division of the Budget in the State’s Financial Plan reflect various cash adjustments and components not reflected in the CMS data. This report by the Office of the State Comptroller includes data from both sources to allow various comparisons, and indicates the source in each case.
3

• The Office of the State Comptroller has expanded an ongoing Medicaid audit initiative that has identified nearly $2.0 billion in fraud, waste, abuse and questionable transactions since 2007, including over $171 million in 2014.
The major reforms planned for Medicaid in New York represent an ambitious restructuring that will influence the cost and quality of health care, as well as access to care, for years to come. The State and the federal government agree that such restructuring may result in a better health care system as well as restrain cost growth. Still, the ongoing changes and the new $8 billion waiver amendment present New York with risks as well as opportunities. Like the State itself, the managed care organizations that cover most Medicaid enrollees may have difficulty balancing the competing demands of improving quality and controlling costs. Because Medicaid plays such a large role in New York's overall health care system, efforts to limit Medicaid spending could lead to costs being shifted onto private purchasers of health insurance, primarily New York employers. At the same time, hoped-for quality improvements driven by Medicaid reform could improve health care for New Yorkers with private coverage, as well. Given the wide range of important changes underway in Medicaid, in addition to closely monitoring developments, DOH should continue to report publicly on each major step in the implementation process, and respond as needed to assure the best outcomes for taxpayers, health care providers, and the millions of New Yorkers served by Medicaid.
4

New York’s Medicaid Program by the Numbers Overall Medicaid spending in New York State – including federal, State and local funds – is expected to reach $58.8 billion in the current State fiscal year, according to DOB projections. This report focuses primarily on the DOH Medicaid program, which was responsible for more than 80 percent of New York’s Medicaid spending in CY 2013. Since CY 2000, New York’s DOH Medicaid enrollment has nearly doubled and DOH Medicaid spending doubled.3 After adjusting for inflation in medical costs, such spending rose by a more modest 23.7 percent.4 The average monthly number of DOH Medicaid enrollees increased by over 2.5 million, or 94.4 percent, from 2.7 million in CY 2000 to 5.3 million in CY 2013, while DOH Medicaid spending grew by more than $23.4 billion, or 100.8 percent, from $23.2 billion in CY 2000 to nearly $46.7 billion in CY 2013.5 Figure 1
Percentage Change in DOH Medicaid Enrollment, Spending and Spending per Enrollee
(by Calendar Year)
Source: NYS DOH.
3See www.health.ny.gov/health_care/medicaid/statistics/ for DOH Medicaid enrollment and spending data, which exclude enrollment and expenditures figures for individuals whose Medicaid eligibility was determined by the State Office of Mental health (OMH) or the State Office for People With Developmental Disabilities (OPWDD). 4 Inflation-adjusted dollars for FFY 2000 were calculated based on the medical care component of the Consumer Price Index for the northeast urban area of the United States using monthly indices of the U.S. Bureau of Labor Statistics CPI Database, All Urban Consumers (Current Services). See www.bls.gov/cpi/data.htm for monthly index data. From FFY 2000 through FFY 2013, the medical inflation rate outpaced overall inflation. 5 See www.health.ny.gov/health_care/medicaid/statistics/ for DOH Medicaid enrollment and expenditure data, which excludes enrollment and expenditure figures for individuals whose Medicaid eligibility was determined by OMH or OPWDD. Expenditure data also excludes retroactive payments, disproportionate share hospital payments and Medicaid administration expenses. DOH Medicaid expenditure data for CY 2014 of $48.99 billion represents a 5.0 percent increase over CY 2013. CY 2014 DOH Medicaid enrollment data was not available as of March 5, 2015.
-10%
-5%
0%
5%
10%
15%
20%
2000 2001 2002 2003 2004 2005 2006 2007 2008 2009 2010 2011 2012 2013
SPENDING ENROLLMENT SPENDING PER ENROLLEE
5

As shown in Figure 1, DOH Medicaid spending per enrollee rose every year from CY 2005 through CY 2009 but has declined every year since then. Adjusted for medical inflation, DOH Medicaid spending per enrollee has declined every calendar year since 2000. Enrollment and spending both rose during the recent recession, but at lower rates than during the recession of the early 2000s. More recently, DOH Medicaid enrollment in New York rose by more than 580,000 enrollees, or 12.3 percent, reaching 5.3 million, from CY 2010 through CY 2013. Enrollment is expected to exceed 6.4 million in SFY 2016-17, according to DOB.6 With enrollment rising steadily, particularly among children and nondisabled, nonelderly adults, who incur relatively lower costs, unadjusted average annual spending per DOH Medicaid enrollee in New York reached a peak of $9,278 in CY 2009, and then declined annually through CY 2013.7 Over the same period, average annual spending per enrollee among the aged, disabled, and children declined, but rose slightly among nonelderly, nondisabled adults. Medicaid spending in New York has long been among the highest in the nation in absolute dollars, and on a per enrollee basis. On a federal fiscal year basis, overall spending on the State’s program rose by an average 5.3 percent annually from 2001 through 2010. From 2010 through 2013, however, New York held average annual increases in such spending to 1.7 percent.8 Adjusted for medical inflation, overall Medicaid spending increased by an annual average of 1.3 percent from 2001 through 2010 and decreased by an average of 1.4 percent a year from 2010 through 2013.9 According to quarterly expense reports filed by DOH with CMS, for the State Fiscal Year ending March 2014, Medicaid spending totaled $55.3 billion in New York.10 Of this amount, the federal government paid $28.6 billion, or 51.7 percent; the State paid $18.0 billion, or 32.5 percent; and county governments and New York City paid $8.8 billion, or 15.9 percent.11 DOB Financial Plan documents show that aggregate federal aid for the State’s Medicaid program has risen in recent years, largely reflecting continued enrollment growth.
6 See http://publications.budget.ny.gov/eBudget1516/financialPlan/FinPlan.pdf, page 78. 7 See www.health.ny.gov/health_care/medicaid/statistics/ for DOH Medicaid enrollment and expenditure data, which excludes enrollment and expenditure figures for individuals whose Medicaid eligibility was determined by OMH or OPWDD. Expenditure data also excludes retroactive payments, disproportionate share hospital payments and Medicaid administration expenses. 8 See federal quarterly expense reports for New York from federal fiscal year (FFY) 2000 through FFY 2013, available at www.medicaid.gov/Medicaid-CHIP-Program-Information/By-Topics/Data-and-Systems/MBES/CMS-64-Quarterly-Expense-Report.html. According to CMS, New York’s Medicaid spending in FFY 2013 totaled $54.5 billion. This varies from the SFY figure due to timing and other factors. In FFY 2013, the only state with higher Medicaid spending than New York was California, with total Medicaid expenditures of $67.1 billion. 9 Ibid. Inflation-adjusted dollars reflect the medical care component of the Consumer Price Index for the northeast urban area of the United States. 10 The total Medicaid spending amount for SFY 2013-14 reflects quarterly expense reports filed by DOH with CMS for the period from April 2013 through March 2014. DOB’s Medicaid presentation of spending totals and projections reflects various cash adjustments and components not reflected in federal CMS-64 quarterly Medicaid expense reports. 11 Ibid for the federal amount. The State amount equals the non-federal amount reflected in quarterly expense reports minus the local amount, as provided by the State Division of the Budget. Totals may not add due to rounding.
6

Aside from ACA-related increases in federal funding starting in 2014, New York’s base federal Medicaid matching rate remains at the statutory minimum of 50 percent. Under federal law, this level reflects the State’s relatively high per capita income, but not its relatively high poverty rate or other factors such as the proportion of aging residents. New York’s statewide poverty rate stood at 16.0 percent in 2013 (the most recent year for which data are available), or 0.2 percentage points above the official U.S. poverty rate.12 As shown in Figure 2, changes in DOH enrollment and spending data by major Medicaid categories of eligibility – children, adults, the elderly, and the disabled – reflect several factors. These include expansion of the program to cover significant numbers of parents and non-pregnant, childless adults who were previously ineligible for Medicaid, as well as the impact of the recent recession and more robust efforts to enroll eligible individuals. While children made up the largest category of enrollees in CY 2000, they were outnumbered by nondisabled adults in CY 2013, after enrollment in the latter category more than tripled. In addition, the proportions of children, the aged and disabled enrollees have all decreased over time.
Figure 2
DOH Medicaid Enrollment and Program Spending by Eligibility Category (CY 2000 – CY 2013)
Source: NYS DOH. Note: See www.health.ny.gov/health_care/medicaid/statistics/ for enrollment and spending data. Enrollment data reflect the monthly average of Medicaid-eligible New Yorkers and exclude enrollees whose eligibility is determined by OMH or OPWDD. Spending data are by date of payment and exclude retroactive payments, payments for enrollees whose eligibility is determined by OMH or OPWDD, disproportionate share hospital payments and Medicaid administration spending.
12 See www.factfinder.census.gov/faces/tableservices/jsf/pages/productview.xhtml?pid=ACS_13_1YR_S1701&prod Type=table. U.S. Census Bureau poverty thresholds for 2013 were $11,490 for an individual, $15,510 for a family of two, $19,530 for a family of three, and $23,550 for a family of four, etc.
Children Adults Aged Disabled Other TotalEnrollees
2000 1,213,641 601,324 321,370 590,241 1,780 2,728,3562013 1,987,010 2,019,185 471,769 778,391 47,020 5,303,375
Enrollees % of Total2000 44% 22% 12% 22% 0%2013 37% 38% 9% 15% 1%
Spending (in billions)2000 $2.85 $3.47 $7.07 $9.64 $0.21 $23.242013 $5.94 $11.22 $10.08 $17.51 $1.91 $46.66
Spending % of Total2000 12% 15% 30% 41% 1%2013 13% 24% 22% 38% 4%
Spending / Enrollee2000 $2,351 $5,771 $21,998 $16,325 $117,317 $8,5172013 $2,991 $5,559 $21,361 $22,494 $40,540 $8,798
7

Figure 2 shows a relatively modest increase of $281, or 3.3 percent, in DOH Medicaid spending per enrollee from CY 2000 through CY 2013. (For both years, this analysis reflects the exclusion of significant amounts of Medicaid spending, including payments for retroactive rate adjustments and for enrollees whose eligibility is determined by OMH or OPWDD, as well as disproportionate share hospital payments.13 Including these additional elements in the analysis would result in substantially higher per capita Medicaid spending overall and in each eligibility category.) Adjusted for medical inflation, DOH Medicaid spending per enrollee fell by 36.4 percent, from $13,826 in CY 2000 to $8,798 in CY 2013. On this adjusted basis, DOH Medicaid spending per enrollee also declined over the same period in all five eligibility categories shown in Figure 2. Figure 2 also shows that children and nondisabled, nonelderly adults account for a large percentage of overall Medicaid enrollees, but a relatively small percentage of overall Medicaid spending – 75 percent of all enrollees, and 37 percent of overall spending in CY 2013. The elderly and the disabled account for a large share of overall Medicaid spending (about 60 percent in CY 2013), but a much smaller proportion (24 percent) of all enrollees.14 The proportion of all enrollees who were nondisabled adults rose noticeably over the period, from 22 to 38 percent, with an increase of 1.4 million enrollees in this category. Medicaid spending for disabled enrollees increased by $7.9 billion from CY 2000 to CY 2013, accounting for the largest share, about 34 percent, of a $23.4 billion increase in spending over this period, but accounted for a smaller share of total spending in CY 2013. Excluding “other” enrollees, unadjusted spending per enrollee in CY 2013 was highest for the disabled, reflecting a 37.8 percent increase in this category since CY 2000. The U.S. Medicaid and CHIP Payment and Access Commission (MACPAC), a federal agency charged with providing independent policy analysis and health services research to Congress on Medicaid and the Child Health Insurance Program (CHIP), issues annual reports containing state-specific and national information about Medicaid enrollment, spending and other topics. MACPAC’s most recent report, issued in June 2014, found that only four other states (Massachusetts, Alaska, Rhode Island and North Dakota) had higher Medicaid spending per enrollee than New York in FFY 2011, the most recent year for which MACPAC data are available.15 MACPAC found that overall Medicaid spending per enrollee in New York was approximately 44 percent higher than the national average. Average costs for adults,
13 Disproportionate share hospital (DSH) payments are supplemental Medicaid payments to hospitals serving a disproportionate share of Medicaid and uninsured patients. 14 For additional information, see www.health.ny.gov/statistics/health_care/medicaid/eligible_expenditures/ and www.health.ny.gov/statistics/health_care/medicaid/quarterly/. 15 See www.macpac.gov/reports. MACPAC’s analysis excludes spending on Medicaid administration and Medicaid-expansion CHIP, as well as disproportionate share hospital payments, which were included in previous reports. MACPAC bases per enrollee spending levels on average monthly enrollment over the period from October 2010 through September 2011 in order to ensure that amounts are not biased by enrollees’ transitions in and out of Medicaid coverage during the year. In FFY 2011, Medicaid spending per enrollee in New York was $10,426, according to MACPAC’s analysis.
8

disabled recipients and the elderly were also noticeably higher in New York, as shown in Figure 3. Among children, New York’s Medicaid spending per enrollee was 3.7 percent above the national average. Figure 3
New York Medicaid Spending per Enrollee – Percentage above the National Average by Eligibility Category
Source: Medicaid and CHIP Payment and Access Commission (MACPAC), June 2014 report to the Congress on Medicaid and CHIP, table 13.
Expense reports that New York files with CMS reflect much of the administrative cost of Medicaid, in addition to programmatic costs. DOB figures indicate DOH-related Medicaid administration expenditures totaled just less than $1.3 billion in SFY 2013-14.16 As shown in Figure 4, this includes both DOH’s own costs, and the State’s reimbursement of administrative spending by counties and New York City. Overall administrative costs are expected to decline modestly over the next three years. Costs shown in Figure 4 do not include payments to managed care plans and certain providers for their allowable administration expenses. Such payments to managed care plans totaled approximately $1.3 billion in SFY 2012-13, according to DOH, which counts them as program expenses, not administration costs, in the expense reports filed with CMS. Including such payments, overall Medicaid administration expenditures in New
16 See http://publications.budget.ny.gov/eBudget1516/financialPlan/FinPlan.pdf.
0%
10%
20%
30%
40%
50%
60%
70%
80%
Children Adults Disabled Elderly Total
9

York likely totaled more than $2.5 billion, or about 4.5 percent of total Medicaid spending, in SFY 2013-14. Figure 4
DOH Medicaid Administration Expenditures
(in thousands of dollars, by State Fiscal Year)
Sources: Division of the Budget publications: SFY 2014-15 Financial Plan Mid-Year Update, November 2014; and SFY 2015-16 Executive Budget Financial Plan, January 2015. Note: Figures for SFY 2012-13 and SFY 2013-14 are actual results as reported by DOB; figures for the remaining years are DOB projections.
2012-13 2013-14 2014-15 2015-16 2016-17 2017-18 2018-19DOH Reimbursement of County Medicaid Admin Expenses
State Funds 528,985 506,256 452,558 386,431 374,411 374,411 374,411Federal Funds 518,249 399,628 505,450 445,950 445,950 445,950 445,950Total 1,047,234 905,884 958,008 832,381 820,361 820,361 820,361
Total DOH Medicaid Admin ExpensesState Funds 528,985 647,566 682,897 610,197 619,797 619,797 619,797Federal Funds 518,249 611,443 700,005 705,570 730,843 769,163 783,563Total 1,047,234 1,259,009 1,382,902 1,315,767 1,350,640 1,388,960 1,403,360
10

Major Medicaid Changes Underway Context for Reform Starting early in the history of Medicaid, New York State policy makers have worked to balance the dual goals of providing effective, broad-based services and limiting costs. Governor Rockefeller won legislative approval of the program in 1966. Less than two years later, in his SFY 1968-69 Executive Budget, the Governor proposed cost-control steps including co-payments and restrictions on benefits for certain beneficiaries.17 The State’s Medicaid program has grown dramatically in size and scope since then. Among the factors in such growth have been legislated program expansions, both federal and State, medical cost inflation that has outpaced inflation generally, and the State’s use of Medicaid resources (with federal approval) to support a broad range of services, including those for the developmentally disabled. Within this context, DOH says the Medicaid program and New York’s entire health care system have “significant quality issues.”18 These include high rates of avoidable hospital use and emergency room visits, and potentially preventable readmissions and complications, as well as significant disparities in health outcomes among racial, ethnic and socioeconomic groups.19 In SFY 2013-14, Medicaid served nearly 5.7 million people, or about 29 percent of the State’s population, and represented more than a third of the State’s All Governmental Funds disbursements.20 Given its role as one of the largest payers for medical care in New York, Medicaid also has a major influence on the State’s overall system of care, and may affect the costs paid by and on behalf of the privately insured. In a 2009 analysis of potential reforms to the State’s overall health care system, DOH and the State Insurance Department commented: “New York has one of the most expensive health care systems in the United States, which has the most expensive health care system in the world.”21 Major efforts to restructure and reform New York’s Medicaid program during its first three decades included: freezing Medicaid rates for hospital and health-related services, and changing hospital reimbursement from a retrospective to a prospective system that provides fixed payments for hospital services, in 196922; conferring emergency powers on the Governor to implement certain Medicaid expenditure controls, in 197623; and creating a uniform and prospective hospital reimbursement system that incorporates much of the State’s methodology for establishing Medicaid rates and allows for partial reimbursement of hospital bad debt and charity care costs, in 1982.24
17 New York State Division of the Budget, Executive Budget for the fiscal year April 1, 1968 to March 31, 1969, p. M47. 18 See www.health.ny.gov/health_care/medicaid/redesign/docs/mrtfinalreport.pdf. 19 Ibid. 20 See http://publications.budget.ny.gov/eBudget1516/financialPlan/FinPlan.pdf. 21 For more information, see the New York State Department of Health/Insurance Department report, “Reforms to Achieve Quality, Affordable Coverage for All New Yorkers,” p. 8; available at www.health.ny.gov/health_care/reports/docs/2009-07-17_release_of_urban_institute_report.pdf. 22 Chapter 957 of the Laws of 1969. 23 Chapter 76 of the Laws of 1976. 24 Chapters 536, 537 and 538 of the Laws of 1982.
11
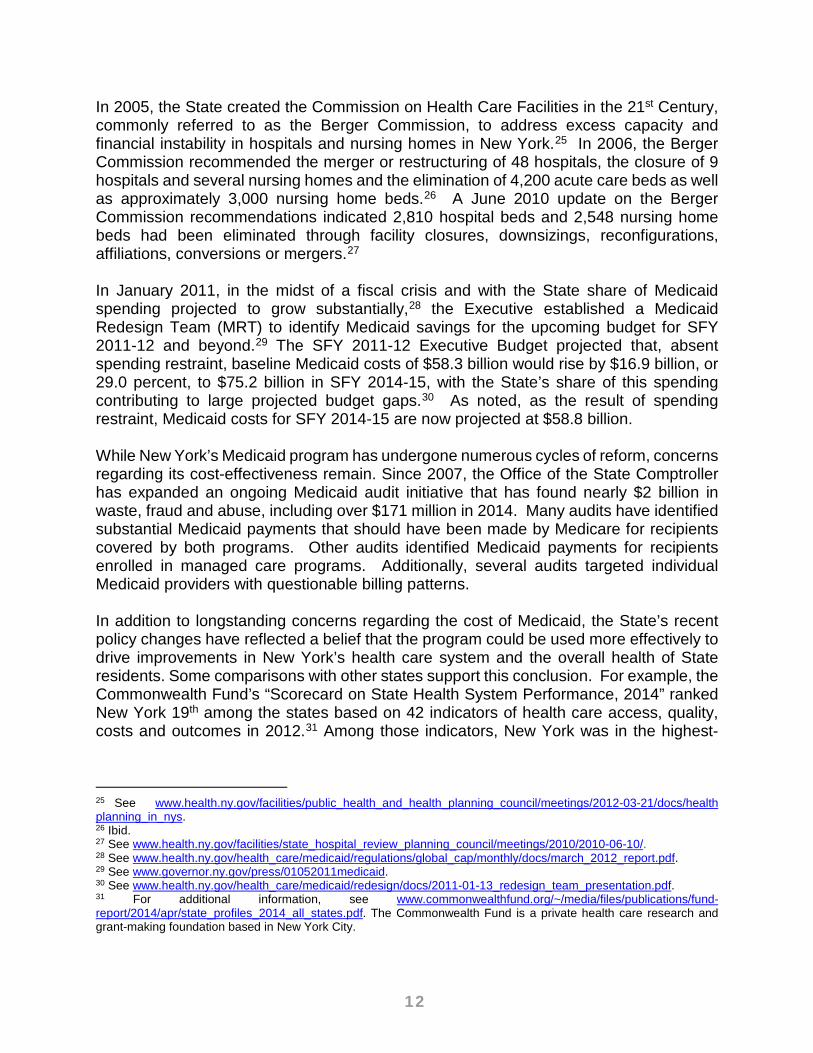
In 2005, the State created the Commission on Health Care Facilities in the 21st Century, commonly referred to as the Berger Commission, to address excess capacity and financial instability in hospitals and nursing homes in New York.25 In 2006, the Berger Commission recommended the merger or restructuring of 48 hospitals, the closure of 9 hospitals and several nursing homes and the elimination of 4,200 acute care beds as well as approximately 3,000 nursing home beds.26 A June 2010 update on the Berger Commission recommendations indicated 2,810 hospital beds and 2,548 nursing home beds had been eliminated through facility closures, downsizings, reconfigurations, affiliations, conversions or mergers.27 In January 2011, in the midst of a fiscal crisis and with the State share of Medicaid spending projected to grow substantially,28 the Executive established a Medicaid Redesign Team (MRT) to identify Medicaid savings for the upcoming budget for SFY 2011-12 and beyond.29 The SFY 2011-12 Executive Budget projected that, absent spending restraint, baseline Medicaid costs of $58.3 billion would rise by $16.9 billion, or 29.0 percent, to $75.2 billion in SFY 2014-15, with the State’s share of this spending contributing to large projected budget gaps.30 As noted, as the result of spending restraint, Medicaid costs for SFY 2014-15 are now projected at $58.8 billion. While New York’s Medicaid program has undergone numerous cycles of reform, concerns regarding its cost-effectiveness remain. Since 2007, the Office of the State Comptroller has expanded an ongoing Medicaid audit initiative that has found nearly $2 billion in waste, fraud and abuse, including over $171 million in 2014. Many audits have identified substantial Medicaid payments that should have been made by Medicare for recipients covered by both programs. Other audits identified Medicaid payments for recipients enrolled in managed care programs. Additionally, several audits targeted individual Medicaid providers with questionable billing patterns. In addition to longstanding concerns regarding the cost of Medicaid, the State’s recent policy changes have reflected a belief that the program could be used more effectively to drive improvements in New York’s health care system and the overall health of State residents. Some comparisons with other states support this conclusion. For example, the Commonwealth Fund’s “Scorecard on State Health System Performance, 2014” ranked New York 19th among the states based on 42 indicators of health care access, quality, costs and outcomes in 2012.31 Among those indicators, New York was in the highest-
25 See www.health.ny.gov/facilities/public_health_and_health_planning_council/meetings/2012-03-21/docs/health planning_in_nys. 26 Ibid. 27 See www.health.ny.gov/facilities/state_hospital_review_planning_council/meetings/2010/2010-06-10/. 28 See www.health.ny.gov/health_care/medicaid/regulations/global_cap/monthly/docs/march_2012_report.pdf. 29 See www.governor.ny.gov/press/01052011medicaid. 30 See www.health.ny.gov/health_care/medicaid/redesign/docs/2011-01-13_redesign_team_presentation.pdf. 31 For additional information, see www.commonwealthfund.org/~/media/files/publications/fund-report/2014/apr/state_profiles_2014_all_states.pdf. The Commonwealth Fund is a private health care research and grant-making foundation based in New York City.
12

ranking quartile of states in 12, among the second quartile in 14, and below the median in the remaining 16. Areas where New York received relatively high rankings included the percentage of children who experienced a medical and dental preventive care visit in the previous year, overall infant mortality rate and the proportion of adults who smoke. The scorecard gave the State low grades for several indicators related to avoidable hospital use and cost, including admissions for pediatric asthma and 30-day readmissions for Medicare patients. Among indicators that show trends over time, New York’s score improved on 16 and worsened on seven. Overall, compared to a previous Commonwealth scorecard, the State’s ranking relative to other states dropped, from 18th in 2009 to 19th in the 2014 assessment. According to DOH, the key to addressing the State Medicaid program’s quality issues is “ending the State’s Medicaid fee-for-service system and replacing it with a comprehensive, high-quality and integrated care management system that will lower costs and improve health outcomes.”32 DOH also believes Medicaid reform has the potential to produce broader health system changes in New York that will benefit the State’s entire population. New York’s Medicaid Redesign Team In MRT Phase 1, the Medicaid Redesign Team, comprising 27 stakeholders representing most sectors of the State’s health care delivery system, as well as patient advocates, made 79 recommendations for reforming and restructuring the program, 78 of which were approved by the State Legislature as part of the SFY 2011-12 Enacted Budget.33 Major recommendations included a global spending cap on DOH Medicaid expenditures, plans to transition most recipients and benefits into Medicaid managed care, reforming the personal care services program in New York City, controlling utilization of Medicaid home health services, and reducing Medicaid transportation costs, as well as spending re-estimates. The proposals were intended to reduce projected State DOH Medicaid expenditures from the General Fund by $2.3 billion, to approximately $15.3 billion in SFY 2011-12. That level was still $3.4 billion, or 28.4 percent, higher than SFY 2010-11 spending because of the expiration of the additional federal Medicaid funding provided by the American Recovery and Reinvestment Act of 2009 (ARRA) in June 2011.34 After budget actions, overall Medicaid spending, including spending by local governments and federal funds, was projected to total $52.6 billion in SFY 2011-12, approximately $5.7 billion or 9.8 percent lower than the original SFY 2011-12 projections.35 Actual Medicaid
32 See www.health.ny.gov/health_care/medicaid/redesign/docs/mrtfinalreport.pdf, page 5. 33 See www.health.ny.gov/health_care/medicaid/redesign/docs/mrtfinalreport.pdf. 34 See www.budget.ny.gov/pubs/archive/fy1112archive/enacted1112/2011-12EnactedBudget.pdf. 35 Ibid.
13

spending for SFY 2011-12 totaled $53.9 billion – $1.3 billion, or 2.5 percent higher than projected.36 MRT Phases 2, 3 and 4, approved by the Legislature as part of the SFY 2012-13, SFY 2013-14, and SFY 2014-15 Enacted Budgets, respectively, implemented further reforms that included transitioning Medicaid administration from counties to the State, modifying Medicaid’s basic benefit package, establishing dedicated funding for development of supportive housing for recipients, integrating and managing care for recipients also eligible for Medicare services (the Fully Integrated Duals Advantage or FIDA program), and developing the State’s new Delivery System Reform Incentive Payment (DSRIP) program. DSRIP is the centerpiece of the State’s $8 billion federal waiver amendment to improve health outcomes for New York Medicaid recipients while reducing Medicaid costs.37 As of January 2015, MRT progress updates posted on the DOH website indicate that 260 out of a total of 270 MRT projects have been substantially completed, merged with other projects, included in the State’s Medicaid waiver amendment, or are in progress. Of the ten projects that have not been implemented, two SFY 2013-14 projects were suspended or canceled, seven SFY 2012-13 projects were suspended or cancelled and one SFY 2011-12 project was cancelled.38 In addition to the MRT initiatives discussed above, such as the global spending cap and the continuing expansion of managed care, important projects currently underway include implementing health homes for high-cost, high-need enrollees, establishing dedicated State-only Medicaid funding for supportive housing development, and accelerating enrollment in managed long-term care plans. Medicaid Spending Cap One of the major elements of the initial phase of the MRT’s work was enactment of a global cap on State DOH Medicaid spending, which was limited to $15.3 billion in SFY 2011-12 and $15.9 billion in SFY 2012-13, as reflected in Figure 5.39 Figure 5 also puts
36 See www.budget.ny.gov/pubs/archive/fy1314archive/enacted1314/FY2014MidYearUpdate.pdf for State and federal shares of Medicaid. Local share Medicaid spending in SFY 2011-12 was $8.1 billion, according to DOB. 37 See www.health.ny.gov/health_care/medicaid/redesign/docs/dsrip_faq.pdf. The DSRIP program provides incentive payments for collaborative groups of Medicaid providers meeting predefined measures and outcomes that improve the care they deliver, improve the health of the Medicaid recipients they serve and reduce per capita Medicaid costs. The primary goal of the DSRIP program is to reduce avoidable hospital use by 25 percent over five years. The federal government’s special terms and conditions for amending and extending the Partnership Plan specify that DSRIP payments are not direct reimbursement for expenditures or payments for services. 38 See www.health.ny.gov/health_care/medicaid/redesign/mrt_progress_updates.htm. 39 State DOH Medicaid spending, as defined in Local Assistance appropriation legislation, excludes Medicaid payments for medical services provided at State facilities operated by the State Office of Mental Health, the State Office for People with Developmental Disabilities and the State Office of Alcoholism and Substance Abuse Services, as well as any other payments not appropriated within DOH, and the local and federal shares of New York Medicaid disbursements. Statutory provisions of the Medicaid spending cap also allow for adjustments to Medicaid spending projections, including: changes in the percentage of the Medicaid program paid for by the federal government; increases in provider revenue; reductions in payments to local social services districts for administering the Medicaid program; operational costs of the State’s medical indemnity fund (established in 2011 to meet the health care needs of plaintiffs in certain
14

State DOH Medicaid spending in the context of total New York Medicaid expenditures, which include the local, overall State (including Medicaid expenditures made in agencies other than DOH) and federal shares of program disbursements, since enactment of the Medicaid spending cap. Figure 5
Total Medicaid Spending by Federal, State and Local Share (Dollars in billions, by State Fiscal Year)
Source: Division of the Budget. Note: DOB’s Medicaid presentation of spending totals and projections reflects various cash adjustments and components not reflected in federal CMS-64 quarterly Medicaid expense reports. Numbers may not add due to rounding. Starting April 1, 2012, the global cap limited year-to-year growth in State DOH Medicaid spending to the ten-year rolling average of the medical component of the Consumer Price Index (medical CPI). Subsequent amendments to the global cap indexed growth in projected Medicaid services spending, which represents 97.3 percent of total State DOH Medicaid spending in SFY 2014-15, to the medical CPI (3.8 percent for SFY 2014-15). Certain other State DOH Medicaid costs included under the global cap are not indexed to the medical CPI, such as State costs associated with the takeover of local Medicaid growth, Monroe County’s participation in the program to cap local Medicaid spending, and Medicaid administrative costs previously funded under DOH’s public health budget that have been transferred to the global cap. The SFY 2014-15 Enacted Budget also extended for an additional year, through March 2016, the authority of the State Health Commissioner to keep State DOH Medicaid spending under the cap if DOB determines that disbursements are expected to exceed projections. Such authority has not been used since it was established in 2011. In addition, if State DOH Medicaid spending remains below the cap, the SFY 2014-15 Enacted Budget authorized the State Health Commissioner to distribute half of the amount under the cap proportionately among Medicaid plans and providers, and the other half to financially distressed and critically needed providers, as identified by the
medical malpractice actions); and increased or expedited State DOH Medicaid spending resulting from natural or other types of disasters.
2011-12 2012-13 2013-14 2014-15 2015-16 2016-17 2017-18 2018-19Results Results Results Projected Projected Projected Projected Projected
State DOH $15.312 $15.900 $16.382 $16.962 $17.571 $17.868 $18.612 $19.330Share of Total 28.4% 29.9% 29.8% 28.9% 28.3% 28.3% 28.0% 28.3%
Overall State Funds 20.828 20.747 21.312 22.023 22.462 22.610 23.849 24.816Share of Total 38.7% 39.0% 38.8% 37.5% 36.2% 35.8% 35.8% 36.3%
Federal Funds 24.921 23.940 24.848 28.002 30.724 31.810 33.944 34.885Share of Total 46.3% 45.0% 45.2% 47.7% 49.5% 50.3% 51.0% 51.0%
Local Funds 8.132 8.495 8.779 8.726 8.860 8.758 8.737 8.678Share of Total 15.1% 16.0% 16.0% 14.9% 14.3% 13.9% 13.1% 12.7%
All Funds $53.881 $53.182 $54.939 $58.751 $62.046 $63.178 $66.530 $68.379
15

Commissioner, during the last quarter of the State fiscal year. Through November 2014, State DOH Medicaid spending during SFY 2014-15 was $10 million, or 0.1 percent, below the cap. However, because of the slim margin between actual and projected spending, DOH has announced that it will not distribute any spending under the cap to Medicaid plans and providers in SFY 2014-15. The SFY 2015-16 Executive Budget Financial Plan projects the State’s share of annual Medicaid expenditures will rise by nearly $2.8 billion, to just below $25 billion, from the current fiscal year to SFY 2018-19.40 Impact of the Affordable Care Act Total Medicaid spending in New York, including the local share, after decreasing by 1.3 percent from SFY 2011-12 to SFY 2012-13, is projected to rise by about 4.3 percent a year through SFY 2018-19. Such growth is largely due to projected increases in federal funding, much of it related to implementation of the Affordable Care Act (ACA) starting in January 2014, as well as the State’s Medicaid waiver amendment. Federal support for Medicaid in New York is projected to rise by nearly $6.9 billion, or 24.6 percent, over the four years ending in SFY 2018-19.41 The federal share of most Medicaid service costs in New York is 50 percent. However, under the ACA, the federal government is paying 100 percent of the costs of approximately 77,000 newly eligible New Yorkers.42 Before the enactment of the ACA, New York expanded its program to cover a large number of parents and nonpregnant childless adults who had been historically ineligible for Medicaid – approximately 800,000 people. For those beneficiaries, the State is receiving a phased-in increase in its federal matching rate, which rises to 90 percent by 2020 and thereafter.43 As a result of these and other provisions of the ACA, the State Medicaid program has received or is projected to receive significant amounts of additional federal aid: $405 million in SFY 2013-14, $2.6 billion in SFY 2014-15, $3.4 billion in SFY 2015-16, $4 billion in SFY 2016-17 and $4.2 billion for SFY 2017-18, according to DOB.44 DOB projects that overall local Medicaid costs will decline modestly in SFY 2016-17 and the two subsequent State fiscal years.45
40 This includes spending from agencies other than DOH. For more information, see http://publications.budget.ny.gov/eBudget1516/financialPlan/FinPlan.pdf. Note that there are a number of differences between spending figures from the federal government and figures used in the State’s Financial Plan, including fiscal year, various Financial Plan adjustments and certain components that are included in one, but not the other. 41 See http://publications.budget.ny.gov/eBudget1516/financialPlan/FinPlan.pdf. 42 Federal payments start at 100 percent of costs and phase down to 90 percent in 2020 and thereafter. See www.info.nystateofhealth.ny.gov/sites/default/files/NY%20Medicaid%20Benchmark%20Benefit%20Option_HMA.pdf. 43 Ibid. 44 See http://publications.budget.ny.gov/budgetFP/fy15fp_q1update.pdf for amounts for SFYs 2013-14 and 2014-15. Amounts for subsequent State fiscal years were provided by DOB’s Health Unit. 45 DOB briefing documents on Medicaid, Health Care Reform Act programs and public health.
16

Another important element of the initial phase of the MRT’s work, named “Care Management for All,” redirects almost all Medicaid spending in the State from fee-for-service Medicaid payments to managed care by April 2018.46 Under managed care, the State pays a monthly premium to a managed care organization, which is responsible for managing patient care and reimbursing service providers.47 Transition to Medicaid Managed Care New York has been enrolling Medicaid recipients into managed care since the late 1980s, following enactment of Chapter 710 of the Laws of 1988. This legislation allowed counties to require managed care participation for Home Relief recipients48 and Aid to Families with Dependent Children (AFDC) recipients,49 but capped AFDC participation in large counties.50 Chapter 165 of the Laws of 1991, enacted to increase the enrollment of Medicaid recipients in managed care, removed the caps on AFDC participation in managed care and required each county to submit a managed care plan to the State.51 Five years later, Executive Budget documents for SFY 1996-97 indicated that enrollment in Medicaid managed care had grown to nearly 660,000 individuals.52 In July 1997, the federal government approved the State’s Medicaid waiver request, a demonstration project known as the Partnership Plan, to enroll most recipients into Medicaid managed care, either on a voluntary or mandatory basis.53 The Partnership Plan has been amended and extended many times since, but continues to be the State’s primary vehicle for expanding Medicaid coverage to additional low-income New Yorkers.54 An interim evaluation report on the Partnership Plan prepared for DOH in March 2009 found that “the proportion of Medicaid enrollees in managed care increased from nine percent in 1990 to approximately 64 percent in June 2007.”55 In SFY 2013-14, as shown
46 See www.health.ny.gov/health_care/medicaid/redesign/docs/care_manage_for_all.pdf. Under fee-for-service Medicaid, health services providers bill directly to the State and are paid for each service, such as an office visit, test or procedure, they provide. 47 See www.health.ny.gov/health_care/medicaid/redesign/docs/care_manage_for_all.pdf. 48 Home Relief is the pre-welfare reform cash assistance program for single and childless couples, funded by states and local governments, which was replaced by the Safety Net Assistance program. 49 Aid to Families with Dependent Children is the pre-welfare reform cash assistance program for needy families, funded by the federal government, which was replaced by the Family Assistance (FA) program. 50 Broken Promises, Emerging Problems: Medicaid Managed Care under the Pataki Administration, New York Assembly Committees on Health, Insurance and Social Services, April 1997. 51 Ibid. 52 New York State 1996-1997 Executive Budget, Appendix I, page 145. 53 For more information, see the New York Partnership Plan 1115 Demonstration Overview and Fact Sheet at www.medicaid.gov/Medicaid-CHIP-Program-Information/By-Topics/Waivers/1115/downloads/ny/ny-partnership-plan-fs.pdf. 54 For more information, see the Application for Partnership Plan Waiver Extension at www.medicaid.gov/Medicaid-CHIP-Program-Information/By-Topics/Waivers/1115/downloads/ny/ny-partnership-plan-pa.pdf. 55 DOH, Office of Health Insurance Programs, Interim Program Evaluation of Section 111 Waiver Programs, Submitted by Delmarva Foundation of Easton, Maryland, March 2009.
17

in Figure 6, more than three-quarters of all DOH Medicaid recipients were enrolled in managed care plans.56 Figure 6
DOH Medicaid Enrollees by Delivery System
(By State Fiscal Year)
Source: New York Department of Health. While requiring more recipients to enroll in managed care, DOH has also transitioned various Medicaid benefits to managed care, including personal care, prescription drugs, home health, hospice and dental services.57
56 For more information, see www.health.ny.gov/health_care/medicaid/regulations/global_cap/monthly/sfy_2014-2015/docs/june_2014_report.pdf and www.health.ny.gov/health_care/medicaid/statistics/. Percentages of DOH Medicaid recipients enrolled in managed care and fee-for-service indicated in Figure 6 reflect average monthly enrollment numbers over the 12-month period of each State Fiscal Year, except for SFY 2013-14, which reflects average monthly enrollment numbers over the 9-month period from April 2013 through December 2013. Total monthly enrollment numbers for January, February and March 2014 are not yet available. 57 Populations transitioned to Medicaid managed care include homeless persons, individuals with end stage renal disease, certain foster care children, low birth-weight or disabled infants under six months of age and individuals living with HIV in upstate areas. Benefits transitioned to Medicaid managed care include most personal care services, pharmacy services, dental services in counties without health plan coverage, hospice services and adult day health care.
65.3% 66.6% 68.3% 70.2% 73.6% 75.9%
34.7%33.4%
31.7% 29.8%26.4%
24.2%
0
1
2
3
4
5
6
2008-09
2009-10
2010-11
2011-12
2012-13
2013-14
Mill
ions
Managed Care Enrollees Fee-For-Service Enrollees
18

These changes have driven major increases in Medicaid payments for managed care and reductions in traditional fee-for-service payments. In SFY 2008-09, $8.5 billion in DOH Medicaid managed care premium payments accounted for about 22 percent of the $39.4 billion in overall DOH Medicaid claims spending. Five years later, DOH Medicaid managed care premium payments accounted for nearly 50 percent of the $48.0 billion in overall DOH Medicaid claims spending, increasing by $15.2 billion, or 178.7 percent, to $23.7 billion in SFY 2013-14.58 As previously noted, one of the core goals of the State’s MRT initiative is to move the bulk of the previously excluded benefits and patient populations from fee-for-service Medicaid into managed care over the next four years.59 By April 2018, DOH expects enrollment in managed care to rise to 95 percent of the Medicaid population and Medicaid spending flowing through managed care plans to exceed $45 billion.60 The most recent change to the Partnership Plan, the State’s Medicaid waiver amendment, encompasses DSRIP and was approved by the federal government in April 2014. The waiver amendment would provide the State up to $8 billion in new federal Medicaid funding over the next five years if CMS agrees to New York’s request to extend the Partnership Plan through December 2019.61 The amendment authorizes initial funding of up to $120 million for planning grant payments and administrative costs under the DSRIP program, as well as up to $500 million from the Interim Access Assurance Fund (IAAF) to stabilize the finances of safety net hospitals participating in the DSRIP program. As of January 2015, DOH has awarded nearly $500 million from the IAAF to 27 safety net hospitals62 and five large public hospitals.63 In August 2014, DOH announced a total of $21.6 million in DSRIP project design grants to emerging performing provider systems (PPSs) preparing DSRIP project plan applications.64 DOH expects to make DSRIP project plan awards in March 2015. DSRIP Year 1 begins April 1, 2015; DOH expects to make initial Year 1 payments to approved PPSs in mid-April 2015. Payments beyond March 31, 2015, when the temporary extension of the Partnership Plan’s current demonstration period expires, are contingent on federal approval of a new demonstration period for the Partnership Plan as well as “satisfactory initial implementation” of MRT activities.65
58 New York State Management and Administrative Reporting Subsystem (MARS) reports 72 and 73 for DOH. 59 See www.health.ny.gov/health_care/medicaid/redesign/docs/dsrip_faq.pdf. 60 See www.health.ny.gov/health_care/medicaid/redesign/docs/care_manage_for_all.pdf. 61 For more information, see www.medicaid.gov/Medicaid-CHIP-Program-Information/By-Topics/Waivers/1115/downloads/ny/ny-partnership-plan-pa.pdf. On December 31, 2014, the day the Partnership Plan current demonstration period would have expired, CMS granted DOH a temporary extension through March 31, 2015 to give the federal government and DOH more time to discuss issues involving approval of a new demonstration period. 62 See www.health.ny.gov/health_care/medicaid/redesign/docs/safety_net_definitions.pdf, for the definition of safety net hospital. 63 See www.health.ny.gov/health_care/medicaid/redesign/iaaf/docs/iaaf_awards_safety_nets.pdf for the list of IAAF awards for safety net hospitals, and for the list of IAAF awards for large public hospitals see www.health.ny.gov/health_care/medicaid/redesign/iaaf/docs/iaaf_awards_large_publics.pdf. 64 See www.health.ny.gov/health_care/medicaid/redesign/docs/design_grant_app_summary_chart.pdf. Performing provider systems (PPSs) are groups of Medicaid providers that are funded to participate in a DSRIP project; PPSs that complete project milestones and measures are eligible to receive DSRIP incentive payments. 65 See www.health.ny.gov/medicaid/redesign/docs/special_terms_and_conditions.pdf.
19

In addition to the $8 billion in anticipated new federal Medicaid waiver funds, New York is providing $2.6 billion of its own capital funding for hospitals, nursing homes, clinics, primary care and home care providers, and assisted living programs to allow them to pursue closures, mergers, infrastructure improvements and other “transformational” strategies that complement health care reform projects supported by the waiver. The State’s original federal waiver application requested $1.7 billion in capital funding for safety net hospitals, as well as $1.25 billion for primary care expansion, including capital investment, but the federal government rejected the requests for capital resources as “unfundable.”66 DOH has also issued guidance to PPSs interested in seeking regulatory waivers in connection with the DSRIP Program and the State’s capital funding. The MRT waiver amendment also requires the State to develop a plan to require managed care plans to make 90 percent of payments to Medicaid providers using “value-based,” instead of fee-for-service, payment arrangements67 that “encourage and reward positive system transformation.”68 According to the New York State Health Innovation Plan, developed with $100 million in federal grant funding and intended to build upon Medicaid reform efforts and achieve similar results across the State’s entire health care system, a value-based payment arrangement aligns the financial interests of payers and providers with the health interests of patients by creating “incentives to encourage providers to focus on effective, efficient strategies to improve health outcomes.”69 Traditional fee-for-service payment models, on the other hand, “do little to reward quality or efficiency” and “reward providers simply for the volume of services provided.”70 DOH’s 2013 report comparing performance among types of health insurance within the State found that Medicaid performance results match or exceed commercial health insurance results for over 65 percent of all measures, and that differences between Medicaid and commercial managed care plans have “continued to diminish in numerous areas of care including preventive care, prenatal care, women’s health and care for people with chronic conditions.”71 However, in its public statements about MRT and the new federal waiver, DOH has indicated that further progress is needed to fully achieve the cost-saving and quality-enhancing goals of managed care.”72 DOH’s most recent interim evaluation report on the Partnership Plan waiver73 estimates $38.5 billion in savings to the State and the federal government since the waiver began in October 1997 through March 2011. The report projected additional State and federal savings of $18.8 billion for the period from April 2011 through December 2014 and, if the
66 See www.health.ny.gov/health_care/medicaid/redesign/docs/2013-12-16_mrt_waiver_amend_crosswalk.pdf. 67 See www.health.ny.gov/health_care/medicaid/redesign/docs/dsrip_faq.pdf. 68 Ibid. 69 See www.health.ny.gov/technology/innovation_plan_initiative/docs/ny_state_health_innovation_plan.pdf, page 94. 70 Ibid. 71 See www.health.ny.gov/health_care/managed_care/qarrfull/qarr_2013/docs/executive_summary.pdf. 72 See www.health.ny.gov/health_care/medicaid/redesign/docs/mrtfinalreport.pdf. 73 The interim evaluation report, prepared by the Island Peer Review Organization (IPRO) under contract with DOH, is contained in DOH’s application to CMS to extend the waiver through December 2019 and rename it the MRT waiver. See www.medicaid.gov/Medicaid-CHIP-Program-Information/By-Topics/Waivers/1115/downloads/ny/ny-partnership-plan-pa.pdf.
20

State receives further approval from CMS to extend the waiver for five more years, $72.7 billion in State and federal savings for the period from January 2015 through December 2019. Estimated and projected savings are relative to Medicaid costs that would have occurred, or would occur, without the waiver for various Medicaid eligibility groups.74 Federal Reinvestment in New York’s Medicaid Program The April 2014 Medicaid waiver agreement between the State and the federal government is not the first time New York has used the Medicaid waiver process to obtain new federal funding intended to drive system reform – although it is certainly the largest in financial terms. Starting in October 1997, as part of the original Partnership Plan amendment, the State received a total of $1.6 billion in new federal funds, over seven years, for various hospital-specific projects under the Community Health Care Conversion Demonstration Project (CHCCDP). The CHCCDP was conceived primarily as a funding mechanism to help hospitals transition to Medicaid managed care. The State’s plan for operating and monitoring the project was similar to several MRT reform initiatives that this year’s Medicaid waiver amendment seeks to implement: for example, improving the long-term stability of safety net hospitals; promoting integration and networking among inpatient and outpatient providers; and supporting health care worker retraining.75 In addition to CHCCDP, the State received a total of $1.5 billion in new federal funding under the Federal-State Health Reform Partnership (F-SHRP). The federal government approved this stand-alone Medicaid waiver request in September 2006 to further reform and restructure the State’s health care delivery system, in conjunction with Berger Commission recommendations and $2.4 billion in State HEAL-NY76 funds to reduce acute care infrastructure, reform long-term care and improve primary and ambulatory care.77 The primary goals of the F-SHRP waiver, which expired in March 2014, were to reduce excess capacity in the State’s acute care system, create more community-based long-term care options, and expand Medicaid managed care in order to slow the growth of Medicaid spending and promote more efficient service delivery to Medicaid beneficiaries.78 Under the April 2014 waiver agreement with CMS, New York joins several other states, including California, Kansas, New Jersey and Texas, in implementing DSRIP programs to reform their Medicaid programs.79 As in the other states, provider-level accountability is a crucial component of New York’s DSRIP program, which requires groups of providers known as “PPSs” to choose from a predetermined list of projects for system
74 Ibid. 75 See www.health.ny.gov/health_care/managed_care/partner/operatio/docs/chapter_24.pdf. 76 The Health Efficiency and Affordability Law for New York (HEAL-NY) program, established in 2004, provides capital grants to encourage improvements in the operation and efficiency of the health care delivery system in the State. 77 See www.health.ny.gov/health_care/managed_care/appextension/docs/fshrp_special_and_conditions.pdf. 78 See www.health.ny.gov/funding/rfp/inactive/0704051116/0704051116.pdf. 79 See www.medicaid.gov/search.html?q=dsrip.
21

transformation, clinical improvement and population-wide health care, and then meet project-specific performance standards and timelines before receiving any of the new federal funding available under the waiver.80 Each project is tied to the focus of New York’s DSRIP program: reducing avoidable hospitalizations by 25 percent over the next five years. Factors driving DSRIP payments include the number and type of projects a PPS selects, the number of Medicaid members it serves, and the quality of its application. By increasing the number of projects it selects (generally, up to 10 are allowed, or 11 in certain circumstances), by selecting more “transformative” projects, or by serving more Medicaid members and receiving more points from the State’s independent assessor, a PPS will be eligible to receive more DSRIP money.81 However, PPSs will not receive any DSRIP payments if they do not meet “very specific, previously approved performance metrics . . . very different from what you have seen under previous New York State waiver amendments,” according to DOH’s State Medicaid Director.82 CMS also insisted on statewide accountability measures for the New York DSRIP program – unlike other states’ programs – that are expected to result in proportional payment reductions for all PPSs, even successful ones, if the State fails to pass any of four performance milestones. These accountability measures begin to take effect in 2017, the third year of the plan. The statewide milestones will assess:
• The progress of the plan’s system transformation projects, including measures associated with creation of integrated delivery systems. Measures include reductions in potentially avoidable services such as emergency room visits and readmissions, as well as the timeliness of routine and urgent care appointments, access to specialists, and access to information after hours. Each measure, calculated to reflect the performance of the entire State, will be assigned a direction as improving or worsening. The State passes this milestone if more measures are improving than worsening, compared to prior years and initial baseline performance.
• The composite success of every DSRIP project in achieving the goals assigned to the project. The State passes this milestone if the aggregate number of project-specific improvement standards met by all PPSs exceeds the number of improvement standards not met.
• Success in restraining growth in statewide total Medicaid spending, as well as inpatient and emergency room spending. Total Medicaid spending growth must
80 System transformation projects include creation of integrated delivery systems focused on evidence-based medicine. Clinical improvement projects involve behavioral and cardiovascular health, and strategies for management of asthma, diabetes and HIV/AIDS. Population-wide projects promote mental health and prevent substance abuse, prevent chronic diseases, HIV and STDs, and promote the health of women, infants and children by reducing premature births. 81 Public Consulting Group Inc. (PCG), selected by DOH to serve as an independent assessor of the State’s DSRIP program, is responsible for reviewing PPS project plan applications and making project plan approval recommendations to the State, as well as performing reporting, monitoring and technical assistance functions over the life of the DSRIP program. DOH selected PCG under budget authority exempting the procurement from the Office of the State Comptroller’s procurement oversight and from competitive bidding. 82 See www.youtube.com/watch?v=0cygySbesjs&feature=youtu.be.
22

be at or below the ten-year average rate of the medical component of the Consumer Price Index (CPI) (the target trend rate) in the fourth and fifth years of the waiver period. Growth in inpatient and emergency room spending must be one percentage point below the target trend rate or lower in the third year of the waiver period, and two percentage points below the target trend rate or lower in the fourth and fifth years of the waiver period.83
• Implementation of a managed care plan that moves health plans participating in the State’s Medicaid managed care program away from traditional fee-for-service payments to payment approaches that reward value, not volume. Such approaches, part of the State’s Health Innovation Plan, would reward providers who help patients stay healthy and achieve quality health care outcomes at an efficient cost.84 To pass this milestone, the State must develop a plan that reflects the impact of DSRIP on managed care contracts and rate-setting before it submits contracts and rates to CMS for approval for State Fiscal Year 2015-16. According to DOH’s State Medicaid Director, this milestone is critical to “ensuring that DSRIP, and particularly the performing provider systems we are building, continue well beyond the life of the waiver.”85 To advance the transition away from fee-for-service payments and achieve the milestone, DOH intends to develop a specific proposal to require New York Medicaid managed care plans to make 90 percent of all provider payments using “non-fee-for-service, value-based payment systems” by the end of the five-year waiver period.86 DOH’s State Medicaid Director calls this milestone a “seismic change” for the State’s Medicaid managed care plans, while also regarding it as “highly consistent” with what the State’s Medicaid Redesign Team has been trying to accomplish under Care Management for All.
Figure 7
Potential Accountability Penalties under 2014 Medicaid Waiver Amendment (In millions)
Source: CMS Official Documents, DSRIP Special Terms and Conditions.87
As shown in Figure 7, failure to pass all four milestones will result in reductions of more than $380 million in projected new federal DSRIP funding. Such penalties would start in
83 Performance on this milestone is determined using per member, per month (PMPM) calculations that exclude growth in federal funding associated with the Affordable Care Act. 84 See www.health.ny.gov/technology/innovation_plan_initiative/docs/ny_state_health_innovation_plan.pdf. 85 See www.health.ny.gov/health_care/medicaid/redesign/docs/2014-04-11_mrt_part2.wmv. 86 Ibid. 87 See www.health.ny.gov/health_care/medicaid/redesign/docs/special_terms_and_conditions.pdf.
CY 2017 2018 2019 TotalDSRIP Penalty $74.09 $131.71 $175.62 $381.42DSHP Penalty $23.39 $34.35 $35.74 $93.48Total $97.48 $166.06 $211.36 $474.90
23

the third year of the waiver (i.e., CY 2017) and extend into the fourth and fifth years (CYs 2018 and 2019, respectively). The potential DSRIP penalties represent 5 percent, 10 percent and 20 percent of DSRIP funding available for each of the three calendar years, respectively. In addition to the DSRIP penalties, New York may also lose similar percentages of additional federal Medicaid funding available to the State for State-only spending associated with Designated State Health Programs (DSHPs),88 if the State does not limit growth in hospital inpatient and emergency room spending to half a percentage point below the medical CPI in CY 2017 and to one percentage point below the medical CPI in each of the following two calendar years. Aside from potential penalties, groups of providers participating in the DSRIP program must achieve specific, previously approved performance measures to receive any federal waiver payments under the program. Performing provider systems that fail to meet annual milestones on any measure are ineligible to receive any incentive payments in any given DSRIP year. Any funding that would have been allocated to a PPS during the year will be placed in a performance pool fund and distributed to PPSs that exceed their performance benchmarks during the year. Any such failures by provider systems to meet the waiver requirements could diminish the level of new federal resources delivered to New York, by amounts that are difficult to predict.
88 Designated State Health Programs include various non-Medicaid programs such as Tobacco Use Prevention and Control, AIDS Drug Assistance, Health Workforce Retraining, Community Services for the Elderly, and Expanded In-Home Services for the Elderly. Approximately $1.1 billion in federal Medicaid funding available to the State under this aspect of the waiver agreement would support health home development and investments in long-term care, workforce and enhanced behavioral health services.
24

Opportunities, Challenges and Risks Ahead Medicaid plays a vitally important role in the provision of health care for the indigent as well as for low-income individuals and, particularly in the area of long-term care, for many middle-class New Yorkers. As outlined above, it also is a major factor in the State’s budget and overall health care system. Given the many ways in which Medicaid affects individual New Yorkers and their communities, major changes in the program pose significant opportunities as well as challenges and risks. As DOH has emphasized, the federal waiver amendment provides wide-ranging, important opportunities for the State to create a better health care system for New Yorkers who rely on Medicaid. New reforms also may drive the State’s overall health care system in the same direction as the Medicaid program – by focusing on primary care and improved patient outcomes, and reducing avoidable hospital use. To the extent such improvements occur, millions of New Yorkers with privately paid health insurance may benefit as well. Meanwhile, continuing to restrain growth in the cost of Medicaid may provide State policy makers additional flexibility in addressing other budgetary goals, including limiting taxes. At the same time, DOH faces the challenge of carrying out two other major Medicaid reforms that are considered essential building blocks for improving New York’s health care delivery system. These are the Fully Integrated Duals Advantage (FIDA) demonstration program, which is giving approximately 170,000 Medicaid recipients also eligible for Medicare an opportunity to enroll in health plans providing integrated benefits89; and the Behavioral Health Managed Care program, which incorporates behavioral health services for Medicaid recipients into managed care and is expected to start in 2015. At this point, it is unclear whether these programs will achieve their goals and savings targets. The SFY 2014-15 Enacted Budget provided $110 million in State and federal funding to help transition behavioral health services to Medicaid managed care.90 The New York City Health and Hospitals Corporation, associations of hospitals and other providers, consumer advocates and other stakeholders have raised concerns about certain aspects of the waiver amendment in comments submitted to DOH. Comments by these stakeholders, posted on the DOH website, reflect the competing interests the State will have to weigh over the coming months as it prepares to begin evaluating DSRIP project plans. Discussion of some of these issues is likely to continue over the coming years as changes associated with the waiver amendment are implemented. Issues include broad questions, such as whether the waiver’s provisions for funding based on cost-control metrics are appropriate or may hamper efforts to improve access to care and health outcomes. Other concerns address more specific issues such as the
89 See www.health.ny.gov/health_care/medicaid/redesign/docs/2013-08-26_ny_mou_press_release.pdf. 90 See www.health.ny.gov/health_care/medicaid/regulations/global_cap/monthly/docs/may_2014_report.pdf.
25
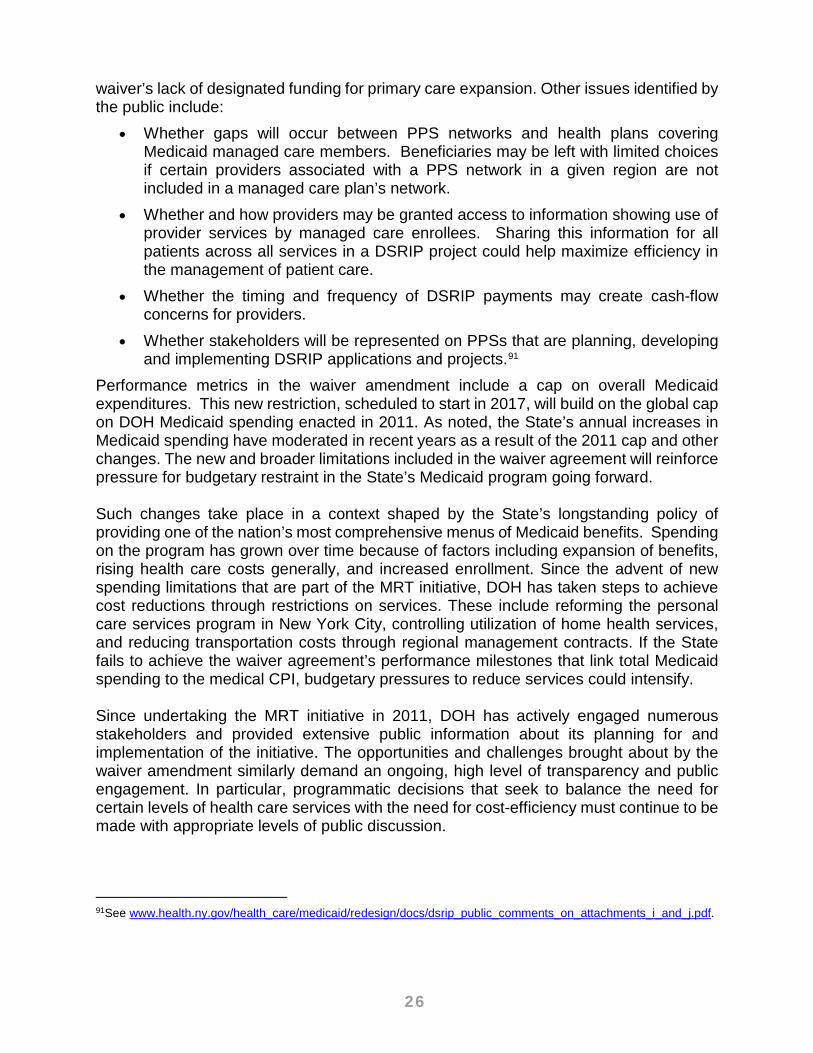
waiver’s lack of designated funding for primary care expansion. Other issues identified by the public include:
• Whether gaps will occur between PPS networks and health plans covering Medicaid managed care members. Beneficiaries may be left with limited choices if certain providers associated with a PPS network in a given region are not included in a managed care plan’s network.
• Whether and how providers may be granted access to information showing use of provider services by managed care enrollees. Sharing this information for all patients across all services in a DSRIP project could help maximize efficiency in the management of patient care.
• Whether the timing and frequency of DSRIP payments may create cash-flow concerns for providers.
• Whether stakeholders will be represented on PPSs that are planning, developing and implementing DSRIP applications and projects.91
Performance metrics in the waiver amendment include a cap on overall Medicaid expenditures. This new restriction, scheduled to start in 2017, will build on the global cap on DOH Medicaid spending enacted in 2011. As noted, the State’s annual increases in Medicaid spending have moderated in recent years as a result of the 2011 cap and other changes. The new and broader limitations included in the waiver agreement will reinforce pressure for budgetary restraint in the State’s Medicaid program going forward. Such changes take place in a context shaped by the State’s longstanding policy of providing one of the nation’s most comprehensive menus of Medicaid benefits. Spending on the program has grown over time because of factors including expansion of benefits, rising health care costs generally, and increased enrollment. Since the advent of new spending limitations that are part of the MRT initiative, DOH has taken steps to achieve cost reductions through restrictions on services. These include reforming the personal care services program in New York City, controlling utilization of home health services, and reducing transportation costs through regional management contracts. If the State fails to achieve the waiver agreement’s performance milestones that link total Medicaid spending to the medical CPI, budgetary pressures to reduce services could intensify. Since undertaking the MRT initiative in 2011, DOH has actively engaged numerous stakeholders and provided extensive public information about its planning for and implementation of the initiative. The opportunities and challenges brought about by the waiver amendment similarly demand an ongoing, high level of transparency and public engagement. In particular, programmatic decisions that seek to balance the need for certain levels of health care services with the need for cost-efficiency must continue to be made with appropriate levels of public discussion.
91See www.health.ny.gov/health_care/medicaid/redesign/docs/dsrip_public_comments_on_attachments_i_and_j.pdf.
26

As DOH transitions additional recipients, benefits and almost all Medicaid spending in the State from fee-for-service to Medicaid managed care, the agency should also commit to providing a broader range of publicly available statistical information on this process. The monthly Medicaid managed care enrollment reports available on the DOH website, as well as the schedules for transitioning Medicaid populations and service benefits to managed care included in DOH’s global spending cap reports, are a useful start. More detailed data on how the managed care plans are spending the premium payments they receive from the State would be helpful. This information could include, for example, spending by category of service and administration expenses for services such as payroll, marketing and office space. While such data is not publicly available from managed care plans, the DOH website currently provides quarterly reports on fee-for-service expenditures, by category of service, aid category and region. Encouraging Medicaid health plans to move away from traditional fee-for-service, or volume-based, payments to value-based payment models may also have important effects on the State’s overall health care delivery system. As the State implements this change, DOH should consider designing safeguards to prevent the underutilization of care if, under the new value-based payment system, providers limit services that do not immediately improve health outcomes (preventive care may be one example).92 Managed care organizations cover more than three-quarters of Medicaid enrollees today and are expected to expand their coverage to 95 percent within the next few years. These organizations may face continuing challenges to balance their Medicaid revenues with beneficiaries’ reasonable expectations of service. Ongoing scrutiny by DOH and the Department of Financial Services, given these agencies’ roles in setting health insurance premiums, can help boost public confidence that managed care organizations are providing appropriate levels of care within the context of State-approved insurance rates. Just as the MRT initiative has produced noticeable results by restraining growth in the State’s Medicaid costs, the federal waiver amendment is already delivering additional resources to New York. Since the federal government approved the State’s Medicaid waiver amendment in April 2014, DOH has paid out more than $500 million in waiver proceeds to safety net hospitals, public hospital systems and other entities, with a total $700 million expected to be paid through March 2015.93 As described earlier in this report, whether the State can meet federal accountability standards to reap the full $8 billion potential of the waiver will not be known for several years. Achieving the federally required milestones and drawing down as much as possible of the $8 billion available through the waiver are important goals. Yet, meeting those goals does not guarantee that New York will create a sustainable, integrated and high-performing health care delivery system. As outlined under the waiver, development of such a system
92 See www.rwjf.org/en/research-publications/find-rwjf-research/2010/04/global-and-episodic-bundling.html. 93 See www.health.ny.gov/health_care/medicaid/redesign/iaaf/iaaf_awards.htm and www.health.ny.gov/health_care/medicaid/redesign/docs/design_grant_app_summary_chart.pdf for information on DSRIP payments to date. For information on waiver uses of funding through March 2015 see www.health.ny.gov/health_care/medicaid/redesign/docs/special_terms_and_conditions.pdf, page 65.
27

requires that the new, collaborative systems of providers will be able to work effectively under the value-based payment reforms envisioned by the State after the waiver money has come and gone. The new federal waiver may also have unexpected broader impacts beyond Medicaid. For example, amendments to Medicaid managed care contracts reflecting new provider systems and DSRIP efficiencies may limit future revenues to managed care organizations, relative to current levels. Such an outcome could result in efforts by managed care organizations to increase revenues from the other major segment of their customer base – private purchasers of health insurance, primarily employers. As New York’s federal waiver initiative begins taking shape, the State is also continuing to implement major changes to Medicaid administrative functions. These include the selection of a new claims processing and payment contractor which will be responsible for major functions such as screening providers for the program, processing claims and payments to providers, managing pharmacy benefits, and preventing fraud and abuse (in coordination with the State Office of the Medicaid Inspector General). Other administrative changes planned or underway include the State takeover of certain responsibilities to determine patient eligibility from the counties and New York City, and the implementation of a new, automated eligibility and enrollment system for Medicaid and other health programs in concert with the operation of the State’s new health benefits exchange. These administrative changes represent major challenges for DOH, apart from those associated with the federal waiver and the ongoing MRT initiative. The State also faces the challenge of a CMS action to disallow and require repayment of $1.26 billion in federal payments made to New York for services to the developmentally disabled in SFY 2010-11. CMS has indicated it is reviewing the State’s claims for such aid in each of the two following years, and “a comparable amount of Federal aid may be disallowed for any prior period if CMS is successful,” according to DOB.94 In September 2014, the State’s request for reconsideration of CMS’s disallowance was denied. However, in January 2015, the State filed a notice of appeal with a federal appeals board, and indicated it may challenge the disallowance in federal court, if necessary.95 In addition, DOB estimates that President Obama’s 2014 Executive actions to reform the U.S. immigration system could add $38.3 million in State-only costs in SFY 2015-16 ($83.7 million in SFY 2016-17) to the New York Medicaid program.96 Given the complexity of the State’s health care system, the results of major Medicaid reforms are sometimes unpredictable. The MRT initiative and the federal waiver amendment together constitute a broader and more ambitious restructuring than any previously undertaken in New York. DOH should closely monitor and report continuously on key elements of its overall Medicaid reform initiative, and continue to work with stakeholders in addressing issues that may arise during implementation.
94 See the New York State Division of the Budget’s New York State FY 2016 Executive Budget Financial Plan, available at http://publications.budget.ny.gov/eBudget1516/financialPlan/FinPlan.pdf, page 44. 95 Ibid. 96 See www.health.ny.gov/health_care/medicaid/redesign/docs/2015-16_executive_budget_scorecard.pdf.
28