Embed Size (px)
Citation preview
Medicaid Explained How It Works and Why It’s So Important
Larry Joseph
Medicaid, which was signed into law 50 years ago by President Lyndon Johnson, is a critically im-portant health insurance program for low-income individuals and families. It is jointly funded by federal and state governments and administered by the states. In addition to providing access to health care for those with limited resources, Medicaid — like private insurance — provides fami-lies with financial protection against the risk of medical expenses. Medicaid is also a core funding source for safety-net hospitals and health centers that serve low-income communities.1 Nearly 3 million Illinois residents receive their health care through Medicaid and related pro-grams. Medicaid is by far the largest state program that benefits low-income children. Its funding structure, eligibility standards, and array of services are complex and often misunderstood. This introduction to Medicaid focuses on its importance for low-income children and other vulnerable populations, including parents, pregnant women, people with disabilities, and the elderly.
1 “Medicaid Moving Forward” (Kaiser Family Foundation, January 2015). Medicaid is sometimes confused with Medicare, which is a federal program that provides health insurance for seniors, as well as some individuals with disabilities, as an extension of the Social Security system.
Selected Highlights
• Medicaid and the Children’s Health Insurance Program (CHIP) have greatly reduced the proportion of children without health insurance. In addition, expanding health coverage for low-income children has had positive long-term effects on educational attainment and earnings in adulthood.
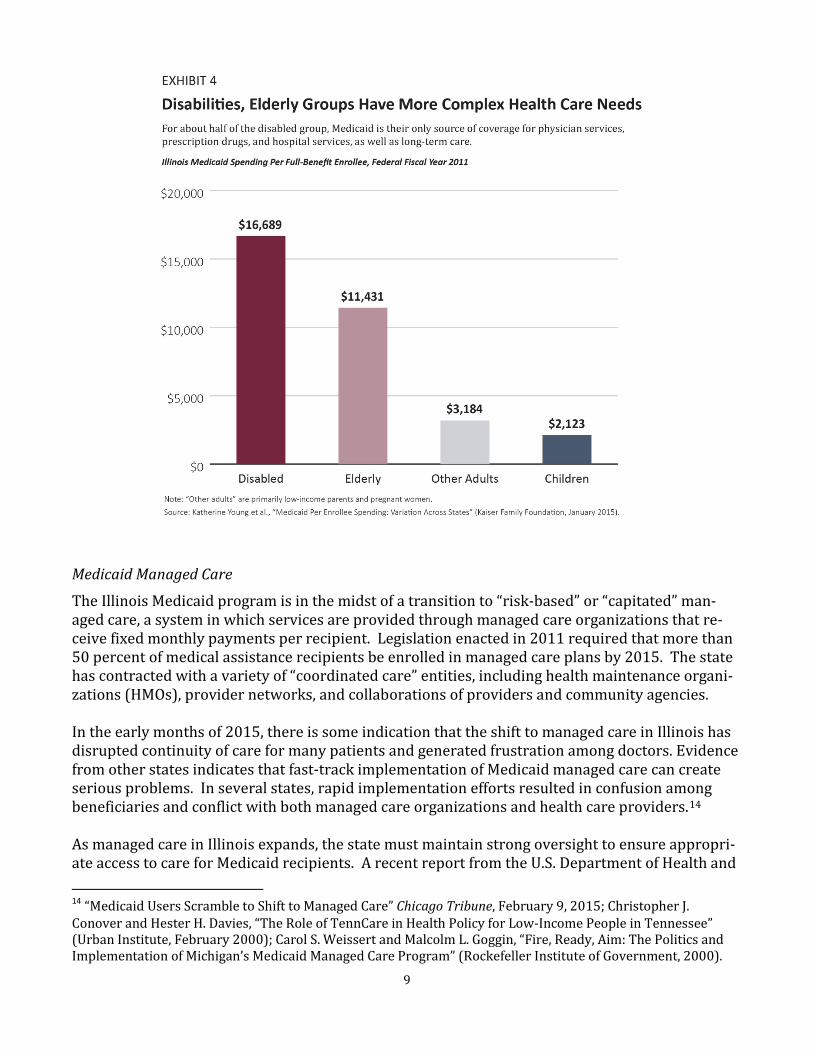
• Children represent more than 60 percent of medical assistance enrollment in Illinois but only one-fourth of program costs. By contrast, non-elderly adults with disabilities, who often have chronic medical conditions and complex health care needs, account for one-tenth of enrollment but about 40 percent of program costs.
• Medicaid spending per enrollee in Illinois is well below the U.S. average and lowest in the Midwest. Between 2000 and 2012, the rate of Medicaid spending growth in Illinois was substantially lower than the nationwide growth rate.
• The state should not expect major cost savings from the shift to Medicaid managed care. Achieving significant cost savings through managed care is most likely in states with relatively high fee-for-service payments, but Illinois is not in that category.
Policy Report February 2015
2
How Medicaid and CHIP Help Children Medicaid was originally designed to provide health care for people with extremely low incomes — recipients of cash assistance through Aid to Families with Dependent Children (AFDC) and Aid to the Aged, Blind, and Disabled (AABD). Over several decades, however, Medicaid was incremental-ly expanded to offer health coverage to a broader set of vulnerable populations. The evolution of Medicaid has been notably important for children. As a result of federal legisla-tion enacted in the 1989 and 1990, Medicaid eligibility was mandated for children under age 6 with family incomes under 133 percent of the federal poverty level and was gradually extended to older children (through age 18) with family incomes up to 100 percent of poverty level. This in-cremental expansion was completed in 2002. The Children’s Health Insurance Program (CHIP), which was established by Congress in 1997 with broad bipartisan support, gave states new options for covering low-income children who were not eligible for Medicaid. As a result of coverage through Medicaid and CHIP, the proportion of chil-dren without health insurance has steadily declined. This progress continued even during the Great Recession, when many families were losing employer-sponsored health insurance coverage. Medicaid has been effective in improving access to primary and preventive care, as well as health outcomes for children. Compared with low-income uninsured children, those with Medicaid are more likely to have a usual source of care, more likely to have well-child visits, and less likely to have unmet health care needs. Research also indicates that expanding health coverage for low-income children has had positive long-term effects, including improved high school graduation, college attendance, and college completion rates, as well as higher earnings in adulthood. One re-cent study estimates that additional tax revenue generated by higher lifetime earnings means that government will recoup more than half of the costs of Medicaid and CHIP expansions for children.2 Federal and State Roles in Medicaid Medicaid is funded partly by the federal government and partly by the states. The federal share of the cost for medical assistance can range from 50 percent to 83 percent, depending on a state’s per capita income relative to the U.S. average. Illinois is one of 14 relatively affluent states with high per capita incomes that receive the minimum federal matching rate of 50 percent. Six states and the District of Columbia have matching rates of 70-75 percent. Each state also receives a 50 per-cent federal match for administrative costs. Medicaid is a federal entitlement program, which means that eligible recipients are entitled to re-ceive covered health care services. This also means that federal matching funds are considered to be mandatory spending and are not subject to the annual appropriations process. Federal funding
2 Leighton Ku and Christine Ferguson, “Medicaid Works: A Review of How Public Insurance Protects the Health and Finances of Children and Other Vulnerable Populations” (First Focus, June 2011); “What Is Medicaid’s Im-pact on Access to Care, Health Outcomes, and Quality of Care?” (Kaiser Family Foundation, August 2013); Sarah Cohodes et al., “The Effect of Child Health Insurance Access on Schooling: Evidence from Public Insurance Ex-pansions” (National Bureau of Economic Research, May 2014); David W. Brown et al., “Medicaid as an Invest-ment in Children: What Is the Long-Term Impact on Tax Receipts?’ (National Bureau of Economic Research, Jan-uary 2015).

3
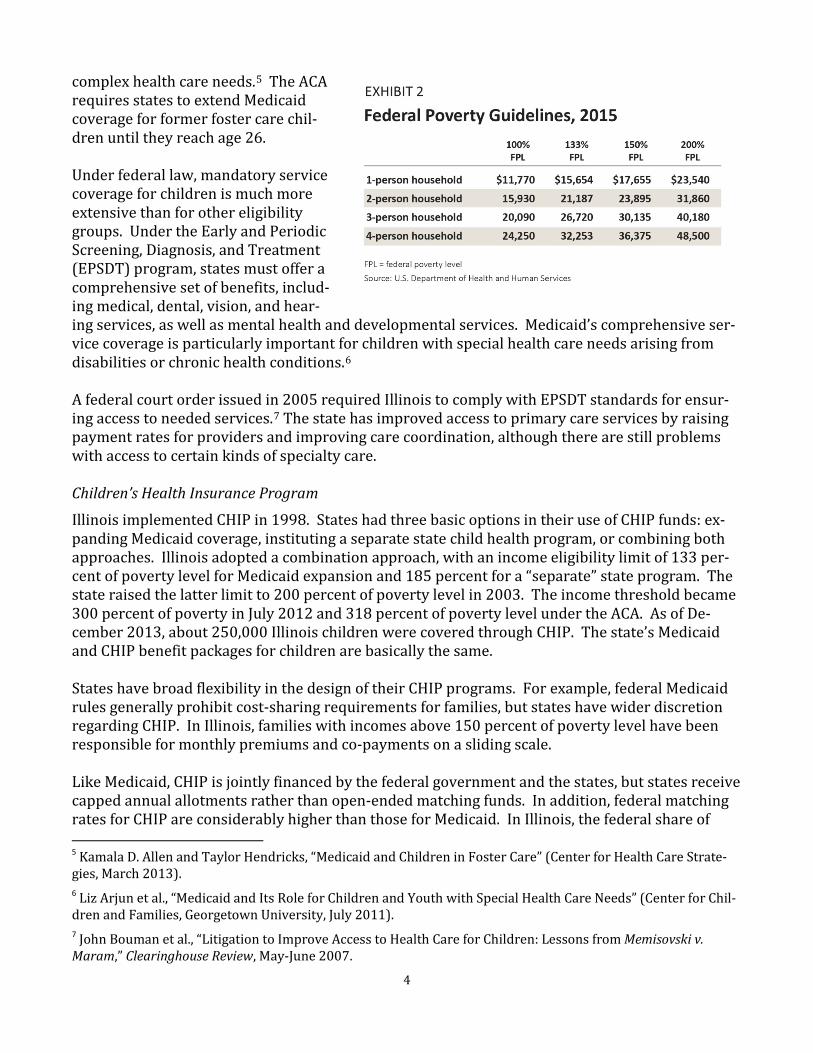
is automatically adjusted to meet increased need. In addition, Congress has sometimes raised fed-eral matching rates in times of economic downturn, when states face both rising Medicaid enroll-ment and declining revenue. During the Great Recession, federal matching rates were temporarily increased to protect state Medicaid programs. For Illinois, the federal share of medical assistance costs rose from 50 percent to more than 60 percent.3 States have considerable flexibility in designing and administering their Medicaid programs with-in the context of federal regulations and guidelines. For example, the federal government has min-imum income eligibility standards for specified eligibility groups, but states have the option of us-ing higher income thresholds. In regard to Medicaid service coverage, some benefits are mandato-ry but others are optional. States have very wide discretion in their policies for payments to ser-vice providers. States can also apply for federal waivers to institute program changes outside the normal statutory and regulatory requirements. Medicaid Coverage for Children in Illinois More than 1.6 million Illinois children have access to health care through the state’s medical assis-tance programs. Most of these chil-dren (about 1.3 million) are covered through Medicaid. In 2013, the Medi-caid income eligibility limit in Illinois was 133 percent of poverty level for children under age 6 and 100 percent of poverty level for older children. The Affordable Care Act (ACA) changed the method for computing countable household income when determining Medicaid eligibility. As a result, the effective income eligibility limit for children is now 147 percent of poverty level (see Exhibits 1 and 2).4 Another mandated coverage group is children receiving federal foster care or adoption assistance. This is an ex-ceptionally vulnerable population, and many of these children have
3 In order to get this fiscal relief, states could not make their eligibility standards or enrollment procedures more restrictive, and they had to assure prompt payments to most Medicaid service providers. 4 The revised method is called Modified Adjusted Gross Income (MAGI), which is based on adjusted gross income on federal income tax returns. MAGI eliminates previous income disregards (i.e., exclusions) and deductions but introduces a new disregard of 5 percent of the federal poverty level. MAGI was designed to standardize the def-inition of income for Medicaid eligibility and the ACA health insurance exchanges.
4
complex health care needs.5 The ACA requires states to extend Medicaid coverage for former foster care chil-dren until they reach age 26. Under federal law, mandatory service coverage for children is much more extensive than for other eligibility groups. Under the Early and Periodic Screening, Diagnosis, and Treatment (EPSDT) program, states must offer a comprehensive set of benefits, includ-ing medical, dental, vision, and hear-ing services, as well as mental health and developmental services. Medicaid’s comprehensive ser-vice coverage is particularly important for children with special health care needs arising from disabilities or chronic health conditions.6 A federal court order issued in 2005 required Illinois to comply with EPSDT standards for ensur-ing access to needed services.7 The state has improved access to primary care services by raising payment rates for providers and improving care coordination, although there are still problems with access to certain kinds of specialty care. Children’s Health Insurance Program
Illinois implemented CHIP in 1998. States had three basic options in their use of CHIP funds: ex-panding Medicaid coverage, instituting a separate state child health program, or combining both approaches. Illinois adopted a combination approach, with an income eligibility limit of 133 per-cent of poverty level for Medicaid expansion and 185 percent for a “separate” state program. The state raised the latter limit to 200 percent of poverty level in 2003. The income threshold became 300 percent of poverty in July 2012 and 318 percent of poverty level under the ACA. As of De-cember 2013, about 250,000 Illinois children were covered through CHIP. The state’s Medicaid and CHIP benefit packages for children are basically the same. States have broad flexibility in the design of their CHIP programs. For example, federal Medicaid rules generally prohibit cost-sharing requirements for families, but states have wider discretion regarding CHIP. In Illinois, families with incomes above 150 percent of poverty level have been responsible for monthly premiums and co-payments on a sliding scale. Like Medicaid, CHIP is jointly financed by the federal government and the states, but states receive capped annual allotments rather than open-ended matching funds. In addition, federal matching rates for CHIP are considerably higher than those for Medicaid. In Illinois, the federal share of 5 Kamala D. Allen and Taylor Hendricks, “Medicaid and Children in Foster Care” (Center for Health Care Strate-gies, March 2013). 6 Liz Arjun et al., “Medicaid and Its Role for Children and Youth with Special Health Care Needs” (Center for Chil-dren and Families, Georgetown University, July 2011). 7 John Bouman et al., “Litigation to Improve Access to Health Care for Children: Lessons from Memisovski v. Maram,” Clearinghouse Review, May-June 2007.
5
funding is currently 65 percent. As a result of the ACA, Illinois will get an enhanced CHIP matching rate of 88.6 percent for a four-year period beginning in October 2015. All Kids Expansion
All Kids expansion, instituted in July 2006, covers children who are not eligible for either Medicaid or CHIP and is funded entirely with state revenue. In most instances, children who enroll must have been uninsured for at least 12 months. All Kids expansion has the same cost-sharing re-quirements as CHIP. The program initially offered coverage to uninsured children regardless of family income level, but in July 2011, the state instituted an eligibility limit of 300 percent of pov-erty level. As of June 2013, about 60,000 children were enrolled in All Kids expansion. The Impact of CHIP and All Kids on Medicaid
The state’s outreach efforts and streamlined application procedures for CHIP and All Kids have had important spillover effects by facilitating enrollment of eligible children in Medicaid. In 2000, Illinois instituted 12-month continuous eligibility for both Medicaid and CHIP children. In 2004, the state instituted presumptive eligibility for children, which provides temporary coverage while their applications are being processed. More broadly, from the perspective of applicants, Medi-caid, CHIP, and All Kids expansion operate as a seamless system under the “All Kids” name. For five consecutive years from 2009 to 2013, Illinois received federal performance bonuses for suc-cessful enrollment and retention of eligible children in Medicaid and CHIP. In 2013, only 4 percent of Illinois children lacked health insurance — one of the lowest uninsured rates among the 50 states. Health Coverage for Other Populations Pregnant Women
Since 1989, federal law has mandated Medicaid eligibility for pregnant women with incomes up to 133 percent of poverty level. Research has shown that expansions of Medicaid coverage for preg-nant women are related to improved birth outcomes, including lower infant mortality rates and fewer low birth-weight babies.8 Illinois has adopted an income eligibility limit of 200 percent of poverty level, as well as presump-tive eligibility for pregnant women. (As a result of ACA, the income limit is now 209 percent of poverty level.) Medicaid covers prenatal care and neonatal intensive care for women and their babies. Infants born to women with Medicaid coverage at the time of delivery are automatically eligible for Medicaid for 12 months. Parents
Parental health can affect child well-being in various ways, and health insurance coverage for par-ents benefits the entire family, especially low-income families. In 2002, Illinois initiated the
8 Janet Currie and Jonathan Gruber, “Saving Babies: The Efficacy and Cost of Recent Changes in the Medicaid Eli-gibility of Pregnant Women,” Journal of Political Economy, December 1996; Phillip B. Levine and Diane Whitmore Schanzenbach, “The Impact of Children’s Public Health Insurance Expansions on Educational Outcomes” (Na-tional Bureau of Economic Research, January 2009).
6
“FamilyCare” program to cover parents and other caretaker relatives of Medicaid and CHIP chil-dren. A waiver allowed the state to use unspent federal CHIP funds for this eligibility expansion. Before FamilyCare, most parents covered by Medicaid in Illinois had extremely low incomes — at or below 37 percent of poverty level. The income eligibility limit for FamilyCare was initially set at 49 percent of poverty level and was gradually raised to 185 percent of poverty level in 2006. When CHIP was reauthorized in 2009, states were no longer allowed to cover adults through the program. In 2010, Illinois received federal approval to fund FamilyCare through Medicaid. In July 2012, the income eligibility limit was lowered from 185 percent to 133 percent of poverty level (138 percent under ACA). Mandatory service coverage for parents is much less extensive than coverage for children, alt-hough Illinois covers most optional services. For many years, Illinois Medicaid paid for dental ser-vices for low-income parents. Under legislation enacted in spring 2012, adult dental coverage was restricted to emergency extractions. This misguided policy change resulted in shifting costs rather than reducing costs. Many Medicaid recipients were going to hospital emergency rooms for pain medications or antibiotics — without getting treatment for the underlying dental problem. Two years later, the General Assembly restored preventive and restorative dental services for both parents and pregnant women. Elderly and Disabled
Nearly all elderly Medicaid recipients are "dual eligibles" who are also enrolled in Medicare, which covers most of their hospital care and physician services. For these individuals, Medicaid pays for services not covered by Medicare — primarily long-term care. Medicaid also assists low-income elderly and disabled recipients with paying Medicare premiums and cost-sharing expenses. The disabled eligibility group includes individuals with physical impairments, developmental dis-abilities, mental illness, and other health conditions. Only about half of disabled Medicaid enrol-lees in Illinois are dual eligibles. For the other half, Medicaid is the only source of health care cov-erage. These beneficiaries have a high prevalence of cardiovascular disease, central nervous sys-tem diseases, psychiatric disorders, and other chronic conditions. Many of them have multiple chronic physical and behavioral health conditions.9 Through June 2000, the effective income eligibility limit for elderly and disabled Medicaid recipi-ents in Illinois was only 41 percent of poverty level. The state gradually raised the income thresh-old to 100 percent of poverty level in July 2003. This income limit is not affected by ACA. Many elderly and disabled Medicaid recipients qualify for the program on the basis of being “med-ically needy.” This path to Medicaid eligibility is an essential safety net for people with very high health care expenses — for example, long-term care costs that overwhelm their financial re-sources. These individuals become eligible by subtracting medical expenses from their income; that is, they “spend down” to the Medicaid eligibility level.10 9 Richard G. Kronick et al., “The Faces of Medicaid III: Refining the Portrait of People with Multiple Chronic Con-ditions” (Center for Health Care Strategies, October 2009). 10 “The Medicaid Medically Needy Program: Spending and Enrollment Update” (Kaiser Family Foundation, De-cember 2012).

7
Other Low-Income Adults
Under the implementation of ACA, states have the option of expanding Medicaid eligibility to all non-elderly adults with incomes up to 138 percent of poverty level, beginning in 2014. In Illinois, low-income parents were already covered by Medicaid, so the expansion was applied only to adults without dependent children. The federal government will cover the full costs of Medicaid expansion through 2016; the state share will gradually increase to 10 percent in subsequent years. Medicaid Services and Program Costs The Illinois Department of Healthcare and Family Services (HFS) has principal responsibility for the state's medical assistance programs, although the enrollment process is administered by the Department of Human Services. Most medical assistance spending is funded through Medicaid, with the federal government typically covering half of the costs. A small portion is financed through CHIP, which has a federal matching rate of 65 percent. Some medical assistance spending is funded entirely by the state.11 There is also a substantial amount of Medicaid-covered services outside HFS — mostly in the Department of Human Services and the Department on Aging. Children represent more than 60 percent of medical assistance enrollment but only one-fourth of program costs (including HFS and other agencies).12 By contrast, adults with disabilities and the elderly, who are more likely to have complex and costly health care needs, account for about one-sixth of enrollment and but more than half of all program costs. Costs per person are substantially higher for the disabled group than for the elderly (see Exhibits 3 and 4). As noted earlier, about half of disabled Medicaid recipients do not have Medicare as their primary health insurance. For this subgroup, Medicaid is the only source of coverage for physician services, prescription drugs, and hospital services, as well as long-term care. The Role of Federal Funding
Since Medicaid is a federal entitlement program, states cannot establish enrollment caps or wait-ing lists (with some exceptions). Consequently, Medicaid program costs cannot be controlled simply by budget cuts. Program costs are determined by enrollment among different eligibility groups, service utilization, and reimbursement rates for providers. Cost reductions can be achieved only through policy changes related to eligibility, service coverage and utilization, or provider payments. Another important aspect of federal matching funds is that reducing Medicaid spending by a given amount results in budget “savings” of only half that amount. For example, $1 billion in Medicaid cuts would save the state only $500 million, since it would lose $500 million in federal resources. Put differently, in order to save $500 million, service cuts would have to be twice that amount. 11 The largest category of HFS spending from state resources alone has been Institutions for Mental Disease (IMDs), which are long-term care facilities having more than 16 beds and more than half of their patients with severe mental illness. Federal law prohibits Medicaid matching funds for IMD patients between ages 22 and 64. Other examples of state-funded programs include All Kids expansion as well as programs for hemophilia, renal dialysis, and emergency treatment for sexual assault survivors. 12 Medicaid “program costs” (also called “liabilities”) refer to the cost of providing services in a given fiscal year, regardless of when payments are made to service providers. By contrast, Medicaid spending in a given fiscal year may cover program costs that were incurred in a previous year.

8
Home and Community-Based Services
Federal waivers for home and community-based services (HCBS) enable states to offer alternative Medicaid services for individuals who might otherwise require more expensive care in institution-al settings such as nursing homes, facilities for people with developmental disabilities, or hospitals providing long-term care services. These waivers give states more flexibility regarding federal Medicaid regulations. For example, states can set enrollment caps and waiting lists for HCBS waiver programs. Illinois currently has nine HCBS waiver programs, including supportive living facilities for the el-derly or disabled, home services for non-elderly adults with physical disabilities, community-based care for the elderly, and various services for people with developmental disabilities. Under its HCBS waivers for children with developmental disabilities and for medically fragile, technolo-gy-dependent children, the state provides Medicaid coverage without regard to family income.13
13 The latter group consists primarily of children and young adults (under age 21) who have tracheostomies, are ventilator-dependent, or need central intravenous lines.
9
Medicaid Managed Care
The Illinois Medicaid program is in the midst of a transition to “risk-based” or “capitated” man-aged care, a system in which services are provided through managed care organizations that re-ceive fixed monthly payments per recipient. Legislation enacted in 2011 required that more than 50 percent of medical assistance recipients be enrolled in managed care plans by 2015. The state has contracted with a variety of “coordinated care” entities, including health maintenance organi-zations (HMOs), provider networks, and collaborations of providers and community agencies. In the early months of 2015, there is some indication that the shift to managed care in Illinois has disrupted continuity of care for many patients and generated frustration among doctors. Evidence from other states indicates that fast-track implementation of Medicaid managed care can create serious problems. In several states, rapid implementation efforts resulted in confusion among beneficiaries and conflict with both managed care organizations and health care providers.14 As managed care in Illinois expands, the state must maintain strong oversight to ensure appropri-ate access to care for Medicaid recipients. A recent report from the U.S. Department of Health and 14 “Medicaid Users Scramble to Shift to Managed Care” Chicago Tribune, February 9, 2015; Christopher J. Conover and Hester H. Davies, “The Role of TennCare in Health Policy for Low-Income People in Tennessee” (Urban Institute, February 2000); Carol S. Weissert and Malcolm L. Goggin, “Fire, Ready, Aim: The Politics and Implementation of Michigan’s Medicaid Managed Care Program” (Rockefeller Institute of Government, 2000).

10
Human Services revealed significant shortcomings in state standards for access in managed care programs and in efforts to enforce compliance with those standards. A companion study found problems with the availability of primary care providers listed by managed care plans.15 Proponents of managed care often assert that shifting away from a fee-for-service system will generate major reductions in Medicaid program costs. However, a comprehensive review of the research on Medicaid managed care does not support this claim. A recent study indicates that achieving significant cost savings through managed care is most likely in states with relatively high fee-for-service payments. Illinois, however, is not in that category.16 Medicaid Trends in Illinois and Nationwide Some critics often claim that Illinois Medicaid spending is “out of control.” But Illinois is not a high-spending state. Medicaid spending per enrollee in Illinois is well below the U.S. average and last among Midwestern states (see Exhibit 5). Illinois Medicaid spending per enrollee is also be-low the nationwide average for all major eligibility groups.17 These comparisons largely reflect the state’s relatively low reimbursement rates for most service providers. Since 2000, the principal reasons for increased Medicaid spending in the U.S. as a whole have been growth in the numbers of beneficiaries and factors driving overall health care costs. In large part, the increase in Medicaid beneficiaries reflects increased need. Between 2000 and 2012, the pov-erty population grew by 54 percent nationwide. Nonetheless, on a per person basis, nationwide growth in Medicaid spending has been slower than the increases in both overall health spending and private health insurance spending.18 These same factors are reflected in Medicaid trends in Illinois, although the rate of spending growth in the state has been substantially lower than the U.S. average. Between 2000 and 2012, Medicaid spending, adjusted for inflation, increased at an average annual rate of 2.4 percent in Il-linois, compared with 4.1 percent nationwide.19
15 Suzanne Martin, “State Standards for Access to Care in Medicaid Managed Care” (Office of Inspector General, U.S. Department of Health and Human Services, September 2014); Daniel R. Levinson, “Access to Care: Provider Availability in Medicaid Managed Care” (Office of Inspector General, U.S. Department of Health and Human Ser-vices, December 2014). 16 Michael Sparer, “Medicaid Managed Care: Costs, Access, and Quality of Care” (Robert Wood Johnson Founda-tion, September 2012); Mark Duggan and Tamara Hayford, “Has the Shift to Managed Care Reduced Medicaid Expenditures? Evidence from State and Local-Level Mandates,” Journal of Policy Analysis and Management, Summer 2013. 17 Katherine Young et al., "Medicaid Per Enrollee Spending: Variation Across States" (Kaiser Family Foundation, January 2015). 18 U.S. Census Bureau, Small Area Income and Poverty Estimates; John Holahan et al., “Medicaid Spending Growth over the Last Decade and the Great Recession, 2000-2009” (Kaiser Family Foundation, February 2011); Kathe-rine Young et al., “Medicaid Spending Growth in the Great Recession and Its Aftermath, 2007-2012 (Kaiser Fami-ly Foundation, July 2014). 19 “State Health Care Spending on Medicaid” (Pew Charitable Trusts and John D. and Catherine T. MacArthur Foundation, July 2014).

11
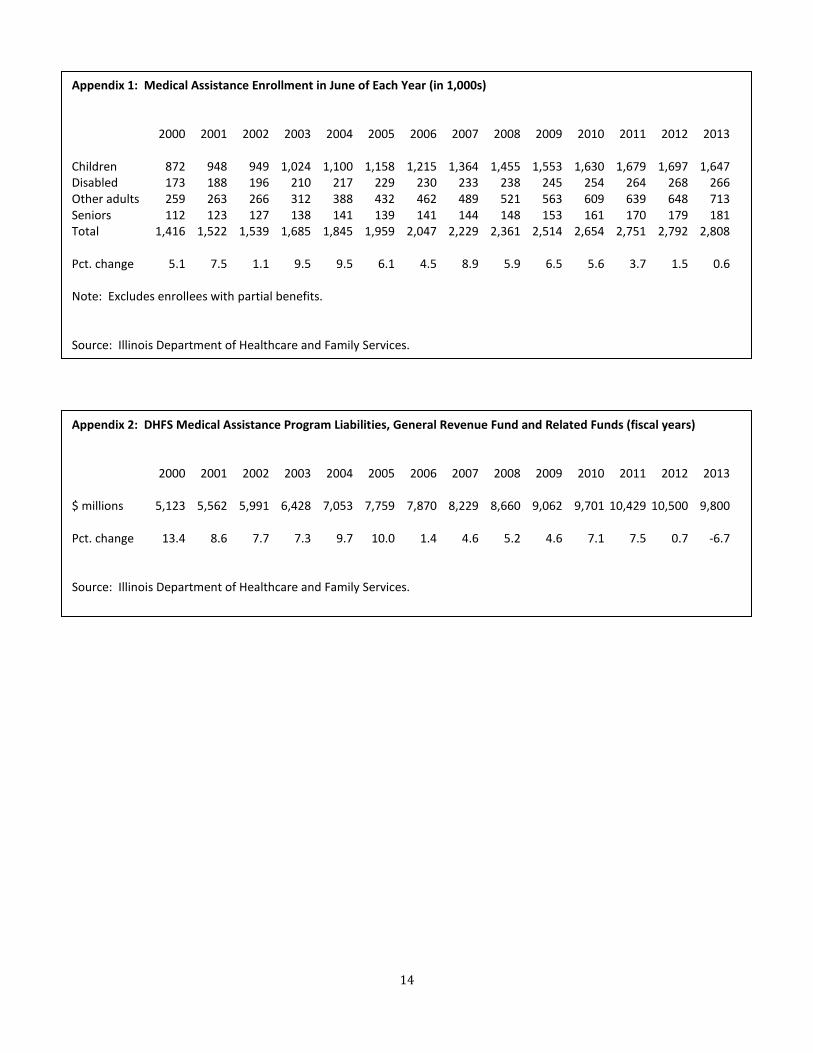
In Illinois, total medical assistance enrollment grew at an average annual rate of 6.5 percent from FY 1999 to FY 2005, while HFS program costs increased at a rate of 9.5 percent (see Appendix 1 and Appendix 2). Enrollment increased significantly for all major eligibility groups, reflecting the implementation of CHIP, the enactment of FamilyCare, and the eligibility expansion for the elderly and disabled. Another factor affecting enrollment growth was the 2001-2002 recession. Between FY 2005 and FY 2011, program costs increased at an average rate of 5.1 percent, which was much lower than the growth rate in the earlier period, as well as lower than the enrollment growth rate of 5.8 percent. Enrollment growth in this more recent period differed across eligibil-ity groups. Among children and parents, enrollment continued to increase substantially, largely due to the effects of the Great Recession. By contrast, enrollment among the disabled and elderly stabilized somewhat. In FY 2012 and FY 2013, medical assistance enrollment was essentially flat. Program costs in-creased slightly in 2012 and declined in 2013. The data for 2013 partly reflect the impact of Medi-caid legislation enacted in 2012, which included numerous policy changes designed to reduce or stabilize program costs. Some of the most significant changes included reducing payment rates for service providers, lowering the income eligibility limit for FamilyCare, eliminating non-emergency

12
dental services for adults (later restored), and restricting outpatient prescription drug coverage to four medications per month (unless there is prior authorization from HFS).20 Preliminary estimates for FY 2014 indicate increases of about 6 percent for medical assistance en-rollment and 10 percent for HFS program costs. Most of this growth, however, can be attributed to ACA Medicaid expansion, for which the federal government is covering the full cost. The Future of Medicaid and CHIP The future of Illinois Medicaid in the near term will be shaped key policy choices at both the fed-eral and state levels. First, some members of Congress will continue their efforts to convert feder-al funding into block grants to the states or by establishing “per capita” caps on federal funding. Under either approach, federal funding would no longer be responsive to program needs at the state level. Block grants would essentially shift costs to states, program beneficiaries, and service providers. States would likely narrow eligibility, reduce service coverage, or cap enrollment. Medicaid block grants could be very harmful for low-income children, undermining the federal en-titlement to coverage, access to the EPSDT benefit package, and progress in reducing the number of children without health insurance.21 A more immediate issue for children is that Congress must renew funding for CHIP. The ACA re-quires that states maintain Medicaid and CHIP eligibility standards for children until October 1, 2019, but authorization for federal CHIP funding expires this year. If federal CHIP funds were eliminated, some children in Illinois would instead be covered by Medicaid. The state, however, would lose a substantial amount of revenue because the federal match would be the regular Medi-caid rate of 50 percent, compared with the enhanced CHIP matching rate of 88 percent, which is scheduled for 2016-2019. Among children who would lose CHIP coverage, some would not be eligible for federal subsidies through the health exchanges because of a drafting error in the ACA. Other children might be eli-gible for subsidies but would likely receive less extensive benefits and face higher premiums and other out-of-pocket costs. There would be considerable financial exposure for families who have children with special health care needs.22 At the state level, Illinois has had chronic problems of underfunding Medicaid, resulting in de-ferred liabilities and long delays in payments to health care providers. Deferred liabilities exceed-ed $2.4 billion at the end of FY 2012 but were nearly eliminated in FY 2014. This fiscal progress has been halted by the General Assembly’s failure to maintain income tax revenue before the be-ginning of the current calendar year. For Medicaid, the growing budget gap will mean the resump-tion in long delays in payments to service providers and/or policy changes that would reduce or eliminate access to care for vulnerable populations across the state. 20 The legislation was called the SMART Act (Save Medicaid Access and Resources Together). 21 “Implications of a Federal Block Grant for Medicaid” (Kaiser Family Foundation, April 2011); Edwin Park, “Medicaid Per Capita Cap Would Shift Costs to States and Undermine Key Part of Health Reform” (Center on Budget and Policy Priorities, May 2013); Peter Harbage and Sarah Arnquist, “Block Grants Are Bad for Kids” (First Focus, September 2011). 22 “The Children’s Health Insurance Program: Why CHIP Is Still Critical for Kids” (First Focus, October 2014).
13
Illinois is facing some critical policy choices. Cutting Medicaid in an attempt to address the state’s budget shortfall could jeopardize access to health care for low-income children, their families, and other vulnerable populations such as the elderly and disabled. Medicaid spending and overall health care costs are nationwide issues, but Medicaid is not the cause of the current budget crisis in Illinois. A responsible solution to our state’s very real budget problems must include securing the resources needed to sustain progress in expanding access to health care.
14
Appendix 1: Medical Assistance Enrollment in June of Each Year (in 1,000s) 2000 2001 2002 2003 2004 2005 2006 2007 2008 2009 2010 2011 2012 2013 Children 872 948 949 1,024 1,100 1,158 1,215 1,364 1,455 1,553 1,630 1,679 1,697 1,647 Disabled 173 188 196 210 217 229 230 233 238 245 254 264 268 266 Other adults 259 263 266 312 388 432 462 489 521 563 609 639 648 713 Seniors 112 123 127 138 141 139 141 144 148 153 161 170 179 181 Total 1,416 1,522 1,539 1,685 1,845 1,959 2,047 2,229 2,361 2,514 2,654 2,751 2,792 2,808 Pct. change 5.1 7.5 1.1 9.5 9.5 6.1 4.5 8.9 5.9 6.5 5.6 3.7 1.5 0.6 Note: Excludes enrollees with partial benefits. Source: Illinois Department of Healthcare and Family Services.
Appendix 2: DHFS Medical Assistance Program Liabilities, General Revenue Fund and Related Funds (fiscal years) 2000 2001 2002 2003 2004 2005 2006 2007 2008 2009 2010 2011 2012 2013 $ millions 5,123 5,562 5,991 6,428 7,053 7,759 7,870 8,229 8,660 9,062 9,701 10,429 10,500 9,800 Pct. change 13.4 8.6 7.7 7.3 9.7 10.0 1.4 4.6 5.2 4.6 7.1 7.5 0.7 -6.7 Source: Illinois Department of Healthcare and Family Services.

208 S. LaSalle St., Suite 1490 • Chicago, IL 60604
Phone: 312-456-0600 • Email: [email protected] • Web: www.voices4kids.org
_________________________________________________________
B U I L D I N G B E T T E R L I V E S
ABOUT THE FISCAL POLICY CENTER
The Fiscal Policy Center at Voices for Illinois Children provides timely, credible, and accessible information and analysis on fiscal issues that affect children, families, and communities in Illinois. The FPC is a member of the State Priorities Partnership, a network of nonprofit organizations in more than 40 states. The Partnership is coordinated by the Center on Budget and Policy Priorities, a Washington, D.C.-based research organization and strategic policy institute that works on a range of federal and state issues.
The Fiscal Policy Center is funded by the Annie E. Casey Foundation, the Center on Budget and Policy Priorities, the Chicago Community Trust, and the Ford Foundation. We thank our funders for their support but acknowledge that the findings and conclusions presented in this report do not necessarily reflect the views of these organizations.
For additional information, please contact David Lloyd, Director of the Fiscal Policy Center, at [email protected] or 312-516-5557.