Embed Size (px)
Citation preview
ARTICLE IN PRESS
Contents lists available at ScienceDirect
Journal of the Mechanics and Physics of Solids
Journal of the Mechanics and Physics of Solids 57 (2009) 840–850
0022-50
doi:10.1
� Cor
E-m
journal homepage: www.elsevier.com/locate/jmps
Mechanics of nanocrack: Fracture, dislocation emission,and amorphization
Shan Huang a, Sulin Zhang b, Ted Belytschko c, Sachin S. Terdalkar d, Ting Zhu a,�
a Woodruff School of Mechanical Engineering, Georgia Institute and Technology, Atlanta, GA 30332, USAb Department of Engineering Science and Mechanics, The Pennsylvania State University, University Park, PA 16802, USAc Department of Mechanical Engineering, Northwestern University, Evanston, IL 60201, USAd Department of Mechanical Engineering, University of Arkansas, Fayetteville, AR 72701, USA
a r t i c l e i n f o
Article history:
Received 23 September 2008
Received in revised form
15 December 2008
Accepted 16 January 2009
Keywords:
Nanocrack
Fracture
Lattice trapping
Brittle-to-ductile transition
96/$ - see front matter & 2009 Elsevier Ltd. A
016/j.jmps.2009.01.006
responding author.
ail address: [email protected] (T. Zhu).
a b s t r a c t
Understanding the nanoscale fracture mechanisms is critical for tailoring the
mechanical properties of materials at small length scales. We perform an atomistic
study to characterize the formation and extension of nano-sized cracks. By using
atomistic reaction pathway calculations, we determine the energetics governing the
brittle and ductile responses of an atomically sharp crack in silicon, involving the
competing processes of cleavage bond breaking, dislocation emission, and amorphiza-
tion by the formation of five- and seven-membered rings. We show that the nanoscale
fracture process depends sensitively on the system size and loading method. Our results
offer new perspectives on the brittle-to-ductile transition of fracture at the nanoscale.
& 2009 Elsevier Ltd. All rights reserved.
1. Introduction
Nanoscale fracture experiments and simulations demonstrate the potential to probe and exploit the ultimate strength ofmaterials (Belytschko et al., 2002; Han et al., 2007; Khare et al., 2007; Lee et al., 2008; Peng et al., 2008; Pugno and Ruoff,2004; Yu et al., 2000; Zhang et al., 2005). These studies also point to the need for an understanding of the mechanismsgoverning the formation and extension of nanometer-sized cracks in a broad range of fields and applications (Celarie et al.,2003; Gao et al., 2003; Guin and Wiederhorn, 2004; Mielke et al., 2007; Ritchie et al., 2004). Here we present an atomisticstudy of nanoscale fracture mechanisms under ultra-high stresses, being close to but below the ideal tensile strength, i.e.,the athermal limit of instantaneous fracture. Such high stresses can easily arise in materials with nanometer-sized cracks.While the nanocrack response in this sub-critical load range controls the fracture behavior of small-volume materials, onlyfew theoretical studies have emerged in recent years (e.g., Bernstein and Hess, 2003; Perez and Gumbsch, 2000a, b; Zhanget al., 2007). This is largely because from an atomistic-modeling standpoint, the fracture under a sub-critical load is hardlyaccessible by direct molecular dynamics (MD) simulations due to the time-scale constraint (Voter et al., 2002). Toovercome the time-scale limitation of MD, we adopt the nudged elastic band (NEB) method (Jonsson et al., 1998) to modelthe sub-critical fracture in terms of the energetics of nanocrack formation and extension.
The quantification of atomic-level energetics clearly reveals an essential feature of fracture in crystals: the latticediscreteness causes the atomic-scale corrugation of the energy landscape, giving rise to the lattice-trapping effect(Thomson et al., 1971). Specifically, under an applied load, a crack can be locally ‘‘trapped’’ in a series of metastable stateswith different crack lengths and crack-tip atomic structures. The time-dependent kinetic crack extension then corresponds
ll rights reserved.

ARTICLE IN PRESS
S. Huang et al. / J. Mech. Phys. Solids 57 (2009) 840–850 841
to the transition of the system from one state to the other via thermal activation (Rice, 1978). This lattice-trapping effect isexpected to play an increasingly important role in fracture with reduced system size, though its significance varies fordifferent crystals, depending on the bonding characteristics such as the interaction range and shape of the interatomic forcelaw (Curtin, 1990; Sinclair, 1975; Zhang et al., 2007). From the atomistic-modeling perspective, the existence of lattice-trapped states enables us to capture and examine in detail various brittle and ductile responses, including the competingprocesses of cleavage fracture, dislocation emission, and amorphization (Bernstein and Hess, 2003; Warner et al., 2007;Zhu et al., 2004, 2006).
In this paper, we examine the thermodynamic driving forces and activation barriers associated with growth of a crack,dislocation emission, and amorphization at a crack tip subjected to either stress or strain loading. We show that for aStillinger–Weber (SW) potential of silicon (Stillinger and Weber, 1985), amorphization is most favored boththermodynamically and kinetically. Based on this result, amorphization is expected to be the dominant crack-tip response.This prediction is consistent with direct MD simulations (Bernstein and Hess, 2003; Buehler et al., 2007), but is valid for amuch wider range of stresses, temperatures, and loading rates. We further investigate the energy landscape beyond theinitial formation of dislocations and five/seven-membered rings. Our results exhibit energy barriers that govern thesubsequent defect migration and nucleation. The competition of these defect processes dictates stress relaxation at a cracktip, and controls fundamentally the brittle-to-ductile transition of fracture.
2. Nanocrack formation and size effect
Consider a central crack in an otherwise perfect crystal of silicon under a uniform far-field load. We use the standardsupercell setup with periodic boundary conditions (Parrinello and Rahman, 1981). The silicon atoms form a diamond-cubiccrystalline network, characterized by localized and directional covalent bonds that generally enhance the lattice-trappingeffect (Sinclair, 1975). Consider the silicon under a high stress of 10 GPa, about 1/4 of the ideal tensile strength in the/111S direction, 38 GPa, as predicted by the SW potential (Zhu et al., 2006). We determine the atomic geometry andenergetics of formation and extension of a nano-sized crack. Here we focus on quasi-2D fracture and ignore the 3Dmechanism of crack advancement by double-kink formation and migration along the crack front (Marder, 1998; Sinclair,1975; Zhu et al., 2004).
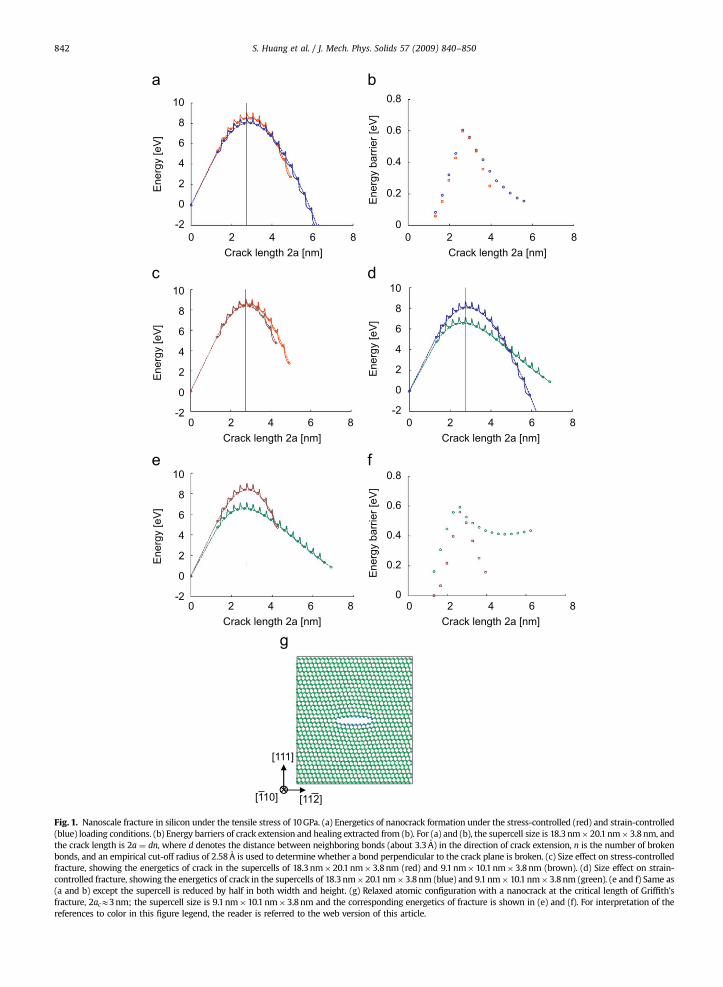
Fig. 1(a) shows the system energy per unit cell along the crack front as a function of crack length under both the stress-controlled (red) and strain-controlled (blue) loading conditions. In this calculation, the supercell is 18.3 nm wide, 20.1 nmhigh, and 3.8 nm thick, with a total of 1680 atoms. In Fig. 1(a), circles represent the local energy minima at different cracklengths, i.e., different numbers of broken bonds. These metastable states arise because of the lattice-trapping effect. Theyare numerically obtained by using the constrained energy minimization method, as detailed in Appendix A2. Theattainment of these states enables us to quantitatively evaluate the applicability of the Griffith theory to nanoscale fracture.According to this theory (Lawn, 1993), fracture occurs at a critical crack length when the system energy maximizes. Fromthe envelop curve connecting circles (dashed line), we determine the Griffith crack lengths for stress-controlled and strain-controlled fractures; both are close to 2acE2.8 nm. On the other hand, the critical crack length can be predicted based onthe Griffith formula. Namely, the critical energy release rate Gc and the stress intensity factor Kc satisfy the condition ofGc ¼ K2
c =E0 ¼ ðsffiffiffiffiffiffiffiffipacp
Þ2=E0 ¼ 2gs; using the surface energy (gs ¼ 1.45 J/m2) and effective Young’s modulus in the /111S
direction (E0 ¼ 148.6 GPa) given by the SW potential (Zhu et al., 2006), one predicts 2ac ¼ 2.74 nm, as indicated by thevertical line in Fig. 1(a). The agreement between the two methods of predicting the critical crack length, with a differenceless than one atomic spacing of 0.33 nm, suggests that the Griffith formula is applicable to nanoscale fracture. Note that theabove estimate of the stress intensity factor, K ¼ s
ffiffiffiffiffiffipap
, ignores the finite-size effect of the system. We have validated thisapproximation, as shown later in the study of the image-crack effect.
In Fig. 1 (a), each curve connecting two adjacent circles measures the energy variation along the minimum energy path(MEP) (Jonsson et al., 1998) for breaking or healing one crack-tip bond, i.e., crack extension or receding by one bonddistance. These MEP curves are calculated from the nudged elastic band method, as detailed in Appendix A. Each MEPinvolves a forward and a backward transition. We extract the energy barriers along the thermodynamically favorabledirections of transition. So the activation energies shown in Fig. 1(b) are the barriers of crack extension when a4ac, and thebarriers of crack healing when aoac.
Fig. 1 also reveals the size effect on nanoscale fracture. In Fig. 1(c), we compare the energies governing the stress-controlled fracture in two supercells, 18.3 nm�20.1 nm (red curve) and 9.1 nm�10 nm (brown curve). Fig. 1(d) shows theenergetics of strain-controlled fracture in two supercells, 18.3 nm�20.1 nm (blue curve) versus 9.1 nm�10 nm (greencurve). Comparing Figs. 1(c) and (d), one sees a significant size effect on strain-controlled fracture, whereas stress-controlled fracture is not sensitive to the system size.
To further reveal the effects of loading method and system size, we regroup the curves in Figs. 1(c) and (d), and show inFig. 1(e) the energies of stress-controlled (brown) and strain-controlled (green) fracture in the size-reduced system(9.1 nm�10 nm). In contrast to Fig. 1(a), the two loading methods lead to considerably different energy curves. Thisdifference arises because the strain-controlled fracture is more sensitive to the system size. Fig. 1(f) shows the energybarriers of crack extension, extracted from Fig. 1(e). Particularly, when a4ac, the energy barrier for strain-controlledfracture (green circles) first decreases and then increases as the crack further extends. This trend differs qualitatively from
ARTICLE IN PRESS
10
8
6
4
2
-2
0
Ene
rgy
[eV
]
10
8
6
4
2
-2
0
Ene
rgy
[eV
]
10
8
6
4
2
-2
0
Ene
rgy
[eV
]
10
8
6
4
2
-2
0
Ene
rgy
[eV
]
0 2 4 6 8Crack length 2a [nm] Crack length 2a [nm]
0.8
0.6
0.4
0.2
00 2 4 6 8
0 2 4 6 8Crack length 2a [nm] Crack length 2a [nm]
0 2 4 6 8
0 2 4 6 8Crack length 2a [nm] Crack length 2a [nm]
0 2 4 6 8
Ene
rgy
barr
ier [
eV]
0.8
0.6
0.4
0.2
0
Ene
rgy
barr
ier [
eV]
[111]
[110] [112]
Fig. 1. Nanoscale fracture in silicon under the tensile stress of 10 GPa. (a) Energetics of nanocrack formation under the stress-controlled (red) and strain-controlled
(blue) loading conditions. (b) Energy barriers of crack extension and healing extracted from (b). For (a) and (b), the supercell size is 18.3 nm�20.1 nm�3.8 nm, and
the crack length is 2a ¼ dn, where d denotes the distance between neighboring bonds (about 3.3 A) in the direction of crack extension, n is the number of broken
bonds, and an empirical cut-off radius of 2.58 A is used to determine whether a bond perpendicular to the crack plane is broken. (c) Size effect on stress-controlled
fracture, showing the energetics of crack in the supercells of 18.3 nm�20.1 nm�3.8 nm (red) and 9.1 nm�10.1 nm�3.8 nm (brown). (d) Size effect on strain-
controlled fracture, showing the energetics of crack in the supercells of 18.3 nm�20.1 nm�3.8 nm (blue) and 9.1 nm�10.1 nm�3.8 nm (green). (e and f) Same as
(a and b) except the supercell is reduced by half in both width and height. (g) Relaxed atomic configuration with a nanocrack at the critical length of Griffith’s
fracture, 2acE3 nm; the supercell size is 9.1 nm�10.1 nm�3.8 nm and the corresponding energetics of fracture is shown in (e) and (f). For interpretation of the
references to color in this figure legend, the reader is referred to the web version of this article.
S. Huang et al. / J. Mech. Phys. Solids 57 (2009) 840–850842
ARTICLE IN PRESS
S. Huang et al. / J. Mech. Phys. Solids 57 (2009) 840–850 843
the case when the system size is doubled, see Fig. 1(b) (blue circles). This change in energy barriers can be correlated to thethermodynamic driving force of crack extension, i.e., G(a)�2gs (Rice, 1978), which corresponds to the negative of the slopeof the envelope curve in Fig. 1(e). Specifically, during the strain-controlled fracture and when a4ac, our calculations showthat the system stress s decreases when a increases. As the crack extends, the effect of s on reducing G ¼ s2pa/E0 overridesthat of crack length a on increasing G, causing a net decrease in G and hence an increase in the energy barrier. Theimplication of this result is that crack extension can be kinetically delayed for a long crack; namely, the kinetic rate of crackgrowth decreases with the increasing crack length. Our results demonstrate that such kinetic delay can be enhanced byreducing the system size.
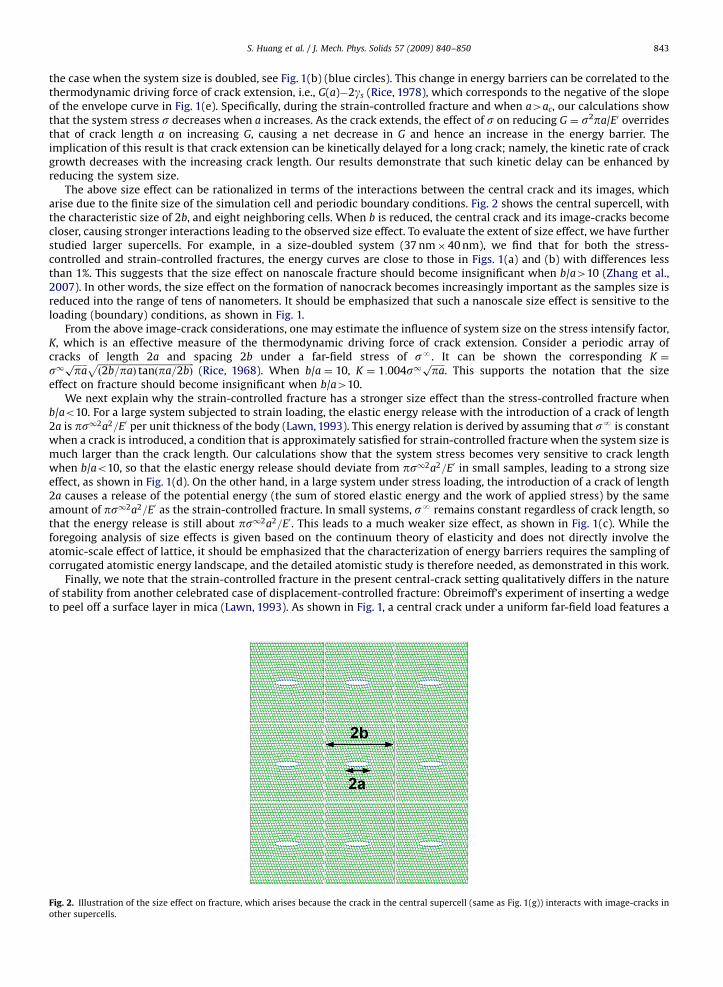
The above size effect can be rationalized in terms of the interactions between the central crack and its images, whicharise due to the finite size of the simulation cell and periodic boundary conditions. Fig. 2 shows the central supercell, withthe characteristic size of 2b, and eight neighboring cells. When b is reduced, the central crack and its image-cracks becomecloser, causing stronger interactions leading to the observed size effect. To evaluate the extent of size effect, we have furtherstudied larger supercells. For example, in a size-doubled system (37 nm�40 nm), we find that for both the stress-controlled and strain-controlled fractures, the energy curves are close to those in Figs. 1(a) and (b) with differences lessthan 1%. This suggests that the size effect on nanoscale fracture should become insignificant when b/a410 (Zhang et al.,2007). In other words, the size effect on the formation of nanocrack becomes increasingly important as the samples size isreduced into the range of tens of nanometers. It should be emphasized that such a nanoscale size effect is sensitive to theloading (boundary) conditions, as shown in Fig. 1.
From the above image-crack considerations, one may estimate the influence of system size on the stress intensify factor,K, which is an effective measure of the thermodynamic driving force of crack extension. Consider a periodic array ofcracks of length 2a and spacing 2b under a far-field stress of sN. It can be shown the corresponding K ¼
s1ffiffiffiffiffiffipap ffiffiffiffiffiffiffiffiffiffiffiffiffiffiffiffiffiffiffiffiffiffiffiffiffiffiffiffiffiffiffiffiffiffiffiffiffiffiffiffiffiffi
ð2b=paÞ tanðpa=2bÞp
(Rice, 1968). When b/a ¼ 10, K ¼ 1:004s1ffiffiffiffiffiffipap
. This supports the notation that the sizeeffect on fracture should become insignificant when b/a410.
We next explain why the strain-controlled fracture has a stronger size effect than the stress-controlled fracture whenb/ao10. For a large system subjected to strain loading, the elastic energy release with the introduction of a crack of length2a is ps12a2=E0 per unit thickness of the body (Lawn, 1993). This energy relation is derived by assuming that sN is constantwhen a crack is introduced, a condition that is approximately satisfied for strain-controlled fracture when the system size ismuch larger than the crack length. Our calculations show that the system stress becomes very sensitive to crack lengthwhen b/ao10, so that the elastic energy release should deviate from ps12a2=E0 in small samples, leading to a strong sizeeffect, as shown in Fig. 1(d). On the other hand, in a large system under stress loading, the introduction of a crack of length2a causes a release of the potential energy (the sum of stored elastic energy and the work of applied stress) by the sameamount of ps12a2=E0 as the strain-controlled fracture. In small systems, sN remains constant regardless of crack length, sothat the energy release is still about ps12a2=E0. This leads to a much weaker size effect, as shown in Fig. 1(c). While theforegoing analysis of size effects is given based on the continuum theory of elasticity and does not directly involve theatomic-scale effect of lattice, it should be emphasized that the characterization of energy barriers requires the sampling ofcorrugated atomistic energy landscape, and the detailed atomistic study is therefore needed, as demonstrated in this work.
Finally, we note that the strain-controlled fracture in the present central-crack setting qualitatively differs in the natureof stability from another celebrated case of displacement-controlled fracture: Obreimoff’s experiment of inserting a wedgeto peel off a surface layer in mica (Lawn, 1993). As shown in Fig. 1, a central crack under a uniform far-field load features a
Fig. 2. Illustration of the size effect on fracture, which arises because the crack in the central supercell (same as Fig. 1(g)) interacts with image-cracks in
other supercells.
ARTICLE IN PRESS
S. Huang et al. / J. Mech. Phys. Solids 57 (2009) 840–850844
concave energy-crack length profile for both the stress-controlled and strain-controlled loadings. Consequently, the cracksystem is unstable since both the extension and healing of a crack from a ¼ ac lower the total energy of the system. Incontrast, the energy-crack length profile that characterizes Obreimoff’s experiment is convex, much like an invert of what isshown in Fig. 1(a), so that the crack system is stable. This difference in crack stability can be qualitatively understood asfollows: for the central-crack setting, the loads are applied by either the far-field stress sN or strain eN ¼ sN/E0. As detailedearlier, the introduction of a crack of length 2a in a large system causes a release of elastic energy or potential energy by thesame amount of ps12a2=E0 for the stress-controlled or strain-controlled fractures. In the meantime, the surface energy isincreased by 2ags. As a result, their energy-crack length profiles are both concave, and qualitatively similar even in smallsystems. On the other hand, the peel-off layer in Obreimoff’s experiment can be modeled by one arm of a split strip. Thearm can be treated as a beam of length l and height h cantilevered at the crack tip. Under an end load of imposeddisplacement d, the stored elastic energy is about E0h3d2/4l3 per unit thickness of the beam, which is different from thestored potential energy of �4l3P2/E0h3 under an end load of imposed force P (Freund, 1990). As a result of the different rolesof crack length l in the beam energy, the system energy versus crack length curve changes from the concave to convexshape as the applied load switches from imposed displacement to force, leading to the change of crack stability.
3. Competing mechanisms of fracture, dislocation emission, and amorphization
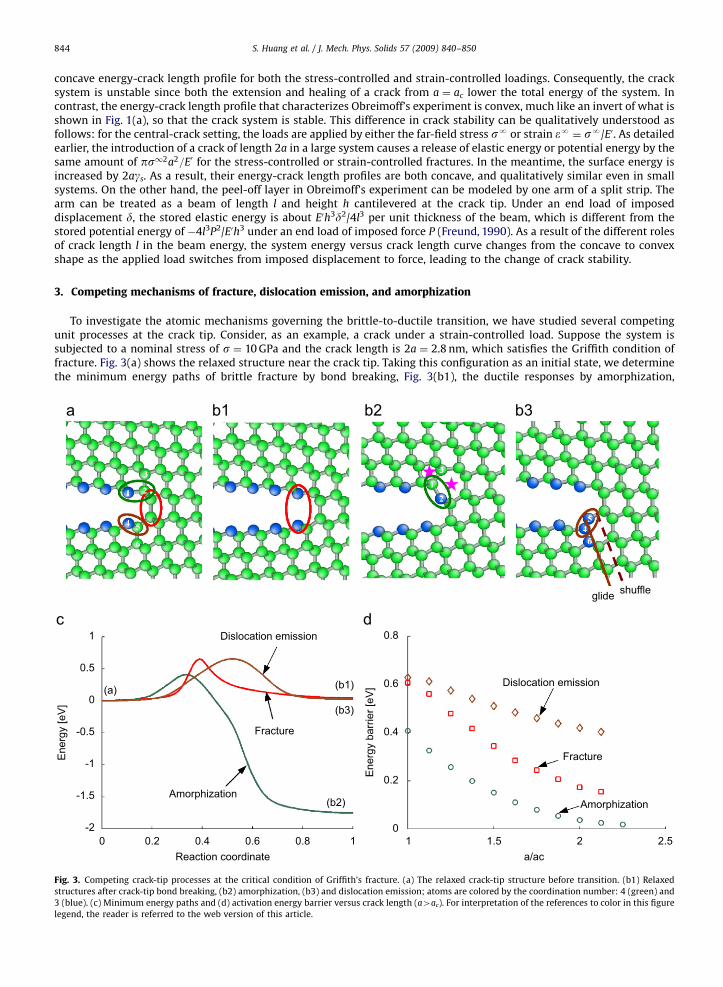
To investigate the atomic mechanisms governing the brittle-to-ductile transition, we have studied several competingunit processes at the crack tip. Consider, as an example, a crack under a strain-controlled load. Suppose the system issubjected to a nominal stress of s ¼ 10 GPa and the crack length is 2a ¼ 2.8 nm, which satisfies the Griffith condition offracture. Fig. 3(a) shows the relaxed structure near the crack tip. Taking this configuration as an initial state, we determinethe minimum energy paths of brittle fracture by bond breaking, Fig. 3(b1), the ductile responses by amorphization,
1
0.5
0
-0.5
-1
-1.5
-20 0.2 0.4 0.6 0.8 1
Reaction coordinate
Amorphization
Fracture
Dislocation emission
(b1)
(b3)
0.8
0.6
0.4
0.2
0
Ene
rgy
barr
ier [
eV] Dislocation emission
Fracture
Amorphization
shuffle
1 1.5 2 2.5a/ac
Ene
rgy
[eV
]
glide
(a)
(b2)
Fig. 3. Competing crack-tip processes at the critical condition of Griffith’s fracture. (a) The relaxed crack-tip structure before transition. (b1) Relaxed
structures after crack-tip bond breaking, (b2) amorphization, (b3) and dislocation emission; atoms are colored by the coordination number: 4 (green) and
3 (blue). (c) Minimum energy paths and (d) activation energy barrier versus crack length (a4ac). For interpretation of the references to color in this figure
legend, the reader is referred to the web version of this article.
ARTICLE IN PRESS
S. Huang et al. / J. Mech. Phys. Solids 57 (2009) 840–850 845
Fig. 3(b2), and dislocation emission, Fig. 3(b3). We obtain these local energy minima (Figs. 3(b1)–(b3)) by using theconstrained energy minimization method, as detailed in Appendix A2. Since brittle fracture has been discussed in detail inSection 2, we below describe the latter two processes.
We next examine the atomic process of crack-tip amorphization. The minimum energy path calculation shows that theinitiation of amorphization proceeds via the rotation of a single silicon bond, as marked by the green oval in Figs. 3(a) and(b2), respectively. This bond rotation results in a pair of five- and seven-membered rings (stars in Fig. 3(b2)), in contrast tothe six- and eight-membered rings in a perfect diamond-cubic structure. Such single bond rotation mechanism initiates thecrack-tip amorphization process, as has been observed in direct MD simulations (Buehler et al., 2007). This mechanism hasan important consequence on the energetics of amorphization to compete against fracture and dislocation emission, as willbe discussed later in this article. Parenthetically, the unit process of bond rotation has been previously hypothesized as afundamental mechanism of amorphization in bulk silicon, and employed to create the continuous random network ofamorphous silicon, the so-called WWW method (Wooten et al., 1985). It is also noteworthy that a similar bond rotationmechanism leads to the formation of a Stone–Wales (SW) defect in the hexagonal lattice of carbon nanotubes and graphenesheets (Dumitrica et al., 2006; Yakobson, 1998; Zhang and Zhu, 2007). The SW defect is a pair of planar rings with five- andseven-members, which is also known as a 5/7 dislocation dipole. The separation of the dipole by dislocation migration is amechanism underlying the plastic deformation of carbon nanotubes and graphene sheets. However, the SW-like defect insilicon is non-planar; it leads to amorphization rather than dislocation nucleation.
For the diamond-cubic silicon, the crack-tip dislocation nucleation on the {111} plane involves two possibilities:dislocation glides on the widely spaced shuffle plane, which cuts through single covalent bonds along the /111S direction,or on the narrowly spaced glide plane, which cuts through the triplets of covalent bonds inclined equally to the {111}plane; Fig. 3(b3) shows the glide and shuffle plane by the solid and dashed line, respectively. As the relative importance ofthe shuffle and glide dislocations in plasticity has not been fully resolved (Bulatov et al., 2001; Sun et al., 1993), we study inthis work the nucleation of a {111}/11 2S glide partial as a representative unit process to compete against fracture andamorphization. By comparing Figs. 3(a) and (b3), one sees the bond shearing process (marked by the brown oval) on the{111} glide plane (the solid line) in the /112S direction. Note that this partial nucleation process involves not onlythe bond shearing between atoms 4 and 5, but also the bond breaking between atoms 5 and 6; the consequent effect on theenergetics of nucleation is discussed next.
Fig. 3(c) shows the minimum energy paths of the three competing processes. Here we take the energy of the relaxedstructure in Fig. 3(a) as a reference of zero energy. It can be seen that the initiation of amorphization is most favored boththermodynamically (with the lowest energy of the final state) and kinetically (with the lowest activation energy barrier).By comparing the structure before transition, Fig. 3 (a), with those after transition, Figs. 3 (b1)–(b3), one can rationalize thethermodynamic preference to amorphization in terms of the number of silicon bonds, which is conserved after bondrotation (switching). In contrast, both fracture and dislocation emission involve bond breaking, as evidenced by theincreased number of under-coordinated (blue) atoms. As a result, the latter two processes are subjected to a larger energypenalty, raising the energy level of the final states.
Fig. 3(d) shows the energy barriers of the three processes at various crack lengths. Generally, the brittle-to-ductiletransition of fracture requires the crossover of barrier curves between the competing crack-tip processes. However, for thismodel of silicon based on the SW potential, it can be seen that amorphization is always the most kinetically favorable modewith the lowest activation energy barrier, until the load is increased to the athermal limit of spontaneous amorphizationgiving a vanishing energy barrier. According to transition state theory (Vineyard, 1957) and assuming that the threeprocesses have approximately the same trial frequency (because each process similarly involves the transformation of asingle bond), amorphization is expected to be the dominant crack-tip response at various stresses, temperatures, andloading rates, as observed in MD simulations using the same potential (Bernstein and Hess, 2003). Here, it should bepointed out that different interatomic potentials of silicon have been compared for predicting the mechanical properties(Balamane et al., 1992; Kang and Cai, 2007; Zhu et al., 2006). Results showed that whereas these empirical potentialsfacilitate the simulations in much larger systems with realistic microstructures compared to the ab initio method, they allhave issues in characterizing the defective states of crystalline and amorphous structures of silicon. The improved fittingformalism and method are needed.
4. Evolving processes of amorphization and dislocation emission
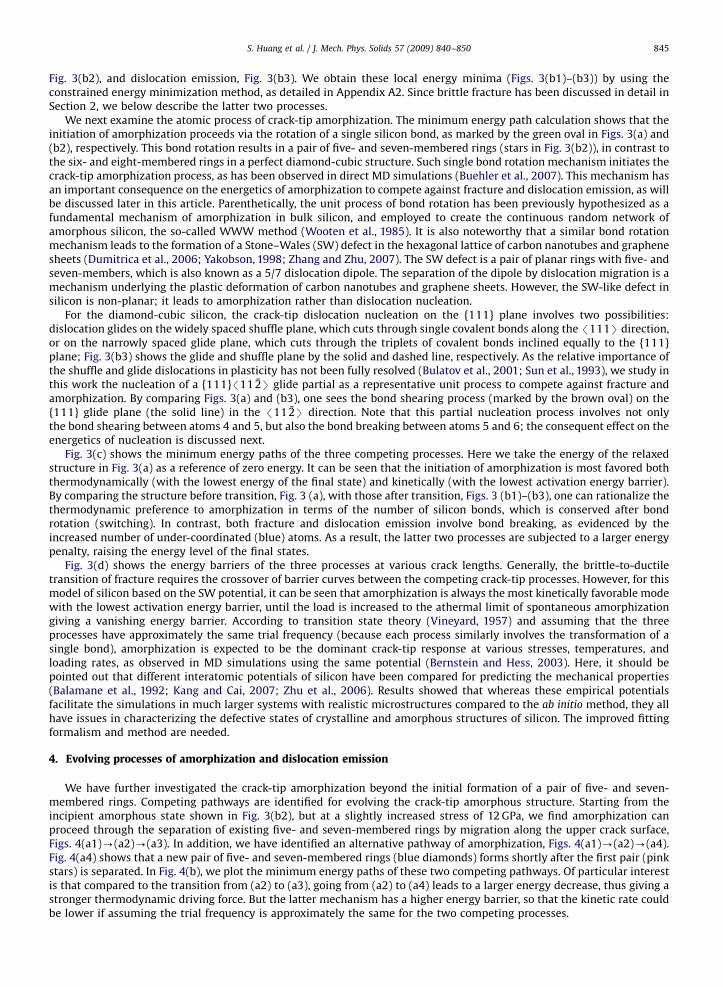
We have further investigated the crack-tip amorphization beyond the initial formation of a pair of five- and seven-membered rings. Competing pathways are identified for evolving the crack-tip amorphous structure. Starting from theincipient amorphous state shown in Fig. 3(b2), but at a slightly increased stress of 12 GPa, we find amorphization canproceed through the separation of existing five- and seven-membered rings by migration along the upper crack surface,Figs. 4(a1)-(a2)-(a3). In addition, we have identified an alternative pathway of amorphization, Figs. 4(a1)-(a2)-(a4).Fig. 4(a4) shows that a new pair of five- and seven-membered rings (blue diamonds) forms shortly after the first pair (pinkstars) is separated. In Fig. 4(b), we plot the minimum energy paths of these two competing pathways. Of particular interestis that compared to the transition from (a2) to (a3), going from (a2) to (a4) leads to a larger energy decrease, thus giving astronger thermodynamic driving force. But the latter mechanism has a higher energy barrier, so that the kinetic rate couldbe lower if assuming the trial frequency is approximately the same for the two competing processes.
ARTICLE IN PRESS
0.5
0
-0.5
-1
-1.5
-20 0.5 1 1.5 2
Reaction coordinate
Ene
rgy
[eV
]
(a1)
(a2)
(a4)
(a3)
Fig. 4. Crack-tip amorphization beyond the first step of formation of a pair of five- and seven-membered rings. Two competing pathways are identified.
(a1)-(a2)-(a3): separation of a pair of five- and seven-membered rings (pink stars). (a1)-(a2)-(a4): formation of a new pair of five- and seven-
membered rings (blue diamonds). (b) Minimum energy paths of the two pathways. For interpretation of the references to color in this figure legend, the
reader is referred to the web version of this article.
10.5
0-0.5
-1-1.5
-2-2.5
0 1 2 3 4Reaction coordinate
(a)
(b)
Ene
rgy
[eV
]
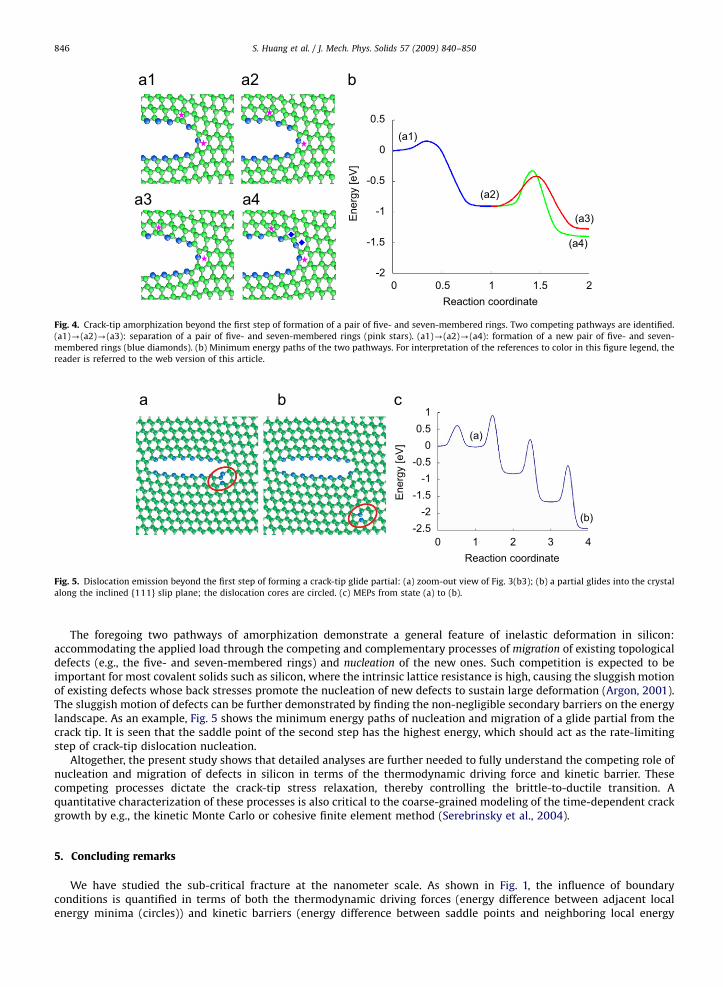
Fig. 5. Dislocation emission beyond the first step of forming a crack-tip glide partial: (a) zoom-out view of Fig. 3(b3); (b) a partial glides into the crystal
along the inclined {111} slip plane; the dislocation cores are circled. (c) MEPs from state (a) to (b).
S. Huang et al. / J. Mech. Phys. Solids 57 (2009) 840–850846
The foregoing two pathways of amorphization demonstrate a general feature of inelastic deformation in silicon:accommodating the applied load through the competing and complementary processes of migration of existing topologicaldefects (e.g., the five- and seven-membered rings) and nucleation of the new ones. Such competition is expected to beimportant for most covalent solids such as silicon, where the intrinsic lattice resistance is high, causing the sluggish motionof existing defects whose back stresses promote the nucleation of new defects to sustain large deformation (Argon, 2001).The sluggish motion of defects can be further demonstrated by finding the non-negligible secondary barriers on the energylandscape. As an example, Fig. 5 shows the minimum energy paths of nucleation and migration of a glide partial from thecrack tip. It is seen that the saddle point of the second step has the highest energy, which should act as the rate-limitingstep of crack-tip dislocation nucleation.
Altogether, the present study shows that detailed analyses are further needed to fully understand the competing role ofnucleation and migration of defects in silicon in terms of the thermodynamic driving force and kinetic barrier. Thesecompeting processes dictate the crack-tip stress relaxation, thereby controlling the brittle-to-ductile transition. Aquantitative characterization of these processes is also critical to the coarse-grained modeling of the time-dependent crackgrowth by e.g., the kinetic Monte Carlo or cohesive finite element method (Serebrinsky et al., 2004).
5. Concluding remarks
We have studied the sub-critical fracture at the nanometer scale. As shown in Fig. 1, the influence of boundaryconditions is quantified in terms of both the thermodynamic driving forces (energy difference between adjacent localenergy minima (circles)) and kinetic barriers (energy difference between saddle points and neighboring local energy

ARTICLE IN PRESS
S. Huang et al. / J. Mech. Phys. Solids 57 (2009) 840–850 847
minima). We find the strain-controlled fracture depends sensitively on the system size, leading to an intriguing scenario ofkinetically delayed fracture with reduced system size. Moreover, the lattice-trapping effect enables us to perform anatomistic analysis of the geometry and energetics of competing crack-tip processes, including cleavage bond breaking,dislocation emission, and amorphization. We demonstrate that amorphization by single bond rotation is the most favorableatomic process until the athermal limit, making the brittle-to-ductile transition less likely. Obviously, in view of theimprecision of force-field models, verification via first principles calculations is needed to ascertain the conclusion.However, our studies also reveal the complexity of the energy landscape that is associated with subsequent growth ofamorphization. To lay the groundwork for first principles calculations, such molecular mechanics studies are insightful.Further, it should be noted that at elevated temperatures, all the three crack extension mechanisms may be active, leadingto a complicated, coupled crack extension process. Nevertheless, the present study represents the first necessary steptowards a mechanistic understanding of the brittle-to-ductile transition of fracture. The atomistic modeling along the linespresented here is now feasible for characterizing the brittle versus ductile responses in different material systems, as wellas the time-dependent kinetic crack growth caused by, for example, the cyclic-loading (Muhlstein et al., 2002) or chemicalattack of foreign molecules (Ogata et al., 2004; Zhu et al., 2005).
Acknowledgements
SH and TZ are supported by the NSF Grants CMMI-0758554 and CMMI-0758265. SZ acknowledges the support underthe NSF Grants CMMI-0826841 and CMMI-0600642. TB acknowledges his support under Army Research Office underGrants W911NF-05-1-0049/P00002 and W911NF-08-1-0212.
Appendix A. Methods
We have employed the nudged elastic band (NEB) method (Jonsson et al., 1998) to determine the energetics of nanoscalefracture under both the strain- and stress-controlled loading conditions. The modeling of strain-controlled fractureinvolves a straightforward application of the standard NEB method. However, care must be taken in the study of stress-controlled fracture. Importantly, under large deformation, the work done by the applied stress could be path-dependent, tobe shown in Section A3.3. Below we first briefly review the notations used in our supercell-based modeling, and thenintroduce the strain-controlled NEB method for fracture modeling. Finally, we derive the formulation for the stress-controlled NEB method.
A1. Supercell-based modeling
As we consider the central-crack setting under a uniform far-field load, it is natural to use the standard supercell setupwith periodic boundary condition (Parrinello and Rahman, 1981). The supercell can have arbitrary shape and size beingcompletely described by three vectors, ai, bi, and ci, that span the edges of the cell. To represent the general deformation, thevectors can have any lengths and mutual orientations. One may arrange the three vectors as [ai, bi, ci] to form a 3�3 matrixhij. The position of an atom within the cell can be written in term of hij and the reduced coordinate si (0psip1)
xi ¼ hijsj (A.1)
The volume of the supercell is det(hij) ¼ nO, where n is the number of atoms in the cell and O is the volume per atom. Atequilibrium, the effective far-field load is equal to the internal Virial stress, as given later.
As commonly done in continuum mechanics, one may take h0ij as a reference state, which does not need to be stressfree. For a homogenous deformation of the supercell from h0ij to hij, the deformation gradient Fij can be calculated by
Fij ¼ hikh�10kj (A.2)
and the volume per atom in the two supercells are related by O ¼ JO0, where J ¼ det(Fij).
A2. Strain-controlled nudged elastic band method
The modeling of strain-controlled fracture involves a direct application of the standard NEB method by adjusting thesystem size to the desired load level. The NEB calculation requires an input of both the initial and final states,corresponding to different local energy minima on the energy landscape. Suppose one takes as an initial state a relaxedstructure with a certain crack length. This structure can be obtained in two steps: first set the atomic positionsapproximately according to the analytic displacement field of a crack in a linear elastic body, and then relax the system byusing the conjugate gradient (CG) energy minimization method with the Broyden–Fletcher–Goldfarb–Shanno (BFGS)optimization algorithm. To study the competing processes of fracture, amorphization and dislocation emission, multipleend-states need to be identified. This can be achieved by a procedure of constrained energy minimization. Specifically, it isimportant to note that because of the short-ranged, directional bonding between silicon atoms, these competing processes

ARTICLE IN PRESS
S. Huang et al. / J. Mech. Phys. Solids 57 (2009) 840–850848
generally involve the localized transformation of one atomic bond. As such, one can focus on the highly stressed atomicbonds near the crack tip, as indicated by ovals in Fig. 3(a). We have studied various transformation modes, involving bondbreaking, bond rotation, and bond shearing. In the paper, we present three representative modes with relatively low energybarriers, leading to cleavage fracture, amorphization, and dislocation emission. To obtain the relaxed end-state for eachbond transformation mode by using the CG energy minimization, one needs to put the initial state within the basin of theend-state. This can be achieved by the energy minimization with local constraints. Consider bond breaking as an example.One can first increase the separation of the targeted bond, d, by about one half of an atomic spacing, and then relax thesystem using the CG minimization while fixing d. After relaxation, one needs to remove the constraint on d, and relax thesystem again to obtain the desired end-state. One exception is of particular note: below a certain length, the crackspontaneously closes upon relaxation, indicating that the metastable state of cracking vanishes on the energy landscape.This arises because the small crack opening is below the interaction range of silicon atoms, causing self-healing withvanishing energy barriers.
Incidentally, the above procedure of constrained energy minimization has also been applied to obtain the end-states inthe NEB calculations of dislocation loop emission in metals such as Cu (Zhu et al., 2007, 2008). Because of the delocalizednature of metallic bonds, the constraints need to be imposed locally on a group of atoms across the slip plane. Finally, wenote that to identify unknown end-states in a more predictive way, one can use, for example, the dimer method(Henkelman and Jonsson, 1999) or metadynamics (Laio and Parrinello, 2002).
After the initial and final states are identified, a discrete elastic band consisting of a finite number of replicas (or images)of the system is constructed by linear interpolation to connect the two end-states. Then a spring interaction betweenadjacent replicas is added to ensure continuity of the path, thus mimicking an elastic band. An optimization of the band,involving the minimization of the forces acting on the replicas, brings the band to the minimum energy path. The MEP isdefined as a continuous path in a 3N-dimensional configuration space (N is the number of free atoms), with the propertythat at any point along the path the atomic forces are zero in the 3N�1 dimensional hyper-plane perpendicular to the path.The energy maximum along the MEP is the saddle-point energy, which gives the activation energy barrier. The calculationis considered to be converged when the potential force on each replica vertical to the path is less than 0.002 eV/A. Wedefine the reaction coordinate as the normalized hyperspace arc length along the MEP. Empirically, the silicon bond lengthundergoing rupture can be taken as an approximate reaction coordinate.
A3. Stress-controlled nudged elastic band method
The stress-controlled NEB method involves a search of MEP in the space of {hij, sj}. To remove the rigid body rotation, oneonly needs to consider the components in the upper triangle of the [hij] matrix. As a result, there is a total of 3N+6 degreesof freedom. Compared to the strain-controlled NEB, one needs to supplement the forces that are work-conjugate to hij andsj, respectively, as well as the stress work. Parenthetically, the stress-controlled NEB method developed by Caspersen andCarter (2005) only deals with applied hydrostatic pressure. Our development is general and applicable for any prescribedstress component, with an appropriate treatment of stress work.
A3.1. Forces work-conjugate to hij
Consider a small and homogenous deformation of the supercell by dhij. The position of an atom at xi will change by
dxi ¼ dhinsn ¼ dhinh�1nmxm (A.3)
and its gradient is
dxi;j ¼ dhinh�1nmxm;j ¼ dhinh�1
nj (A.4)
Assuming all the atoms are uniformly displaced, the incremental work associated with this small change dhij is
dW ¼ Vsijdxi;j ¼ Vsijh�1nj dhin ¼ V0Sijh
�10njdhin (A.5)
where the Cauchy stress sij is related to the first Piola–Kirchhoff (PK1) stress Sij by
sij ¼ SimFjm=J ¼ Simhjkh�10km=J (A.6)
Suppose the supercell is subjected to an applied PK1 stress Saik. Here, the use of the PK1 stress simplifies the stress-work
calculation as shown in Section A3.3. Correspondingly, the forces work-conjugate to hij are
f hij ¼ Vpikh�1
jk � V0Saikh�1
0jk (A.7)
where pij is the internal Virial (Cauchy) stress
pij ¼1
O
Xf irj (A.8)
where f i and rj denote the interatomic force and distance, respectively, and the summation includes all the atoms in thesupercell.
ARTICLE IN PRESS
S. Huang et al. / J. Mech. Phys. Solids 57 (2009) 840–850 849
A3.2. Forces work-conjugate to si
Consider a small change of the internal coordinate si while holding the supercell fixed. The corresponding change in xi is
dxi ¼ hindsn (A.9)
The incremental work is
dW ¼ f idxi ¼ f ihijdsj (A.10)
so that the forces that are work-conjugate to si is
f si ¼ f jhji (A.11)
A3.3. The stress work
When a system is under the stress control, the total energy should include the work done by the applied stress when thesystem is deformed from the reference to current state. It should be emphasized that the stress work could be path-dependent. To illustrate this dependence, let us consider a simple example of uniaxial tension. Given an arbitrarily chosenreference state, the length of the bar is L0 and the cross-section area is A0. The work due to an applied force P in stretchingthe bar from L0 to L1 is
W ¼
Z L1
L0
PdL (A.12)
If the first Piola–Kirchhoff stress Sij is fixed in the course of elongation, the stress work is
W ¼
Z L1
L0
S11A0dL ¼ S11A0ðL1 � L0Þ ¼ PðL1 � L0Þ (A.13)
Here we assume that the bar is aligned in the x1 direction. In contrast, if the Cauchy stress sij is fixed during elongation,the stress work is
W ¼
Z L1
L0
s11AdL (A.14)
One should notice that the area of the cross-section A generally changes with elongation, so that the stress work dependson the specific relation between A and the length of the bar L. In other words, the stress work under the fixed Cauchy stressis path-dependent because the relation between A and L is a priori unknown, so that the numerical integration of Eq. (A.14)is necessary. To appreciate this path-dependence, let us consider two examples. Assuming the bar has a constant volume,the corresponding stress work is
W ¼ sA0L0 lnðL1=L0Þ (A.15)
As a second example, assuming the linear variation of both A and L, namely, A ¼ (A1�A0)l+A0 and L ¼ (L1�L0)l+L0, where0plp1, the stress work is
W ¼ sA0 þ A1
2ðL1 � L0Þ (A.16)
which is clearly different from Eq. (A.15).In principle, one may use any stress measure in the stress-controlled NEB method. In our calculations we assume
the first Piola–Kirchhoff stress Sij is fixed. The corresponding stress work does not require numerical integration; based onEq. (A.5), it is given by
W ¼ V0Sijh�10njðh1in � h0inÞ (A.17)
Rigorously speaking, we study in this work the nanoscale fracture under the first Piola–Kirchhoff stress. While this stressis not very different numerically from the Cauchy stress, making the distinction between the two stress measures is criticalto ensuring the correct stress-work calculation, numerical stability, and self-consistency of results.
References
Argon, A.S., 2001. Mechanics and physics of brittle to ductile transitions in fracture. Journal of Engineering Materials and Technology-Transactions of theASME 123 (1), 1–11.
Balamane, H., Halicioglu, T., Tiller, W.A., 1992. Comparative-study of silicon empirical interatomic potentials. Physical Review B 46 (4), 2250–2279.Belytschko, T., Xiao, S.P., Schatz, G.C., Ruoff, R.S., 2002. Atomistic simulations of nanotube fracture. Physical Review B 65 (23), 235430.Bernstein, N., Hess, D.W., 2003. Lattice trapping barriers to brittle fracture. Physical Review Letters 91 (2), 025501.Buehler, M.J., Tang, H., van Duin, A.C.T., Goddard, W.A., 2007. Threshold crack speed controls dynamical fracture of silicon single crystals. Physical Review
Letters 99 (16), 165502.Bulatov, V.V., Justo, J.F., Cai, W., Yip, S., Argon, A.S., Lenosky, T., de Koning, M., de la Rubia, T.D., 2001. Parameter-free modelling of dislocation motion: the
case of silicon. Philosophical Magazine A 81 (5), 1257–1281.Caspersen, K.J., Carter, E.A., 2005. Finding transition states for crystalline solid-solid phase transformations. Proceedings of the National Academy of
Sciences of the United States of America 102 (19), 6738–6743.
ARTICLE IN PRESS
S. Huang et al. / J. Mech. Phys. Solids 57 (2009) 840–850850
Celarie, F., Prades, S., Bonamy, D., Ferrero, L., Bouchaud, E., Guillot, C., Marliere, C., 2003. Glass breaks like metal, but at the nanometer scale. PhysicalReview Letters 90 (7), 075504.
Curtin, W.A., 1990. On lattice trapping of cracks. Journal of Materials Research 5 (7), 1549–1560.Dumitrica, T., Hua, M., Yakobson, B.I., 2006. Symmetry-, time-, and temperature-dependent strength of carbon nanotubes. Proceedings of the National
Academy of Sciences of the United States of America 103 (16), 6105–6109.Freund, L.B., 1990. Dynamic Fracture Mechanics. Cambridge University Press, Cambridge, UK.Gao, H.J., Ji, B.H., Jager, I.L., Arzt, E., Fratzl, P., 2003. Materials become insensitive to flaws at nanoscale: lessons from nature. Proceedings of the National
Academy of Sciences of the United States of America 100 (10), 5597–5600.Guin, J.P., Wiederhorn, S.M., 2004. Fracture of silicate glasses: ductile or brittle? Physical Review Letters 92 (21), 215502.Han, X.D., Zheng, K., Zhang, Y.F., Zhang, X.N., Zhang, Z., Wang, Z.L., 2007. Low-temperature in situ large-strain plasticity of silicon nanowires. Advanced
Materials 19 (16), 2112–2118.Henkelman, G., Jonsson, H., 1999. A dimer method for finding saddle points on high dimensional potential surfaces using only first derivatives. Journal of
Chemical Physics 111 (15), 7010–7022.Jonsson, H., Mills, G., Jacobsen, K.W., 1998. Nudged elastic band method for finding minimum energy paths of transitions. In: Berne, B.J., Ciccotti, G., Coker,
D.F. (Eds.), Classical and Quantum Dynamics in Condensed Phase Simulations, pp. 385–404.Kang, K., Cai, W., 2007. Brittle and ductile fracture of semiconductor nanowires-molecular dynamics simulations. Philosophical Magazine 87, 2169–2189.Khare, R., Mielke, S.L., Paci, J.T., Zhang, S.L., Ballarini, R., Schatz, G.C., Belytschko, T., 2007. Coupled quantum mechanical/molecular mechanical modeling of
the fracture of defective carbon nanotubes and graphene sheets. Physical Review B 75 (7), 075412.Laio, A., Parrinello, M., 2002. Escaping free-energy minima. Proceedings of the National Academy of Sciences of the United States of America 99 (20),
12562–12566.Lawn, B., 1993. Fracture of Brittle Solids. Cambridge University Press, Cambridge, UK.Lee, C., Wei, X.D., Kysar, J.W., Hone, J., 2008. Measurement of the elastic properties and intrinsic strength of monolayer graphene. Science 321 (5887),
385–388.Marder, M., 1998. Energies of a kinked crack line. Journal of Statistical Physics 93 (3–4), 511–525.Mielke, S.L., Belytschko, T., Schatz, G.C., 2007. Nanoscale fracture mechanics. Annual Review of Physical Chemistry 58, 185–209.Muhlstein, C.L., Stach, E.A., Ritchie, R.O., 2002. A reaction-layer mechanism for the delayed failure of micron-scale polycrystalline silicon structural films
subjected to high-cycle fatigue loading. Acta Materialia 50 (14), 3579–3595.Ogata, S., Shimojo, F., Kalia, R.K., Nakano, A., Vashishta, P., 2004. Environmental effects of H2O on fracture initiation in silicon: a hybrid electronic-density-
functional/molecular-dynamics study. Journal of Applied Physics 95 (10), 5316–5323.Parrinello, M., Rahman, A., 1981. Polymorphic transitions in single-crystals—a new molecular-dynamics method. Journal of Applied Physics 52 (12),
7182–7190.Peng, B., Mocascio, M., Zapol, P., Li, S., Mielke, S.L., Schatz, G.C., Espinosa, H.D., 2008. Measurements of near-ultimate strength for multiwalled carbon
nanotubes and irradiation-induced crosslinking improvements. Nature Nanotechnology 3, 626–631.Perez, R., Gumbsch, P., 2000a. An ab initio study of the cleavage anisotropy in silicon. Acta Materialia 48 (18–19), 4517–4530.Perez, R., Gumbsch, P., 2000b. Directional anisotropy in the cleavage fracture of silicon. Physical Review Letters 84 (23), 5347–5350.Pugno, N.M., Ruoff, R.S., 2004. Quantized fracture mechanics. Philosophical Magazine 84 (27), 2829–2845.Rice, J.R., 1968. Mathematical analysis in the mechanics of fracture. In: Liebowitz, H. (Ed.), Fracture: An Advanced Treatise (vol. 2, Mathematical
Fundamentals). Academic Press, New York, pp. 191–311.Rice, J.R., 1978. Thermodynamics of quasi-static growth of Griffith cracks. Journal of the Mechanics and Physics of Solids 26 (2), 61–78.Ritchie, R.O., Kruzic, J.J., Muhlstein, C.L., Nalla, R.K., Stach, E.A., 2004. Characteristic dimensions and the micro-mechanisms of fracture and fatigue in ‘nano’
and ‘bio’ materials. International Journal of Fracture 128 (1–4), 1–15.Serebrinsky, S., Carter, E.A., Ortiz, M., 2004. A quantum-mechanically informed continuum model of hydrogen embrittlement. Journal of the Mechanics
and Physics of Solids 52 (10), 2403–2430.Sinclair, J.E., 1975. Influence of interatomic force law and of kinks on propagation of brittle cracks. Philosophical Magazine 31 (3), 647–671.Stillinger, F.H., Weber, T.A., 1985. Computer-simulation of local order in condensed phases of silicon. Physical Review B 31 (8), 5262–5271.Sun, Y.M., Beltz, G.E., Rice, J.R., 1993. Estimates from atomic model of tension shear coupling in dislocation nucleation from a crack-tip. Materials Science
and Engineering A 170 (1–2), 67–85.Thomson, R., Hsieh, C., Rana, V., 1971. Lattice trapping of fracture cracks. Journal of Applied Physics 42 (8), 3154–3160.Vineyard, G.H., 1957. Frequency factors and isotope effects in solid state rate processes. Journal of Physics and Chemistry of Solids 3 (1–2), 121–127.Voter, A.F., Montalenti, F., Germann, T.C., 2002. Extending the time scale in atomistic simulation of materials. Annual Review of Materials Research 32,
321–346.Warner, D.H., Curtin, W.A., Qu, S., 2007. Rate dependence of crack-tip processes predicts twinning trends in F.C.C. Metals. Nature Materials 6, 876–881.Wooten, F., Winer, K., Weaire, D., 1985. Computer-generation of structural models of amorphous Si and Ge. Physical Review Letters 54 (13), 1392–1395.Yakobson, B.I., 1998. Mechanical relaxation and ‘‘intramolecular plasticity’’ in carbon nanotubes. Applied Physics Letters 72 (8), 918–920.Yu, M.F., Lourie, O., Dyer, M.J., Moloni, K., Kelly, T.F., Ruoff, R.S., 2000. Strength and breaking mechanism of multiwalled carbon nanotubes under tensile
load. Science 287 (5453), 637–640.Zhang, S., Zhu, T., 2007. Atomic geometry and energetics of carbon nanotube necking. Philosophical Magazine Letters 87 (8), 567–574.Zhang, S.L., Mielke, S.L., Khare, R., Troya, D., Ruoff, R.S., Schatz, G.C., Belytschko, T., 2005. Mechanics of defects in carbon nanotubes: atomistic and
multiscale simulations. Physical Review B 71 (11), 115403.Zhang, S.L., Zhu, T., Belytschko, T., 2007. Atomistic and multiscale analyses of brittle fracture in crystal lattices. Physical Review B 76 (9), 094114.Zhu, T., Li, J., Lin, X., Yip, S., 2005. Stress-dependent molecular pathways of silica–water reaction. Journal of the Mechanics and Physics of Solids 53 (7),
1597–1623.Zhu, T., Li, J., Samanta, A., Kim, H.G., Suresh, S., 2007. Interfacial plasticity governs strain rate sensitivity and ductility in nanostructured metals.
Proceedings of the National Academy of Sciences of the USA 104, 3031–3036.Zhu, T., Li, J., Samanta, A., Leach, A., Gall, K., 2008. Temperature and strain-rate dependence of surface dislocation nucleation. Physical Review Letters 100,
025502.Zhu, T., Li, J., Yip, S., 2004. Atomistic configurations and energetics of crack extension in silicon. Physical Review Letters 93, 205504.Zhu, T., Li, J., Yip, S., 2006. Atomistic characterization of three-dimensional lattice trapping barriers to brittle fracture. Proceedings of the Royal Society of
London A 462, 1741–1761.