Embed Size (px)
Citation preview

Mechanics Science 1.1
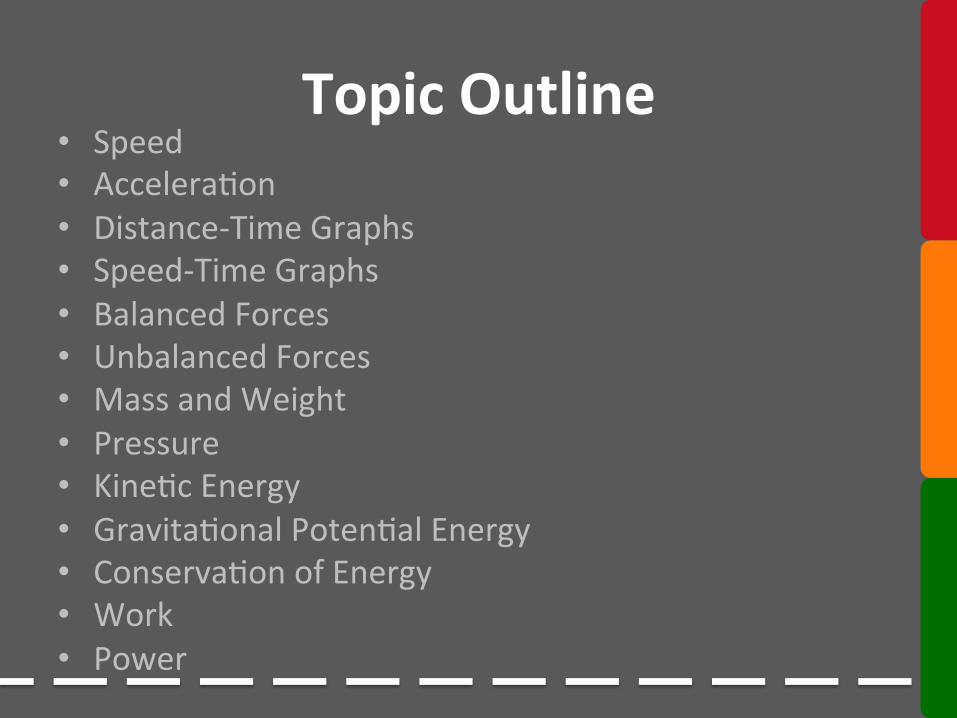
Topic Outline • Speed • Accelera+on • Distance-‐Time Graphs • Speed-‐Time Graphs • Balanced Forces • Unbalanced Forces • Mass and Weight • Pressure • Kine+c Energy • Gravita+onal Poten+al Energy • Conserva+on of Energy • Work • Power
Equa6ons Y11#Mechanics#Equations#
!
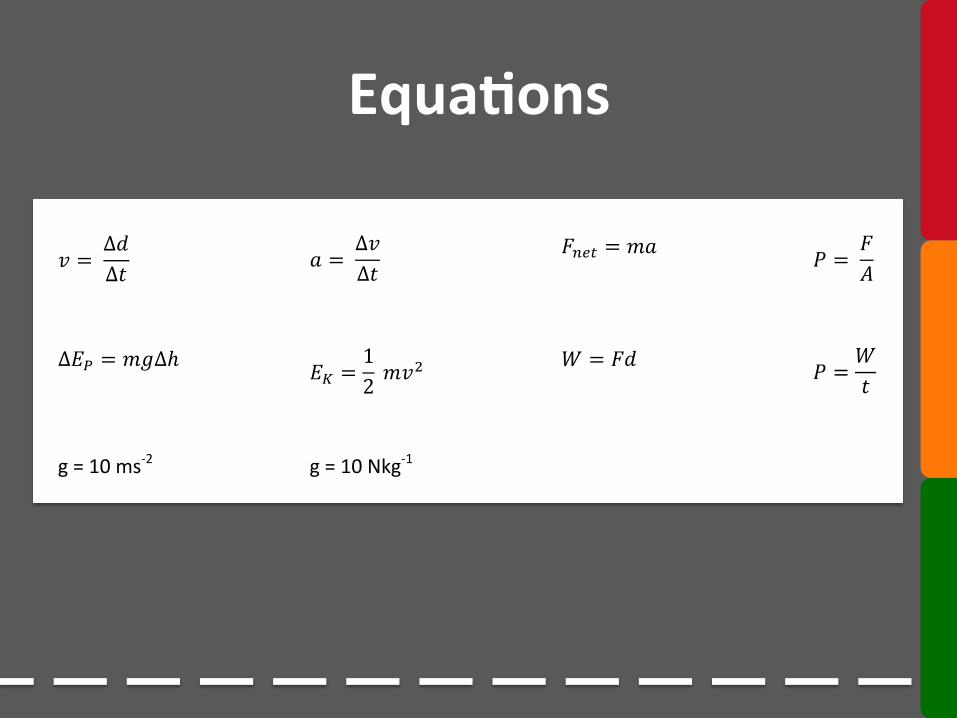
! = !∆!∆! ! ! = !∆!∆! !!!"# = !"! ! = !!!!
!
∆!! = !"∆ℎ! !! =12 !!!
!! ! = !"! ! =!!
!
g!=!10!ms(2! g!=!10!Nkg(1!
!
!
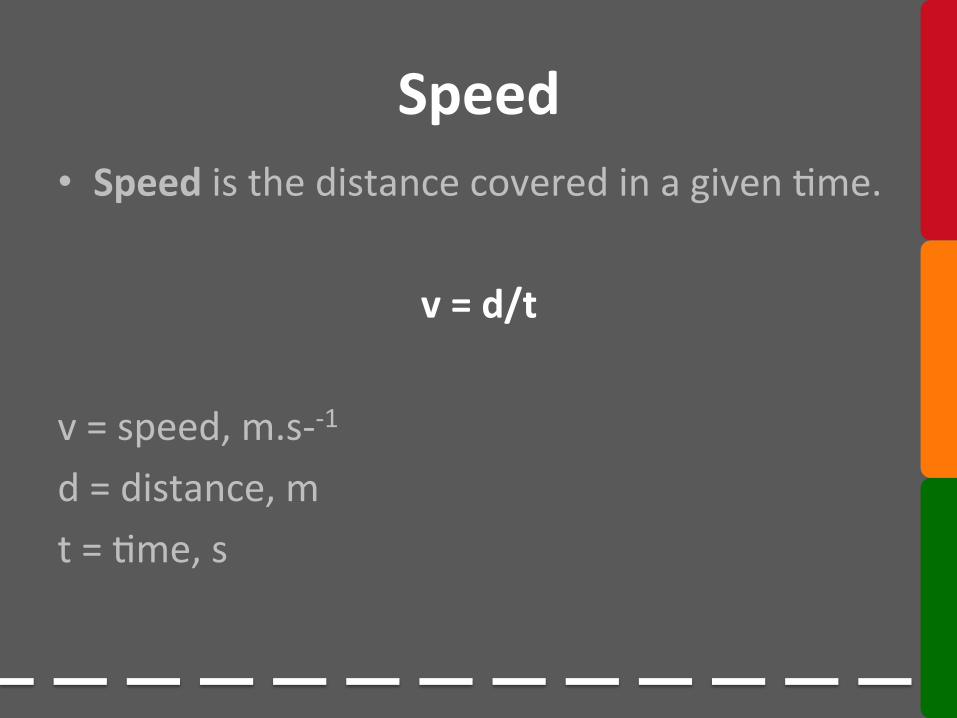
Speed • Speed is the distance covered in a given +me.
v = d/t v = speed, m.s-‐-‐1 d = distance, m t = +me, s

Speed – Prac6cal Speedy Cars
Measure the time taken for a number of cars to travel 20 m along Balmacewen Road. When you are back in the class, calculate the average speed of these cars in m.s-1 and km.h-1.
Car Time (s) Distance (m) Average Speed (m.s-1)
Average Speed (km.h-1)
1
2
3
4
5
6
7
8
9
10 Macleod
Speedy Cars
Measure the time taken for a number of cars to travel 20 m along Balmacewen Road. When you are back in the class, calculate the average speed of these cars in m.s-1 and km.h-1.
Car Time (s) Distance (m) Average Speed (m.s-1)
Average Speed (km.h-1)
1
2
3
4
5
6
7
8
9
10 Macleod
20 m
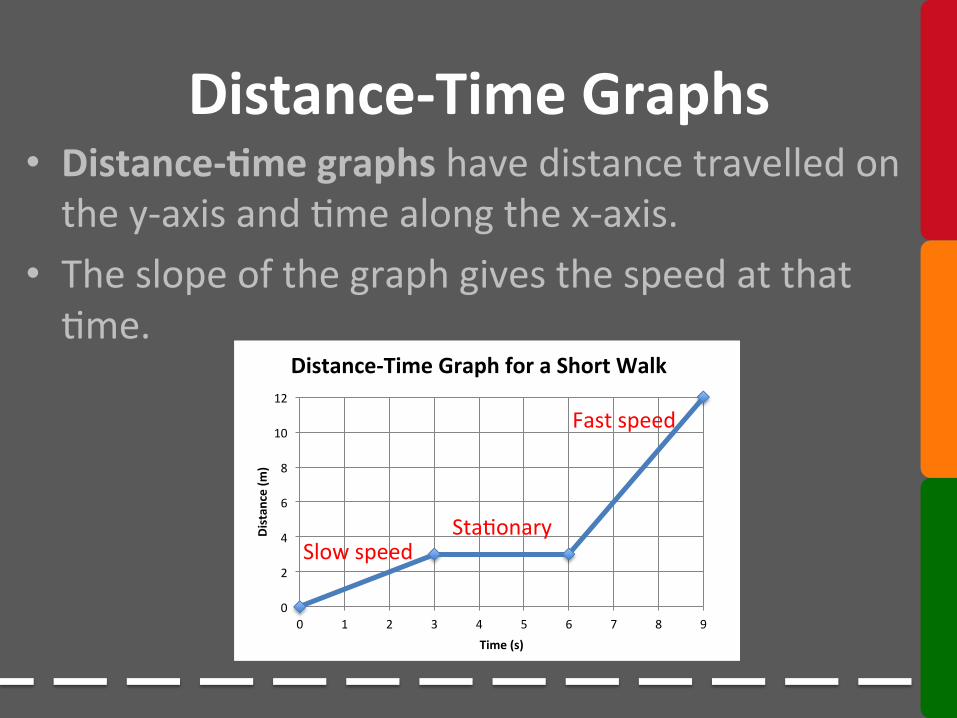
• Distance-‐6me graphs have distance travelled on the y-‐axis and +me along the x-‐axis.
• The slope of the graph gives the speed at that +me.
Distance-‐Time Graphs
0
2
4
6
8
10
12
0 1 2 3 4 5 6 7 8 9
Distan
ce (m
)
Time (s)
Distance-‐Time Graph for a Short Walk
Slow speed Sta+onary
Fast speed

Distance-‐Time Graphs • In a distance-‐+me graph, the slope indicates the speed: – a steep slope indicates a fast speed – a gradual slope indicates a slow speed – a flat (horizontal) slope indicates the object has stopped moving
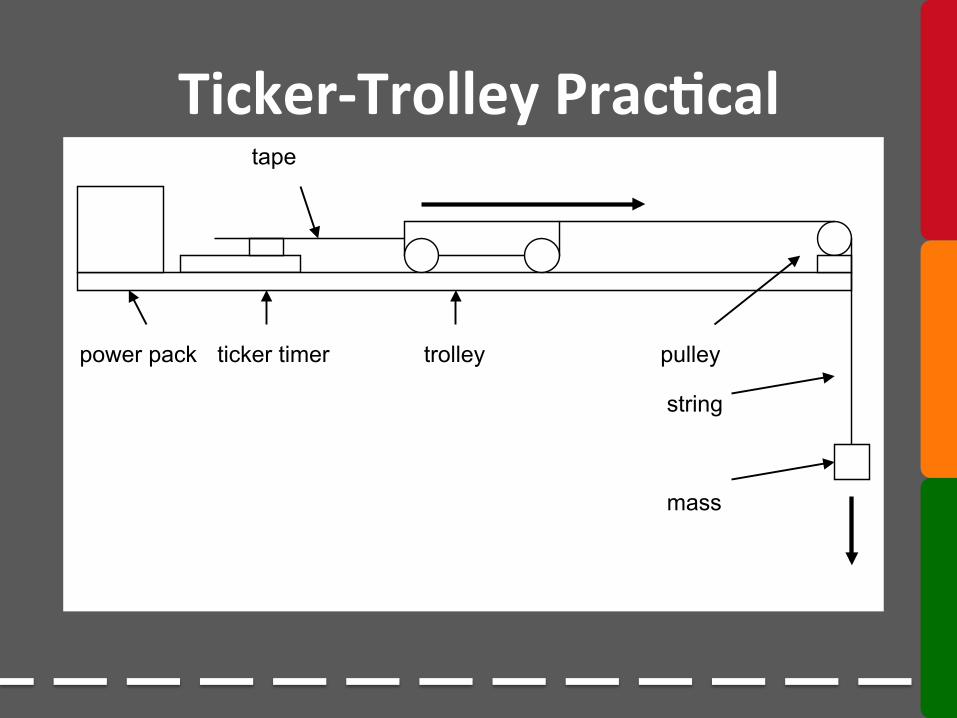
Ticker-‐Trolley Prac6cal
Ticker'Trolley'Experiment'
Aim:!To!plot!a!distance.time!graph!for!the!journey!of!a!ticker!trolley.!
Hypothesis:'I!think!that!as!the!trolley!is!pulled!off!the!table!its!speed!will!<insert'your'prediction>.!
Method:!!
<Insert'steps>'
tape
power pack ticker timer trolley pulley
string
mass
'
'
'
Results:'
Table!
Interval'Number'
'Time'(s)' Distance'(cm)' Distance'(m)' Summative'Distance'(m)'
Average'Speed'(msD1)'
1! 0.1! ! ! ! !2! 0.1! ! ! ! !3! 0.1! ! ! ! !4! 0.1! ! ! ! !5! 0.1! ! ! ! !6! 0.1! ! ! ! !7! 0.1! ! ! ! !8! 0.1! ! ! ! !9! 0.1! ! ! ! !10! 0.1! ! ! ! !
!
Graph!
!
Conclusion:'
Agree/disagree!with!hypothesis!!

Ticker-‐Trolley Prac6cal • Aim: To plot a distance-‐+me graph for the journey of a +cker trolley
• Hypothesis: I think that as the trolley is pulled off the table the speed will <increase / stay the same / decrease>
• Method: Outline steps and draw a diagram

Ticker-‐Trolley Prac6cal • Results
Once you have filled out the table, draw a distance-‐;me graph for your results
Ticker'Trolley'Experiment'
Aim:!To!plot!a!distance.time!graph!for!the!journey!of!a!ticker!trolley.!
Hypothesis:'I!think!that!as!the!trolley!is!pulled!off!the!table!its!speed!will!<insert'your'prediction>.!
Method:!!
<Insert'steps>'
tape
power pack ticker timer trolley pulley
string
mass
'
'
'
Results:'
Table!
Interval'Number'
'Time'(s)' Distance'(cm)' Distance'(m)' Summative'Distance'(m)'
Average'Speed'(msD1)'
1! 0.1! ! ! ! !2! 0.1! ! ! ! !3! 0.1! ! ! ! !4! 0.1! ! ! ! !5! 0.1! ! ! ! !6! 0.1! ! ! ! !7! 0.1! ! ! ! !8! 0.1! ! ! ! !9! 0.1! ! ! ! !10! 0.1! ! ! ! !
!
Graph!
!
Conclusion:'
Agree/disagree!with!hypothesis!!
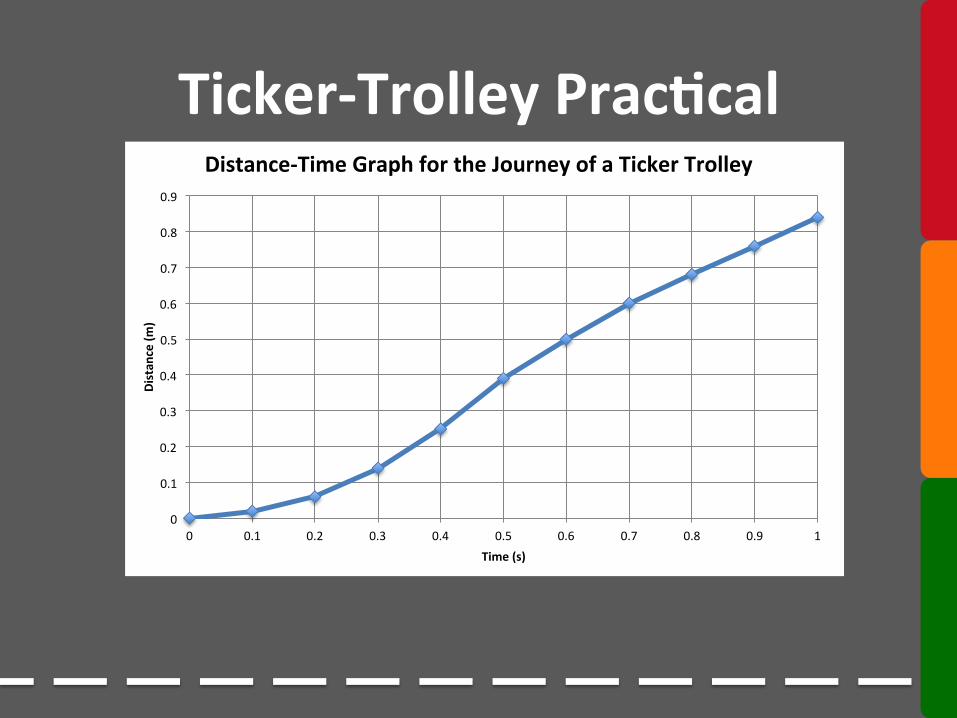
Ticker-‐Trolley Prac6cal
0
0.1
0.2
0.3
0.4
0.5
0.6
0.7
0.8
0.9
0 0.1 0.2 0.3 0.4 0.5 0.6 0.7 0.8 0.9 1
Distan
ce (m
)
Time (s)
Distance-‐Time Graph for the Journey of a Ticker Trolley

Ticker-‐Trolley Prac6cal • Conclusion – Agree or disagree with your hypothesis – Explain your results – Suggest three reasonable Improvements

Accelera6on • Accelera6on is the change in speed over +me.
a = Δv Δt
a = accelera+on, m.s-‐2 Δv = change in speed, m.s-‐1 Δt = change in +me, s
Worksheet: Speed and Accelera;on

Speed-‐Time Graphs • Speed-‐6me graphs have the speed on the y-‐axis and +me along the x-‐axis.
• The slope of the graph gives the accelera+on at that +me.
0
2
4
6
8
10
12
14
0 2 4 6 8 10 12 14 16 18 20
Speed (m
/s)
Time (s)
Speed-‐Time Graph for a Short Bike Ride
Gradual accelera+on
Rapid accelera+on
No accelera+on OR constant speed
Nega+ve accelera+on OR decelera+on
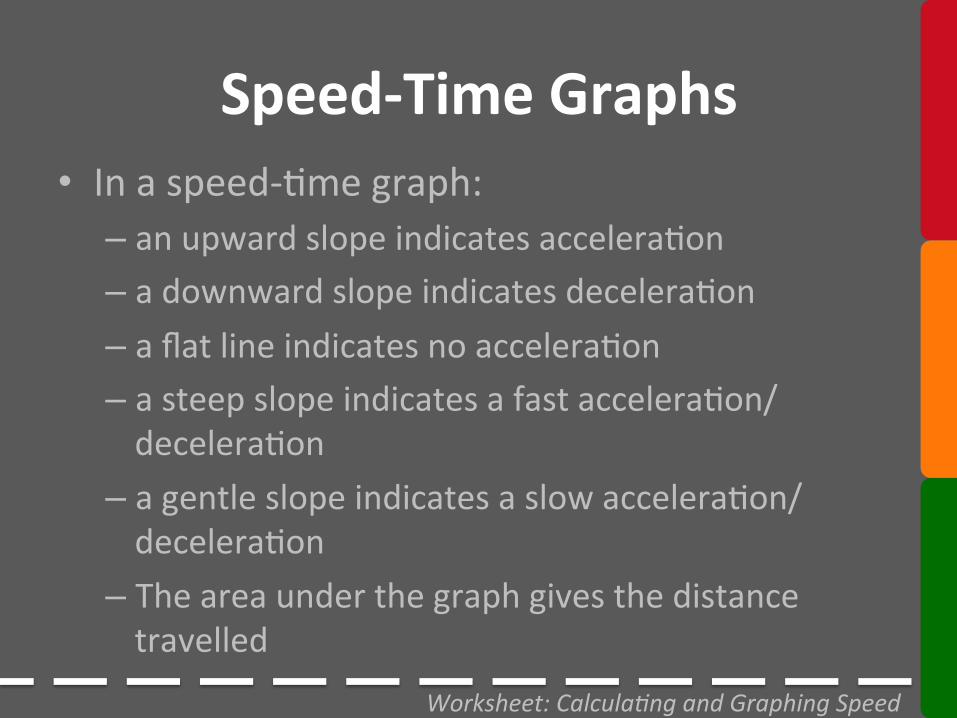
Speed-‐Time Graphs • In a speed-‐+me graph: – an upward slope indicates accelera+on – a downward slope indicates decelera+on – a flat line indicates no accelera+on – a steep slope indicates a fast accelera+on/decelera+on
– a gentle slope indicates a slow accelera+on/decelera+on
– The area under the graph gives the distance travelled
Worksheet: Calcula;ng and Graphing Speed

Reac6on Time – Prac6cal Ac6vity: 1. Set up a chair so one group member can push
their foot against a wall 2. Drop a meter ruler between the person’s foot and
the wall 3. Record the distance the ruler falls 4. Repeat three +mes for each group member 5. Use the chart to work out the average reac+on
+me for each person 6. Time permieng, repeat using a different
condi+on, e.g. having a conversa+on, listening to music, tex+ng… (check with teacher first)

Reac6on Time – Prac6cal
Once you have calculated your average reac+on +me, calculate how far you would travel in this +me in a car travelling at 50 km/h. How does this compare to sta+s+cs that people travel an average of 11 m before star+ng to break?
Macleod
Worksheet: Calculating and Graphing Speed. Reaction Time and Breaking Activity: Measure reaction time by dropping a metre ruler between someone’s hand, take the average of 3 measurements for each student. Plot a histogram of class data. Use chart below to work out reaction time and calculate distance travelled by a car travelling at 16 m.s-1 (57.6 km/h) in that time (minimum time before you start breaking). Compare with statistics that an average driver will travel 11 m before breaking. Why do you think there is a difference? Distance on ruler (cm) Reaction time (s)
5 0.10 10 0.14 15 0.18 20 0.20 25 0.23 30 0.25 35 0.26 40 0.28 45 0.30 50 0.32
Force A force is a push, pull or twist. Contact forces require physical contact between the two objects, e.g. kicking a ball; non-contact forces do not, e.g. gravity and magnetism. All forces have a direction. When a force is applied to an object, the object will either: speed up, slow down, change direction or change shape. When two forces of the same size are acting against each other, they will cancel out (or ‘balance’). Force is measured in Newtons. 1 N = the force required to accelerate a 1 kg object at 1 m.s-2. Types of Force Types of Force cloze. Friction is a contact force. Friction occurs when two surfaces are in contact and one is moving relative to the other. The friction force is in the opposite direction to the motion of the object. Friction is increased when:
• the surface area of contact is greater • the speed of the objects is greater • the materials are ‘rougher’.
Magnetism is a non-contact force. Magnets contain iron (or cobalt or nickel) and all magnets have a North and a South pole. Opposite poles attract, like poles repel. Electrostatic forces are non-contact forces. Electrostatic forces occur between objects with an electric charge, i.e. a positive or a negative charge. Opposite charges attract, like charges repel.

Force • A force is a push, pull or twist • Contact forces require physical contact between the two objects, e.g. kicking a ball; non-‐contact forces do not, e.g. gravity and magne+sm
• All forces have a direc6on • When a force is applied to an object, the object will: speed up, slow down, change direc+on or change shape
• When two forces of the same size are ac+ng against each other, they will cancel out (or ‘balance’)
• Force is measured in Newtons. 1 N = the force required to accelerate a 1 kg object at 1 m.s-‐2
Worksheet: Types of Force

Newton’s First Law of Mo6on • Newton’s First Law of Mo6on: An object will con+nue to travel in the same speed and in the same direc+on unless it is acted on by an unbalanced force
• All forces have a size and a direc6on • The forces in a given direc+on (e.g. horizontal direc+on or ver+cal direc+on) can be added to work out the net (overall) force in that direc+on – Thrust is the force that is intended to make the object move
– Fric6on is a force that opposes the movement of an object – Weight is the downward force of gravity on an object – Support is the force holding up the weight of an object

Free-‐Body Force Diagrams • We can draw free-‐body force diagrams to show the forces on an object
Lin
Thrust Drag
Weight
Newton’s Second Law of Mo6on • Newton’s Second Law of Mo6on: If an unbalanced force acts on an object, the object will accelerate in the direc+on of that force
• Another way to think of this is that the object will move in the direc+on of the net force
• The net force is the ‘overall’ force, which is calculated by adding all the forces together (remember: forces have direc6on)

Newton’s Second Law of Mo6on !
!
!

Force = mass x accelera+on
F = ma F = force, N m = mass, kg a = accelera+on, m.s-‐2
Worksheet: Newton’s Laws Worksheet: Warbirds over Wanaka
Newton’s Second Law of Mo6on
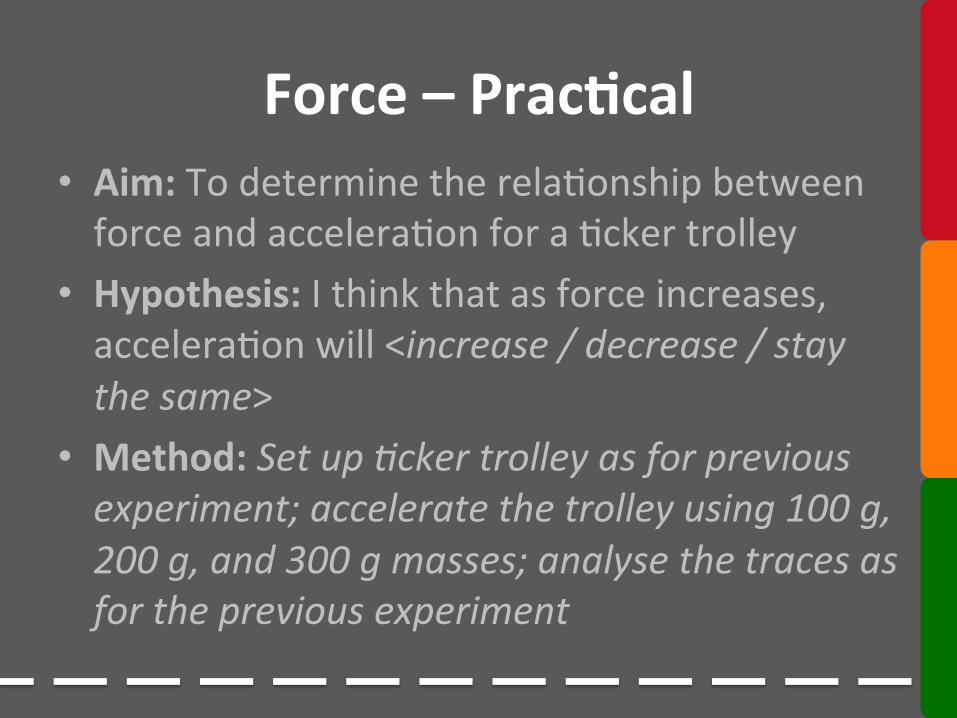
Force – Prac6cal • Aim: To determine the rela+onship between force and accelera+on for a +cker trolley
• Hypothesis: I think that as force increases, accelera+on will <increase / decrease / stay the same>
• Method: Set up ;cker trolley as for previous experiment; accelerate the trolley using 100 g, 200 g, and 300 g masses; analyse the traces as for the previous experiment

Force – Prac6cal
Ticker'Trolley'Experiment'
Aim:!To!plot!a!distance.time!graph!for!the!journey!of!a!ticker!trolley.!
Hypothesis:'I!think!that!as!the!trolley!is!pulled!off!the!table!its!speed!will!<insert'your'prediction>.!
Method:!!
<Insert'steps>'
tape
power pack ticker timer trolley pulley
string
mass
'
'
'
Results:'
Table!
Interval'Number'
'Time'(s)' Distance'(cm)' Distance'(m)' Summative'Distance'(m)'
Average'Speed'(msD1)'
1! 0.1! ! ! ! !2! 0.1! ! ! ! !3! 0.1! ! ! ! !4! 0.1! ! ! ! !5! 0.1! ! ! ! !6! 0.1! ! ! ! !7! 0.1! ! ! ! !8! 0.1! ! ! ! !9! 0.1! ! ! ! !10! 0.1! ! ! ! !
!
Graph!
!
Conclusion:'
Agree/disagree!with!hypothesis!!

Force – Prac6cal • Data Analysis – Mark off intervals by puSng a line through every 5th dot on the trace
– Measure the length of the longest interval on the trace – Calculate the speed for this interval (s = d/t) – Work out the change in speed from the start (0 ms-‐1) to the maximum speed (which you have just calculated)
– Count the number of intervals and work out the change in /me to reach the maximum speed
– Calculate accelera/on using a = Δv/Δt
Force and Acceleration Aim: To determine the relationship between force and acceleration. Hypothesis: I think that <insert your prediction>. Method: <Insert steps> Results: To analyse your results:
1. Mark off every 5th dot. 2. Find the longest distance covered on one interval and work out the speed for that
interval. 3. Count the number of intervals to the fastest one and work out the acceleration. 4. Fill out the table below.
Mass (g) Force (N) Acceleration (m.s-2)
100 1 200 2 300 3
Graph <graph force on the x-axis and acceleration on the y-axis> Conclusion: Agree/disagree Explain your results Improvements
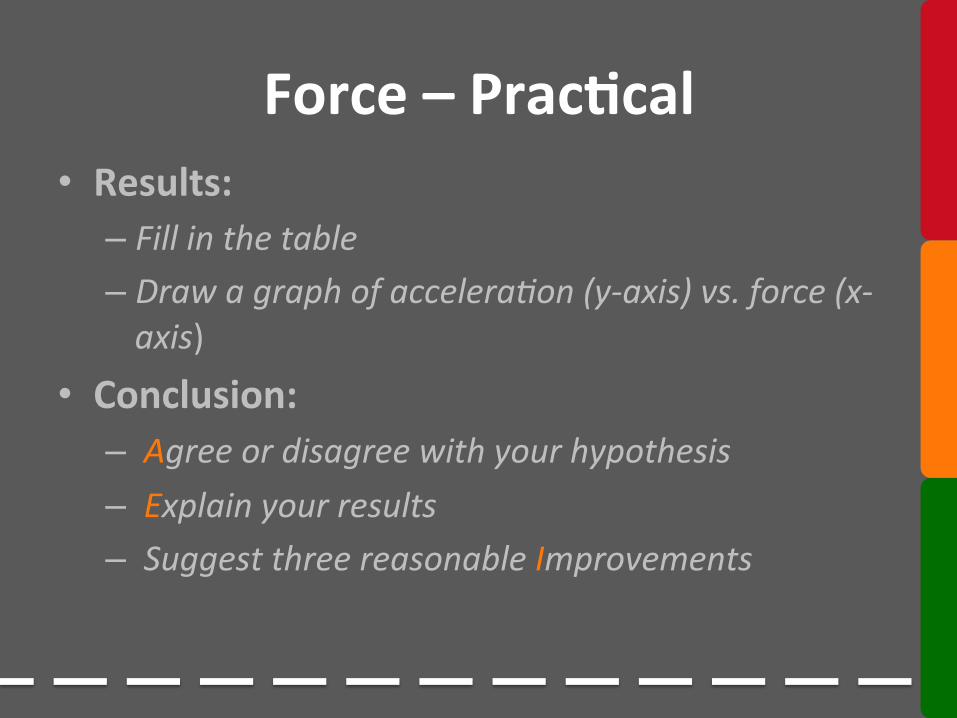
Force – Prac6cal • Results: – Fill in the table – Draw a graph of accelera;on (y-‐axis) vs. force (x-‐axis)
• Conclusion: – Agree or disagree with your hypothesis – Explain your results – Suggest three reasonable Improvements

Mass and Density • Mass is a measure of the amount of maoer in an object
• Mass is measured in kilograms (kg) • Density is the amount of maoer in a given volume
• Density is measured in kg/l (kg.l-‐1) or g/ml (g.ml-‐1)
Density = mass volume
• One kilogram of water has a volume of one litre, so the density of water is 1 kg/l

Density – Prac6cal • Aim: To calculate the density of at least 5 small objects
• Method: – Measure the mass (g) of an object on the electronic scales
– Measure the volume (ml) of the object using water displacement in a measuring cylinder
– Calculate density = mass/volume • Results: – Make a table of your results
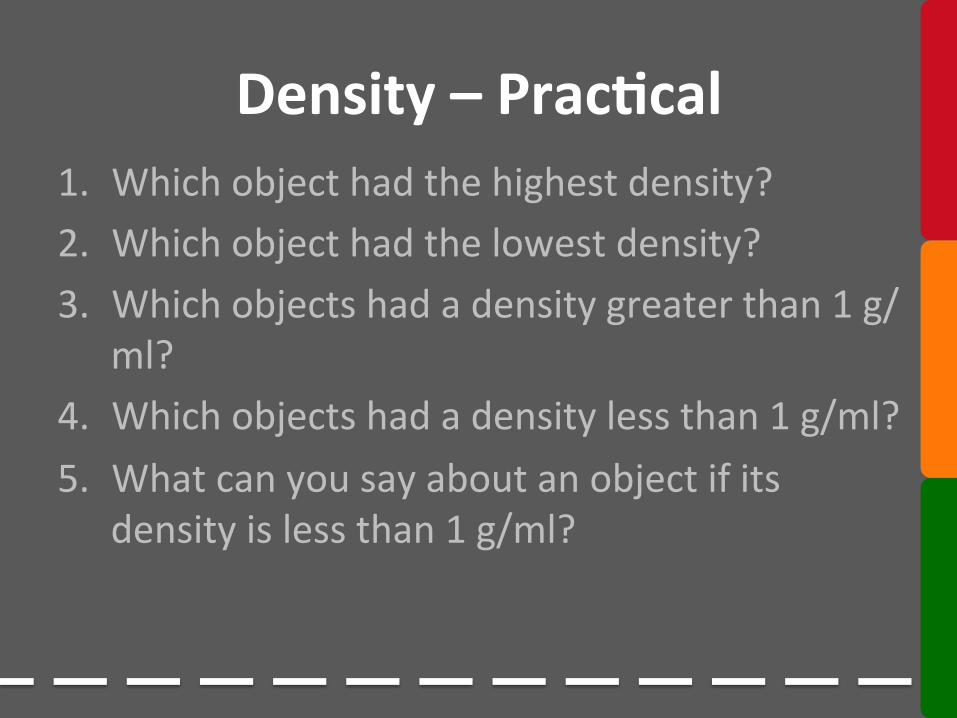
Density – Prac6cal 1. Which object had the highest density? 2. Which object had the lowest density? 3. Which objects had a density greater than 1 g/
ml? 4. Which objects had a density less than 1 g/ml? 5. What can you say about an object if its
density is less than 1 g/ml?

Mass and Weight • Mass is the amount of maoer in an object, kg • Weight is the force of gravity ac+ng on a mass, Newtons, N Weight force = mass x accelera+on due to gravity
FW = mg
FW = weight force, N m = mass, kg g = accelera+on due to gravity, 10 m.s-‐2
Worksheet: Planet Gravity

Measuring Mass in Space -‐ Prac6cal • Aim: To measure mass without measuring weight • Method: – Tape a ruler to the edge of a desk, with most of the ruler hanging over the edge
– Tape a 50 g mass onto the end of the ruler – Time 10 oscilla+ons of the mass on the ruler – Repeat for 100 g, 150 g and 200 g masses – Plot a graph of +me for 10 oscilla+ons (y-‐axis) vs. mass (x-‐axis)
– Aoach an unknown mass to the end of the ruler and +me 10 oscilla+ons
– Use your graph (a calibra+on curve) to es+mate the mass of the unknown

Pressure • Pressure is the force on an object divided by the area over which that force acts
P = F A
P = pressure, Pascals (Pa) or Nm-‐2 F = force, N A = area, m2

Pressure – Ac6vity • Trace the sole of your shoe on grid paper with cen+metre markings
• Count the number of squares under your shoe, then double this area (for standing on both feet)
• Convert the area from cm2 to m2 by dividing by 10 000
• Calculate your weight by mul+plying your mass by gravity
• Calculate the pressure you exert on the floor using pressure = force / area
• Repeat using the area of the chair legs

Energy • Energy is the capacity to do work and is measured in Joules (J)
• There are two main categories of energy: – poten6al energy is stored energy, e.g. a car baoery has chemical poten+al energy
– ac6ve energy is when the energy changes are observable, e.g. fireworks exploding

James Joule • James Prescoo Joule (1818-‐1889) was an English Physicist
• He demonstrated the equivalence between mechanical work and heat

Energy Transforms • Energy is neither created nor destroyed, but is transformed from one form to another
Ac;vity: Make an eight-‐frame cartoon for the energy transforms that result in one of the following situa;ons: – the electric light shining in this room – you wri;ng on your page – a person scoring a goal or a try

Kine6c Energy • Kine6c energy is calculated from the mass of the object and the speed it is going:
EK = ½ mv2 EK = kine+c energy, J m = mass, kg v = velocity (speed), m.s-‐1 Ac;vity: Calculate your average kine;c energy when running 25 m
Worksheet: Kine;c Energy

Gravita6onal Poten6al Energy • Gravita6onal poten6al energy is the amount of stored energy an
object has when it is held at a height • E.g. water in a dam or a person on a diving board
EGP = mgh EGP = gravita+onal poten+al energy, J m = mass, kg g = accelera+on due to gravity, 10 m.s-‐2 h = height of the object Ac;vity: Calculate the gravita;onal poten;al energy you gain by climbing a flight of stairs
Worksheet: Gravita;onal Poten;al Energy

Work • Work is the transfer of energy from one form to another, and is measured in Joules (J).
• Work is calculated from the force used to move an object a certain distance
Work = force x distance W = Fd
W = work done, J F = force, N d = distance the object is moved, m

Work -‐ Example A force of 15 N is applied to lin a school bag 1.2 m from the floor onto a desk Work done = force x distance = 15 x 1.2 = 18 J In this case, chemical poten+al energy from the person’s food is converted into kine+c energy as the muscles and school bag move, and then the kine+c energy is converted into gravita+onal poten+al energy of the bag on the desk.
Worksheet: Work

Conserva6on of Energy • When an object is in free fall (e.g. a tennis ball dropped from a building), its gravita+onal poten+al energy is converted to kine+c energy
Worksheet: Conserva;on of Energy

Power • Power is a measure of how fast work is done, i.e. how quickly energy is converted from one form to another
• A powerful car is able to turn chemical poten+al energy (petrol) into kine+c energy (speed) in a short amount of +me
• Power is measured in Waos, W Power = Work / +me taken
P = W / t P = power, W W = work done, J t = +me, s
Worksheet: Power

Power – Ac6vity • Calculate your average power when climbing a flight of stairs

Power – Ac6vity Worked example: m = 65 kg F = mg = 65 x 10 = 650 N h = 3 m W = Fd = 650 x 3 = 1950 J t = 4 s P = W ÷ t = 1950 ÷ 4 = 487.5 W

Revision • Summary ques+ons: NZ Cliff Divers • Glossary • Past exam papers (Science 1.1)