Embed Size (px)
Citation preview

Mechanics and design of fiber-reinforced vascular prostheses
Citation for published version (APA):Oijen, van, C. H. G. A. (2003). Mechanics and design of fiber-reinforced vascular prostheses. TechnischeUniversiteit Eindhoven. https://doi.org/10.6100/IR564630
DOI:10.6100/IR564630
Document status and date:Published: 01/01/2003
Document Version:Publisher’s PDF, also known as Version of Record (includes final page, issue and volume numbers)
Please check the document version of this publication:
• A submitted manuscript is the version of the article upon submission and before peer-review. There can beimportant differences between the submitted version and the official published version of record. Peopleinterested in the research are advised to contact the author for the final version of the publication, or visit theDOI to the publisher's website.• The final author version and the galley proof are versions of the publication after peer review.• The final published version features the final layout of the paper including the volume, issue and pagenumbers.Link to publication
General rightsCopyright and moral rights for the publications made accessible in the public portal are retained by the authors and/or other copyright ownersand it is a condition of accessing publications that users recognise and abide by the legal requirements associated with these rights.
• Users may download and print one copy of any publication from the public portal for the purpose of private study or research. • You may not further distribute the material or use it for any profit-making activity or commercial gain • You may freely distribute the URL identifying the publication in the public portal.
If the publication is distributed under the terms of Article 25fa of the Dutch Copyright Act, indicated by the “Taverne” license above, pleasefollow below link for the End User Agreement:www.tue.nl/taverne
Take down policyIf you believe that this document breaches copyright please contact us at:[email protected] details and we will investigate your claim.
Download date: 21. Nov. 2021

Mechanics and design offiber-reinforced vascular prostheses

CIP-DATA LIBRARY TECHNISCHE UNIVERSITEIT EINDHOVEN
Oijen, Christiaan H.G.A. van
Mechanics and design of fiber-reinforced vascular prostheses / byChristiaan H.G.A. van Oijen. - Eindhoven : Technische Universiteit Eindhoven, 2003.Proefschrift. - ISBN 90-386-3014-XNUR 954Subject headings: fiber-reinforced vascular prosthesis / vascular prosthesis ; compliance mis-match / fiber-reinforced materials ; mathematical modeling / fiber-reinforced materials ; up-dated Lagrange / arteries ; mechanical properties / vascular prosthesis ; fiber-reinforced hy-drogel / anastomosis; wall stress
Reproduction: Universiteitsdrukkerij TU Eindhoven, Eindhoven, the Netherlands

Mechanics and design offiber-reinforced vascular prostheses
PROEFSCHRIFT
ter verkrijging van de graad van doctor aan deTechnische Universiteit Eindhoven, op gezag van de
Rector Magnificus, prof.dr. R.A. van Santen, voor eencommissie aangewezen door het College voorPromoties in het openbaar te verdedigen op
vrijdag 16 mei 2003 om 16.00 uur
door
Christiaan Hendrikus Gerardus Arnoldus van Oijen
geboren te Druten

Dit proefschrift is goedgekeurd door de promotoren:
prof.dr.ir. F.P.T. Baaijensenprof.dr.ir. F.N. van de Vosse

Voor Veronica


Contents
Summary xi
1. General introduction 11.1 Introduction . . . . . . . . . . . . . . . . . . . . . . . . . . . . . . . . . . . 21.2 The arterial wall . . . . . . . . . . . . . . . . . . . . . . . . . . . . . . . . . 2
1.2.1 Morphology . . . . . . . . . . . . . . . . . . . . . . . . . . . . . . 21.2.2 Mechanical behavior . . . . . . . . . . . . . . . . . . . . . . . . . . 3
1.3 History and future of vascular prostheses . . . . . . . . . . . . . . . . . . . . 51.4 A small-diameter synthetic prosthesis . . . . . . . . . . . . . . . . . . . . . 51.5 Objective and outline . . . . . . . . . . . . . . . . . . . . . . . . . . . . . . 7
2. A constitutive model for incompressible fiber-reinforced materials 92.1 Introduction . . . . . . . . . . . . . . . . . . . . . . . . . . . . . . . . . . . 102.2 Constitutive equation for transversely isotropic material . . . . . . . . . . . . 11
2.2.1 Kinematics . . . . . . . . . . . . . . . . . . . . . . . . . . . . . . . 112.2.2 Finite elasticity (hyperelasticity theory) . . . . . . . . . . . . . . . . 112.2.3 Generalized form . . . . . . . . . . . . . . . . . . . . . . . . . . . . 122.2.4 Extended composite constitutive equation (rule of mixtures) . . . . . 12
2.3 Finite element formulation . . . . . . . . . . . . . . . . . . . . . . . . . . . 142.3.1 Balance equations . . . . . . . . . . . . . . . . . . . . . . . . . . . 142.3.2 Linearisation . . . . . . . . . . . . . . . . . . . . . . . . . . . . . . 162.3.3 Galerkin discretization . . . . . . . . . . . . . . . . . . . . . . . . . 172.3.4 Constitutive equations . . . . . . . . . . . . . . . . . . . . . . . . . 18
2.4 Examples . . . . . . . . . . . . . . . . . . . . . . . . . . . . . . . . . . . . 202.4.1 Convergence of the iteration process . . . . . . . . . . . . . . . . . . 202.4.2 The arterial wall: a two-layer composite with residual strains . . . . . 21
2.5 Discussion . . . . . . . . . . . . . . . . . . . . . . . . . . . . . . . . . . . . 24
3. Mechanical characterization and modeling of human arteries 253.1 Introduction . . . . . . . . . . . . . . . . . . . . . . . . . . . . . . . . . . . 263.2 Mathematical model . . . . . . . . . . . . . . . . . . . . . . . . . . . . . . 27
3.2.1 Kinematics . . . . . . . . . . . . . . . . . . . . . . . . . . . . . . . 273.2.2 Equilibrium . . . . . . . . . . . . . . . . . . . . . . . . . . . . . . . 283.2.3 Solution procedure . . . . . . . . . . . . . . . . . . . . . . . . . . . 29
vii

viii Contents
3.2.4 Constitutive equations . . . . . . . . . . . . . . . . . . . . . . . . . 303.3 Material and experimental method . . . . . . . . . . . . . . . . . . . . . . . 31
3.3.1 Biological material . . . . . . . . . . . . . . . . . . . . . . . . . . . 313.3.2 Experimental setup . . . . . . . . . . . . . . . . . . . . . . . . . . . 323.3.3 Experimental procedure . . . . . . . . . . . . . . . . . . . . . . . . 34
3.4 Results . . . . . . . . . . . . . . . . . . . . . . . . . . . . . . . . . . . . . . 343.4.1 Residual stress . . . . . . . . . . . . . . . . . . . . . . . . . . . . . 343.4.2 Mechanical behavior . . . . . . . . . . . . . . . . . . . . . . . . . . 343.4.3 Model . . . . . . . . . . . . . . . . . . . . . . . . . . . . . . . . . . 363.4.4 Comparison with values from literature . . . . . . . . . . . . . . . . 39
3.5 Discussion . . . . . . . . . . . . . . . . . . . . . . . . . . . . . . . . . . . . 39
4. Mechanics of fiber-reinforced HEMA/EGDMA hydrogel 414.1 Introduction . . . . . . . . . . . . . . . . . . . . . . . . . . . . . . . . . . . 424.2 Materials and methods . . . . . . . . . . . . . . . . . . . . . . . . . . . . . 43
4.2.1 Preparation of the composite . . . . . . . . . . . . . . . . . . . . . . 434.2.2 Biocompatibility . . . . . . . . . . . . . . . . . . . . . . . . . . . . 434.2.3 Mathematical model . . . . . . . . . . . . . . . . . . . . . . . . . . 444.2.4 Tensile test . . . . . . . . . . . . . . . . . . . . . . . . . . . . . . . 45
4.3 Results . . . . . . . . . . . . . . . . . . . . . . . . . . . . . . . . . . . . . . 454.3.1 Biocompatibility . . . . . . . . . . . . . . . . . . . . . . . . . . . . 454.3.2 Mechanical properties . . . . . . . . . . . . . . . . . . . . . . . . . 454.3.3 Model validation . . . . . . . . . . . . . . . . . . . . . . . . . . . . 494.3.4 Natural arteries . . . . . . . . . . . . . . . . . . . . . . . . . . . . . 50
4.4 Discussion . . . . . . . . . . . . . . . . . . . . . . . . . . . . . . . . . . . . 53
5. Numerical analysis of distensible artery-graft anastomoses: a model study 555.1 Introduction . . . . . . . . . . . . . . . . . . . . . . . . . . . . . . . . . . . 565.2 Methods . . . . . . . . . . . . . . . . . . . . . . . . . . . . . . . . . . . . . 56
5.2.1 Geometry and boundary conditions . . . . . . . . . . . . . . . . . . 565.2.2 Constitutive equations and material parameters . . . . . . . . . . . . 58
5.3 Results . . . . . . . . . . . . . . . . . . . . . . . . . . . . . . . . . . . . . . 605.4 Discussion . . . . . . . . . . . . . . . . . . . . . . . . . . . . . . . . . . . . 65
6. Discussion and conclusions 676.1 Discussion . . . . . . . . . . . . . . . . . . . . . . . . . . . . . . . . . . . . 68
6.1.1 Modeling of fiber-reinforced materials . . . . . . . . . . . . . . . . . 686.1.2 Experimental characterization of human arteries . . . . . . . . . . . 686.1.3 Hydrogel as material for vascular grafts . . . . . . . . . . . . . . . . 696.1.4 Numerical analysis of distensible anastomoses . . . . . . . . . . . . 70
6.2 Conclusions and recommendations . . . . . . . . . . . . . . . . . . . . . . . 70
References 73
A. Matrix representation of tangent stiffness tensor 81
B. Tangent stiffness matrix for composite constitutive equation 83

Contents ix
Samenvatting 85
Dankwoord 87
Curriculum Vitae 89

x Contents

Summary
Replacement or bypass of occluded arterial sections are common practice in clinics nowa-days. In many cases a vascular prosthesis is used to accomplish such interventions. For manyyears synthetic grafts have been used successfully, but success has only been achieved incases involving large diameter blood vessels. For arteries with a diameter less than 5 mm,success rates for synthetic grafts have been low. In those cases, however, autologous material(veins or arteries) has been applied satisfactorily.
There are numerous factors that play an important role in the failure of small diametersynthetic grafts. A commonly found pathology is distal anastomotic intimal hyperplasia. Itis a widespread belief that the compliance mismatch between the graft and the host artery isa major cause of graft failure. Therefore, improvement of the mechanical compatibility be-tween natural arteries and synthetic grafts may lead to better patency rates for small diametersynthetic grafts.
Development of a graft that is mechanically equivalent with a natural artery requires in-vestigation of the mechanics of arteries and possible grafts. Furthermore, a well defined pro-cedure is necessary to obtain design parameters for the graft. Of the many factors involved inthe development of vascular grafts, this work is limited to the mechanical aspects. The possi-ble use of a fiber-reinforced hydrogel as a small diameter graft has formed the starting pointfor further investigation. The hydrogel provides good biocompatible properties, while the ad-dition of fibers will give the graft the desired mechanical properties. The design parametersfor the hydrogel graft are obtained through employment of a mathematical model capable ofdescribing fiber-reinforced materials. The desired properties of the graft are determined bycharacterization experiments on human arterial tissue. With the model it is possible to find aset of parameters which results in a mechanically equivalent hydrogel graft.
The mathematical model plays an important role in the design process. It must be capableto describe fiber-reinforced materials and incorporate parameters usable for manufacturingof the graft. A generalized form allows for a large variety of material models to be used,in particular in-elastic material models. For fiber-reinforced materials, the fiber density is atypical design parameter. The fiber density is introduced as a material parameter using a ruleof mixtures. The latter is adapted to correct for the one-dimensional character of the fiberstress. An updated Lagrange framework is used to implement the model in a finite elementprogram.
Experimental data on human arteries form the input for the graft design. For this purpose,the mechanical properties of two human arteries are determined. The data are obtained usinga setup that is capable of applying a dynamic internal pressure to an arterial segment, whilemeasuring the internal pressure, the axial force and the internal and external diameter. Mea-
xi

xii Summary
surement of the inner and outer diameter is achieved using a ultrasound technique combinedwith a distension estimation algorithm. A numerical model is used to describe the mechani-cal properties of arterial tissue under inflation. Using a constitutive model for fiber-reinforcedmaterials, both the radius and axial force can be described accurately.
Hydrogels are materials consisting of hydrophilic polymer chains that can contain a largequantity of water. In general, these materials exhibit good biocompatible characteristics.A prototype graft is made to gain insight in the construction of a fiber-reinforced hydrogelstructure. To complete the procedure suggested in this work, an initial value for the materialparameters of the hydrogel and fibers is determined by a tensile test on both materials. Re-sults from a numerical model based of the graft prototype, on the material parameters found,match with experimentally obtained data. A fit with the previously acquired experimentaldata on human arteries, resulted in the design parameters of a hydrogel graft which, in thephysiological range, is mechanically equivalent.
Compliance mismatch is seen as a major cause of the forming of intimal hyperplasia atanastomoses. It is suggested that wall stress and wall shear stress may play an importantrole. Numerical studies can provide information on stress and wall shear stress distributions.However, most studies focus on flow dynamics and the distribution of wall shear stresses.In the available studies on wall stress, often linear, isotropic material models are used. Thisstudy shows that the choice of material model has a large influence of the final stress distri-bution. Also, if axial prestrain and residual stress are included, a nonlinear material modelmust be used. The current way of modeling of residual stress posses several problems forthe implementation within a numerical model. The use of adaptation models provide a moresuitable way of modeling residual stress.

Chapter 1
General introduction
Although synthetic grafts are used commonly for surgical procedures, their success has been limited tolarge, high flow arteries. For small-diameter grafts the failure rate is relatively high. This low patency isoften contributed to the mechanical mismatch between the graft and the host artery. It is hypothesizedthat a synthetic graft can be constructed that is mechanically equivalent to the native host artery andthat in such a way patency can be improved significantly. After a short introduction on the morphologyof the arterial wall and the characteristic mechanical properties, a brief overview on existing prosthesesis given. The strategy followed in this study is the one of a fiber-reinforced material for which thebiological properties are determined by the matrix material and the mechanical behavior is mainlydetermined by the fibers and fiber layout. A computational model is used to determine the designparameters for the graft. The objective of this work is given followed by the outline of this thesis.
1

2 Chapter 1
1.1 Introduction
Surgical procedures such as reconstruction of occluded arteries, replacement or bypass ofoccluded sections are common practice in clinics. Often such interventions involve the place-ment of a vascular prosthesis into the arterial system in order to restore blood supply to thedistal tissues. Synthetic vascular grafts, usually made of PET or (expanded)-PTFE (Edwards,1962; DeBakey et al., 1964; Boyce, 1982), have been used routinely for these types of car-diovascular surgery. They have been applied with great success, but only in cases where thereplacement or bypass of large, high blood flow arteries was concerned (Guidoin et al., 1993a;Friedman et al., 1995; Prager et al., 2001). For arteries with an internal diameter of less than5 mm success rates have been low (Charlesworth, 1980). Autologous veins (Andrus et al.,1986; Taheri, 1987), arteries (Faruqi and Stoney, 2000), allografts (Shah et al., 1983) andxenografts (Clarke et al., 2001) have been applied satisfactorily for bypass or replacement ofsmall (peripheral) arteries. However the need for synthetic grafts remains as availability ofsuitable autologous veins may be limited due to lack of quality or they might have been usedin previous interventions.
The reason of failure of small diameter synthetic grafts can not be defined easily as it in-volves numerous mechanisms (Kraiss and Clowes, 1997), which by themselves are not fullyunderstood yet. However, some general considerations can be made. Set aside the conditionsof the host artery, the factors that play an important role in the limited usability of syntheticprostheses can be divided into those related to biological issues (Clowes et al., 1986), themechanical properties of the graft (Abbot et al., 1987) and changed local hemodynamics(Sottiurai et al., 1989). Thrombosis is considered an important cause of failure and a con-siderable effort has been made in improving thrombogenicity of grafts (see Xue and Greisler(2003) for an overview). Another frequently observed pathology is distal anastomotic inti-mal hyperplasia (see Lemson et al. (2000) for a review). It is characterized by growth ofthe intima, which especially in small diameter arteries, may lead to occlusion. Studies onthe location of intimal hyperplasia (Bassiouny et al., 1992; Hofer et al., 1996) has led to thewidespread belief that both hemodynamical and mechanical factors are involved. Regardingthe latter, the compliance mismatch between the graft and the host artery is considered a ma-jor cause of graft failure due to intimal hyperplasia (Abbot et al., 1987; Trubel et al., 1994;Hsu and Kambic, 1997; Melbin and Ho, 1997).
Improving the mechanical compatibility between synthetic grafts and natural arteries isa requirement for well functioning small-diameter prostheses (How et al., 1992). In order toobtain a match of the mechanical properties between artery and graft, an investigation of themechanics of both the artery and the graft is necessary. Furthermore, a well defined procedureto construct such a matching graft is desirable.
1.2 The arterial wall
1.2.1 Morphology
Arteries can be roughly subdivided into two groups according to their structure: elastic andmuscular. Elastic arteries have relatively large diameters and are found in vicinity of the heart.This type of arteries are called elastic as they contain little smooth muscle cells. Musculararteries, however, contain large amounts of muscle cells and in general are located at the

General introduction 3
external elasticlamina
tunica adventitia
smooth musclecellsinternal elasiclaminasmooth muscle +connective tissue
basale membrane
endothelium
vasa vasorumnerve
tunica intima
tunica media
Figure 1.1: Structure of a muscular artery. The three layers, intima, media and adventitia are marked,together with the membranes that separate each layer.
periphery. On a microscopic level the arterial wall consists of three layers which are called(from inside to outside): tunica intima, tunica media and tunica adventitia (see figure 1.1).The properties of each layer are discussed briefly (based on Rhodin, 1980).
Intima The innermost layer consists of a mono-layer layer of endothelium cells separated bya thin basal membrane from the sub-endothelium layer. It is the interface between theblood and the vessel wall. The intima is very thin and its contribution to the overallmechanical properties of the arterial wall is insignificant. However, it plays an impor-tant role in the pathologies found near graft implants: it is the thickening of this layerthat may lead to occlusion of the lumen.
Media The middle layer of the wall consists of a network of elastin and collagen fibers andsmooth muscles cells. The media is separated into several layers by the fenestratedelastic laminae, creating concentric fiber-reinforced layers. The number of laminaepresent decreases towards the periphery and are found absent in small muscular arter-ies. The laminae are interconnected by elastic fibrils which give strength and elasticityto the media. Smooth muscle cells are present within this network and are intercon-nected with the elastin and collagen fibers.
Adventitia The outermost layer comprises only a small part of the arterial wall and mainlyconsists of thick bundles of collagen fibers. It contributes to the strength of the vesseland limits the deformation at high levels of internal pressure.
1.2.2 Mechanical behavior
The overall mechanical behavior is closely linked to the structure previously described. Theelastin in the media bears the load for low pressures, while for higher loads the collagennetwork in the adventitia limits the deformability (Roach and Burton, 1957). This increasein stiffness for higher internal pressure yields that the material behaves strongly nonlinear.

4 Chapter 1
pres
sure
[kPa
]
30
0.450
circumferential strain [-]
Figure 1.2: Typical mechanical response of a rat carotid artery after inflation with internal pressure(after Weizsacker and Pinto (1988).
Figure 1.2 schematically depicts the typical nonlinear relation of arterial tissue when inflatedwith internal pressure. It is generally accepted that the arterial wall can be considered cylin-drically orthotropic (see the early work of Patel and Fry, 1969), although the material princi-pal axes of each layer may vary (Rhodin, 1980).
The smooth muscle cells present are contractile, so the vessel wall behaves active. Alsothe passive behavior is affected by the presence of muscle cells. A number of studies (mainlyon animal subjects) has been performed to assess the contribution of smooth muscle cells toarterial elasticity (Peterson et al., 1960; Dobrin and Rovick, 1969; Yano et al., 1989; Barraet al., 1993). However, the findings have not been conclusive as both an increase as a decreasein elastic modulus have been found. Human studies generally show an increased compliancewhen vasodilator drugs are admitted (Westling et al., 1984; Safar et al., 1987). More recently,Bank et al. (1995) has shown that at constant pressure the compliance increased while theelastic modulus remained unaltered. In this study, however, the smooth muscle component isleft out of the investigation.
Arteries are, like many other biological tissues, regarded incompressible (Carew et al.,1968). Compression experiments on fresh rabbit aortic tissue (Chuong, 1984) have shownthat a small amount of fluid was expelled from the arterial wall. However the fluid within thearterial tissue is not expelled easily and supports the assumption that the arterial wall may beconsidered incompressible. Viscoelasticity of arteries is determined experimentally (Tanakaand Fung, 1974) and is often linked to the presence of smooth muscle cells. However, Murphy(1980) showed that if the smooth muscle cells are considered passive their viscoelasticity maybe neglected.
When an arterial segment is removed from the body it is not stress-free (Chuong andFung, 1986; Fung, 1993; Vossoughi et al., 1993). A ring of arterial tissue that is cut axiallywill spring open. A typical opening angle between the cutted edges can be defined. Thisimplies that under physiological conditions so-called residual stress is present which is com-pressive at the inner wall and of tensile nature at the outer wall. It is believed that underphysiological conditions, the residual stress levels out the circumferential stress distribution
General introduction 5
over the wall.
1.3 History and future of vascular prostheses
The first vascular prosthesis made from a synthetic material was developed 50 years ago(Voorhees et al., 1952). It consisted of a woven textile tube which acts as a skeleton withinblood clots. This yielded a less thrombogenic surface with which the blood becomes in con-tact. Soon other materials such as Teflon (PTFE) and Dacron (PET) were used to producevascular prostheses that were completely non-thrombogenic (Edwards, 1962; DeBakey et al.,1964). In Boyce (1982) expanded PTFE was introduced, which is a strong, high porositymaterial with low thrombogenic properties. The expanded PTFE has become the most com-monly used vascular graft for large diameter arterial bypass or replacement.
The design and development of small diameter vascular grafts is mainly based on the useof polyurethanes. Polyurethanes have low thrombogenicity and in general have a lower stiff-ness than PET or PTFE. Also they are available in a wide range of compositions and a largenumber of manufacturing techniques can be used to produce a graft. A small diameter graftwas produced by Lyman et al. (1977) where they applied a Dacron mesh to a polyurethanetube. Their prosthesis was highly anisotropic, yet the elastic modulus was approximately 10times higher than found for natural arteries.
While materials such as PET and PTFE are successfully used for large-diameter pros-theses, their application to small-diameter grafts has been less successful. Many strategieshave been followed to improve the patency for these types of grafts (see Bos et al. (1998)for an overview of methods used). Numerous modifications have been evaluated, such aschemical modifications, coating (Gosseling et al., 1996; Aldenhoff et al., 2001) and seed-ing of the luminal surface with endothelial cells (Pasic et al., 1996). It has been reportedthat endothelialised PTFE grafts may give a patency rate comparable to that of a vein graft(Meinhart et al., 1997). Current advances in tissue engineering have opened promising waysin small-diameter graft development (Bos et al., 1998; Schmidt and Baier, 2000; Teebkenand Haverich, 2002). Although the biological compatibility dramatically improves, the me-chanical issues remain. This work focuses on the development of synthetic prostheses, butthe knowledge of the mechanics of arteries surely can be used in the development of tissueengineered vascular grafts.
1.4 A small-diameter synthetic prosthesis
An ideal (small diameter) vascular prosthesis should be biocompatible, compliant and possessgood handling and performance at a low cost (How et al., 1992). It is a conduit that, wheninserted into the arterial system, restores the natural blood flow without altering the overallcharacteristics of the arterial tree and that needs to be fully integrated into the biologicalenvironment. These requirements have turned out to be even more critical for small diametergrafts.
As mentioned above, PET and (e)PTFE are the standard polymers used for grafts, yetprimarily for large diameter vessels. In figure 1.3 the stress-strain relation in circumferentialdirection of several vascular prostheses and arterial tissues is given. From this can be seen

6 Chapter 1
5
6
8
7
10
9
100 200
1.0
0.5
0
1234
circumferential strain [%]
circ
umfe
rent
ials
tres
s[M
Pa]
Figure 1.3: Mechanical behavior in circumferential direction of several vascular prostheses and arterialtissues in circumferential direction: 1: PET woven; 2: PTFE woven; 3: PET knitted; 4:PTFE knitted; 5: iliac artery; 6: distal abdominal aorta; 7: femoral artery; 8: proximalabdominal aorta; 9: distal thoracic aorta; 10: proximal thoracic aorta; (after Pietrabissa(1996)).
that the stiffness of PET and PTFE grafts (1-4 in the graph) is much higher than that of arter-ies. Polyurethanes have been the choice of preference for manufacturing of small diametergrafts because of its elastic behavior. Even as of today, new forms of PU have been devel-oped (Eberhart et al., 1999) or coatings have applied to the lumenal surface (Aldenhoff et al.(2001) reports on a Persantin coating on a PU graft). Others have tried to seed, for example,endothelium cells on the inner surface (Ishibashi and Matsuda, 1994; Poole-Warren et al.,1996; Cenni et al., 1997; Lewis et al., 1997) to improve patency.
Although many factors are involved in prosthesis development, this work is limited tothe mechanical aspects of vascular grafts. The investigation is inspired by the possible use ofEGDMA/HEMA hydrogel as a material for small diameter compliant graft. This material hasgood biocompatible properties, but does not have mechanical properties similar to an arteryand lacks strength. Reinforcement with fibers can enhance the mechanical properties. Asthe stiffness of the fibers will be relatively high compared to that of the hydrogel, the overallbehavior of the composite can be altered by changing the fiber properties and fiber layout.Biological factors, such as thrombogenicity, are determined mainly by the matrix material.When a different mechanical behavior of the graft is desired, a change of fiber material orlayout may suffice.
To find the parameters for which the amount of fibers is minimized to obtain a desiredoverall mechanical behavior, a computational model is employed. Using a mathematicalmodel, the mechanical properties of the composite can be predicted. Or reversely: given thepressure diameter relation, the material parameters or fiber layout can be determined whichwill yield the desired mechanical behavior. Using data obtained from experiments of naturalarteries, the design parameters of a possible synthetic, mechanically equivalent graft can befound.

General introduction 7
1.5 Objective and outline
The objective of this study is to develop a procedure for the design of small-diameter vascularprostheses that are mechanically compatible with a native artery, based on a experimentallyvalidated computational model. A mathematical model for the description of the mechanicalproperties of fiber-reinforced structures is proposed in which the fiber density is added as amodel parameter. The constitutive model is implemented with an updated Lagrange formula-tion in a finite element program (chapter 2). The characterization experiments needed to findthe mechanical properties of natural arteries are described in chapter 3. Two arterial speci-men were subjected to a time varying internal pressure. Simultaneously internal and externaldiameter, axial force and pressure are measured. The experimental data found is fitted witha numerical model. In chapter 4 the hydrogel is introduced as a material for vascular graftconstruction. A prototype is used to validate the model. The experimental data from naturalarteries obtained earlier is used to find a set of design parameters yielding a mechanicallyequivalent graft. In chapter 5 a numerical analysis is performed to investigate the influenceof material models and residual stress on the stress distribution at an end-to-side anastomo-sis. The thesis ends with a discussion of the results obtained and recommendations for futureresearch.

8 Chapter 1
Chapter 2
A constitutive model for incompressiblefiber-reinforced materials
Modeling the mechanical behavior of biological tissue such as arteries requires a constitutive modelcapable of describing nonlinear transversely isotropic and time-dependent viscoelastic material under-going large deformations. The Updated Lagrange formulation is found to be a convenient frameworkfor the description of time-dependent materials. In this chapter a description of a constitutive model fortransversely isotropic material within an Updated Lagrange approach is given. First a generalized formfor the constitutive equation is presented and fiber density is introduced as a material parameter (usingthe rule of mixtures). The latter is adapted to take the one-dimensional character of the fiber stress intoaccount. The resulting set of equations is discretized according to the Galerkin method and a mixedformulation is used to incorporate the incompressibility constraint. The convergence of the iterationprocess of the formulation is analyzed and an example on the modeling of arteries is given.
9

10 Chapter 2
2.1 Introduction
In many engineering applications one encounters materials which have direction dependentproperties and show no volume change under deformation. Especially within the field ofbiomechanics there are many examples of these types of materials such as tendons, ligamentsand blood vessels. Arteries are a clear example of a layered structure of which each layerconsists of arranged fibers embedded in soft matrix material. In general these fibers exhibitnon-linear viscoelastic or poro-elastic behavior (Hayashi, 1993). In order to model thesekinds of materials, the use of constitutive models that describe transversely isotropic materialundergoing large deformations and rotations is necessary.
A framework for these types of materials is given in Spencer (1984). The elastic behaviorof the material can be described by a strain energy function. The material symmetry condi-tions can be satisfied by using a suitable set of invariants. In Spencer (1984), besides the threestandard invariants, so-called pseudo-invariants are introduced to incorporate anisotropic ma-terial properties. This theory is widely used for modeling elastic materials and extensionstowards visco-elastic materials have been made (see Holzapfel and Gasser (2001) for a re-cent example). In this theory, the Cauchy stress is expressed in terms of derivatives of theelastic potential or strain energy function and the Finger strain tensor.
Also in this work a constitutive model for fiber reinforced materials is introduced. Theexpression for the Cauchy stress for a transversely isotropic material, however, is written in ageneralized form, in terms of the Finger strain tensor and the fiber stretch, admitting a varietyof constitutive models for the different constituents. For hyperelastic materials a direct linkwith an elastic potential mentioned above can be made. The model is implemented in a finiteelement program using the Updated Lagrange formulation. Incompressibility of the materialis ensured by using a mixed formulation (see Brink and Stein (1996) for details) in whichthe displacements and the hydrostatic pressure are separate variables and are interpolatedaccordingly. The resulting set of equations is solved using an integrated method thus solvingthe coupled displacements and hydrostatic pressure.
An important design parameter for composite materials is the relative amount of fiberspresent in the material. The fiber density can be introduced by applying the rule of mixtures.Traditionally, application of the rule of mixtures to transversely isotropic material yields thatin the directions perpendicular to the fiber direction the material is erroneously weakened asa result of the one-dimensional character of the introduced anisotropy. Therefore we presentan adapted version in which the rule of mixtures is only applied in the fiber direction.
First the constitutive equations for transversely isotropic materials will be treated. Subse-quently the finite element formulation will be derived and expressions for the tangent stiffnessused in the framework will be given. Two examples are presented: first the convergence ofthe iteration process of the formulation used is investigated. The second example deals withthe modeling of the arterial wall.

A constitutive model for incompressible fiber-reinforced materials 11
2.2 Constitutive equation for transversely isotropic material
2.2.1 Kinematics
If the position of a material point in the undeformed configuration �0 is given by the positionvector Ex0, then the deformation of Ex0 into Ex is described by the deformation tensor
F = ( E∇0 Ex)T . (2.1)
In the undeformed configuration �0, the fiber direction is denoted by the unit vector Ee0.Assuming affine deformation, the fiber extension λ and the current fiber direction Ee are relatedto the undeformed vector Ee0 by
λEe = F · Ee0. (2.2)
The fiber stretch λ is obtained from
λ2 = Ee0 · C · Ee0, (2.3)
with C = FT · F the Cauchy-Green strain tensor.
2.2.2 Finite elasticity (hyperelasticity theory)
For a hyperelastic material the stress at each material point can be derived from a scalarfunction. This scalar function is called the strain energy function 9 and is a function ofinvariants of C (Ericksen and Rivlin, 1954; Spencer, 1980), hence 9 = 9(I1, I2, I3) andtwo more invariants incorporating transverse isotropy,
9 = 9(I1, I2, I3, I4, I5), (2.4)
with
I1 = tr(C), I2 =12
[(
tr(C))2
− tr(C2)]
, I3 = det(C) = J 2,
I4 = Ee0 · C · Ee0 = λ2, I5 = Ee0 · C2 · Ee0.
(2.5)
The 2nd Piola-Kirchoff stress and Cauchy stress are derived from the strain energy functionas
S = 2∂9
∂C, σ = J−1 F · 2
∂9
∂C· FT . (2.6)
If we introduce the Finger strain tensor B = F · FT and apply the definition in (2.6), we canwrite for the Cauchy stress
σ = 2J− 12
[
(I292 + J93) I + 91 B − J92 B−1+
I494EeEe + I495(EeB · Ee + Ee · BEe)]
, (2.7)

12 Chapter 2
where 9a = ∂9/∂ Ia, a = 1, . . . 5 has been introduced. When the material is incompressibleJ = 1 and consequently 9 is only a function of I1, I2, I4 and I5. Often the strain energyfunction is written as
9 = 9(I1, I2, I4, I5), (2.8)
where the barred function denotes the elastic potential for an incompressible material. Afterintroduction of a Lagrange multiplier p to ensure incompressibility, the Cauchy stress for atransversely isotropic incompressible material is given by (Spencer, 1984)
σ = −p I + 2[
91 B − 92 B−1 + I494EeEe + I495(EeB · Ee + Ee · BEe)]
, (2.9)
with, similar as above, 9a = ∂9/∂ Ia, a = 1, . . . 5.
2.2.3 Generalized form
The framework used in the previous section is convenient for describing hyperelastic materi-als. A wide range of constitutive models have been developed that are not necessarily basedon a strain energy function. These models can be used if (2.9) is cast into a generalized form.In general, equation (2.9) may be written as
σ = −p I + τ + τ f EeEe + τ f2(EeB · Ee + Ee · BEe), (2.10)
with in case of hyperelasticity
τ = 2(
91 B − 92 B−1), τ f = 2I494, τ f2 = 2I495. (2.11)
In practice it has been shown that the τ f2 term is not needed to describe the most commonfeatures of transversely isotropic material and therefore it is often omitted from the constitu-tive equation. Although not capable to govern all theoretically possible constitutive models,a constitutive equation which sufficiently captures incompressible transversely isotropic ma-terial behavior, can be written as
σ = −p I + τ + τ f EeEe. (2.12)
Now, τ and τ f may be given by any suitable constitutive model for the matrix and the fiber.This generalized form does not put restrictions on the type of constitutive equations used forτ and τ f other than (i) they must satisfy objectivity and (ii) for elastic materials the energydissipation during deformation has to be zero. If, for an elastic material, the hyperelasticitytheory is used, both conditions are automatically satisfied.
Remark: The previous equations can also be derived for more than one fiber family. Anextra fiber family will give an extra term in the form of τ f i Eei Eei with τ f i the fiber stressbelonging to the fiber direction Eei . See also Spencer (1984).
2.2.4 Extended composite constitutive equation (rule of mixtures)
When designing fiber-reinforced composites or when dealing with, for example, remodelingof arterial tissue, it is convenient to control the amount of fibers present in the material without

A constitutive model for incompressible fiber-reinforced materials 13
V f /Vn = V f /V
Figure 2.1: A volume element of which n of the total volume is fibers is represented by a volumeelement with an averaged stress.
changing the material parameters of the components. A simple solution would be to multiplythe fiber stress with a fiber fraction parameter. This would lead to an improper materialstiffness as there is no compensation for the change of material volume. Another method thatcan be used is the mixing theory. This theory describes the overall mechanical behavior as acombination of each individual component.
The mixing theory is based on the principle of interaction of the components with the fol-lowing assumptions: (i) in each infinitesimal volume of a composite material a finite numberof components are present; (ii) each component contributes to the total material behavior inthe same proportion as its volumetric participation; (iii) all components have the same strains(affine deformation or compatibility concept). This theory is studied in Truesdell and Toupin(1960) and Green and Naghdi (1965). According to Truesdell and Toupin (1960) the totalstrain energy of the composite is the addition of the strain energy of the components, hencefor an incompressible material
9(I1, I2, I4, I5) =
N∑
i=1
ni9i(I1, I2, I4, I5), (2.13)
where 9i is the strain energy corresponding to each of the components and n i the volumetricparticipation of the component and N the number of components. The volumetric participa-tion should satisfy the condition
N∑
i=1
ni = 1. (2.14)
This shows that only N − 1 fractions are independent. We remark that the mixing theory isonly valid in the case that all components of the composite are incompressible. If not, thecompatibility condition is violated. The Cauchy stress in the composite then is written as
σ = −p I +
N∑
i=1
ni J−1 F · 2∂9i
∂C· FT (2.15)
Let us address an incompressible material with an isotropic component (matrix) and atransversely isotropic component (fibers). If the volumetric participation of the fibers is nthen we can write for the strain energy function
9(I1, I2, I4, I5) = (1 − n)9m(I1, I2) + n9f(I4, I5), (2.16)

14 Chapter 2
with 9m and 9f the strain energy functions of the matrix and the fibers respectively. Aschematic representation is given in figure 2.1. A volume element that consists of both ma-trix and fiber material is represented by an element with averaged stress. However, as theanisotropic part of the stress is averaged over the total element (continuum approach) anyspatial information regarding the fiber is lost. With this constitutive model the mechanicalbehavior of the composite can be altered without changing the material parameters of theconstituents. Applying (2.15) will give the expression for the Cauchy stress:
σ = −p I + 2[
(1 − n)[
9m1 B − 9m
2 B−1]+ n[
I49f4EeEe + I49
f5(EeB · Ee + Ee · BEe)
]
]
, (2.17)
or in a generalized form (2.10):
σ = −p I + τ + n[
τ f EeEe − τ
]
, (2.18)
where the τ f2 has been omitted. As a consequence of the rule of mixtures, not only the stressin the fiber direction Ee has changed, also the stress perpendicular to Ee has been affected be-cause of the (1−n) term appearing before the isotropic stress. Consequently a reinforcementin the fiber direction may, erroneously, cause a weakening in the directions perpendicular tothe fiber direction. Hence the classical rule of mixtures does not give a satisfactory result aswe want the fiber fraction only to influence the material properties in the fiber direction.
In order to avoid weakening in the directions perpendicular to the fiber direction we applythe mixing rule only in the fiber direction. Therefore the isotropic stress tensor τ within thebracketed term of (2.18) is replaced with the isotropic stress in fiber direction, giving
σ = −p I + τ + n[
τ f − Ee · τ · Ee]
EeEe. (2.19)
From a physical point of view, the previous equation suggests that in the fiber directionisotropic matrix material is replaced by fiber material. As the fibers are modeled as a one-dimensional material (the fiber stress only has one component and no transversal properties),any contribution to the transversal properties of the composite is neglected.
2.3 Finite element formulation
2.3.1 Balance equations
The equation of motion and the continuity equation for an incompressible material definedby the domain � and bounded by 0 = 0u ∪ 0t read:
E∇ · σ = Ef in �, (2.20)J − 1 = 0 in �, (2.21)
with σ the Cauchy stress tensor, Ef a body force per unit volume and J = det(F) the volumechange between �0 and the current configuration �. The set of equations is completed witha set of Dirichlet and Neumann boundary conditions at 0u and 0t respectively, which can bewritten as:
Ex = Exp in 0u, (2.22)
σ · En = Et in 0t, (2.23)

A constitutive model for incompressible fiber-reinforced materials 15
where Ex denotes the position vector, En the outward normal of 0 t and Exp and Et denote theprescribed position and surface traction respectively. The Cauchy stress for an incompressiblematerial is written as
σ = −p I + τ , (2.24)
where p is the hydrostatic pressure and τ the extra stress resulting from deformation.Let Ew and q be weighing functions for respectively the momentum equation and incom-
pressibility constraint, then the weak form of (2.20) and (2.21) is given by:∫
�
( E∇ Ew)T : σ d� = fex ( Ew, Ef , Et) (2.25)
∫
�
q(J − 1) d� = 0 (2.26)
with
fex ( Ew, Ef , Et) =
∫
�
Ew · Ef d� +
∫
0t
Ew · Et d0t (2.27)
representing external loads. Note that the integrals are taken over the current (unknown)configuration � with boundary 0t.
In order to evaluate the integrals, a transformation to a known (reference) configuration,denoted by �r , is required. There are two options available: (i) a transformation back to theundeformed configuration (total Lagrange approach, �r = �0) or (ii) a transformation tothe last known configuration (updated Lagrange approach, �r = �n). See figure 2.2 for aschematic representation. In this work the updated Lagrange approach is used for describingthe deformation of the continuum. Let Fn denote the deformation tensor which describesthe deformation from the initial configuration to the configuration �n at t = tn and F1
describing the deformation from configuration �n to the current configuration, then the tensordescribing the deformation from �0 to the current configuration � at t = tn+1 is given by
F = F1 · Fn with Fn = ( E∇0 Exn)T , F1 = ( E∇n Ex)T , (2.28)
where E∇0 denotes the gradient operator with respect to the initial configuration and E∇n de-notes the gradient with respect to the known configuration �n. Writing the gradient operatoras E∇ = F−c
1 · E∇n yields for the balance equations:∫
�n
( E∇n Ew)T : F−11 · σ d�n = fex ( Ew, Ef , Et) (2.29)
∫
�n
q(J − 1) d�n = 0. (2.30)
Note that it has been used that for an incompressible material Jd�n = d�n. 1
1For an incompressible material the condition J = 1 is valid at a known configuration. However when computingthe (yet) unknown configuration �, this condition is not necessarily true. However, assuming J d�n = d�n doesnot break the theory. Note that, despite the latter, a linearisation of J is used for the incompressibility condition.

16 Chapter 2
Fn
�∗�0
F = F1 · Fn
F1
F∗1
�n
�
t = tn
t = tn+1 after convergence
Figure 2.2: Schematic representation of describing the deformation within an updated Lagrange ap-proach.
2.3.2 Linearisation
The nonlinear set of equations (2.25) and (2.26) is solved using the Newton iteration process.In the updated Lagrange formulation we take the last known (converged) configuration (�n)to be the reference configuration (see 2.3.1 and figure 2.2).
If the exact solution is denoted by Ex , and Ex∗ is an estimate of this exact solution, then theerror δEx in the estimate is given by δEx = Ex − Ex∗. All quantities appearing in (2.29) and (2.30)can be expanded in a similar way, giving
F1 = F∗1 + δF1, σ = σ
∗ + δσ = σ∗ − δp I + δτ , J = J ∗ + δJ. (2.31)
Substitution into the balance equations and neglecting second order terms the linearized bal-ance equations with respect to the reference configuration read:
∫
�n
( E∇n Ew)T :(
δ(F−11 ) · σ
∗ + F∗−11 ·
(
−δp I + δτ + σ∗)
)
d�n = fex ( Ew, Ef , Et)
(2.32)∫
�n
q(J ∗ + δJ − 1) d�n = 0. (2.33)
Note that all unknown quantities now are with respect to the estimation Ex ∗. If δEx is sufficientlysmall, then δ(F−1
1 ) and δJ can be written as:
δ(F−11 ) = −F∗−1
1 · Lδ, δJ = J ∗tr(Lδ), (2.34)
where the abbreviation Lδ = ( E∇δEx)T has been introduced and where E∇ is the gradient oper-ator with respect to the current configuration. The linearized extra stress can be expressed inδEx using δτ = 4M∗ : LT
δ where 4M∗ is determined by the constitutive equation. It is con-venient to rewrite the equations with respect to the most recent estimated configuration �∗
corresponding to position field Ex∗. Similar to Lδ we introduce the abbreviation Lw = ( E∇ Ew)T

A constitutive model for incompressible fiber-reinforced materials 17
which gives for the linearized balance equations with respect to the last known (estimated)configuration
∫
�∗
Lw :(
−Lδ · σ ∗)
+ Lw : 4 M∗ : LTδ d�∗ −
∫
�∗
δp E∇ · Ew d�∗ =
fex ( Ew, Ef , Et) −
∫
�∗
Lw : σ∗ d�∗ (2.35)
∫
�∗
q E∇ · δEx d�∗ = −
∫
�∗
q( J ∗ − 1
J ∗
)
d�. (2.36)
Note that all quantities marked with an asterisk are known and that the gradient operator E∇ istaken with respect to the last known (estimated) configuration �∗. The boundary conditionsgoverned in fex are not included in the linearisation process. The integrands of this term areevaluated on �∗ and 0t∗. The convergence, however, is hardly affected by it. The governingequations of (2.35) and (2.36) irrespective of the choice for the constitutive equation.
2.3.3 Galerkin discretization
In order to obtain a discrete set of equations, the complete domain � is divided into non-overlapping sub-domains �e. Within each element the error in the position field δEx and thecorresponding weighing functions Ew are discretized using the same interpolation function(Galerkin method). These interpolation functions can be gathered in the column N
˜such that
(δEx) j |�e = N˜
T (δx˜ e) j with (δx
˜ e) j the element nodal values and j = x, y, z. A similarprocedure δp and the corresponding weighing functions q yields δp|�e = M
˜T δ p
˜ e with theinterpolation functions stored in M
˜.
Substituting the above expressions into the balance equations results in a discrete set oflinearized equations for a single element �e. As the equations must hold for all weighingfunctions the resulting set of equations can be written, in matrix form, as
S −DT
−D 0
δx˜e
δ p˜ e
=
F˜R˜
(2.37)
with
S =
∫
�e
BT [
6 + C]
B d�e (2.38)
D =
∫
�e
M˜
B˜
Tw d�e (2.39)
F˜
=
∫
�e
N˜
T f˜
d�e +
∫
0e
N˜
T t˜
d0e −
∫
�e
BT σ˜
d�e (2.40)

18 Chapter 2
R˜
=
∫
�e
M˜
(
J−1J
)
d�e. (2.41)
The material stiffness S consists of a part due to the stress present in the material 6 (seeappendix A) and the material stiffness C depending on the choice for the constitutive equa-tion. The B matrix contains the derivatives of the basis functions for Ex . The divergencematrix D originates from the incompressibility constraint and couples the displacement andthe pressure field. It consists of the column M
˜with the basis functions for the pressure and
the column B˜ w with derivatives of the basis function for Ex in the nodal points for p. The right
hand side F˜
contains the stress present in the material and body force f˜
and surface tractionst˜. The right hand side of the incompressibility condition is given by R
˜.
2.3.4 Constitutive equations
Isotropic elastic materials
For isotropic elastic materials the extra stress tensor τ can be written in a general form as
τ = g1(I1, I2)B + g2(I1, I2)B−1 (2.42)
with g1 and g2 scalar functions of the invariants of B. The extra stress tensor is written in anestimate and an error according to τ = τ
∗ + δτ and the tangent tensor can determined bysubstitution of F = F∗ + δF into (2.42).
For sufficiently small δF and when second order terms are neglected, the tangent tensorδτ can be written as
δτ =
[
∂g1
∂ I1tr δB +
12
∂g1
∂ I2
[
tr B∗tr δB − tr(B∗ · δB)]
]
B∗ + g1δB[
∂g2
∂ I1tr δB +
12
∂g2
∂ I2
[
tr B∗tr δB − tr(B∗ · δB)]
]
B∗−1 + g2δB−1,
δB = Lδ · B∗ + B∗ · LTδ ,
δB−1 = −[LTδ · B∗−1 + B∗−1 · Lδ].
(2.43)
Notice that the tangent tensor possesses the required symmetry. The tensor products areevaluated and the components of the tangent tensor can be rearranged such that in matrixform the tangent tensor can be written as δτ
˜= M L
˜with the matrix M the desired tangent
stiffness matrix and L˜
containing the components of Lδ .Often a subclass of the previous constitutive equation is used (Rivlin type materials) for
which the scalar functions g1 and g2 are constant (or in terms of a strain energy function: thesecond derivatives of 9 with respect to the invariants is zero). In this case the tangent tensorreduces to:
δτ = g1[Lδ · B∗ + B∗ · LTδ ] − g2[LT
δ · B∗−1 + B∗−1 · Lδ] (2.44)
Composite material
The derivation of the tangent tensor for a transversely isotropic material follows the sameprocedure: linearisation is carried out by writing the tensor depending on the deformation as

A constitutive model for incompressible fiber-reinforced materials 19
an estimate and an error. The extra stress given by
τ = τ + n[
τ f − Ee · τ · Ee]
EeEe. (2.45)
Substitution of τ = τ∗ + δτ , τ f = τ ∗
f + δτ f , F = F∗ + δF and Ee = Ee∗ + δEe into (2.45) andneglection of second order terms, gives for the tangent tensor
δτ = δτ + n[
τ ∗f − Ee∗ · τ
∗ · Ee∗]
δ(EeEe) + n[
δτ f − δ(
Ee · τ · Ee)]
Ee∗Ee∗, (2.46)
where δτ f is the fiber stiffness and the term δ(
Ee · τ · Ee)
represents the matrix stiffness in thefiber direction. Again (·∗) denotes the known quantities at configuration �∗. For brevity, theasterisk notation is omitted for the remainder of this section, hence all quantities not precededwith δ refer to the values on �∗. The term δ(EeEe) describing the geometric stiffness can bederived by using (2.2) which for sufficiently small δλ yields
δ(EeEe) ≈ λ−2δ(F · Ee0 F · Ee0) − λ−4δ(λ2)F · Ee0 F · Ee0. (2.47)
With the definition of
K = Lδ · EeEe, K = Ee · Lδ · Ee (2.48)
it follows that δ(F · Ee0 F · Ee0) = λ2 (
K + K T )
and δ(λ2) = 2λ2K , hence
δ(EeEe) ≈ K + K T − 2K EeEe. (2.49)
The term δτ f in (2.46) represents the fiber tangent stiffness and can be expressed as:
δτ f = 2∂τ f
∂λ2 λ2K . (2.50)
Consequently, to obtain the fiber tangent stiffness only the partial derivative of the constitutiveequation for the fiber with respect to λ2 needs to be taken. Summarized, the tangent stiffnessof a transversely isotropic composite with incorporation fiber density is written as
δτ = δτ + n[
(
τ f − Ee · τ · Ee)(
K + K T )
− δ(
Ee · τ · Ee)
EeEe+
2[∂τ f
∂λ2 λ2 −(
τ f − Ee · τ · Ee)]
K EeEe]
. (2.51)
Notice that similar to the stress, the tangent stiffness (giving the actual stiffness of the mate-rial) is the weighed sum of the isotropic matrix stiffness and the fiber stiffness. The requiredsymmetry of δτ can be seen directly in the expression given in (2.51). The derivation of thematrix representation can be found in appendix B.
Remark: If the fiber density is omitted, the tangent tensor for the class of materials ofgoverned by the constitutive equation given in (2.12), is found to be (with K and K as definedin (2.51)):
δτ = δτ + τ f(
K + K T )
+ 2(∂τ f
∂λ2 λ2 − τ f)
K EeEe. (2.52)

20 Chapter 2
λz = 1.5
λz = 2
10−12
10−7
10−2
103
1 2 3 4 5 6
ener
gyno
rm
iteration
Figure 2.3: Convergence during the Newton iteration process in case of an isotropic Neo-Hookean ma-terial (dashed) and a anisotropic material (solid) for two load steps of δz = 0.5.
2.4 Examples
The numerical framework and the constitutive equations have been implemented into thesoftware package SEPRAN (Segal, 1984) using a Q2/P1 element with discontinuous pres-sure (Crouzeix-Raviart). This element type uses quadratic interpolation functions for thedisplacement unknowns and linear interpolation functions for the hydrostatic pressure. Thehydrostatic pressure is given by four unknowns, being the value in the centroid and three gra-dients. To demonstrate the capabilities and performance of the constitutive model we havecarried out some numerical simulations. First the convergence is analyzed and an example isgiven in which the arterial wall is modeled as a fiber-reinforced cylinder undergoing inflation.
2.4.1 Convergence of the iteration process
A simple test is performed to check the convergence of the iteration process: on a singleelement the displacement is described and the energy norm of the right hand side is computed.We have taken an element that covers a unit box and with a constitutive equation as in (2.12)with
τ = c(B − I), τ f = k1λ2(λ2 − 1)ek2(λ
2−1)2(2.53)
with c = 1, k1 = 10 and k2 = 0.1. The fiber direction is taken parallel to the direction ofloading (z-direction). The boundary conditions are as follows: along the x = 0 plane, they = 0 plane and z = 0 plane there is no displacement normal to the plane and the node in theorigin has all displacements set to 0. At z = 1 the displacement in z-direction is prescribed.In figure 2.3 the convergence is plotted for the isotropic case (k1 = 0) and the anisotropiccase for two consecutive load steps of δz = 0.5, hence for λz = 1.5 and λz = 2. Clearly,the convergence shows quadratic behavior. The convergence for the second load step is fasteras the displacement with respect to the element size is smaller compared to the first loadstep. After the second load step the deformation is such that λ = 2 and in the fiber directionthe fiber-stress is almost 300 times higher than the isotropic stress. However, the quadratic

A constitutive model for incompressible fiber-reinforced materials 21
unloadedstress-free�0 �r �
loaded
α lL
pi = 0pi
θ r
R2
Ro
Ri
ro
ri
Figure 2.4: Definition of three states of deformation for a thick-walled cylindrical tube including resid-ual strains.
h [mm] β c [kPa] k1 [kPa] k2 [-]
media 0.26 29.0◦ 3.0 2.36 0.84
adventitia 0.13 62.0◦ 0.3 0.56 0.71
Ri = 1.43 mm for α = 160◦
Table 2.1: Dimensions and material parameters for a rabbit carotid artery. Parameters are taken fromHolzapfel (2000).
convergence remains. Hence the framework performs, at least in this case, according to whatcan be expected theoretically.
2.4.2 The arterial wall: a two-layer composite with residual strains
Arteries are a typical example of a layered composite structure. In the past these types ofstructures were modeled as a single material using particular forms for the strain energyfunction to account for anisotropy. Recently a multi-layer constitutive model is proposed(Holzapfel, 2000) where the media and adventitia of the vessel wall are considered as a fiberreinforced composite. Histological information is incorporated in the model using appropri-ate material parameters for the two layers. In the aforementioned work a numerical (non-FEM) model is presented and, in this section, any references to the non-FEM numericalmodel refers to Holzapfel (2000).
The constitutive equations proposed in Holzapfel (2000) can be rewritten in the formgiven in (2.12). This yields for the constitutive equations for the media and adventitia respec-tively
σ j = −p I + τ j +
2∑
i=1
τ f i j Eei j Eei j with (2.54)
τ j = c j (B − I) , τ f i j = 2k1 jλ2i j (λ
2i j − 1)ek2 j (λ
2i j −1)2
(2.55)

22 Chapter 2
where c j , k1 j and k2 j , j = M, A are material parameters and Eei j (with i = 1, 2, j = M, A)are the unit vectors of the fiber directions in the media and adventitia layer. As the fiberscannot take any compressible strains the fiber contribution is taken into account only whenλi j ≥ 1. The fibers are modeled as two symmetrically arranged spirals. Within a Cartesiancoordinate system the unit vectors in the undeformed configuration Ee0i j are expressed in thefollowing column vectors:
e˜01 j =
− cos(β j ) sin(2)
cos(β j ) cos(2)
sin(β j )
, e˜02 j =
− cos(β j ) sin(2)
cos(β j ) cos(2)
− sin(β j )
, j = M, A, (2.56)
with β j the angle between the fibers and the circumferential direction for the media and ad-ventitia and 2 the circumferential coordinate in the stress-free configuration. The dimensionsand material parameters used are given in table 2.1. For further details the reader is referredto Holzapfel (2000).
The three states of deformation are schematically given in figure 2.4. Because the un-loaded state of an artery in general is not stress-free this needs to be included in the determi-nation of the mechanical behavior of the blood vessel. A widely used method is to determinethe opening angle when a specimen is cut axially (Fung, 1993). The resulting open config-uration (state 1) is regarded to be stress-free and is used as the initial computational mesh.The first step in the computation is to apply appropriate boundary conditions to close thetube (state 2), thus introducing stresses and strains in the material in the unloaded state. Themechanical response of the artery during inflation can be determined by applying a naturalboundary condition on the inner surface of the tube (state 3).
The results obtained for three different axial stretches and an internal pressure up to20 kPa are shown in figure 2.5. The solid lines are the results of the FEM numerical sim-ulation and the dashed lines represent the solution of a non-FEM numerical analysis of theinflation of a cylinder. A comparison of the results show that the result using the finite ele-ment method coincides with the non-FEM numerical solution. This allows us to say that theimplementation of a transversely isotropic material model in an updated Lagrange frameworkis successful.
In figure 2.6 results are shown when the extended composite model is used. All solu-tions are for variable n while all other material parameters and geometry parameters are leftunchanged. The results for constitutive equation as in (2.18), which is not corrected for thetransversal properties, are represented by the dashed lines. In case of the corrected modelgiven by (2.19) the results marked with the solid lines are found. Only for the low pressurerange there is a small difference between the solutions. In this example with two fiber layers,the limit for the fiber density is n = 0.50. For a value close to this limit (n = 0.49 for exam-ple) it is not possible to obtain a solution with the standard model, while the modified modelaccording to (2.19) performed without problems. This is caused by the weakening effect ofthe standard model. For values of n close to its limit, the material stiffness in radial directionis reduced to almost zero, which causes numerical problems.

A constitutive model for incompressible fiber-reinforced materials 23
0.0
2.0
4.0
6.0
8.0
10.0
12.0
14.0
16.0
18.0
20.0
0.2 0.4 0.6 0.8 1.0 1.2 1.4
inte
rnal
pres
sure
[kPa
]
inner radius [mm]
λz = 1.5
λz = 1.9
−0.05
0.00
0.05
0.10
0.15
0.20
0.25
0.2 0.4 0.6 0.8 1.0 1.2 1.4
redu
ced
axia
lfor
ce[N
]
inner radius [mm]
λz = 1.5
λz = 1.9
Figure 2.5: Mechanical behavior of a rabbit carotid artery under inflation: numerical simulations usingthe finite element method (solid lines) and non-FEM numerical model (cross-hairs) forλz = 1.5, λz = 1.7 and λz = 1.9. left: pressure vs. radius; right: pressure vs. reducedaxial force
0.0
2.0
4.0
6.0
8.0
10.0
12.0
14.0
16.0
18.0
20.0
0.4 0.6 0.8 1.0 1.2 1.4 1.6
inte
rnal
pres
sure
[kPa
]
inner radius [mm]
n = 0.1
n = 0.49
−0.08
−0.07
−0.06
−0.05
−0.04
−0.03
−0.02
−0.01
0.00
0.01
0.4 0.6 0.8 1.0 1.2 1.4 1.6
redu
ced
axia
lfor
ce[N
]
inner radius [mm]
n = 0.1
n = 0.49
Figure 2.6: Mechanical behavior for fixed axial strain λz = 1.5 for n = 0.1, n = 0.2, n = 0.4and n = 0.49 for the corrected model of (2.19) (solid lines) and standard model of (2.18)(dashed lines).left: pressure vs. radius; right: pressure vs. reduced axial force

24 Chapter 2
2.5 Discussion
The major difference with other work on the modeling of fiber-reinforced materials is thatin this work a generalized constitutive equation, formulated in terms of stress, is used. It isinspired by the results obtained from the hyperelasticity theory. However, it is not limitedto materials models based on a strain energy based formulation. It allows a large varietyof constitutive models (eg. hyper-elastic, visco-elastic, multi-phase) that are not, or can notbe, postulated in terms of a strain energy function, to be used in combination with fiber-reinforcement.
The rules of mixtures seems to be a good approach to incorporate fiber density into theconstitutive model. The straightforward application of the rule of mixtures will lead to a lossof material stiffness perpendicular to the fiber direction. This is due to the one-dimensionalnature of the constitutive law for the fibers. When the rule of mixtures is applied only in fiberdirection, the perpendicular material properties are preserved. Although in the example pre-sented here, the differences in solution between the standard and corrected model are small,the corrected model performs numerically better for higher fiber densities. Application ofthe constitutive model presented in this chapter yields that a change in the material param-eters of the fiber only affects the overall material properties in the fiber direction. The totaldeformation is only changed through the coupling of all directions in the balance equations.
The finite element implementation used in this work is based on an updated Lagrangeapproach in which a changing reference configuration is used opposed to the unchangingundeformed configuration in a total Lagrange approach. The details of both methods arebeyond the scope of this work, but the updated Lagrange method has a benefit which isrelated to the topic of this thesis. Arteries are characterized as being visco-elastic materials.Although in this work arterial tissue is modeled as an elastic material, the future use of visco-elastic models may benefit from an updated Lagrange framework, as it seems a more naturalapproach for dealing with time-dependent constitutive models. For elastic materials, however,there is no clear preference for one method.
The consistent linearisation used has been proven with an example that showed (the max-imum reachable) quadratic convergence of the solution. Hence, the results obtained from theformulation used in this chapter are consistent with those of a classical theory such as thehyperelasticity theory.

Chapter 3
Mechanical characterization and modelingof human arteries
Besides biocompatibility, the compliance mismatch of vascular grafts is believed to influence the pa-tency of vascular prostheses, especially those with small diameter. Consequently, to improve the pa-tency, a graft that is mechanically equivalent to the natural artery would be preferable. To obtain thedesign parameters of such a graft, the mechanical behavior of natural arteries is investigated and anappropriate constitutive model to quantify the results is proposed. The experimental data that definethe mechanical properties are obtained using a setup capable of applying a dynamic internal pressureto a segment of an artery while simultaneously measuring pressure, axial force, diameter and torque.Both inner and outer diameter are measured using an ultrasound technique combined with a distensionestimation algorithm. The constitutive model consists of a transversely isotropic thick-walled cylinderand is capable of incorporating residual stress. The experimental results obtained can be described bythis model and the parameters obtained by a fitting procedure can be used to construct a mechanicallyequivalent graft based on a fiber reinforced matrix material.
25

26 Chapter 3
3.1 Introduction
A proper description of the mechanical properties of arteries is important for research onvascular diseases in general and the development of vascular prostheses in particular. Withrespect to vascular graft development, besides biological issues such as blood- and biocom-patibility, the mechanical properties of the arterial wall play an important role in the patencyof vascular prostheses, especially in the case of small diameter grafts. For large diameterarteries thickening of the intima will not directly lead to failure (sufficient lumen remainsavailable), but for small diameter arteries (with a diameter up to 5 mm), however, stenosisis often found. It has been proposed that the mechanical mismatch between a graft and itshost vessel contributes to the development of intimal hyperplasia (How et al., 1992; Hoferet al., 1996). Hence an improvement of the mechanical match between the host artery andthe vascular prosthesis may reduce intimal hyperplasia and lead to better graft patency.
In order to develop a vascular graft that is mechanically compatible, in this study the me-chanical behavior of natural arteries has been investigated. This is done by performing char-acterization experiments on segments of human arteries. The experimental results obtainedare meant to be used to find a set of design parameters for the vascular prosthesis which willachieve a mechanical behavior matched to the natural artery. Although arterial tissue alsocontains active components (smooth muscle cells) its effect on the total mechanical behavioris kept out of the investigation and only the passive behavior of arteries is considered. This ismainly motivated by the fact that smooth muscle activity and its regulatory mechanism cannot be incorporated in a synthetic vascular prosthesis.
In the past numerous studies have been carried out on a wide range of arterial specimen,for example canine (Cox, 1983; Cox and Bagshaw, 1988), rabbit (Li and Hayashi, 1996), rat(Weizsacker and Pinto, 1988) and human (Gupta and Kasyanov, 1997). Most of the reportedresults are tests on large arteries. Also a wide range of testing methods have been used, butloading a cylindrical arterial segment with an internal pressure has turned out to be the mostreliable method to obtain mechanical parameters for the arterial wall (Hayashi, 1993). InHumphrey et al. (1989) theoretical considerations are given on the design of such setups (seeHumphrey et al. (1993) for experiments). We have realized a experimental setup which isable to measure simultaneously internal and external diameter (giving also wall thickness),transmural pressure, longitudinal force and (optionally) torque of an arterial segment whileundergoing a dynamic (time varying) internal pressure.
In literature many material laws for the passive behavior of arterial tissue have been pro-posed. In Humphrey (1995) a review of a number of constitutive models is given. Mostmodels use a phenomenological approach and describe the mechanical behavior as a macro-scopic system although structure based models have been proposed also (Tozeren, 1984;Wuyts et al., 1995). The mathematical model used in this work is a continuum model of afiber-reinforced incompressible thick-walled tube subjected to an internal pressure. Recentlysuch a model was used in Holzapfel (2000). The constitutive equations describing the me-chanical behavior of the constituents describe transversely isotropic material and are takenfrom chapter 2. The constitutive model used contains a fiber density parameter to describethe volume fraction of fibers present in the material. The parameters in the model are foundby fitting the model results with the experimental data obtained.
In this study we investigate the ability of the model presented to describe the mechanicalbehavior of small arteries and will give the design parameters for a mechanically equivalent
Mechanical characterization and modeling of human arteries 27
unloadedstress-free�0 �r �
loaded
α lL
pi = 0pi
θ r
R2
Ro
Ri
ro
ri
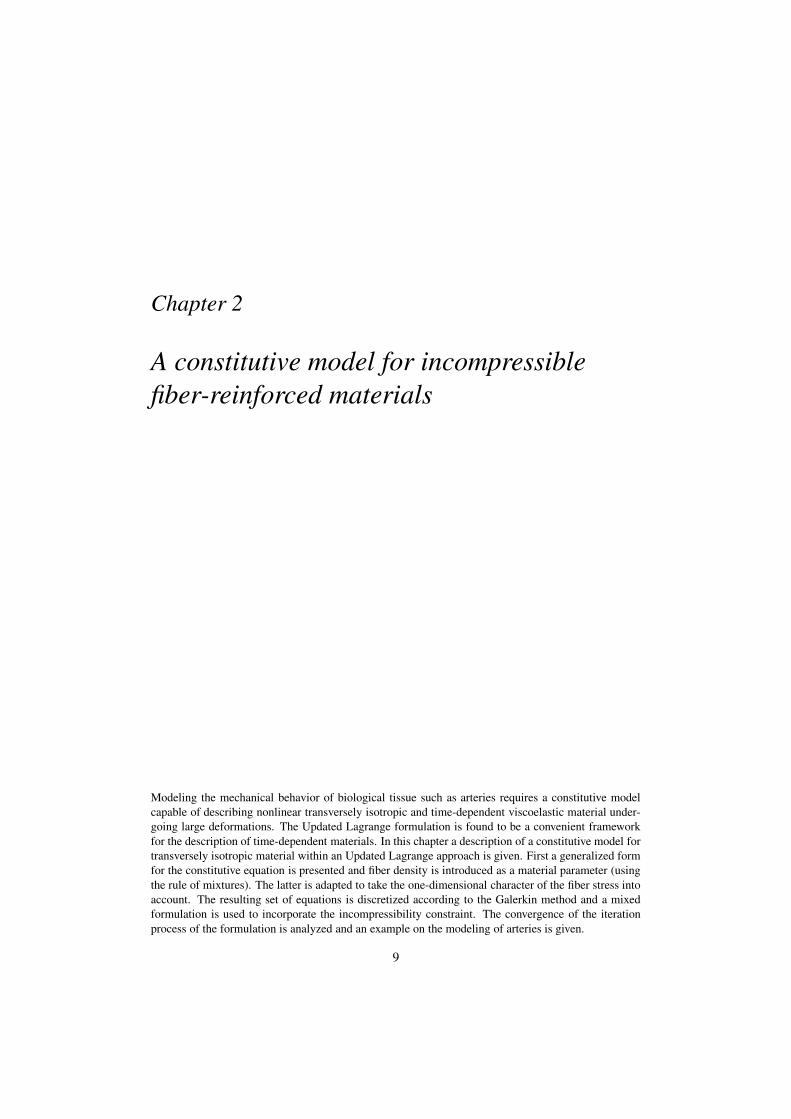
Figure 3.1: Three configurations during the loading of a cylindrical segment: the stress-free referenceconfiguration �0, the (closed) load-free configuration �r and the current (loaded) configu-ration �.
synthetic fiber reinforced vascular prostheses.
3.2 Mathematical model
3.2.1 Kinematics
The artery is considered as an incompressible thick-walled fiber-reinforced cylindrical tubesubjected to internal pressure, axial extension and torsion. It is known that when an artery isremoved from the body and not subjected to any load it is not in a stress-free configuration.This is demonstrated by the observation that an arterial segment will spring open when cutradially (Vossoughi et al., 1993; Fung, 1993). To take this finding into account we assumethat the open configuration �0 is the stress-free reference configuration (see figure 3.1). Theunloaded configuration �r (which represents the state when the artery is removed from thebody) therefore will contain the so-called residual stress. The configuration under loadingis labeled as �. It is assumed that the geometry of the reference configuration �0 can bedescribed by a cylinder. This assumption is often applied to incorporate residual stress intomathematical models although it has been found not to be valid in all cases (Fung, 1993).
The geometry of �0 is defined in cylindrical coordinates (R, 2, Z) by
Ri ≤ R ≤ Ro, 0 ≤ 2 ≤ (2π − α), 0 ≤ Z ≤ L, (3.1)
with Ri and Ro the inner and outer radius respectively, α the opening angle and L the lengthof the undeformed tube. In terms of cylindrical coordinates (r, θ, z) the geometry of � isdefined by
ri ≤ r ≤ ro, 0 ≤ θ ≤ 2π, 0 ≤ z ≤ l, (3.2)
where ri, ro and l denote the inner and outer radius and the length of the deformed tuberespectively.
The position vector Ex of a material point in � can be written as
Ex(r, θ, z) = r Eer(θ) + zEez, (3.3)

28 Chapter 3
with Eer and Eez the unit basis vectors in the radial and axial direction associated with (r, θ, z)and
r =
√
R2 − R2i
kλz+ r2
i , θ = k2 + Z8
L, z = λz Z , (3.4)
with λz = l/L the axial stretch, k = 2π/(2π − α) a measure for the opening angle, ri theinner radius in the deformed configuration and 8 the angle of twist. We remark that (3.4) isderived assuming incompressibility of the material.
Using (3.3), the deformation gradient F can be expressed in cylindrical coordinates as
F = ( E∇0 Ex)T = λr Eer EeR + λθ Eeθ Ee2 + λz Eez EeZ + γλz Eeθ EeZ , (3.5)
with EeR, Ee2, EeZ the unit basis vectors associated with (R, 2, Z) and where the followingstretch ratios have been introduced:
λr =∂r∂ R
=R
rkλz, λθ =
rR
∂θ
∂2=
krR
, λz =lL
, γ = r∂θ
∂z= r
8
l, (3.6)
with λr , λθ and λz the stretches in the radial, circumferential and axial directions respectively.The shear resulting from torsion is represented by γ . The Cauchy Green tensors C = FT · Fand B = F · FT can easily be derived from the previous equation. Note that when there isno twist both strain tensors only have diagonal components and have the same values.
3.2.2 Equilibrium
In the absence of body forces the equilibrium equation reads
E∇ · σ = 0. (3.7)
If axisymmetry is assumed (∂/∂θ = 0) and if we neglect edge effects (∂/∂z = 0) the total setof equations is reduced to one equation (originating from the radial component of the balanceequation) which reads
∂σr
∂r+
σr − σθ
r= 0, (3.8)
where σr and σθ are the Cauchy stress components in the radial and circumferential direc-tions. Using (3.8) and the boundary condition for the outer surface σr |r=ro = 0 we can writefor the stress in radial direction
σr (r) =
ro∫
r
σr − σθ
r ′dr ′, ri ≤ r ≤ ro. (3.9)
By applying the boundary condition for the inner surface σr |r=ri = −pi we can obtain anexpression for the internal pressure:
pi =
ro∫
ri
σθ − σr
rdr. (3.10)

Mechanical characterization and modeling of human arteries 29
For incompressible materials the Cauchy stress in splitted into a hydrostatic part and a dis-tortional part, hence σr = −p + τr and σθ = −p + τθ . Note that the hydrostatic pressurep vanishes from (3.10). The deformation resulting from an internal pressure pi is found bysolving (3.10).
3.2.3 Solution procedure
Only for simple constitutive equations (3.10) can be solved analytically. To maintain thegeneral character of the model, a numerical technique is employed. We define λθ i = kri
Rias
the value of λθ at the inner surface. For a given value of α, λz and 8 the distortional partsof the stress (τr and τθ ) can be written as a function of λθ i and r . Let f be some functiondescribing (σθ − σr ), then (3.10) can be written in a general form as
ro∫
ri
1r
f (λθ i , r)dr − pi = 0, with f (λθ i , r) = σθ − σr . (3.11)
As r is a function of ri only and ri is given in terms of λθ i the only unknown remaining isλθ i . The evaluation of the integral is carried out using a Gaussian integration rule, hence
n∑
j=1
f (λθ i , r j )w j
r j− pi = 0, (3.12)
with w j and r j the weights and the Gaussian integration points and n the order of the inte-gration rule. The previous equation is, in general, non-linear. Therefore a Newton iterationscheme is used to solve (3.12). This gives the following linear equation for λθ i :
n∑
j=1
[
d f
dλkθ i
δλkθ i + f (λk
θ i )
]
w j
r j− pi = 0, λk+1
θ i = λkθ i + δλθ i , (3.13)
with δλθ i the error between the exact solution and the estimation for λθ i . The previousequation can be written in a general form as:
K δλkθ i = −R(λk
θ i ) + pi, (3.14)
with
K =
n∑
j=1
d f
dλkθ i
w j
r j, R =
n∑
j=1
f (λkθ i )
w j
r j. (3.15)
Hence, K is the stiffness obtained by evaluation of d f/dλθ i and R the right hand side ob-tained by the evaluation of f . The iteration procedure is started with λ0
θ i = 1 and iterationsare performed until a stop criterion is met, for example when δλk
θ i has become sufficientlysmall. The exact values for f are determined by the constitutive equation (see 3.2.4). Inthis study the balance equations is solved by dividing the domain into 6 subdomains and usepiecewise quadratic integration with n = 3.

30 Chapter 3
When the deformation is known the axial force N and torque M can be computed using
N = 2π
ro∫
ri
σzrdr, M = 2π
ro∫
ri
σθzr2dr, (3.16)
with σz the Cauchy stress in the axial direction and σθz the shear in the θ − z-plane.
3.2.4 Constitutive equations
The morphology of arteries clearly shows that the arterial wall consists of oriented collagenand elastin fibers embedded in some matrix material. Hence a constitutive model capable ofdescribing fiber reinforced material seems suitable. In chapter 2 such a model is presentedand the constitutive equation is given in a general form by
σ = −p I + τ + n[
τ f − Ee · τ · Ee]
EeEe, (3.17)
with τ and τ f respectively the extra isotropic and fiber stress, n the relative fiber fractionand Ee the current fiber direction. In this constitutive equation the stress perpendicular to thefiber direction is decoupled from the fiber fraction, hence it is assumed that the transversalproperties of the composite are not affected by the presence of the fibers. For the isotropicpart of the stress we use a Neo-Hookean model for which τ is given in terms of the Fingertensor according to
τ = c(B − I), (3.18)
where c is the modulus of the material. Histological analysis shows that in the unloaded statethe elastic lamina are not circular but have a wavy structure. When the artery is loaded, theelastic lamina have been stretched and their wavy structure is no longer present (de Smet et al.,1998). A similar assumption for the bundles of fibers yields that their contribution to the totalstress is negligible until a reference stretch in fiber direction has been reached. However,if this assumption is correct the reference configuration for the fibers is yet undetermined.Furthermore, the fiber stretch depends on the radial position in the wall and the local fiberdirection (which in arteries may vary along the radial coordinate). To reduce complexity thefibrous structures present in the arterial wall are modeled by two symmetrically arranged spi-rals of fibers with nonlinear material properties. The strong nonlinear stress-strain behaviorof arteries is captured by an exponential form for the fiber stress:
τ f = k1λ2[ek2(λ2−1)2
− 1]
, (3.19)
where λ is the fiber stretch, k1 a stiffness parameter and k2 a dimensionless parameter. Ma-terial parameter k1 will determine the initial linear stiffness of the material while k2 mainlydetermines the nonlinearity of the mechanical behavior. As the fibers can only take a tensionforce, their contribution to the total stress is added only when λ > 1. Two fiber directions areneeded, which in the undeformed configuration are described in matrix notation by:
e˜01 =
[
0 cos(β) sin(β)
]T, e
˜02 =[
0 cos(β) − sin(β)
]T, (3.20)

Mechanical characterization and modeling of human arteries 31
with β the angle between the circumferential and axial direction. Furthermore it is assumedthat the fibers are distributed uniformly within the wall, hence there is no radial dependencyin the material properties and the geometry of the fibers. No distinction between the twoseparate fiber families is made, hence no separate constitutive equation or fiber fraction isdefined (fiber fraction is n for each fiber family). Summarizing, the total constitutive behaviorof the arterial wall is governed by:
σ = −p I + c(B − I) +
2∑
i=1
n[
τ f i − Eei · [c(B − I)] · Eei]
Eei Eei , with
τ f i = k1λ2i[
ek2(λ2i −1)2
− 1]
, λ2i = Ee0i · C · Ee0i .
(3.21)
In 3.2.3 the numerical solution procedure was described and a stiffness K and right handside R were determined. The function f needed to compute K and R contain the stresscomponents which are found using (3.21). For γ = 0 (no twist), these components can beexpressed as
σr = −p + c(Br − 1) (3.22)
σθ = −p + c(Bθ − 1) +
2∑
i=1
n[
τ f i − τm] Bθ cos2 β
λ2i
(3.23)
σz = −p + c(Bz − 1) +
2∑
i=1
n[
τ f i − τm] Bz sin2 β
λ2i
, (3.24)
with
Br = λ2r =
R2
k2λ2zr2 , Bθ = λ2
θ =k2r2
R2 , Bz = λ2z , (3.25)
λ2i =
k2r2
R2 cos2 β + λ2z sin2 β, (3.26)
τm =c
λ2i
(
Bθ (Bθ − 1) cos2 β + Bz(Bz − 1) sin2 β
)
(3.27)
and τ f i as given in (3.21), r as given in (3.4) and ri = λθ i Ri/k. Using the previous equationsfunction f and the derivative d f/dλθ i can be determined and K and R can be computedusing (3.15). Note that in the following sections, the subscript i is dropped from the notationfor the internal pressure, hence p refers to internal pressure unless stated otherwise.
3.3 Material and experimental method
3.3.1 Biological material
In this study we have used segments from the human a.axillaris. This artery is relatively easyto reach as it runs superficial and therefore no complex preparation is necessary. Furthermoreit is used in vascular surgery for bypassing arteries in the extremities. The diameter of thesevessels is within the medium range of 4 to 5 mm.

32 Chapter 3
1
6
7
5
8
4
R3 2
9
Figure 3.2: Experimental setup. 1: reservoir, 2: static pump, 3: variable resistance, 4: dynamic pump,5: force transducer, 6: torque transducer, 7: sample, 8: ultrasound transducer, 9: drainage
The samples were obtained within 24 hours after death of the hospital patient. The re-mains were kept at low temperature (approximately 6 ◦C) between the time of death of thepatient and the removal of the artery. After all side branches were tied off a 100 mm longsegment of the artery was removed and tested for leakage. Any remaining side branch wastied off until the leakage stopped. Then on each side a cannula was attached using surgicalsuture wire and the artery was stored in saline solution. After transportation to the laboratorythe specimen was immediately placed in the setup which subsequently is filled with salinesolution which is kept at a temperature of 37 ◦C.
Remark that no additional steps were taken to account for the contribution of smoothmuscle cells to the passive mechanical behavior. Under physiological conditions a certainmuscle tone is present and whether this is still the case in the post-mortem specimen wasnot investigated in this study. Also with the current setup it is not possible to provide aenvironment in which arteries can be kept alive. Therefore we have chosen to work withpost-mortem material for which these conditions are not necessary.
3.3.2 Experimental setup
The experimental device used in this work is schematically presented in figure 3.2. The cen-tral part of the setup is a PMMA container with a removable front cover for easy access. Thiscontainer is filled with saline solution and kept at 37 ◦C using a temperature controlled waterbath (Julabo HC/6). Fluid is added at a continuous rate while a drainage system expels exces-sive fluid, hence maintaining a constant fluid level. Any leakage of fluid from the specimenthat might occur will not cause any increase in fluid level as it is immediately drained fromthe container.
The lower connector is placed through the bottom of the container and connected to aforce transducer (HBM, 1-U1A/10 N). This connection is sealed using a thin PVC membrane,which enables free movement in axial direction and exhibits low bending stiffness. This waythe container is sealed while the error introduced by the sealing is kept to a minimum. The

Mechanical characterization and modeling of human arteries 33
force resulting from the weight of the fluid in the container is accounted for. The placement ofthe force transducer leaves the top of the container open. Note that the axial force measuredis not the true axial force, but the reduced axial force. The latter is defined as F = N −r 2
i πp,with N the axial force as defined in 3.2.3, ri the inner radius and p the internal pressure. Atthe top part of the setup a torque transducer (Haake RV20) is mounted as it must be able torotate freely. The top connector is directly mounted on the transducer which can measure thetorque that may be introduced by inflation of the specimen. However, in this study torquewas not measured yet. This part of the setup can be moved axially in order to restore the axiallength found in-vivo. A steady pump and a piston driven pump provide the pressure withinthe system. The steady pump (Verder 2032) provides a constant flow and the static pressureis controlled by an variable resistance in the flow circuit. Any possible leakage occurringfrom the specimen is compensated by an increased flow towards to specimen. The pistonpump is driven by a servo-motor (Parker ML2304) thus generating the dynamic pressure.The pressure in the system is measured by a pressure catheter (RADI PressureWire 0.014”)which is placed at the entrance of the sample. The pressure is referred to ambient atmosphericpressure and the resulting transmural pressure working on the vessel can be computed usingthe height of the fluid in the container. The pressure transducer is capable of registeringdynamic measurements of the pressure with a bandwidth of 1000 Hz.
Opposed to the traditional method of measuring the outer diameter of the artery with aCCD camera an ultrasound system capable of echo wall tracking and distension estimationis used for real-time diameter measurement (Brands et al., 1999; Shau et al., 1999; Meinderset al., 2001). The major advantage of this technique is the capability to measure both inner andouter diameter (and hence the wall thickness) of the sample. We have used a focused ( f = 30mm) ultrasound transducer (Panametrics V320) which emits bursts of several waveforms witha center frequency fc = 7.5 MHz into one direction. The reflected sound waves are receivedby the probe and a data acquisition system on a Pentium II PC takes care of sampling theincoming RF-signals at a sample-rate of 27 MHz.
The diameter is estimated with an offline algorithm based on a complex correlation func-tion (Brands et al., 1997). The Doppler frequency caused by the reflection of the ultrasoundbeam on the moving wall is estimated. Then from the frequency shift obtained, the veloc-ity of the wall is computed. Integration of the velocity over time gives the distension of thearterial wall during inflation. The accuracy of the velocity estimation method is in the orderof the Doppler frequency, which yields a higher spatial resolution (order 10−2 mm) than theecho tracking algorithm (order of the wavelength of the emitted ultrasound wave).
The method is used for the inner and outer wall independently and subtraction of thesesignals yields the wall thickness on the line of measurement. However any change in wallthickness in circumferential and axial direction cannot be measured using a fixed 1D ul-trasound probe. The average inner diameter with accompanying outer diameter is used tocompute the reference value for the volume of the vessel wall. Using the signals for in-ner and outer diameter the volume of the wall during deformation is computed and dividedby the reference volume to give the vessel wall volume change with respect to the averagedeformation. This allows for verification of the incompressibility assumption.
All incoming transducer signals are amplified by a bridge amplifier (Peekel CA-100) andsampled by the PC which controls the total setup. This PC is also used to generate triggerand synchronization signals for the ultrasound system.

34 Chapter 3
3.3.3 Experimental procedure
Before removal the in-vivo length of the specimen is measured in order to determine theamount of prestrain present in the material. Each side of the sample is mounted on a PVC can-nula using surgical suture wire. After transportation to the laboratory the sample is mountedwithin the container in the setup which subsequently is filled with saline solution of 37 ◦C.The flow system is used to flush the lumen of the vessel to remove air bubbles present in thesystem.
The upper part of the setup is adjusted to obtain the prestrain present in-vivo. The staticinternal pressure is applied by setting the variable resistance in the flow circuit. Engaging theservo-motor gives the dynamic load needed for the experiment. The internal pressure, axialforce and internal (and possibly external) diameter are measurement during 10 cycles.
As the opening angle (Fung, 1993) of the artery can only be determined when the sampleis cut the determination of the reference configuration is carried out after the performing theexperiment. A ring of material is cut from the artery and its inner diameter and wall thicknessis measured using a CCD camera. Then the ring is cut axially and the radii and opening angleare measured.
3.4 Results
The number of arteries investigated is rather limited. Only 2 samples have been characterizedusing the experimental setup. Furthermore, the samples are post-mortem material which maygive a stiffer material than fresh specimen.
3.4.1 Residual stress
The axial stretch to obtain in-vivo length has a value of 1.17 for sample 1 and 1.14 for sample2 respectively These values are considerably lower than values found in literature (up to 1.5).This may be due to the fact that the samples used are post mortem arteries and not freshspecimen. The unloaded (not stress-free) geometry for sample 1 had an internal radius of1.99 ± 0.01 mm and a wall thickness of 0.64 ± 0.01 mm. Sample 2 had a slightly largerinternal radius and wall thickness being 2.22 ± 0.01 mm and 0.75 ± 0.01 mm respectively.When cut axially both vessels opened but did not form a circular section. Therefore it wasimpossible to determine an opening angle conforming the definition presented in figure 2.4.Any attempt to do so would not have been a good representation of the residual stress presentin the artery.
3.4.2 Mechanical behavior
The experimentally obtained data for pressure and axial force are filtered with a low passfilter with a cut-off frequency of 25 Hz to filter the noise sampled during the experiment. TheRF-data measured by the ultrasound system was processed offline and a temporal and spatialestimation window of 1 ms and 400 µm respectively was applied. The pressure-diameterrelation obtained (figure 3.3) shows the mechanical response to inflation which is typicalfor arterial tissue. Note that only the physiological range has been measured. The materialexhibits stiffening for increasing deformation. Clearly noticeable is the difference between
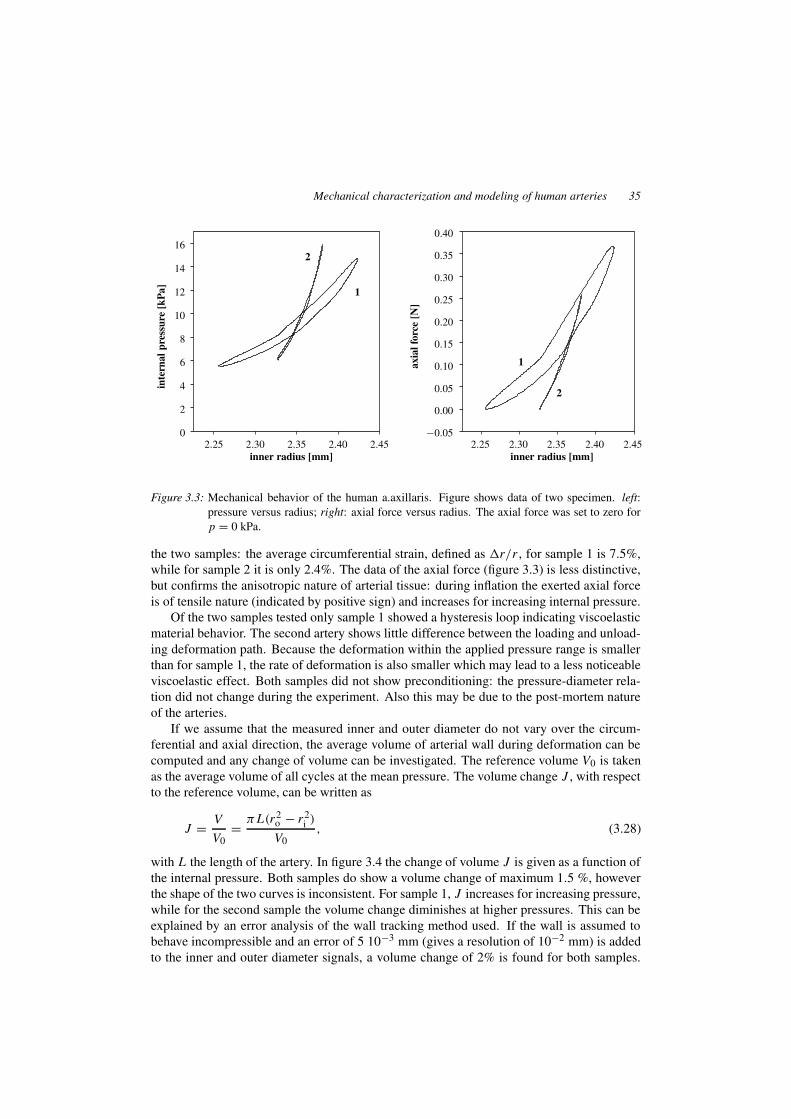
Mechanical characterization and modeling of human arteries 35
0
2
4
6
8
10
12
14
16
2.25 2.30 2.35 2.40 2.45
inte
rnal
pres
sure
[kPa
]
inner radius [mm]
1
2
−0.05
0.00
0.05
0.10
0.15
0.20
0.25
0.30
0.35
0.40
2.25 2.30 2.35 2.40 2.45
axia
lfor
ce[N
]
inner radius [mm]
1
2
Figure 3.3: Mechanical behavior of the human a.axillaris. Figure shows data of two specimen. left:pressure versus radius; right: axial force versus radius. The axial force was set to zero forp = 0 kPa.
the two samples: the average circumferential strain, defined as 1r/r , for sample 1 is 7.5%,while for sample 2 it is only 2.4%. The data of the axial force (figure 3.3) is less distinctive,but confirms the anisotropic nature of arterial tissue: during inflation the exerted axial forceis of tensile nature (indicated by positive sign) and increases for increasing internal pressure.
Of the two samples tested only sample 1 showed a hysteresis loop indicating viscoelasticmaterial behavior. The second artery shows little difference between the loading and unload-ing deformation path. Because the deformation within the applied pressure range is smallerthan for sample 1, the rate of deformation is also smaller which may lead to a less noticeableviscoelastic effect. Both samples did not show preconditioning: the pressure-diameter rela-tion did not change during the experiment. Also this may be due to the post-mortem natureof the arteries.
If we assume that the measured inner and outer diameter do not vary over the circum-ferential and axial direction, the average volume of arterial wall during deformation can becomputed and any change of volume can be investigated. The reference volume V0 is takenas the average volume of all cycles at the mean pressure. The volume change J , with respectto the reference volume, can be written as
J =VV0
=π L(r2
o − r2i )
V0, (3.28)
with L the length of the artery. In figure 3.4 the change of volume J is given as a function ofthe internal pressure. Both samples do show a volume change of maximum 1.5 %, howeverthe shape of the two curves is inconsistent. For sample 1, J increases for increasing pressure,while for the second sample the volume change diminishes at higher pressures. This can beexplained by an error analysis of the wall tracking method used. If the wall is assumed tobehave incompressible and an error of 5 10−3 mm (gives a resolution of 10−2 mm) is addedto the inner and outer diameter signals, a volume change of 2% is found for both samples.
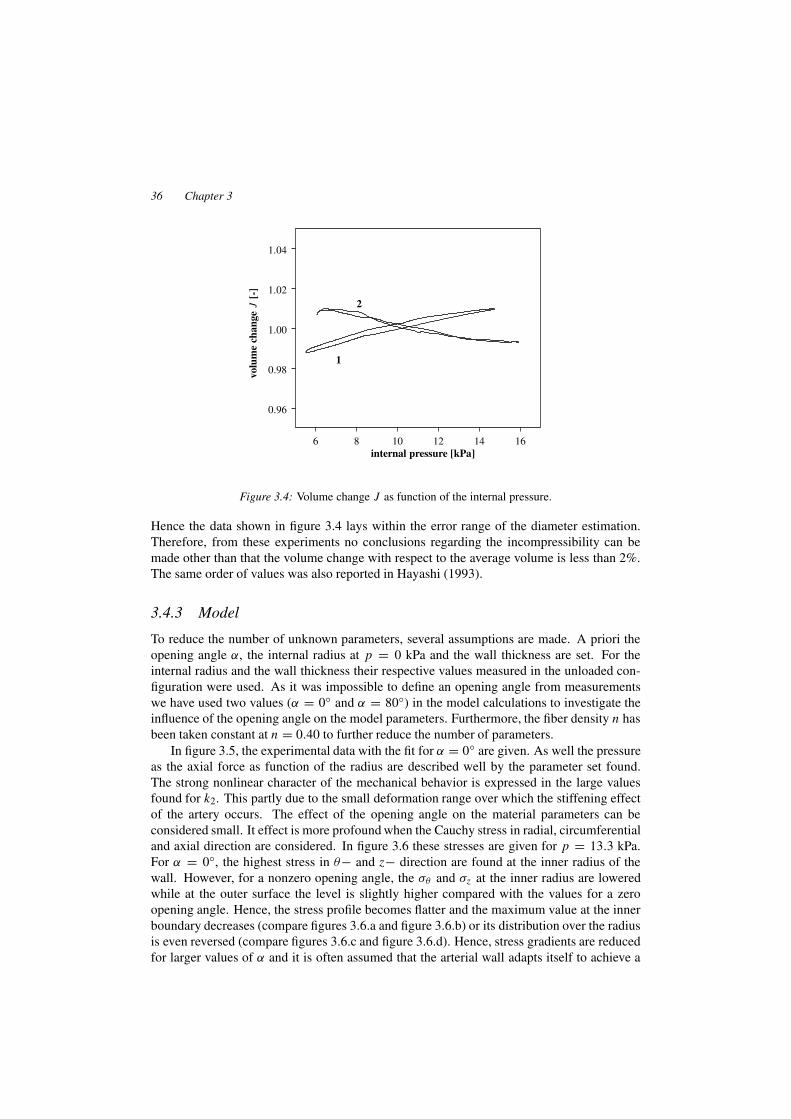
36 Chapter 3
0.96
0.98
1.00
1.02
1.04
6 8 10 12 14 16
volu
me
chan
geJ
[-]
internal pressure [kPa]
1
2
Figure 3.4: Volume change J as function of the internal pressure.
Hence the data shown in figure 3.4 lays within the error range of the diameter estimation.Therefore, from these experiments no conclusions regarding the incompressibility can bemade other than that the volume change with respect to the average volume is less than 2%.The same order of values was also reported in Hayashi (1993).
3.4.3 Model
To reduce the number of unknown parameters, several assumptions are made. A priori theopening angle α, the internal radius at p = 0 kPa and the wall thickness are set. For theinternal radius and the wall thickness their respective values measured in the unloaded con-figuration were used. As it was impossible to define an opening angle from measurementswe have used two values (α = 0◦ and α = 80◦) in the model calculations to investigate theinfluence of the opening angle on the model parameters. Furthermore, the fiber density n hasbeen taken constant at n = 0.40 to further reduce the number of parameters.
In figure 3.5, the experimental data with the fit for α = 0◦ are given. As well the pressureas the axial force as function of the radius are described well by the parameter set found.The strong nonlinear character of the mechanical behavior is expressed in the large valuesfound for k2. This partly due to the small deformation range over which the stiffening effectof the artery occurs. The effect of the opening angle on the material parameters can beconsidered small. It effect is more profound when the Cauchy stress in radial, circumferentialand axial direction are considered. In figure 3.6 these stresses are given for p = 13.3 kPa.For α = 0◦, the highest stress in θ− and z− direction are found at the inner radius of thewall. However, for a nonzero opening angle, the σθ and σz at the inner radius are loweredwhile at the outer surface the level is slightly higher compared with the values for a zeroopening angle. Hence, the stress profile becomes flatter and the maximum value at the innerboundary decreases (compare figures 3.6.a and figure 3.6.b) or its distribution over the radiusis even reversed (compare figures 3.6.c and figure 3.6.d). Hence, stress gradients are reducedfor larger values of α and it is often assumed that the arterial wall adapts itself to achieve a

Mechanical characterization and modeling of human arteries 37
0
5
10
15
20
1.80 1.90 2.00 2.10 2.20 2.30 2.40 2.50
inte
rnal
pres
sure
[kPa
]
inner radius [mm]
1
2
−0.20
−0.10
0.00
0.10
0.20
0.30
0.40
0.50
0.60
1.80 1.90 2.00 2.10 2.20 2.30 2.40 2.50
axia
lfor
ce[N
]
inner radius [mm]
1
2
α c [kPa] k1 [kPa] k2 [-] β
sample 1
Ri = 1.99 mm, h = 0.64 mm, λz = 1.17 0◦ 52.8 0.60 37.7 46.2◦
Ri = 2.65 mm, h = 0.64 mm, λz = 1.17 80◦ 53.0 0.48 42.9 46.4◦
sample 2
Ri = 2.22 mm, h = 0.75 mm λz = 1.14 0◦ 35.5 2.0 100 38.1◦
Ri = 2.96 mm, h = 0.75 mm λz = 1.14 80◦ 35.5 2.1 109 38.1◦
Figure 3.5: Pressure diameter relation measured (solid lines) and computed after fitting of the math-ematical model (dashed lines) for p from 0 to 20 kPa and α = 0◦. The table shows theparameters obtained for n = 0.40.

38 Chapter 3
0
25
50
75
100
125
150
175
200
225
250
0.00 0.10 0.20 0.30 0.40
Cau
chy
stre
ss[k
Pa]
r − ri [mm]
α = 0.0◦
(a)
σrσθσz
0
25
50
75
100
125
150
175
200
225
250
0.00 0.10 0.20 0.30 0.40
Cau
chy
stre
ss[k
Pa]
r − ri [mm]
α = 80.0◦
(b)
σrσθσz
0
25
50
75
100
125
150
175
200
225
250
0.00 0.10 0.20 0.30 0.40 0.50
Cau
chy
stre
ss[k
Pa]
r − ri [mm]
α = 0.0◦
(c)
σrσθσz
0
25
50
75
100
125
150
175
200
225
250
0.00 0.10 0.20 0.30 0.40 0.50
Cau
chy
stre
ss[k
Pa]
r − ri [mm]
α = 80.0◦
(d)
σrσθσz
Figure 3.6: Cauchy stress σr , σθ and σz in the radial, circumferential and axial direction over the wallthickness at p = 13.3 kPa. (a) and (b): sample 1, (c) and (d): sample 2. Material parametersand geometry are taken from the table in figure 3.5.

Mechanical characterization and modeling of human arteries 39
uniform circumferential stress over the wall. When investigating the stress distribution, anaccurate determination of α is necessary.
3.4.4 Comparison with values from literature
Values for the compliance found in these experiments are compared with the work of West-erhof et al. (1969). If a quadratic approximation of the pressure-area relationship is assumed(Stergiopulos et al., 1992), then the compliance becomes a linear function of the pressure andcan be written as
C =∂ A∂p
= A0(
C ′0 + 2C ′
1(p − p0))
, (3.29)
with p0 a reference pressure. For p0 = 13 kPa the coefficients C ′0 and C ′
1 are computedfor the range 6 < p < 18 kPa. For these experiments the following values are found: forthe first sample C ′
0 = 1.9 10−2 kPa−1, C ′1 = −1.6 10−3 kPa−2, and for the second C ′
0 =
8.5 10−3 kPa−1, C ′1 = −4.9 10−4 kPa−2. From the value for the volumetric compliance
given in Westerhof et al. (1969), C ′0 can be computed by using C ′
0 = Cvol/(L A0) and with thegiven segment length and internal radius this yields C ′
0 = 2.8 10−2 kPa−1. Hence the value ofC ′
0 for the first sample in this work is approximately 30% less than obtained from Westerhofet al.. For the second sample it is approximately three times smaller. Lower values for C ′
0can be expected as post-mortem material is used in this study, but the order of magnitudematches. Values regarding the non-linear compliance are not given in the aforementionedwork, which makes a full comparison difficult.
3.5 Discussion
The setup used is suitable for measuring the mechanical properties of arteries. The use ofan ultrasound probe has added the possibility to measure inner and outer diameter simultane-ously. The spatial resolution has been improved with the application of a velocity estimationalgorithm and a more accurate determination of the vessel diameter can be made comparedto a standard wall tracking algorithm.
The measurement of inner and outer diameter can provide information about the incom-pressibility of the arterial wall. However, the error in the diameter estimation was too largeto provide accurate data on incompressibility. Analysis has shown that the maximum volumechange does not exceed 2%. It confirms earlier findings that the arterial wall can be consid-ered incompressible. The spatial resolution can be increased by using a probe with a higherfrequency or a intravascular probe. The latter may increase accuracy as it is able to measurealong the circumference of the vessel.
In this study we have used arteries which were not fresh and can not be considered asliving tissue. The choice for post-mortem tissue is lead by the fact that testing on fresh speci-men requires a condition system that is integrated with the setup in order to maintain a stablephysiological environment for survival of the artery. The presence of smooth muscle cells hasbeen neglected in this study, i.e. no precautions have been taken to eliminate a possible stresstonus present. This might have yielded a too high a stiffness measured. Two samples havebeen used in this study. This is too low a number to provide statistically significant data, but it

40 Chapter 3
does provide an indication of the characteristics of arteries. More studies on natural arteries,preferably fresh specimen, are needed to provide more information on bioligical diversity.
The mathematical model is capable of describing both the radius and axial force of anartery under inflation. The fibrous structure present in the arterial wall is captured with twofiber layers (symmetrical helices) with nonlinear material behavior. Modeling of separatelayers (e.g. media and adventitia) can provide more detailed information on the stress distri-bution in the wall, it is not necessary to capture the macroscopic behavior.
The influence of the opening angle on the material parameters found for the model wassmall. However, the computed stress levels are homogenized over the wall when residualstresses are taken into account. Therefore an accurate determination of the residual stress isnecessary when investigating stress levels in the arterial wall. In this work, the configurationfound after the arteries were cut radially did not match with the (assumed) stress-free con-figuration and an opening angle could not be determined. Therefore the assumption that thestress-free state of the artery can be described by a cylindrical geometry is too limiting andan other method is necessary.

Chapter 4
Mechanics of fiber-reinforcedHEMA/EGDMA hydrogel
Hydrogels are materials consisting of a network of hydrophilic polymers that can contain a large amountof water. As these materials have, in general, good biocompatible characteristics, they could be usedto design and produce small diameter compliant grafts. To obtain the proper mechanical properties andstrength, however, the material must be reinforced with fibers. In this study, a mathematical model isused to predict the overall mechanical behavior based on the mechanical properties of the gel matrixand fibers used for reinforcement. A prototype graft is made and experimental data are compared withthe results from the mathematical model. An optimized fiber layout and fiber parameters are determinedby fitting the model to experimental data obtained from natural arteries.
41

42 Chapter 4
4.1 Introduction
Replacement of diseased arteries with synthetic vessels is common clinical practice. The in-terventions, however, have been limited to relatively large-diameter high-flow arteries such asthe aorta, iliac and femoral arteries. The use of synthetic vessels for small diameter (less than5 mm) artery replacement is not so common as low patency rates are found in clinical testing(Charlesworth, 1980). In small diameter prostheses often intimal hyperplasia occurs whichleads to failure of the graft. Anastomotic hyperplasia not only occurs using synthetic vesselsbut also manifests itself in grafts from mammary veins and arteries as well autologous veinsand arteries. It has been suggested that this complication results partially from mechanicalmismatch between the graft and the host artery (Abbot et al., 1987). Furthermore, alteredhemodynamics may contribute to narrowing of small diameter arterial reconstructions.
Many studies to potentially improve the patency can be found. They address porosityand structure of grafts (Guidoin et al., 1993a,b; Gupta and Kasyanov, 1997), enhancing cellin-growth (Holt et al., 1994) and seeding of endothelial cells on the luminal surface of thegraft (Ishibashi and Matsuda, 1994; Cenni et al., 1997; Lewis et al., 1997). Nowadays, tis-sue engineering offers new possibilities and materials of natural origin are used to developvascular prostheses (Schmidt and Baier, 2000). Commonly used materials for the fabricationof synthetic grafts are PET, PTFE (in woven or knitted structures) and polyurethanes. An-other class of materials, already widely used within the biomedical field, are hydrogels (seelandmark paper by Wichterle and Lim, 1960). Hydrogels are a network of hydrophilic poly-mers held together by cohesive forces such as covalent bonds and hydrogen bridges. Thesenetworks are capable of retaining large quantities of water within their polymeric structure.Many applications can be found, such as drug delivery systems and medical devices (Peppas,1987) and composite structures serving as replacements for ligaments, tendons, intervertebraldiscs (Ambrosio et al., 1996, 1998) and skin (Young et al., 1998).
Because of their good biocompatible characteristics (Park and Park, 1996), a HEMA hy-drogel could be used for the construction of a compliant graft with small diameter. However,hydrogel by itself does not possess sufficient strength and has isotropic material properties.In this study the proper mechanical properties are obtained by incorporation of polymericfibers. The objective of this work is to design a fiber-reinforced hydrogel graft, which me-chanical properties matches with those of natural arteries, using a mathematical model forthe determination of a proper hydrogel configuration and fiber layout.
First the construction of a fiber-reinforced hydrogel tube is investigated. A tensile testis used to determine the order of magnitude for the material parameters of the hydrogel andthe fibers. The hydrogel tube is inflated dynamically using the setup described in chapter 3and the time-dependent pressure, radius and axial force are measured. The experimentalresults are compared with the results found by a mathematical model of the composite. Sub-sequently, the procedure can be reversed: data from characterization experiments on naturalarteries are used to find the fiber properties and layout to closely match the mechanical be-havior of the artery considered.

Mechanics of fiber-reinforced HEMA/EGDMA hydrogel 43
4.2 Materials and methods
4.2.1 Preparation of the composite
A solution of the monomers 2-hydroxyethylmethacrylate (HEMA) and sodiummethacrylate(NaMA), crosslinker ethylene glycol dimethacrylate (EGDMA) and initiator 2,2’-Azobis(2-methylpropion-amidine)dihydrochloride (all purchased from Merck) are mixed, at room tem-perature, in the moll ratio 20:1:10:1. Distilled water forms the remaining 68% of the solution.The mixture is stirred in order to dissolve all constituents. The graft is built up out of threelayers. A polyethylene (PE) cylindrical tube with an outer diameter of 2.42 ± 0.01 mm isused as the inner mold for the prosthesis. A stiff metal rod is inserted into the tube to preventbending. The tube with metal insert is subsequently placed into a second PE tube with aninternal diameter of 3.00 ± 0.01 mm. The two tubes are centered using special end stops andmonomer solution is poured into the gap between the two PE tubes. The whole assembly isclosed and placed into a polycarbonate (PC) cylinder in order to keep the tubes straight. Themold is placed into a waterbath and the temperature is increased from 20 ◦C up to 80 ◦C ata speed of 2.5 ◦C/min. Ninety minutes after being placed in the waterbath, the mold is takenout and disassembled by removing the PC cylinder and destroying the outer PE tube.
The (air dried) polymerized inner layer is mounted in a fiber winding machine and fibersare wound helically with the desired winding angle. In this study, Lycra fibers (DuPont) of17 dtex (diameter 50 µm) are used. Lycra is an elastic polyurethane material and a singlefiber consists of several smaller filaments wound together.
A similar procedure as for the inner layer is performed to form the third layer. The fibercovered hydrogel is placed in a PE tube with an internal diameter of 3.88 ± 0.01 mm. Aftercentering of the tube, it is filled with monomer solution and cured in the waterbath for 90minutes at 80 ◦C similar to the procedure used for the inner layer. After removal of themold, the hydrogel tube is placed in 0.15 M NaCl solution. After swelling the inner mold isremoved.
4.2.2 Biocompatibility
The addition of Lycra fibers may have affected the biocompatibility of the hydrogel. There-fore a cytotoxicity test on the composite is performed. For reference first both hydrogel andLycra fibers are tested separately. A direct contact test was used for the fibers and a MEM ex-tract test was used for the graft. Both test were performed for the HEMA/EGDMA hydrogel.
For a direct contact test, a monolayer of mouse lung fibroblasts (L929) was grown to70-80% confluency. Samples of hydrogel and fibers were positioned into a Milli-Cell systemon top of the monolayer. After exposure to the samples for 72 hours at 37◦C, the cells wereexamined microscopically and scored for cytotoxic effects: zone of affected cells, degree offloating cells and change in cellular morphology. The qualitative scores were corrected forthe negative control (UHMW polyethylene). Also inhibition of cell proliferation, establishedby a quantitative cell count at 72 hours, was scored and corrected for the negative control.Pararubber was used as positive control in the test.
For a MEM extract test, a monolayer of mouse lung fibroblasts was challenged with anextract of the composite or the hydrogel, the negative control (UHMW polyethylene), thepositive control (pararubber) and with medium only. After exposure to the extract for 72

44 Chapter 4
unloaded�r �
loadedstress-free
�0
lpi = 0pi
ro
ri
θ rr∗
Ro
α
isotropicanisotropic
h∗L
2 Ri
Figure 4.1: Three configurations during the loading of a cylindrical segment: the stress-free referenceconfiguration �0, the (closed) load-free configuration �r and the current (loaded) config-uration �. The wall is radially divided into three layers: one anisotropic layer surroundedby two isotropic layers. The radial coordinate of the center of the anisotropic layer, withthickness h∗, is defined as r∗.
hours at 37◦C, the medium was removed. The cells were examined and scored on confluencyof the monolayer and change of cellular morphology. The qualitative scores are corrected forthe negative control. Subsequently, MTT, a water soluble tetrazolium salt solution, was addedto the culture. Only active mitochondrial dehydrogenases of living cells will convert MTTinto a insoluble purple formazan dye. The cultures were incubated for 3 hours at 37◦C. Thecells were lysed and the precipitated formazan was dissolved. The formazan concentrationswere quantitatively determined by measuring the optical density.
4.2.3 Mathematical model
The graft is modeled as a thick-walled cylinder with transversely isotropic material properties.It is assumed that no fluid is expelled from the hydrogel. Because of its large water content,the hydrogel matrix can be considered incompressible. The derivation and the solution of thebalance equations are extensively discussed in chapter 3.
To represent the structure of the hydrogel graft, the wall is divided into three layers: anisotropic inner and outer layer and an anisotropic fiber layer in the middle. The thicknessof the anisotropic layer is denoted by h∗ and its center is given by the radial coordinate r ∗,see figure 4.1. The constitutive equations governing the material behavior can be written assuggested in chapter 2:
σ = −p I + τ for
{
ri < r < r∗ − 12h∗
r∗ + 12h∗ < r < ro
σ = −p I + τ +
2∑
k=1
n[
τ f − Eek · τ · Eek]
Eek Eek for r∗ − 12h∗ < r < r∗ + 1
2h∗,
(4.1)
with h the wall thickness, p the hydrostatic pressure, τ the isotropic (matrix) stress. The

Mechanics of fiber-reinforced HEMA/EGDMA hydrogel 45
anisotropic stress is determined by the fiber stress τ f , the current fiber direction Ee and fiberdensity n. We remark that the fiber density used here is defined with respect to the volumeof the anisotropic layer and not with respect to the total volume of the graft. The fibersare modeled as two symmetrically arranged spirals. The unit vectors Ee0k, k = 1, 2 in theundeformed configuration can be expressed in the following column vectors:
e˜01 =
[
0 cos(β) sin(β)
]T, e
˜02 =[
0 cos(β) − sin(β)
]T, (4.2)
with β the angle between the fibers and the circumferential direction.
4.2.4 Tensile test
A tensile test is used to determine the order of magnitude of the material properties of thehydrogel and the fibers. A statistically valid method is not adopted here, as statistic accuracyis not the primary interest. However, it enables the completion of the procedure towards thedesign of a hydrogel graft.
A slice of hydrated hydrogel was placed in the test machine (Zwick Z-11) and the samplewas stretched with a speed of 10 mm s−1 up to λ = 1.30 and subsequently unloaded. Asimilar test was performed with a single Lycra fiber, however the sample was loaded untilrupture. The Cauchy stress is computed from σ = F/A with F the tensile force and A thecross-sectional area of the sample. As A changes during deformation, its value is computedusing the assumption that the material behaves incompressible, hence A = A0/λ, with A0the initial cross-sectional area and λ = l/L the stretch ratio.
4.3 Results
4.3.1 Biocompatibility
The results of the cytotoxicity test are given in figure 4.2. Microscopic images show thefibroblast monolayer after exposure and quantitative results are given in the table in the figure.For reference the values for the negative and positive control are also given. The substantialamount of cell growth inhibition indicates that Lycra fibers are mild cytotoxic. The hydrogelcan be considered non-cytotoxic, although a small amount of inhibition of growth and cellmetabolism was found. The MEM extract test on the hydrogel graft indicates that, when theLycra fibers are fully embedded into the hydrogel matrix, the cytotoxicity of the material isnot altered. Hence, the fiber reinforced hydrogel graft has cytotoxicity properties similar toplain hydrogel, under the condition that the fibers are fully embedded and direct contact oftissue with the fibers is avoided.
4.3.2 Mechanical properties
Hydrogel
Three specimen (size 12 mm by 5 mm) were cut from the fiberless ends of the swollenhydrogel graft. Figure 4.3 shows the relation between the Cauchy stress and the stretch ratioup to λ = 1.30. The variation found is due to differences between the individual samples used
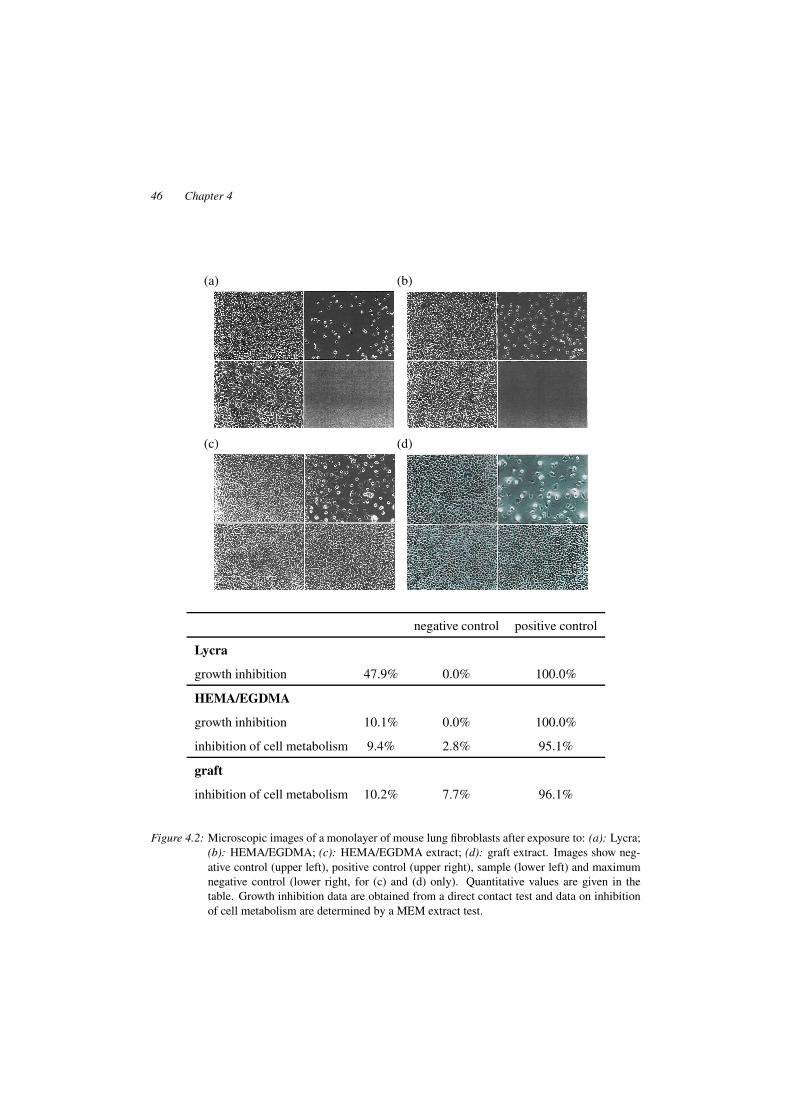
46 Chapter 4
(a) (b)
(d)(c)
negative control positive control
Lycra
growth inhibition 47.9% 0.0% 100.0%
HEMA/EGDMA
growth inhibition 10.1% 0.0% 100.0%
inhibition of cell metabolism 9.4% 2.8% 95.1%
graft
inhibition of cell metabolism 10.2% 7.7% 96.1%
Figure 4.2: Microscopic images of a monolayer of mouse lung fibroblasts after exposure to: (a): Lycra;(b): HEMA/EGDMA; (c): HEMA/EGDMA extract; (d): graft extract. Images show neg-ative control (upper left), positive control (upper right), sample (lower left) and maximumnegative control (lower right, for (c) and (d) only). Quantitative values are given in thetable. Growth inhibition data are obtained from a direct contact test and data on inhibitionof cell metabolism are determined by a MEM extract test.

Mechanics of fiber-reinforced HEMA/EGDMA hydrogel 47
0
50
100
150
200
250
1.00 1.05 1.10 1.15 1.20 1.25 1.30
Cau
chy
stre
ss[k
Pa]
stretch ratio λ [-]
Figure 4.3: Cauchy stress versus stretch ratio of swollen HEMA/EGDMA hydrogel. The results ofthree samples are given by the solid lines. The fit with the constitutive model is given bythe dashed line.
0.0
0.2
0.4
0.6
0.8
1.0
1.0 2.0 3.0 4.0 5.0 6.0
Cau
chy
stre
ss[1
03M
Pa]
stretch ratio λ [-]
0.0
0.5
1.0
1.5
2.0
2.5
3.0
3.5
4.0
1.00 1.05 1.10 1.15 1.20 1.25 1.30
Cau
chy
stre
ss[M
Pa]
stretch ratio λ [-]
Figure 4.4: Cauchy stress versus stretch ratio of 17 dtex Lycra fibers over the full range (left) and thedeformation range likely to occur in a vascular graft (right). The results of three samplesare given by the solid lines. The dashed line represents the fit with the constitutive model.

48 Chapter 4
gel
fibers
Figure 4.5: Image of the cross-section of a fiber-reinforced hydrogel tube. The black ring is the shadowcast by the hydrogel onto its inner surface. The right hand image shows a detail of the fiberlayer which is fully embedded into the hydrogel wall.
and measurement inaccuracies. For each sample a pure elastic response was found, althougha viscoelastic mechanical response was expected. An elastic incompressible neo-Hookeanconstitutive law is used to describe the material behavior:
σ = −p I + c(B − I), (4.3)
with p the hydrostatic pressure, B = F · FT the Finger strain tensor and c the materialstiffness. If an uni-axial stress state is assumed, the hydrostatic pressure can be eliminatedand the Cauchy stress in the loading direction is given by σl = c(λ2 − 1/λ). Using thisequation a fit of the experimental data is determined. The stiffness of the HEMA/EGDMAhydrogel used was found to be c = 245 ± 7 kPa (dashed line in figure 4.3).
Fibers
The left panel of figure 4.4 shows the Cauchy stress for three single 17 dtex Lycra fibers(cross-sectional area 50 µm) versus the stretch ratio. The fiber was loaded until rupture atλ ≈ 5.5. When used in the graft, the deformation is likely to be limited to 1.0 < λ < 1.3. Inthe right panel of figure 4.4 the curve for this deformation range is given. Lycra fibers exhibitnonlinear behavior, but for 1.0 < λ < 1.3 they act nearly linear. Therefore, Lycra would notbe suitable as a substitute for collagen. In the mathematical model, the mechanical responseof the fibers is described by a linear one-dimensional constitutive equation
τ f = k(λ2 − 1), (4.4)
with k a stiffness parameter and λ the fiber stretch. Fitting of the above equation to themeasured data yields k = 5.04 ± 0.09 MPa (dashed line in figure 4.4).
Hydrogel graft
A hydrogel tube with embedded fibers with a fiber angle of 30◦ has been manufactured.After polymerization, the tube was placed in saline solution. Because the material contains

Mechanics of fiber-reinforced HEMA/EGDMA hydrogel 49
charged groups, water will be absorbed within the polymeric network and consequently thematerial will swell. At equilibrium the inner diameter had increased from 2.42 ± 0.01 mmto 3.22 ± 0.01 mm and the wall thickness had reduced from 0.73 ± 0.01 mm to 0.60 ± 0.01mm. Furthermore, the tube elongated in the axial direction (λ = 1.28 with respect to thethe original length before swelling). Taking the into account the measurement inaccuracy,the maximum increase in cross-sectional area is 4%. Hence, the increase of volume hasmanifested itself mainly in axial elongation. This is caused by the anisotropic properties ofthe tube (the circumferential stiffness is higher than the axial stiffness).
A microscopic image of a cross section of the hydrogel tube is given in figure 4.5. Theblack ring is the shadow cast by the sample onto the inner surface. The right hand imageshows a detail of the wall. The fibers are fully embedded into the matrix. The locationwhere the fibers exit from the hydrogel is marked. When the material is cut the fibers donot disconnect from the matrix, suggesting a good connection between the hydrogel and thefibers. The stress in the fibers due to swelling of the hydrogel, do not cause the fibers toshorten when a ring shaped segment is cut.
The experimental characterization of the graft is carried out by loading it with a timevarying internal pressure and simultaneously measuring the inner and outer diameter, theinternal pressure and the exerted axial force (see chapter 3). At each side of the graft a canullais attached using surgical suture wire. The sample is placed in the setup which is filled withsaline solution and kept at a temperature of 37 ◦C. A small axial stretch (λz = 1.005) wasapplied to prevent the sample from buckling when loaded. The hydrogel tube was loadedwith an internal pressure between 6 and 17 kPa. An average of 10 cycles is depicted bythe solid lines in figure 4.6. In the range of the loading applied, both the hydrogel and thefibers possess linear material behavior. Consequently, for increasing internal pressure thecompliance will increase and the stiffening at higher pressures, which is typical for naturalarteries, is not present. The axial force has a positive sign (tensile force), indicating that thetube will shorten under inflation.
4.3.3 Model validation
Regarding the modeling of the composite, several assumptions are made. The geometry ofthe tube after swelling is taken as the initial configuration. With the current model it is notpossible to model swelling as mass balance is not satisfied during the swelling process: theamount of water within the polymer network has increased. Although the model provides thepossibility to incorporate residual stress, usage of this option is not possible as the configura-tion before swelling cannot be described by the model.
In the table of figure 4.6 the geometrical and material parameters are summarized. Asinitial configuration Ri = 1.61 mm, h = 0.60 mm, λz = 1.005 and α = 0◦ is taken. Usingthe winding parameters, the fiber density is computed to be n = 0.385 for each layer. If,as a result of the swelling, a constant radial compression is assumed, the initial fiber layerthickness of 100 µm (two layers of 50µm each) will be reduced yielding h∗ = 82 µm. Theradial position of the fiber layer relative to the inner radius is taken to be constant before andafter swelling, hence (r ∗ −ri)/h is constant. This yields the radial coordinate r ∗ = 1.84 mm.The fiber angle is adjusted for the axial elongation, which yields β = 36.5◦. The constitutiveequations are given by (4.3) and (4.4) with material parameters c = 245 kPa and k = 5.04MPa as determined from the tensile tests.

50 Chapter 4
0
5
10
15
20
1.60 1.62 1.64 1.66 1.68 1.70 1.72
inte
rnal
pres
sure
[kPa
]
inner radius [mm]
−0.020
0.000
0.020
0.040
0.060
0.080
0.100
1.60 1.62 1.64 1.66 1.68 1.70 1.72
axia
lfor
ce[N
]
inner radius [mm]
Ri [mm] h [mm] λz [-] r∗ [mm] h∗ [mm] c [kPa] k [MPa] β n [-]
1.61 0.60 1.005 1.84 0.082 245 5.04 36.5◦ 0.385
Figure 4.6: Mechanical behavior of a fiber-reinforced HEMA/EGDMA hydrogel under inflation. Ex-perimental data (average of 10 cycles) are depicted by solid lines and results obtained bythe numerical model are given by the dashed lines.
The computed values of radius and axial force versus pressure are given by the dashedlines in figure 4.6. The computed radius matches well with the experimental data. Thesmall difference in radius lays within the accuracy of the measurements. The axial stiffness,however, is underestimated by a factor two. To investigate the influence of the uncertaintyof the material parameters, a 20% variation was applied to each material parameter (seefigure 4.7). The pressure-radius relation is most sensitive to variations in the matrix stiffnessc and fiber angle β. The result of a variation of the other parameters is most noticeable in theaxial force. Furthermore, an increase of c, k or n yields an increase in both circumferentialand axial directions. An increase in the fiber angle β, however, results in a decrease of thecircumferential stiffness and an increase of the axial stiffness. The uncertainty of the valuesfor c and k as determined by the tensile tests, are approximately 3% for c and 1.8% for k.Based on the results presented in figure 4.7, the measurement inaccuracies found in the tensiletests will only have a small influence on the overall mechanical behavior.
4.3.4 Natural arteries
In chapter 3 experimental results of inflation tests on two specimen of human a.axillaris werereported. The experimental data are used to determine the design parameters for a mechani-cally equivalent hydrogel tube. The fiber density is taken the same as in the realized prototype(n = 0.385) to reduce the number of free parameters. The parameters to be found are theradius in the unloaded, unstretched configuration Ri, the wall thickness h, the fiber stiffnessk and the fiber angle β. A further reduction of parameters is made by taking an initial wallthickness for which at p = 13.3 kPa the current wall thickness in the model is the same asthat of the artery.

Mechanics of fiber-reinforced HEMA/EGDMA hydrogel 51
0
5
10
15
20
1.60 1.64 1.68 1.72 1.76
inte
rnal
pres
sure
[kPa
]
inner radius [mm]
c
0.000
0.020
0.040
0.060
0.080
0.100
1.60 1.64 1.68 1.72 1.76
axia
lfor
ce[N
]inner radius [mm]
c
0
5
10
15
20
1.60 1.64 1.68 1.72 1.76
inte
rnal
pres
sure
[kPa
]
inner radius [mm]
k
0.000
0.020
0.040
0.060
0.080
0.100
1.60 1.64 1.68 1.72 1.76
axia
lfor
ce[N
]
inner radius [mm]
k
0
5
10
15
20
1.60 1.64 1.68 1.72 1.76
inte
rnal
pres
sure
[kPa
]
inner radius [mm]
n
0.000
0.020
0.040
0.060
0.080
0.100
1.60 1.64 1.68 1.72 1.76
axia
lfor
ce[N
]
inner radius [mm]
n
0
5
10
15
20
1.60 1.64 1.68 1.72 1.76
inte
rnal
pres
sure
[kPa
]
inner radius [mm]
β
0.000
0.020
0.040
0.060
0.080
0.100
0.120
1.60 1.64 1.68 1.72 1.76
axia
lfor
ce[N
]
inner radius [mm]
β
Figure 4.7: Mechanical response of the hydrogel tube under inflation. The gray area marks a 20%variation of c, k, n and β. The arrows indicate an increasing value and the dashed linesindicate the results found in 4.3.3.

52 Chapter 4
0
5
10
15
20
1.80 1.90 2.00 2.10 2.20 2.30 2.40 2.50
inte
rnal
pres
sure
[kPa
]
inner radius [mm]
−0.20
−0.10
0.00
0.10
0.20
0.30
0.40
0.50
0.60
1.80 1.90 2.00 2.10 2.20 2.30 2.40 2.50
axia
lfor
ce[N
]
inner radius [mm]
0
5
10
15
20
2.10 2.20 2.30 2.40
inte
rnal
pres
sure
[kPa
]
inner radius [mm]
−0.20
−0.10
0.00
0.10
0.20
0.30
0.40
2.10 2.20 2.30 2.40
axia
lfor
ce[N
]
inner radius [mm]
Ri [mm] h [mm] k [MPa] β
sample 1
α = 0◦, c = 245 kPa, λz = 1.17, n = 0.385 2.65 0.51 27.1 40.7◦
sample 2
α = 0◦, c = 245 kPa, λz = 1.14, n = 0.385 2.51 0.68 36.7 35.4◦
Figure 4.8: Mechanical behavior of a human a.axillaris (dashed line) under inflation and axial tensionand a matching fiber-reinforced hydrogel tube (solid line). top: sample 1; bottom: sample2. The parameters for the hydrogel tube are given in the table.

Mechanics of fiber-reinforced HEMA/EGDMA hydrogel 53
The fit with the experimental data is depicted in figure 4.8. The numerical results are rep-resented by the solid lines and the experimentally obtained data are marked with the dashedlines. Clearly, it is not possible to match the mechanical behavior of the artery over the totalpressure range. However, considering that the physiological range lies between 10 kPa and16 kPa, the hydrogel would be a suitable replacement, though. For p > 10 kPa the radius andaxial force show a good match with the artery. The values found for the fiber stiffness k showthat fibers stiffer than the Lycra fibers used are needed (approximately 5 and 7 times stifferfor sample 1 and 2 respectively). For the arteries investigated, fibers with linear materialbehavior suffice; no strong nonlinearity is required. This is not necessarily true in all cases,as other arteries may show a more pronounced nonlinear behavior within the physiologicalpressure range.
Unfortunately, the hydrogel tube with the design parameters derived above could not beproduced with the current materials available. However, it is demonstrated that, at least the-oretically, it is possible to manufacture a fiber reinforced hydrogel tube that is mechanicallycompatible with a human artery.
4.4 Discussion
The use of HEMA-hydrogels for the vascular graft application looks promising. With a pro-totype it has been shown that a fiber-reinforced hydrogel tube can be made. A cytotoxicitytest shows that when the fibers are fully embedded into the matrix, the cytotoxicity of thematerial is not affected after the addition of Lycra fibers. However, further tests on thrombo-genicity and bloodcompatibility are necessary to investigate the possible use of this materialfor vascular grafts.
With a tensile test, an initial value for the material parameters of the hydrogel and thefibers is determined. The mechanical behavior of the composite can be described fairly wellusing the, earlier derived, mathematical model for fiber-reinforced materials and the materialparameters of its constituents and fiber layout. Comparison with experimental results showeda good match for the radius. The axial force was predicted too low, but its role is limitedcompared to that of the radius. Hence, a prediction of the compliance of the hydrogel graftcan be made.
Experimental data on segments of human arteries is used to find a parameter set which canbe used to construct a fiber-reinforced hydrogel tube with matching mechanical properties.Graft parameters are determined for the two different arteries investigated. The geometricalparameters such as radius and wall thickness do not differ much and the overall behavior isdetermined by the fibers. At mean arterial pressure both the internal radius and wall thick-ness are matched with the natural artery. Whether such a graft can be realized depends onthe availability of the fiber material. However, it has been shown that the gel stiffness issufficiently low such that with the addition of fibers the required stiffness to match the arterycan be reached. For the samples used in this study, fibers with linear material behavior couldbe used to yield a graft that shows a reasonable match with the artery for the physiologicalrange.
A high fiber stiffness is found for a matching hydrogel graft. This may form a problemin the production process. The swelling of the hydrogel causes a deformation of the fibernetwork. If the fiber stiffness is too high, the swelling of the hydrogel may cause the gel to
54 Chapter 4
be pushed through the fibers, thus destroying the graft. Hence, the fiber stiffness must besufficiently low to prevent separation of the hydrogel and fibers. For the investigation of theproduction process, incorporation of the swelling behavior into the mathematical model isdesirable. A multi-phase model of the matrix could be a solution to achieve this. The use ofsuch a model also enables the modeling of the residual stress induced by the swelling of thehydrogel. Furthermore, it can be used to determine production parameters such as mold sizesand winding angle which are influenced by the amount swelling occurring.

Chapter 5
Numerical analysis of distensibleartery-graft anastomoses: a model study
Compliance mismatch is seen as a major cause of the forming of distal intimal hyperplasia at artery-graft anastomoses. The mechanism which is responsible for this is yet unknown. Wall stress and wallshear stress are said to be of influence on the forming of hyperplasia. Information on the distribution andlevel of wall stress and wall shear stress can be obtained by numerical studies. Most studies are focusedon the flow dynamics and wall shear stress distribution. The little work that exist on wall stress, oftenassume linear isotropic material behavior for the arterial wall. In this chapter, the difference betweenwall stress distributions obtained with an isotropic and an anisotropic material model is investigated.Also the influence of axial stretch and residual stress is often neglected. In this study, it is shown thatthis has a major effect on the stress distribution and may be of great importance when analyzing stressin the arterial wall. Based on the observations made, a discussion on the problems involving numericalanalysis of anastomoses is given.
55

56 Chapter 5
5.1 Introduction
The role of graft-artery compliance mismatch is most evident at the anastomosis site: the sitewhere the connection between the vascular graft and the host artery is made. Intimal hyper-plasia, which is a major cause of low graft patency (Abbot et al., 1987), is often found nearthe anastomosis suture line but also on the bed (see figure 5.1) of the host artery (Bassiounyet al., 1992; Trubel et al., 1994). This has lead to the widespread belief that both hemody-namical factors (Sottiurai et al., 1989; Bassiouny et al., 1992; Hofer et al., 1996) as well asvessel wall mechanics (Abbot et al., 1987) play an important role in the patency of vasculargrafts.
Information on the distribution of the stress in the arterial wall and the wall shear stressnear an anastomosis may help to understand why the distinct sites mentioned above are proneto form intimal hyperplasia. Numerical simulations can provide such information. Manystudies, focus on flow dynamics and the effect of various parameters on the wall shear stress.Only a small number of studies (Chandran et al., 1992; Hofer et al., 1996; Ballyk et al., 1998;Perktold et al., 2002; Leuprecht et al., 2002) have addressed wall stresses at an anastomosis.In Ballyk et al. (1998), Perktold et al. (2002) and Leuprecht et al. (2002), the arterial wall ismodeled as a linear isotropic material using geometrically non-linear shell theory. In Perk-told et al. (2002) and Leuprecht et al. (2002) the geometry of the anastomosis was obtainedfrom casts of bypass sites. In all other aforementioned studies an idealized geometry of ananastomosis was used.
From chapter 3 it has become clear, that an anisotropic constitutive model is necessary foran accurate description of the mechanical behavior of arterial tissue. In literature present atthis time, however, only isotropic material models have been used. Clearly, a linear isotropicmaterial model may not able to describe the mechanical behavior of arterial tissue accurately:it lacks anisotropy and the stiffening effect at higher internal pressure. In order to obtain aruling on this isotropy assumption, the results of an isotropic and an anisotropic analysis arecompared in this study.
The modeling of residual stress (Fung, 1993) using an opening angle α may have a sig-nificant impact on the stress distribution in the arterial wall, as seen in chapter 3. Also thestress caused by the axial stretch present under in-vivo conditions has an effect on the stressin the wall under inflation. In Leuprecht et al. (2002) there is no mention of the incorpora-tion of residual stress into the computation. Axial prestretch is incorporated in Ballyk et al.(1998), but no details on the implementation are given. In this study, an investigation into theeffect of residual stress on the final stress distribution at physiological pressure is performed.Finally, an introductory investigation into compliance mismatch is performed with analysisof the stress distribution at an anastomoses for both an isotropic and anisotropic artery withan isotropic graft with low and high stiffness.
5.2 Methods
5.2.1 Geometry and boundary conditions
As emphasize is placed on constitutive equations and residual stresses, it is beyond the scopeof this study to provide an accurate geometrical description of a patient-specific anastomosis.Therefore, an idealized geometry, similar to the one used in Ballyk et al. (1998), is used (see

Numerical analysis of distensible artery-graft anastomoses: a model study 57
bed
heel
toe
0p
0p
0s
0t
0e
0e
0s
0a1
0a2
Figure 5.1: Computational domain for the end-to-side anastomosis. The boundary conditions are ap-plied on the surfaces defined by: 0s : symmetry condition; 0e: axial stretch; 0p: internalpressure; 0a1: anastomosis plane on artery side; 0a2: anastomosis plane on graft side.
figure 5.1). It consists of two tubes that are attached under an angle of 45◦. In practice, anincision is made in the host artery and subsequently a graft is sutured to it. Such a procedureis difficult to incorporate into a numerical model, hence a simplified approach is used. Theinitial computational mesh already contains an aperture of the size of the graft.
Modeling a suture would require more effort than a simple coupling of degrees of freedomon several locations. Suture wire stress and contact between the artery and the graft wouldhave to be included, thus adding a large amount of complexity. Furthermore, discrete suturelocations only model the immediate post-surgical situation. Arterial tissue will show healingand a continuous connection is formed ultimately. Suture models for wire and clips were usedin Perktold et al. (2002) and Leuprecht et al. (2002). Ballyk et al. (1998) has used discretesuture locations, but the implementation is not mentioned in the paper.
In order to be able to compute residual stresses in the artery, the total computationaldomain consists of two independent domains that are connected at the suture surface (rep-resented by the surfaces marked 0a1 and 0a2). The coupling of the artery and the graft iscontinuous, hence there are no discrete suture locations.
One objective of this study is to investigate the importance of residual stress for the finalstress distribution. Because the problem is nonlinear, in both geometrical and physical sense,incorporation of residual stress is not trivial. Straightforward superposition of residual stressand the stress resulting from inflation is not possible. Consequently, the total deformationfrom the initial configuration up to the loaded configuration has to be taken into account.
The initial computational mesh is generated by constructing a mesh of both the graft and

58 Chapter 5
the artery with the diameter and wall thickness as in the unloaded state (regardless of thevalue for the opening angle). In the case the opening angle α is nonzero, the coordinates ofthe mesh are changed such that an opened tube with the proper diameter is obtained. Usingthe obtained mesh, a number of steps are taken to obtain the unloaded configuration. Duringdeformation from the initial to the unloaded configuration, the stiffness of the graft is takensufficiently low that it does not influence the stress distribution in the artery. For the artery,the proper material model is used.
Residual stress is incorporated by using a Dirichlet boundary condition on 0s to closethe opened tube. After closure of the tube, axial prestrain is applied by a Dirichlet boundarycondition on 0e. Without any precautions, application of the axial prestrain will lead to acurved central axis of the host artery. A possible solution, as adopted in this work, is to applya boundary condition for the axial displacement on the anastomosis surfaces such that centralaxis of the host artery remains non-curved. After the application of the axial prestrain, thegraft is made stress-free. In the case residual stress for the artery is omitted, the stress in thehost artery is set to zero as well.
It is assumed that the end surface of the graft is axially tethered. Because of such aboundary condition, the end surface 0t may not remain perpendicular to the axis the the tube.Therefore, all displacements are suppressed on 0t . Because of the length of the graft, theeffect of suppression of radial displacement is limited and will not affect the deformation inthe anastomosis region. A Neumann boundary condition on 0 p is used to apply an internalpressure of 13.3 kPa. Symmetry, with appropriate boundary conditions on 0s are used toreduce the computational domain and computation time.
5.2.2 Constitutive equations and material parameters
Two types of material models are used: a fiber-reinforced model based on the experimentaldata of chapter 3 and an isotropic approximation. The mechanical behavior of a humana.axillaris can be described by the following anisotropic constitutive model (see chapters 2and 3):
σ = −p I + c(B − I) +
2∑
i=1
n[
τ f i − Eei · [c(B − I)] · Eei]
Eei Eei , with
τ f i = k1λ2i[
ek2(λ2i −1)2
− 1]
, λ2i = Ee0i · C · Ee0i ,
(5.1)
with p the hydrostatic pressure, B = F · FT the Finger strain tensor, τ f the fiber stress, λithe fiber stretch, Ee the fiber direction and k1 and k2 fiber material parameters. The total stressis determined by an isotropic part (the matrix) and an anisotropic part representing the fibers.The isotropic extra stress is given by a neo-Hookean material law with a stiffness parameterc. The fibers are modeled by an exponential relation between fiber stretch λi and fiber stressτ f . It is assumed that the fibers only contribute when the fibers are loaded with tension,hence when λi ≥ 1. The fibers are modeled as two symmetrical spirals and their directionsare described in the unloaded configuration by the vectors:
e˜01 =
[
0 cos(β) sin(β)
]T, e
˜02 =[
0 cos(β) − sin(β)
]T, (5.2)

Numerical analysis of distensible artery-graft anastomoses: a model study 59
0
5
10
15
20
1.80 1.90 2.00 2.10 2.20 2.30 2.40 2.50
inte
rnal
pres
sure
[kPa
]
inner radius [mm]
p = 13.3 kPa
α c [kPa] k1 [kPa] k2 [-] β
isotropic
Ri = 2.50 mm, h = 0.54 mm, λz = 1.17 - 600 - - -
anisotropic
Ri = 1.99 mm, h = 0.64 mm, λz = 1.17 0◦ 52.8 0.6 37.7 46.2◦
Ri = 2.65 mm, h = 0.64 mm, λz = 1.17 80◦ 53.0 0.48 42.9 46.4◦
Figure 5.2: Pressure radius relation of the anisotropic model (solid line) based on experimental data of ahuman a.axillaris and an isotropic equivalent (dashed lines). Data is obtained from inflationexperiments on human a.axillaris (see chapter 3).
with β the angle between the circumferential and axial direction of the domain. Note that theaxial direction for the graft is under a 45◦ angle with the axial direction of the artery. Thematerial parameters used are obtained from the experiments described in chapter 3 and aresummarized in the table in figure 5.2.
For the purpose of comparison, the experimental data given in chapter 3 are also usedto derive material parameters for the linear isotropic constitutive model. A neo-Hookeanmaterial law with shear modulus c is fitted with the experimental data. The initial internalradius and wall thickness are adapted such that for p = 13.3 kPa they are approximately thesame for both models. The value of c for the isotropic model is such that the gradient ofthe pressure-radius curve (representing the circumferential stiffness) of both material modelsmatch for p = 13.3 kPa (see figure 5.2). This resulted in c = 600 kPa, Ri = 2.50 mm andh = 0.54 mm for the isotropic model. Note that the stiffness of both models only matches forp = 13.3 kPa. For p < 13.3 kPa, the stiffness of the isotropic model is too high compared tothat of the anisotropic model. Also the linear isotropic model can not describe the nonlinearbehavior for 0 < p < 13.3 kPa. As a result, the radius for p = 0 kPa, represented by Ri,must be higher for the isotropic model. Although at p = 13.3 kPa the inner radius for bothmodels are equal, the deformation with respect to the unloaded configuration is not the same,due to the difference in Ri.
To investigate the role of the material model, a matched anastomosis is modeled. Thisis achieved by taking the constitutive model and material parameters the same for both the

60 Chapter 5
artery and the graft. Remark that axial prestrain and residual stress are not included for thegraft. The effect of graft stiffness on the stress distribution is studied by modeling the graftas an isotropic neo-Hookean material with respectively c = 2.5 MPa and c = 0.25 MPa fora graft that is too stiff or too compliant with respect to the artery.
5.3 Results
Constitutive model and residual stress
For an anastomosis with matched graft and artery, the distribution of the maximum principalstress ratio (MPSR) on the inner surface and at several cross-sections is depicted in figure 5.3for p = 0 kPa and in figure 5.4 for p = 13.3 kPa. The MPSR is computed by dividingthe maximum principle stress (MPS) by its mean value in the host artery far away from theanastomotic region. The mean value is given below the graphs by 〈MPS〉.
In the absence of axial prestrain and residual stress, the configuration is stress-free forp = 0 kPa. The diameter difference between figure 5.3.a and figure 5.3.d is caused by thedifference in the initial radius Ri (see 5.2.2 and figure 5.2). During the application of theaxial prestrain, the central axis of the host artery was not allowed to become curved. Whenthat boundary condition is removed, the stress in the host artery (due to axial prestrain andresidual stress) causes deformation which results in stress in the graft. For the isotropic modelit is likely that the MPS is directed in axial direction, when only axial prestrain is applied. Afirst order approximation of 〈MPS〉 should be in the order of 220 kPa, based on τ = c(λ2 −1)
with c = 600 kPa. The value found is higher due to the contribution of the incompressibilityconstraint. At p = 0 kPa, the stiffness of the anisotropic model is mainly determined by theisotropic matrix. Hence a first order approximation with c = 53 kPa yields a value of 20 kPafor 〈MPS〉 without taking into account the contribution of the incompressibility contraint.
The stress distribution is not homogeneous within the host artery as a result of the de-formation caused by the axial prestrain. An area of high stress is found near the suture line.Independent of the material model used, incorporation of residual stress lowers the value for〈MPS〉 at the inner surface, but no substantial change in the stress distribution is found.
The value of 〈MPS〉 found for the isotropic model is more than 12 times higher than the〈MPS〉 for the anisotropic model. This is due to the linearity of the isotropic model. Thelinear isotropic model cannot describe the behavior for 0 < p < 13.3 kPa and only matcheswith the artery for p = 13.3 kPa. Therefore, the stiffness of the isotropic model is too highin the region below mean pressure, resulting in a too high a value for the stress. We mayconclude that the application of axial prestrain with a linear material model does not makesense. A linear model is too stiff in the region from zero stress to mean pressure resulting intoo high prestress values. Hence, a nonlinear material model, capable of describing the fullpressure range, is needed when axial prestrain is to be included.
The differences in MPSR distribution between the isotropic and anisotropic materialmodel are small (but large in absolute value). Because of the small deformation present,the fiber stress in the anisotropic model can be considered small compared to the isotropicmatrix stress. As the stress in the anisotropic model is mainly determined by the isotropicmatrix, the resulting stress distribution is similar to that of the isotropic model.
For p = 13.3 kPa, the MPSR distribution is given in figure 5.4. The boundary conditionapplied to the end surface of the graft is clearly visible for the anisotropic model. However,

Numerical analysis of distensible artery-graft anastomoses: a model study 61
it does not affect the solution near the anastomosis region. The diameters of the two modelsare the same as can be expected considering figure 5.2. The 〈MPS〉 has increased due tothe applied internal pressure. For the isotropic model, the MPS will mainly be directed incircumferential direction, in the absence of axial prestrain and residual stress. A first orderapproximation (hσθ = r p) yields an order of magnitude of 66 kPa for the 〈MPS〉. The valuefound for the isotropic model is higher, as in a thick-walled tube the circumferential stressdepends on the radius and is higher near the inner surface. Due to the presence of fibers inthe anisotropic model, the direction of the MPS is likely to coincide with the fiber direction.Hence, the linear approximation is not applicable.
The effect of residual stress is clearly visible, yet more pronounced for the anisotropicmodel. The 〈MPS〉 is lowered and the stress gradient over the wall thickness is reduced; thedifference in MPS between the inner and outer surface is diminished. The MPSR in the graftincreases, because the 〈MPS〉 is lower and the absolute stress levels in the graft have notchanged (residual stress is only incorporated in the artery).
The differences in MPSR distribution of the two material models become apparent forp = 13.3 kPa. Figure 5.4.a shows the classical pattern of high stress concentration oftenlinked with intimal hyperplasia. Areas with high stress are found at the toe, the heel and thebed of the host artery. From experiments, these sites are known to show a large amount ofintimal hyperplasia. A similar pattern is found for the anisotropic model as well. When axialprestrain is applied, this pattern vanishes for the isotropic model and the stress distributionis similar as found for p = 0 kPa (compare figure 5.4.b with figure 5.3.b). Due to thehigh stiffness of the isotropic model, the stress induced by the axial prestrain dominates andsuppresses the stresses induced by inflation. For the anisotropic model, however, the highstress pattern becomes more pronounced and high stress areas are found at the toe, the heeland the bed, but also at the suture line area. Incorporation of residual stress has no substantialeffect on the stress distribution other than lowering the 〈MPS〉. Again, the MPSR in the graftincreases, because of a lower 〈MPS〉 with the absolute stress levels in the graft unchanged.
Compliance mismatch
As previously concluded, the application of axial prestrain in combination with the isotropicmodel is not useful. As the opening angle and axial prestrain are closely linked definingthe total residual stress, it seems reasonable not to include an opening angle when axialprestrain is omitted. Therefore, in the following section, the results of the anisotropic modelare compared with the results of isotropic model without axial prestrain and residual stress.
Figures 5.5.b and 5.5.e are previously shown in figure 5.4 and depict an anastomosiswith matched properties of the graft and artery. Figures 5.5.a and 5.5.d contains the MPSRdistribution for an isotropic graft with c = 0.25 MPa and figures 5.5.c and 5.5.f represent theMPSR distribution for an isotropic graft with c = 2.5 MPa. Note that the 〈MPS〉 is the sameregardless of the graft stiffness. This confirms that the bottom cross-section (on which the〈MPS〉 is computed) is chosen sufficiently far away from the anastomosis.
Based on the results presented in figure 5.5, it is not possible to draw a conclusion re-garding compliance mismatch. When the graft is matched with artery, the stresses seem tobe most homogeneous near the anastomosis. However, no conclusive evidence can be foundin figure 5.5 that supports the hypothesis on compliance mismatch. An explanation may befound in the computational mesh used for the problem. Examination of the cross-sections at

62 Chapter 5
matched, p = 0 kPaisotropic anisotropic
no axial prestrain,no residual stress
(a) 〈MPS〉 = 0 kPa (d) 〈MPS〉 = 0 kPa
axial prestrain,no residual stress
(b) 〈MPS〉 = 272 kPa (e) 〈MPS〉 = 22 kPa
axial prestrain,residual stress,
(c) 〈MPS〉 = 254 kPa (f) 〈MPS〉 = 20 kPa0 0.1 0.2 0.3 0.4 0.5 0.6 0.7 0.8 0.9 10
0.1
0.2
0.3
0.4
0.5
0.6
0.7
0.8
0.9
1
PSfrag replacements
0.0 0.2 0.4 0.6 0.8 1.0 1.2 1.4 1.6 1.8MPSR [-]
Figure 5.3: Maximum principle stress ratio (MPSR) for p = 0.0 kPa on the inner surface and at sev-eral cross-sections of a matched end-to-side anastomosis. left: isotropic material behavior;right: anisotropic material behavior.

Numerical analysis of distensible artery-graft anastomoses: a model study 63
matched, p = 13.3 kPaisotropic anisotropic
no axial prestrain,no residual stress
(a) 〈MPS〉 = 72 kPa (d) 〈MPS〉 = 148 kPa
axial prestrain,no residual stress
(b) 〈MPS〉 = 304 kPa (e) 〈MPS〉 = 135 kPa
axial prestrain,residual stress
(c) 〈MPS〉 = 287 kPa (f) 〈MPS〉 = 95 kPa0 0.1 0.2 0.3 0.4 0.5 0.6 0.7 0.8 0.9 10
0.1
0.2
0.3
0.4
0.5
0.6
0.7
0.8
0.9
1
PSfrag replacements
0.0 0.2 0.4 0.6 0.8 1.0 1.2 1.4 1.6 1.8MPSR [-]
Figure 5.4: Maximum principle stress ratio (MPSR) for p = 13.3 kPa on the inner surface and at severalcross-sections of a matched end-to-side anastomosis. (a)-(c): isotropic material behavior;(d)-(f): anisotropic material behavior.

64 Chapter 5
isotropic anisotropic
stiffnesstoo low
(a 〈MPS〉 = 72 kPa (d) 〈MPS〉 = 95 kPa
matched
(b) 〈MPS〉 = 72 kPa (e) 〈MPS〉 = 95 kPa
stiffnesstoo high
(c) 〈MPS〉 = 72 kPa (f) 〈MPS〉 = 95 kPa0 0.1 0.2 0.3 0.4 0.5 0.6 0.7 0.8 0.9 10
0.1
0.2
0.3
0.4
0.5
0.6
0.7
0.8
0.9
1
PSfrag replacements
0.0 0.2 0.4 0.6 0.8 1.0 1.2 1.4 1.6 1.8MPSR [-]
Figure 5.5: Maximum principle stress ratio (MPSR) for p = 13.3 kPa on the inner surface and at severalcross-sections of an end-to-side anastomosis with an isotropic graft. (a)-(c): isotropic arterymodel; (d)-(f): anisotropic artery model. Only for the anisotropic model, axial prestrain andresidual stress are modeled (α = 80◦, λz = 1.17).

Numerical analysis of distensible artery-graft anastomoses: a model study 65
the anastomosis suggests that bending over the suture line occurs. Therefore, the presence ofsharp transitions between the artery and the graft may lead to unexpected results. An accurateexplanation of the results found cannot be given, based on what is presented here.
5.4 Discussion
The analysis of wall stress in a distensible anastomosis remains a complex problem. Analyseson an idealized geometry, as performed in this work, can provide data on the influence of theconstitutive model and the incorporation of residual stress, but conclusions regarding thephysiological situation must be made with caution.
This study is focused on the role the material model plays in the analysis of wall stress inan anastomosis. A linear isotropic constitutive model is not suitable for accurately describingthe typical mechanical behavior of arterial tissue. With an anisotropic model a more accuratedescription of the mechanical properties can be given. This is reflected when axial prestrainis applied. The results in this study show that axial prestrain with an linear material modeldoes not make sense, as the material behavior is too stiff in the region from zero stress tomean pressure, yielding too high values for the prestress. Only with a nonlinear model, theapplication of axial prestrain is useful. Whether the results obtained with the anisotropicmodel used in this study reflect the actual physiological situation is unknown as in-vivo dataon wall stress are not available.
Incorporation of residual stress by means of an opening angle has a leveling effect on thestress over the wall thickness. However, incorporation of residual stress is a computationalchallenge. The generation of a computational mesh of a vessel with a nonzero opening angleis only possible for a simple geometry and even in the idealized situation used in this work, itcould only be applied to the host artery. Also the application of axial prestrain raised difficul-ties and a special boundary condition had to be introduced to prevent large mesh distortion.When dealing with a realistic geometry (see Perktold et al. (2002) for example), the solutionsadapted in this work would fail.
The numerical analyses performed in this work gave rise to a large number of questions.A major problem forms the modeling of residual stress in arteries. Current techniques do notprovide a satisfactory solution and the reason these techniques fail is that they neglect thelikely origin of residual stress: adaptation of the arterial wall. Adaptation and remodelingmodels provide a more suitable way of incorporating residual stress as they could model thenatural process of its formation. The framework used in this study can provide a basis forfurther development: it offers a description for anisotropic materials in an updated Lagrangeformulation which facilitates the implementation of adaptation models into a finite elementprogram (Driessen et al., 2003).

66 Chapter 5

Chapter 6
Discussion and conclusions
67

68 Chapter 6
6.1 Discussion
6.1.1 Modeling of fiber-reinforced materials
In this study we have chosen to design a graft that consists of an isotropic matrix materialwhich is reinforced with fibers. To derive a mathematical description of the graft, a constitu-tive model for fiber-reinforced materials has been developed. In literature, many continuummodels that describe such materials are based on the well known work of Spencer (1984).This work provides a hyperelastic model based on a strain energy function approach. A ma-jor drawback is the limited range of constitutive models, in particular in-elastic models, thatcan be described using a strain energy function. A large number of material models has beendeveloped that are not based on, or cannot be cast into, a strain energy function. The general-ized form presented in this thesis, circumvents the limitation mentioned above and allows fora large variety of constitutive models, including hyperelastic models, models for in-elasticmaterials and models suitable for the description of vessel wall adaptation.
Fiber density is an important parameter when modeling fiber-reinforced composites witha continuum model, but also in vessel wall adaptation models. Hence, incorporation of fiber-density into a constitutive law is desirable. The application of the rule of mixtures seemsa natural approach to do this. A straightforward application, however, would erroneouslylead to loss of material stiffness perpendicular to the fiber direction. The application of therule of mixtures in the fiber direction only, as proposed in this study, correctly preservesthe perpendicular material properties and guarantees that only in fiber direction the overallproperties are changed.
The finite element method is a powerful mathematical technique to solve the balanceequations found in nonlinear solid mechanics. For the constitutive model proposed, an up-dated Lagrange framework is used to derive a linearized set of equations, suitable for solvingwith a finite element method. The incompressibility constraint is incorporated using a mixedformulation in displacement and hydrostatic pressure. The resulting set of equations is dis-cretized according to a Galerkin method. The spatial discretization has been based on a Q2/P1element with discontinuous pressure (quadratic Crouzeix-Raviart element). Through consis-tent linearisation of the equations, quadratic convergence of the Newton iteration process isobtained.
6.1.2 Experimental characterization of human arteries
Characterization experiments on natural arteries provide the input for the graft design pro-cedure. In an experimental setup, a segment of an artery is inflated while simultaneouslymeasuring the internal pressure, the axial force and the inner and outer diameter. A mathe-matical model for describing fiber-reinforced materials, based on the theory described earlier,is developed. With the data obtained, the material parameters for the model are determined.
The use of ultrasound for wall displacements measurement has been employed success-fully. Unlike the use of a CCD camera, it enables the measurement of the inner and outerradius of the blood vessel directly and simultaneously. The spatial resolution has been im-proved compared to a wall track algorithm by using a velocity estimation algorithm. Probeswith higher frequency or intra-vascular probes can further improve spatial resolution andaccuracy of the wall displacement measurement.

Discussion and conclusions 69
From the same experiment the volume change of the arterial wall can be computed. Due tothe limitations in spatial resolution of the probe used it was not possible to provide accuratedata about the incompressibility of arterial tissue. However, the maximum value found isconsistent with values found in literature. Also it supports the assumption that the arterialwall can be regarded incompressible.
The determination of the stress-free configuration remains a problem when deriving amathematical model for the behavior of arteries. The observation that a radially cut segmentsprings open has lead to the concept of the opening angle. It was not possible to accuratelydetermine the opening angle of the samples used.
A major shortcoming of this study is the limited amount of samples tested and their post-mortem nature. Because in this study only an indication of the characteristics of the materialwas needed, only two samples have been measured. Their post-mortem nature may haveresulted in an increase in stiffness and a reduction of nonlinearity. More data on natural arter-ies are needed to verify the robustness of the procedure adopted in this study and to providemore information on the biological diversity on the mechanical properties of arteries. Also,the influence of smooth muscle cells is neglected in this study. Under in-vivo circumstances,smooth muscle tissue is activated, hence the mechanical properties measured may differ fromthe in-vivo situation.
6.1.3 Hydrogel as material for vascular grafts
To test the procedure suggested in this thesis, a fiber-reinforced hydrogel tube is manufac-tured. Initially, a prototype is made to study the manufacturing process. To complete theprocedure suggested, an initial value for the material parameters for the hydrogel and fibersis determined from a tensile test on both materials. Using the material properties of the con-stituents and the geometry of the fibers, a mathematical model of the composite can describethe mechanical behavior of the fiber-reinforced hydrogel tube. A good match was found be-tween the measured properties and the results of the mathematical model. Only one hydrogeltube has been made and it is not proved whether different geometries and compositions ofthe tube can be described with the same accuracy. Using the experimental data, a design ofa hydrogel graft that mechanically matches with an artery can be made. With the use of themathematical model it is possible to find a parameter set that, at least theoretically, gives ahydrogel graft that is mechanically equivalent to a natural artery. The hydrogel graft with itsdesign parameters derived from experimental data has not been realized and demands furtheroptimization of both gel and fiber material properties. Also, more work is needed to improvethe production process and facilitate a convenient fabrication process for fiber-reinforced hy-drogel tubes for any given geometry and fiber layout.
The good biocompatible characteristics of HEMA-hydrogels suggest a possible appli-cation as a graft material, fiber reinforcement is necessary to add strength to the materialand to obtain the proper mechanical properties for a graft. A preliminary biocompatibilitytest has shown that the biocompatibility is not affected by the addition of fully embeddedpolyurethane-based Lycra fibers. The good result of the cytotoxicity test may serve as a start-ing point to gain knowledge on bloodcompatibility and thrombogenicity of fiber-reinforcedhydrogel.
The hydrogel used exhibits a large amount of swelling, even in the presence of a fibernetwork. The material properties of the fibers play an important role in the swelling process.

70 Chapter 6
They limit the amount of swelling that may occur, but a too stiff a fiber network may causethe gel to be pushed out between the fibers, thus destroying the graft. Hence, for the analysisof the production process, the incorporation of the swelling into the mathematical model isdesirable. This can be achieved by using a multi-phase material model for the matrix. The useof a multi-phase constitutive model also enables the modeling of the residual stress caused bythe swelling and it can be used to find the mold size and winding angle needed for production.
6.1.4 Numerical analysis of distensible anastomoses
Intimal hyperplasia at an anastomosis has been the topic of many studies. However, attentionif often focused on hemodynamics and little work is done on the stress distribution in the ar-terial wall at an anastomotic site. The few studies performed all have assumed linear isotropicproperties for arterial tissue. The numerical analysis performed in this study showed that thechoice of material model has a large impact on the stress levels and distribution found.
Axial prestrain can only be applied when the material model is capable of describing thematerial behavior of arteries over the entire pressure range from zero to mean pressure. Thisrequires a nonlinear constitutive model. Application of axial prestrain with a linear materialmodel does not make sense, as the material behavior is too stiff in the region below meanpressure, resulting in too high prestress values. If axial and circumferential residual stressesare assumed to be of importance, a nonlinear material model, with preferably anisotropy,must be used to describe arterial tissue.
Incorporation of axial prestrain and residual stress forms a major problem in numericalanalysis of an anastomosis. Residual stress is modeled by introducing an opening angle whichdescribes the geometry of an opened tube and closing of the opened tube yields the desiredstress in the material. Even for a idealized geometry as used in this study, implementationis not trivial and special precautions have to be taken. For more complex geometries thedefinition of the opening angle will fail. Hence, a different way of implementing residualstress is necessary.
Rather than circumventing the problems caused by the implementation of an opening an-gle and axial prestrain, the development of good adaptation models is preferable. Adaptationand remodeling models will provide a more suitable way of dealing with residual stress, asthey address the fundamental principle of its origin. The numerical framework used in thiswork provides a good basis for the implementation of such models into numerical programs.
6.2 Conclusions and recommendations
The patency of vascular grafts does not only depend on proper mechanics, but involves nu-merous factors such as chemical and biological factors. A good functioning of a graft dependson the quality of the graft itself and on the adaptive capabilities of the arterial wall. From amechanical point of view, the quality of the graft is determined by how well the complianceof the graft matches with the compliance of the artery it is attached to. In this thesis a pro-cedure to design a mechanically equivalent graft, based on experimental characterization andmathematical modeling, is described. A hydrogel was used as matrix material for a smalldiameter fiber-reinforced graft. Design parameters were determined with the use of exper-iments on human arteries and mathematical modeling of the fiber-reinforced material. The

Discussion and conclusions 71
actual realization depends on the availability of the desired materials and the flexibility of theproduction process. An important issue such as biocompatibility is addressed only briefly inthis work. If fiber-reinforced hydrogels are considered serious candidates for graft material,more research on this topic and clinical handling is necessary.
Several issues are open for improvement. More data on, preferably fresh, natural arteriesis necessary to test the robustness of the procedure described. The introduction of a condi-tioning system and simplification of the usage of the experimental setup may facilitate this.Incorporation of the swelling behavior of the hydrogel into the mathematical model is nec-essary. It enables the investigation of the stresses induced in the matrix and fibers due toswelling. The development of mathematical models that describe adaptation of arterial tis-sue will be a large step forward towards a more accurate description of arterial tissue. Sinceintimal hyperplasia may be strongly related to adaptation processes in the arterial wall, suchmathematical models may give insight in the possible mechanical factors linked with intimalhyperplasia and may contribute to the improvement of vascular graft design.

72 Chapter 6

References
W. M. Abbot, J. Megermann, J. E. Hasson, G. J. L’Italien, and D. F. Warnock. Effect ofcompliance mismatch on vascular graft patency. J. Vasc. Surg., 5:376–382, 1987.
Y. B. Aldenhoff, J. ter Woorst F. H. van der Veen, J. Habets, L. A. Poole-Warren, and L. H.Koole. Performance of a polyurethane vascular prosthesis carrying a dipyridamole (per-santin) coating on its lumenal surface. J. Biomed. Mater. Res., 54:224–233, 2001.
L. Ambrosio, P. Netti, S. Innace, S. Huang, and L. Nicolais. Composite hydrogels for inter-vertebral disc prostheses. J. Mater. Sci.: Mater. Med., 7:251–254, 1996.
L. Ambrosio, R. D. Santis, and L. Nicolais. Composite hydrogels for implants. Proc. Instn.Mech. Engrs., 212:93–99, 1998.
G. Andrus, R. W. Harris, and S. X. Salles-Cunha. Arm veins for arterial revascularisation ofthe leg: Arteriographic and clinical observations. J. Vasc. Surg., 4:416–427, 1986.
P. D. Ballyk, C. Walsh, J. Butany, and M. Ojha. Compliance mismatch may promote graft-artery intimal hyperplasia by altering suture-line stresses. J. Biomechanics, 31:229–237,1998.
A. J. Bank, R. F. Wilson, S. H. Kubo, J. E. Holte, T. J. Dresing, and H. Wang. Direct effectsof smooth muscle relaxation and concentration on in in vivo human brachial artery elasticproperties. Circ. Res., 77:1008–1016, 1995.
J. G. Barra, R. L. Armentato, J. Levenson, E. I. C. Fischer, R. H. Pichel, and A. Simon.Assessment of smooth muscle contribution to descending thoracic aortic elastic mechanicsin conscious dogs. Circ. Res., 73:1040–1050, 1993.
H. S. Bassiouny, S. White, S. Glagov, E. Choi, D. P. Giddens, and C. K. Zarins. Anastomoticintimal hyperplasia: mechanical injury or flow induced. J. Vasc. Surg., 15(4):708–717,1992.
G. W. Bos, A .A. Poot, T. Beugeling, W. G. van Aken, and J. Feijen. Small-diameter vasculargraft prostheses: Current status. Arch. Physiol. Biochem., pages 100–115, 1998.
B. Boyce. Physical characteristics of expanded polytetrafluorethylene grafts. In J. C. Stanley,editor, Biologic and synthetic vascular prostheses, pages 553–560. Grune and Stratton,New York, 1982.
73
74 References
P. J. Brands, A. P. G. Hoeks, L. A. F. Ledoux, and R. S. Reneman. A radio frequencydomain complex cross-correlation model to estimate blood flow velocity and tissue motionby means of ultrasound. Ultrasound Med. Biol., 23(6):911–920, 1997.
P. J. Brands, A. P. G. Hoeks, J. Willegers, C. Willekes, and R. S. Reneman. An integratedsystem for the non-invasive asessment of vessel wall and hemodynamic properties of largearteries by means of ultrasound. Eur. J. Ultrasound, 9:257–266, 1999.
U. Brink and E. Stein. On some mixed finite element methods for incompressible and nnearlyincompressible finite elasticity. Comput. Mech., 19:105–119, 1996.
T. E. Carew, R. N. Vaishnav, and D. J. Patel. Compressibility of the arterial wall. Circ. Res.,23:61–68, 1968.
E. Cenni, D. Granchi, G. Ciapetti, E. Verri, D. Cavedagna, S. Gamberini, M. Cervellati,A. Di Leo, and A. Pizzoferrato. Expression of adhesion moplecules on endothelial cellsafter contact with knitted dacron. Biomaterials, 18:489–494, 1997.
K. B. Chandran, D. Gao, G. Han, H. Baraniewski, and J. D. Corson. Finite-element analysisof arterial anastomoses with vein, dacron and PTFE grafts. Med. Biol. Eng. Computing,30:413–418, 1992.
D. Charlesworth. Arterial replacements. In S. Taylor, editor, Recent advances in surgery,volume 10, pages 93–111. Churchill Livingstone, 1980.
C. J. Chuong. Compressibility and constitutive equation of arterial wall in radial compressionexperiments. J. Biomechanics, 17:35–40, 1984.
C. J. Chuong and Y. C. Fung. On residual stress in arteries. J. Biomech. Eng., 108:189–192,1986.
D. R. Clarke, R. M. Lust, Y. S. Sun, K. S. Black, and J. D. Ollerenshaw. Transformation ofnonvascular acellular tissue matrices into durable vasular conduits. Ann. Thorac. Surg., 71:S433–S436, 2001.
A. W. Clowes, T. R. Kirkman, and M. M. Clowes. Mechanism of arterial graft failure. ii.chronic endothelial and smooth muscle cell proliferation in healing ptfe prostheses. J.Vasc. Surg., 3:877–884, 1986.
R. H. Cox. Comparison of arterial wall mechanics using ring and cylindrical segments. Am.J. Physiol., 244:H298–H303, 1983.
R. H. Cox and R. J. Bagshaw. Effects of hypertension and its reversal on canine arterial wallproperties. Hypertension, 12:301–309, 1988.
B. J. de Smet, G. Pasterkamp, Y. J. van der Helm, C. Borst, and M. J. Post. The relationbetween de novo atherosclerosis remodeling and angioplasty- induced remodeling in anatherosclerotic yucatan micropig model. Arterioscler. Thromb. Vasc. Biol., 18:702–707,1998.
References 75
M. E. DeBakey, G. L. Jordan, J. P. Abbott, B. Halpert, and R. M. O’Neill. The fate of dacronvascular grafts. Arch. Surg., 89:757–782, 1964.
P. B. Dobrin and A. A. Rovick. Influence of vascular smooth muscle on contractile mechanicsand elasticity of arteries. Am. J. Physiol., 217:1644–1652, 1969.
N. J. B. Driessen, G. W. M. Peters, J. M. R. J. Huyghe, C. V. C. Bouten, and F. P. T. Baai-jens. Remodelling of continuously distributed collagen fibres in soft connective tissues. J.Biomechanics, 2003. in press.
A. Eberhart, Z. Zhang, R. Guidoin, G. Laroche, L. Guay, D. De La Faye, M. Batt, andMartin W. King. A new generation of polyurethane vascular prostheses: Rara avis or ignisfatuus? J. Biomed. Mater. Res., 48(4):546–558, 1999.
W. S. Edwards. Plastic arterial grafts. Springfield: Thomas, 1962.
J. L. Ericksen and R. S. Rivlin. Large elastic deformation of homogeneous anisotropic mate-rials. J. Rat. Mech. Analysis, 3:281–301, 1954.
R. M. Faruqi and R. J. Stoney. The arterial autograft. In E. B. Rutherford, editor, VascularSurgery, pages 532–539. Philadelphia, Pennsylvania: W. B. Saunders, 5th edition, 2000.
S. G. Friedman, R. S. Lazzaro, L. N. Spier, C. Moccio, and A. J. Tortolani. A prospec-tive randomized comparison of dacron and polytetrafluorethylene aortic bifurcation grafts.Surgery, 117:7–10, 1995.
Y. Fung. Mechanical properties of living tissues. Springer Verlag, second edition, 1993.
C. Gosseling, D. A. Vorp, V. Warty, D. A. Severyn, E. K. Dick, H. S. Borovetz, and H. P.Greisler. eptfe coating with fibrin glue, fgf-1, and heparin: Effect on retention of seededendothelial cells. J. Surg. Res., 60:327–332, 1996.
A. Green and P. Naghdi. A dynamical theory of interacting continua. J. Engr. Sci., 3:3–231,1965.
R. Guidoin, N. Chakfe, S. Maurel, T. How, M. Batt, M. Marois, and C. Gosselin. Expandedpolytetrafluorethylene arterial prostheses in humans: histopathological study of 298 surgi-cally excised grafts. Biomaterials, 14(9):678–693, 1993a.
R. Guidoin, S. Maurel, N. Chakfe, T. How, Z. Zhang, M. Therrien, M. Formichi, and C. Gos-selin. Expanded polytetrafluorethylene arterial prostheses in humans: chemical analysis of79 explanted specimens. Biomaterials, 14(9):694–704, 1993b.
B. S. Gupta and V. A. Kasyanov. Biomechanics of human common carotid artery and designof novel hybrid textile compliant vascular grafts. J. Biomed. Mater. Res., 34:341–349,1997.
K. Hayashi. Experimental approaches on measuring the mechanical properties and constitu-tive laws of arterial walls. J. Biomech. Engr., 115:481–488, 1993.

76 References
M. Hofer, G. Rappitsch, K. Perktold, W. Trubel, and H. Schima. Numerical study of wallmechanics and fluid dynamics in end-to-side anastomoses and correlation to intimal hy-perplasia. J. Biomech., 29(10):1297–1308, 1996.
D. B. Holt, R. C. Eberhart, and M. D. Prager. Endothelial cell binding to dacron modifiedwith polyethylene oxide and peptide. ASIAO Journal, 40(3):M858–M863, 1994.
G. A. Holzapfel. A new constitutive framework for arterial wall mechanics and a comparativestudy of material models. J. Elasticity, 61:1–48, 2000.
G. A. Holzapfel and T. C. Gasser. A viscoelastic model for fiber-reinforced composites atfinite strains: Continuum basis, computational aspects and applications. Comput. MethodsAppl. Mech. Engr., 190:4379–4403, 2001.
T. V. How, R. Guidoin, and S. K. Young. Engineering design of vascular prostheses. Proc.Inst. Mech. Eng. Part H: J. Eng. Med., 206(2):61–71, 1992.
S. Hsu and H. Kambic. On matching compliance between canine carotid arteries andpolyurethane grafts. Artificial Organs, 21(12):1247–1254, 1997.
J. D. Humphrey. Mechanics of the arterial wall: Review and directions. Critical Reviews inBiomed. Engr., pages 1–162, 1995.
J. D. Humphrey, T. Kang, P. Sakarda, and M. Anjanappa. Computer-aided vascular experi-mentation: a new electromechanical test system. Ann. Biomed. Engr., 21:33–43, 1993.
J. D. Humphrey, R.K. Strumpf, and F. C. P. Yin. A theoretically-based experimental approachfor identifying vascular constitutive relations. Biorheology, 26:687–702, 1989.
K. Ishibashi and T. Matsuda. Reconstruction of a hybrid vascular graft hierarchically layeredwith three cell types. ASAIO Journal, 40(3):M284–M290, 1994.
L. W. Kraiss and A. W. Clowes. Response of the arterial wall to injury and intimal hyperpla-sia. In A. N. Sidawy, B. E. Sumpio, R. G. DePalma, and N. Y. Armonk, editors, The basicscience of vascular disease, pages 289–317. Futura Publishing Company Inc., 1997.
M. S. Lemson, J. H. M. Tordoir, M. J. A. P. Daemen, and P. J. E. H. M. Kitslaar. Intimalhyperplasia in vascular grafts. Eur. J. Vasc. Endovasc. Surg., 19:336–350, 2000.
A. Leuprecht, K. Perktold, M. Prosi, T. Berk, W. Trubel, and H. Schima. Numerical study ofhemodynamics and wall mechancisin distal end-to-side anastomoses of bypass grafts. J.Bioemechanics, 35:225–236, 2002.
D. A. Lewis, R. C. Lowell, R. A. Cambria, P. C. Roche, P. Gloviczki, and V. M. Miller.Production of endothelium-derived factors from sodded expanded polytetrafluorethylenegrafts. J. Vasc. Surgery, 25:187–197, 1997.
X. Li and K. Hayashi. Alternate method for the analysis of residual strain in the arterial wall.Biorheology, 55(6):439–449, 1996.
D. J. Lyman, D. Albo, R. Jackson, and Knutsen K. Development of small diameter vascularprostheses. Trans. Am. Soc. Artif. Intern. Organs, 23:253–261, 1977.

References 77
J. M. Meinders, P. J. Brands, J. M. Willegers, L. Kornet, and A. P. G. Hoeks. Assessment ofthe spatial homogeinity of artery dimension parameters with high frame rate 2-d b-mode.Ultrasound Med. Biol., 27(6):785–794, 2001.
J. Meinhart, M. Deutsch, and P. Zilla. Eight years of clinical endothelial cell transplantation.closing the gap between prosthetic grafts and vein grafts. Asaio J., 43:M515–M521, 1997.
J. Melbin and P. C. Ho. Stress reduction by geometric compliance matching at vascular graftanastomoses. Ann. Biomed. Engr., 25:874–881, 1997.
R. A. Murphy. Mechanics of vascular smooth muscle. In B. F. Bohr, A. D. Somlyo, and H. V.Sparks, editors, Handbook of Physiology, volume 2, chapter 13, pages 325–351. AmericanPhysiological Society, Bethesda, MD, 2nd edition, 1980.
H. Park and K. Park. Biocompatibility issues of implantable drug delivery systems. Pharm.Res., 12:1770–1776, 1996.
M. Pasic, W. Muller-Glauser, L. von Segresser, B. Obermatt, M. Lachat, and M. Turina.Endothelial cell seeding improves patency of synthetic vascular grafts: manual versus au-tomatised method. Eur. J. Cardiothorac. Surg., 10:372–379, 1996.
D. J. Patel and D. J. Fry. The elastic symmetry of arterial segments in dogs. Circ. Res., pages1–8, 1969.
N. A. Peppas. Hydrogels in Medicine and Pharmacy, volume I and II. CRC Press, BocaRaton, Florida, 1987.
K. Perktold, A. Leuprecht, M. Prosi, T. Berk, M. Czerny, W. Trubel, and H. Schima. Fluiddynamics, wall mechanics and oxygen transfer in peripheral bypass anastomoses. Ann.Biomed. Eng., 30:447–460, 2002.
L. H. Peterson, R. E. Jensen, and J. Parnell. Mechanical properties of arteries in vivo. Circ.Res., 8:622–639, 1960.
R. Pietrabissa. Biomateriali per organi artificiali e protesi. Patron Editore, 1996. In Italian.
L. A. Poole-Warren, K. Schindhelm, A. R. Graham P. R. Slowiaczek, and K. R. Noble. Per-formance of small diameter synthetic vascular prostheses with confluent autologous en-dothelial cell linings. J. Biomed. Mater. Res., 30(2):221–229, 1996.
M. Prager, P. Polterauer, and H. J. Bohmig et al. Collagen versus gelatin-coated dacronversus stretch polytetrafluorethylene in abdominal aortic bifurcation graft surgery: resultsof a seven year prospective, randomized multicenter trial. Surgery, 130:408–414, 2001.
J. A. G. Rhodin. Architecture of the vessel wall. In B. F. Bohr, A. D. Somlyo, and H. V.Sparks, editors, Handbook of Physiology, chapter 1, pages 1–31. American PhysiologicalSociety, Bethesda, MD, 2nd edition, 1980.
M. R. Roach and A. C. Burton. The reason for the shape of the distensibility curve of arteries.Canad. J. Biochem. Physiol., 35:681–690, 1957.

78 References
M. E. Safar, G. M. London, J. A. Bouthier, J. A. Levenson, and S. Laurent. Brachial arterycross-sectional area and distensibility before and after arteriolar vasodilation in men withsustained hypertension. J. Cariovasc. Pharmacol., 9:734–742, 1987.
C. E. Schmidt and J. M. Baier. Acellular vascular tissues: natural biomaterials for tissuerepair and tissue engineering. Biomaterials, 21:2215–2231, 2000.
A. Segal. SEPRAN user manual, standard problems and programmers guide. Ingenieursbu-reau SEPRA, Leidschendam, the Netherlands, 1984.
R. M. Shah, G. L. Faggioli, and S. Mangione et al. Early results with cryopreserved saphe-nous vein allografts for infrainguinal bypass. J. Vasc. Surg., 18:965–969, 1983.
Y. Shau, C. Wang, J. Sheih, and T. Hsu. Noninvasive assessment of the viscoelasticity ofperipheral arteries. Ultrasound Med. Biol., 25(9):1377–1388, 1999.
V. S. Sottiurai, J. S. T. Yao, R. C. Batson, S. L. Sue, R. Jones, and Y. A. Nakamura. Distalanastomotic intimal hyperplasia: histopathologic character and biogenesis. Annals Vasc.Surg., 3(1):26–33, 1989.
A. J. M. Spencer. Continuum mechanics. Longman, London, 1980.
A. J. M. Spencer. Continuum theory of the mechanics of fibre-reinforced composites. SpringerVerlag, 1984.
N. Stergiopulos, D. F. Young, and T. R. Rogge. Computer simulation of arterial flow withapplications to arterial and aortic stenoses. J. Biomech., 25(12):1477–1488, 1992.
S. A. Taheri. Superficial femoral-popliteal veins and reversed saphenous veins as primaryfemoropopliteal bypass grafts: a randomised comparative study [letter]. J. Vasc. Surg., 6:624–625, 1987.
T. T. Tanaka and Y. C. Fung. Elastic and inelastic properties of the canine aorta and theirvariation along the aortic tree. J. Biomechanics, 7:357–370, 1974.
O. E. Teebken and A. Haverich. Tissue engineering of small diameter vascular grafts. Eur. J.Vasc. Endovasc. Surg., 23:475–485, 2002.
A. Tozeren. Elastic properties of arteries and their influence on the cardiovascular system. J.Biomech. Engr., 106:182–185, 1984.
W. Trubel, A. Moritz, H. Schima, F. Raderer, R. Scherer, R. Ullrich, U. Losert, andP. Poltrauer. Compliance and formation of distal anastomotic intimal hyperplasia in dacronmesh tube constricted veins used as arterial bypass grafts. ASAIO Journal, 40:M273–M278, 1994.
C. Truesdell and R. Toupin. The classical field theories, Handbuch der Physik III/I. Springer,Berlin, 1960.
A. B. Voorhees, A. Jaretzki, and A. H. Blakemore. The use of tubes constructed from vinyon’n’ cloth in bridging arterial defects. Ann. Surg., 135:332–336, 1952.

References 79
J. Vossoughi, Z. Hedjazi, and F. S. I. Borris. 1993 ASME Advances in Bioengineering, chapterIntimal residual stress and strain in large arteries, pages 434–437. New York, 1993.
H. W. Weizsacker and J. G. Pinto. Isotropy and anisotropy of the arterial wall. J. Biomech.,21(6):477–487, 1988.
N. Westerhof, F. Bosman, C. J. de Vries, and A. Noordergraaf. Analog studies of the humansystemic arterial tree. J. Biomech., 2:121–143, 1969.
H. Westling, L. Jansson, B. Jonson, and R. Nilsen. Vasoactive drugs and elastic properties ofhuman arteries in vivo, with special reference to the action of nitroglycerine. Eur. HeartJ., 5:609–616, 1984.
O. Wichterle and D. Lim. Hydrophilic gels for biological use. Nature, 185:117–118, 1960.
F. L. Wuyts, V. J. Vanhuyse, G. J. Langewouters, W. F. Decraemer, E. R. Raman, and S. Buyle.Elastic properties of human aortas in relation to age and atherosclerosis: A structuralmodel. Phys. Med. Biol., 117:136–145, 1995.
L. Xue and H. P. Greisler. Biomaterials in the development and future of vascular grafts. J.Vasc. Surg., 37(2):472–480, 2003.
M. Yano, T. Kumada, M. Matsuzaki, M. Kohno, T. Hiro, S. Kohtoku, T. Miura, K. Katayama,M. Ozaki, and R. Kusukawa. Effect of diltiazem on aortic pressure-diameter relationshipin dogs. Am. J. Physiol., 256:H1580–H1587, 1989.
C.-D. Young, J.-R. Wu, and T.-L. Tsou. High-strength, ultra-thin and fiber-reinforced phemaartificial skin. Biomaterials, 19:1745–1752, 1998.

80 References
Appendix A
Matrix representation of tangent stiffnesstensor
The linearized balance equations are linear in terms of δEx as it is linear in Lδ = ( E∇δEx)T .The integral can be rewritten in such a way that discretization of the equations results in thedesired tangent stiffness matrix. Therefore terms of the form
( E∇ Ew)T : A = Lw : A, (A.1)
Lw = ( E∇ Ew)T (A.2)
have to be evaluated, where A = −Lδ · σ∗ or A = δτ = 4 M : LT
δ . After evaluation of thedouble dot product the components of both Lw and A can be collected in the columns L
˜ w
and A˜
such that Lw : A = L˜
Tw A
˜. This holds if
L˜ w =
[
Lw x x Lw yy Lw x x Lwxy Lw yz Lw zx Lw yx Lwzy Lw xz
]T, (A.3)
A˜
=[
Ax x Ayy Azz Ayx Azy Axz Axy Ayz Azx
]T. (A.4)
Notice that we cannot use symmetry as both Lw i j and Lw j i with i = j = x, y, z, i 6= jappear in these expressions and Lδ does not possess symmetry. Since all terms of the integralare linearly dependent on Lδ the column A
˜can be rewritten in the form A
˜= X L
˜. Then
each of the products defining A yields a X-matrix, which is a part of the tangent matrix.As the product Lw : δτ depends on the chosen constitutive equation only the product withA = −Lδ · σ
∗ will be discussed here. This term, which originates from linearizing F−11 is
81

82 Appendix A
rewritten such that A˜
= 6H˜
with
6 = −
σx x 0 0 σxy 0 0 0 0 σzx
0 σyy 0 0 σyz 0 σxy 0 0
0 0 σzz 0 0 σzx 0 σyz 0
0 σxy 0 0 σzx 0 σx x 0 0
0 0 σyz 0 0 σxy 0 σyy 0
σzx 0 0 σyz 0 0 0 0 σzz
σxy 0 0 σyy 0 0 0 0 σyz
0 σyz 0 0 σzz 0 σzy 0 0
0 0 σzx 0 0 σx x 0 σxy 0
. (A.5)
The expression for L˜
and L˜ w can be rewritten using the interpolation functions such that
L˜
= Bδx˜ e and L
˜ w = B˜
Tww
˜ e with
B =
∂N1∂x 0 0 ∂N2
∂x 0 0 · · · ∂Nn∂x 0 0
0 ∂N1∂y 0 0 ∂N2
∂y 0 · · · 0 ∂Nn∂y 0
0 0 ∂N1∂z 0 0 ∂N2
∂z · · · 0 0 ∂Nn∂z
∂N1∂y 0 0 ∂N2
∂y 0 0 · · · ∂Nn∂y 0 0
0 ∂N1∂z 0 0 ∂N2
∂z 0 · · · 0 ∂Nn∂z 0
0 0 ∂N1∂x 0 0 ∂N2
∂x · · · 0 0 ∂Nn∂x
0 ∂N1∂x 0 0 ∂N2
∂x 0 · · · 0 ∂Nn∂x 0
0 0 ∂N1∂y 0 0 ∂N2
∂y · · · 0 0 ∂Nn∂y
∂N1∂z 0 0 ∂N2
∂z 0 0 · · · ∂Nn∂z 0 0
, (A.6)
and
B˜
Tw =
[
∂N1∂x
∂N1∂y
∂N1∂z
∂N2∂x
∂N2∂y
∂N2∂z · · · ∂Nn
∂x∂Nn∂y
∂Nn∂z
]
, (A.7)
where Ni is the interpolation function for the displacement in nodal point i .

Appendix B
Tangent stiffness matrix for compositeconstitutive equation
To find the material stiffness matrix we need to write the tangent tensor δτ in matrix formthat the multiplication δτ
˜= C L
˜forms the correct components of the tangent tensor. In the
remaining part of this section we will denote the individual components of Ee with ei , i =x, y, z. The components of the tensor EeEe are arranged into a column vector e
˜with its compo-
nents defined as
e˜
=[
exex eyey ezez ex ey eyez ezex eyex ezey exez
]T. (B.1)
Equation (2.51) suggests us to write the tangent stiffness matrix as
C = C τ + n[
(
τ f − Ee · τ · Ee)
C1 − C2 + 2(
∂τ f
∂λ2 λ2 −(
τ f − Ee · τ · Ee)
)
C3
]
. (B.2)
Evaluation of (K + K T ) gives 9 components which can be rearranged to form C 1:
C1 =
2ex ex 0 0 2ex ey 0 0 0 0 2ezex
0 2eyey 0 0 2eyez 0 2ex ey 0 0
0 0 2ezez 0 0 2ezex 0 2eyez 0
ex ey ex ey 0 eyey ezex 0 ex ex 0 eyez
0 eyez eyez 0 ezez ex ey ezex eyey 0
ezex 0 ezex eyez 0 ex ex 0 ex ey ezez
ex ey ex ey 0 eyey ezex 0 ex ex 0 eyez
0 eyez eyez 0 ezez ex ey ezex eyey 0
ezex 0 ezex eyez 0 ex ex 0 ex ey ezez
. (B.3)
The term δ(
Ee · τ · Ee)
EeEe representing the isotropic (matrix) stiffness in the fiber direction isapproximated by
δ(Ee · τ · Ee)EeEe ≈ δτee Lee = δτee e˜
T L˜, (B.4)
83

84 Appendix B
hence
C2 = (Ee · δτ · Ee) e˜
T L˜, (B.5)
where (Ee · δτ · Ee) can be computed using the isotropic stiffness matrix C τ . The scalar K =Ee · Lδ · Ee can be written as K = e
˜T L
˜, so K EeEe = e
˜e˜
T L˜
, hence
C3 = e˜e˜
T . (B.6)

Samenvatting
Het vervangen van, of het aanbrengen van een bypass rondom, vernauwde arterien is eenveel voorkomende ingreep in klinieken. Het gebruik van synthetische vaatprotheses bij ditsoort interventies is beperkt tot bloedvaten met grote diameter. Voor vaten met een diameterkleiner dan 5 mm, zijn synthetische vaatprotheses weinig succesvol en wordt vaak gebruikgemaakt van autoloog materiaal (venen of arterien) van de patient.
Een groot aantal factoren speelt een belangrijke rol bij het falen van synthetische vaat-protheses met kleine diameter. Een veelvoorkomende pathologie is distale intimale hyper-plasie. Het compliantieverschil tussen de prothese en het natuurlijk vat lijkt een belangrijkeoorzaak te zijn voor het falen van een prothese. Het verbeteren van de mechanische compa-tibiliteit tussen het natuurlijke vat en de vaatprothese zou daarom kunnen bijdragen aan eenverbeterde functionaliteit.
De ontwikkeling van een vaatprothese die mechanisch equivalent is met een natuurlijkvat, vraagt om onderzoek van de mechanica van arterien en mogelijke prothesen. Om deontwerpparameters voor zo een prothese te kunnen bepalen is een goed gedefinieerde pro-cedure noodzakelijk. Startpunt was het mogelijke gebruik van een vezelversterkte hydrogel.Een hydrogel beschikt in het algemeen over goede biocompatibiliteitseigenschappen. Omhet materiaal de juiste eigenschappen en sterkte te geven is echter vezelversterking noodza-kelijk. De ontwerpparameters voor de hydrogel prothese worden verkregen door het gebruikvan een wiskundig model dat in staat is vezelversterkt materiaal te beschrijven. De gewensteeigenschappen van de prothese worden bepaald door middel van experimenten aan menselijkarterieel weefsel. Met behulp van het model kunnen de parameters voor een mechanischequivalente hydrogel prothese worden bepaald.
Het model speelt een belangrijke rol in het ontwerpproces. Het moet het gedrag vanvezelversterkt materiaal kunnen beschrijven en het moet beschikken over parameters die voorhet fabriceren van de prothese gebruikt kunnen worden. Door het materiaalmodel in eengegeneraliseerde vorm te schrijven, kan een grote diversiteit aan materiaalmodellen wordengebruikt. De vezeldichtheid is een typische ontwerpparameter en is geıntroduceerd als mate-riaalparameter door middel van een mengtheorie. Deze laatste is aangepast om te corrigerenvoor het een-dimensionale karakter van de vezelspanning. Er wordt een updated Lagrangeformulering gebruikt voor de implementatie van het materiaalmodel in een eindige elementenprogramma.
Experimentele data van menselijke arterien vormen de basis voor het ontwerp van deprothese. Hiervoor zijn de mechanische eigenschappen van twee bloedvaten bepaald. Dedata zijn verkregen met behulp van een opstelling die een dynamische interne druk kan op-leggen aan een arterie en tegelijkertijd de interne druk, de axiale kracht en de binnen- en
85

86 Samenvatting
buitendiameter kan meten. Meting van binnen- en buitendiameter geschiedt door middel vaneen ultrageluid-systeem en een schattingsalgoritme voor de distensie. De mechanische eigen-schappen van een arterie onder interne druk worden beschreven met een constitutief modelvoor vezelversterkte materialen, waarmee zowel de radius als de axiale kracht nauwkeurigbeschreven kunnen worden.
Hydrogels bestaan uit lange polymeerketens die grote hoeveelheden water kunnen be-vatten. Deze materialen hebben in het algemeen goede biocompatibele eigenschappen. Ominzicht te verkrijgen in de productie van een vezelversterkte hydrogel is een prototype gepro-duceerd. Om de procedure een keer te kunnen doorlopen worden, worden de materiaalpa-rameters van de hydrogel en vezels bepaald door middel van een trekproef. De resultaten vaneen model van het prototype, dat is gebaseerd op de gevonden materiaalparameters, komenovereen met gemeten resultaten. Met behulp van de eerder verkregen data van natuurlijkvaten, kan een set parameters worden bepaald voor een hydrogel prothese, die in het physiol-ogische gebied, mechanisch equivalent is.
Het compliantieverschil tussen een bloedvat en een prothese wordt vaak gezien als eenbelangrijke oorzaak van de vorming van intimale hyperplasie bij anastomoses. Er wordtaangenomen dat de spanning in de wand en wandschuifspanning een belangrijke rol spelen.De meeste numerieke studies betreffen de vloeistofdynamica en de verdeling van wandschuif-spanning. In studies betreffende de spanning in de vaatwand wordt vaak een lineair, isotroopmateriaal gedrag verondersteld. In deze studie is aangetoond dat de keuze van het mate-riaalmodel een grote invloed heeft op de uiteindelijke verdeling van spanning. Als axialevoorrek en residuele spanning worden genomen dan moet een niet-lineair materiaalmodelgebruikt worden. De huidige manier om residuele spanning te modelleren levert een aan-tal problemen op bij het uitvoeren van numerieke simulaties. Adaptatiemodellen bieden eenbetere manier om residuele spanning te kunnen modelleren.

Dankwoord
Zo, de laatste pagina. Uiteraard heeft het niet zover kunnen komen zonder de hulp en onder-steuning van een aantal mensen. Graag wil de mensen bedanken die hebben meegewerkt aande totstandkoming van dit proefschrift.
Graag wil ik Frans van de Vosse bedanken. Frans, de discussies met jou waren altijd ergzinvol en verhelderend. Bovendien heb je in de laatste fase van de strijd toch maar steedsweer tijd vrijgemaakt om mijn proefschrift te lezen.
Ook een woord van dank aan de afstudeerders die ik heb mogen begeleiden: Emiel Peeters,Umberto Nocco en Elisa Vireca. Emiel, bedankt voor het werk dat je hebt geleverd aan hetbouwen van de opstelling. To the Italian students: thank you very much for your contributionto this thesis.
Ik dank alle collega’s van de Materials Technology groep en in het bijzonder: Jurgen deHart voor het opsporen van laatste foutjes in de code, Leo Wouters, Patrick van Brakel en demensen van de werkplaats voor het realiseren van de opstelling en het opknappen van alletussendoor-klusjes.
Natuurlijk wil ik ook mijn (ex)-kamergenoten bedanken: Marcel Rutten en Marcel Wijlaars.MarcelR, de drie jaar bij jou op de kamer waren goed voor een grote dosis nieuwe woorden,zinvolle en minder zinvolle discussies en een mooi uitzicht vanuit de Watchtower. MarcelW,je hebt me vaak geholpen met de chemie in dit project, bovendien heb ik een jaar van je mooiemeubilair gebruik mogen maken.
Ook de jongens van de band verdienen dank: het samen muziek maken was onontbeerlijkvoor de broodnodige ontspanning. Cees, Rian, Anton, Rene en Albert, bedankt voor julliemuzikale ondersteuning.
Wat dichter bij huis, gaat mijn dank uit naar mijn ouders en Rob. Jullie hebben me altijdondersteund en waren altijd geınteresseerd in mijn werk.
Vero, bedankt voor je geduld en je steun. Vooral tijdens die zware laatste maanden was jeonmisbaar. Het is nu echt klaar.
87

88 Dankwoord

Curriculum Vitae
9 september 1974 Born in Druten, the Netherlands.
1986-1992 Pax Christi College, Druten (grammar school).
1992-1993 Mechanical Engineering, Eindhoven University of Technology.
1993-1998 Biomechanical Engineering (post-propaedeutics program),Eindhoven University of Technology.
1998-2003 Research Assistant at Materials Technology,department of Biomedical Engineering,Eindhoven University of Technology.
89