Embed Size (px)
Citation preview
Copyright (c) Society of Critical Care Medicine and Lippincott Williams & Wilkins. Unauthorized reproduction of this article is prohibited
Critical Care Medicine www.ccmjournal.org 1
Objective: Mechanical ventilation causes cyclic changes in the heart’s preload and afterload, thereby influencing the circulation. However, our understanding of the exact physiology of this car-diopulmonary interaction is limited. We aimed to thoroughly deter-mine airway pressure distribution, how this is influenced by tidal volume and chest compliance, and its interaction with the circula-tion in humans during mechanical ventilation.Design: Intervention study.Setting: ICU of a university hospital.Patients: Twenty mechanically ventilated patients following coro-nary artery bypass grafting surgery.Intervention: Patients were monitored during controlled mechani-cal ventilation at tidal volumes of 4, 6, 8, and 10 mL/kg with normal and decreased chest compliance (by elastic binding of the thorax).Measurements and Main Results: Central venous pressure, air-way pressure, pericardial pressure, and pleural pressure; pulse pressure variations, systolic pressure variations, and stroke vol-ume variations; and cardiac output were obtained during con-trolled mechanical ventilation at tidal volume of 4, 6, 8, and 10 mL/kg with normal and decreased chest compliance. With increasing tidal volume (4, 6, 8, and 10 mL/kg), the change in intrathoracic pressures increased linearly with 0.9 ± 0.2, 0.5 ± 0.3, 0.3 ± 0.1, and 0.3 ± 0.1 mm Hg/mL/kg for airway pressure, pleural pressure, pericardial pressure, and central venous pressure, respectively.
At 8 mL/kg, a decrease in chest compliance (from 0.12 ± 0.07 to 0.09 ± 0.03 L/cm H2O) resulted in an increase in change in air-way pressure, change in pleural pressure, change in pericardial pressure, and change in central venous pressure of 1.1 ± 0.7, 1.1 ± 0.8, 0.7 ± 0.4, and 0.8 ± 0.4 mm Hg, respectively. Further-more, increased tidal volume and decreased chest compliance decreased stroke volume and increased arterial pressure varia-tions. Transmural pressure of the superior vena cava decreased during inspiration, whereas the transmural pressure of the right atrium did not change.Conclusions: Increased tidal volume and decreased chest wall compliance both increase the change in intrathoracic pressures and the value of the dynamic indices during mechanical venti-lation. Additionally, the transmural pressure of the vena cava is decreased, whereas the transmural pressure of the right atrium is not changed. (Crit Care Med 2014; XX:00–00)Key Words: cardiac output; cardiovascular physiological phenomena; hemodynamics; positive pressure ventilation
Intermittent positive airway pressure (Paw) during mechanical ventilation periodically increases intratho-racic pressure (ITP) and thereby influences the circula-
tion. The temporary increase in airway, pleural, and pericardial pressures (Paw, Ppl, and Ppc, respectively) decrease output of the right heart and, after an initial increase, also decrease out-put of the left heart (1). These ventilation-induced changes, quantified by pulse pressure variation (PPV), systolic pres-sure variation (SPV), and stroke volume variation (SVV), can be used to predict the response to intravascular fluid administration in mechanically ventilated patients (volume responsiveness) (2, 3).
The principles of heart-lung interaction and clinical useful-ness of the dynamic indices to predict fluid responsiveness have been described previously (4–10). However, to our knowledge, there is no study in which the pressure distribution is meticu-lously described from airway to pericardium under different conditions and related to the characteristic changes in the cir-culation in humans. This might also partly explain the current
Copyright © 2014 by the Society of Critical Care Medicine and Lippincott Williams & Wilkins
DOI: 10.1097/CCM.0000000000000345
1Department of Clinical Neurophysiology, MIRA-Institute for Biomedical Technology and Technical Medicine, University of Twente, Enschede, The Netherlands.
2Department of Intensive Care, Radboud University Nijmegen Medical Centre, Nijmegen, The Netherlands.
3Department of Cardiothoracic Surgery, Radboud University Nijmegen Medical Centre, Nijmegen, The Netherlands.
This work was performed at Radboud University Nijmegen Medical Cen-tre, Intensive Care.
Drs. Hofhuizen and van Lavieren contributed equally to this work.
The authors have disclosed that they do not have any potential conflicts of interest.
For information regarding this article, E-mail: [email protected]
Mechanical Ventilation–Induced Intrathoracic Pressure Distribution and Heart-Lung Interactions
Benno Lansdorp, MSc1,2; Charlotte Hofhuizen, MD2; Martijn van Lavieren, MSc1;
Henri van Swieten, MD, PhD3; Joris Lemson, MD, PhD2; Michel J. A. M. van Putten, MSc, MD, PhD1;
Johannes G. van der Hoeven, MD, PhD2; Peter Pickkers, MD, PhD2
Copyright (c) Society of Critical Care Medicine and Lippincott Williams & Wilkins. Unauthorized reproduction of this article is prohibited
Lansdorp et al
2 www.ccmjournal.org XXX2014•VolumeXX•NumberXXX
limitation of the clinical usefulness of the dynamic indices to predict volume responsiveness in clinical practice (11).
To improve our knowledge about the underlying physiol-ogy of heart-lung interaction, the primary aim of the present study was to show to what extent the Paw is distributed to the Ppl, Ppc, and central venous pressures (CVP) and how this dis-tribution is influenced by changes in tidal volume (TV) and chest wall compliance. The secondary objective was to deter-mine how this pressure distribution influences circulation by changing transmural pressures of the right atrium (PtmRA) (and thereby right cardiac pre- and afterload) and dynamic indices and how this is related to fluid responsiveness.
MATERIALS AND METHODSWith the approval of the institutional review board and following written informed consent, 20 patients were studied following elec-tive coronary artery bypass grafting. Exclusion criteria were any cardiac arrhythmias, hemodynamic instability (a change in heart rate or blood pressure > 20%), recent myocardial infarction (< 2 mo), preoperative inotropic or intra-aortic balloon pump sup-port, nonelective surgery, and concomitant pulmonary, endocrine, metabolic, or neurologic diseases. Prior to surgery, each patient received a central venous (internal jugular vein) catheter and an arterial (radial artery) catheter. During surgery, an air-filled 5F bal-loon catheter (12 × 20 mm Tyshak II, NuMed, Canada) was placed in the pleural space (juxtacardiac position) and another one in the pericardial space (at the lateral aspect of the right atrium) and a 5F thermistor-tipped arterial PiCCO catheter (Pulsion Medical Systems, Munich, Germany) was inserted into the femoral artery.
MonitoringOn arrival in the ICU, patients were mechanically ventilated (volume-controlled) with the Servo 300 (Macquet, Rasstat, Germany) and Paw and TV were monitored with a dedicated respiratory monitor (NICO, Philips respironics, Amsterdam, The Netherlands). Arterial blood pressure (ABP), CVP, and electrocardiogram were monitored using an HP monitor (Merlin M1046A, Hewlett Packard, CA). Cardiac output and stroke volume index (SVI) were monitored by a PiCCO moni-toring system (PiCCO 2.0, Pulsion Medical Systems) through thermodilution and calibrated pulse contour analysis. The pericardial and pleural catheters were filled with 0.8 mL of air. This amount of air was determined during in vitro experi-ments prior to the study as the smallest amount of air (in order to minimize possible distortion of the pericardium) that creates a lumen inside the balloon that adjusts to peripheral pressure (positive or negative) and was much smaller than the balloon’s unstressed volume of 7 mL. All variables were recorded on with a sample rate of 200 Hz. All pressures are expressed in mm Hg.
Transmural pressure (Ptm) of the superior vena cava (PtmSVC) was defined as CVP – Ppl, and Ptm of the right atrium (PtmRA) was calculated as CVP – Ppc. The PPV, SPV, and SVV were defined as the mean value of the relative dif-ference in pulse pressure, systolic pressure, and stroke volume over one breath, averaged over a period of five breaths (11).
DesignAfter hemodynamic stability was reached (heart rate or mean arterial pressure fluctuations < 10%) and calibration of the PiCCO, patients were ventilated with four increasing values of TV: 4, 6, 8, and 10 mL/kg ideal body weight (starting at 4 mL/kg). This was repeated during decreased chest wall compliance, by placing an elastic band around the patients’ thorax, aimed to decrease total respiratory system compliance with 25%. Dur-ing these 3-minute periods, minute volume was kept constant by adjusting respiratory rate. The change of the Ptm variation over the different levels of TV was related to the value of the PPV (as a measure of fluid responsiveness).
Statistical AnalysisDifferences in the effect of changes in TV and chest wall com-pliance were compared with repeated-measures two-way anal-ysis of variance since data were normally distributed, including Bonferroni tests for subgroups. Paired Student t tests were used to compare the means of two groups. p values less than 0.05 were considered statistically significant. Data are presented as mean ± sd, and statistical analysis was performed using SPSS 19 for Mac (SPSS, Chicago, IL) and Prism 5 for Mac (Graph-pad Software, La Jolla, CA).
RESULTSPatient characteristics and baseline hemodynamic and venti-latory variables at ICU admission are presented in Table 1. A representative example of the simultaneous recordings of ABP, SVI, Paw, Ppl, Ppc, and CVP is shown in Figure 1. Figure 2
TAbLE 1. Patients’ Characteristics and baseline Hemodynamic and Respiratory Variables During Initial Pressure Regulated Volume Control Ventilation
Patient characteristics Mean ± sd
Patients: male/female 17/3
Age (yr) 66.3 ± 7.9
Weight (kg) 86.6 ± 16.2
Hemodynamic variables at ICU admission
Heart rate (min–1) 84.1 ± 19.5
Mean arterial pressure (mm Hg) 66.5 ± 8.4
Central venous pressure (mm Hg) 11.2 ± 3.6
Cardiac output (L/min) 6.1 ± 1.1
Respiratory variables at ICU admission
Tidal volume (mL/kg IBW) 6.9 ± 0.8
Respiratory rate (min–1) 12.6 ± 1.2
Positive end-expiratory pressure (cm H2O) 6.2 ± 1.8
Plateau pressure (cm H2O) 19.0 ± 4.4
Valuesarepresentedasmean(sd) or number.

Copyright (c) Society of Critical Care Medicine and Lippincott Williams & Wilkins. Unauthorized reproduction of this article is prohibited
Clinical Investigation
Critical Care Medicine www.ccmjournal.org 3
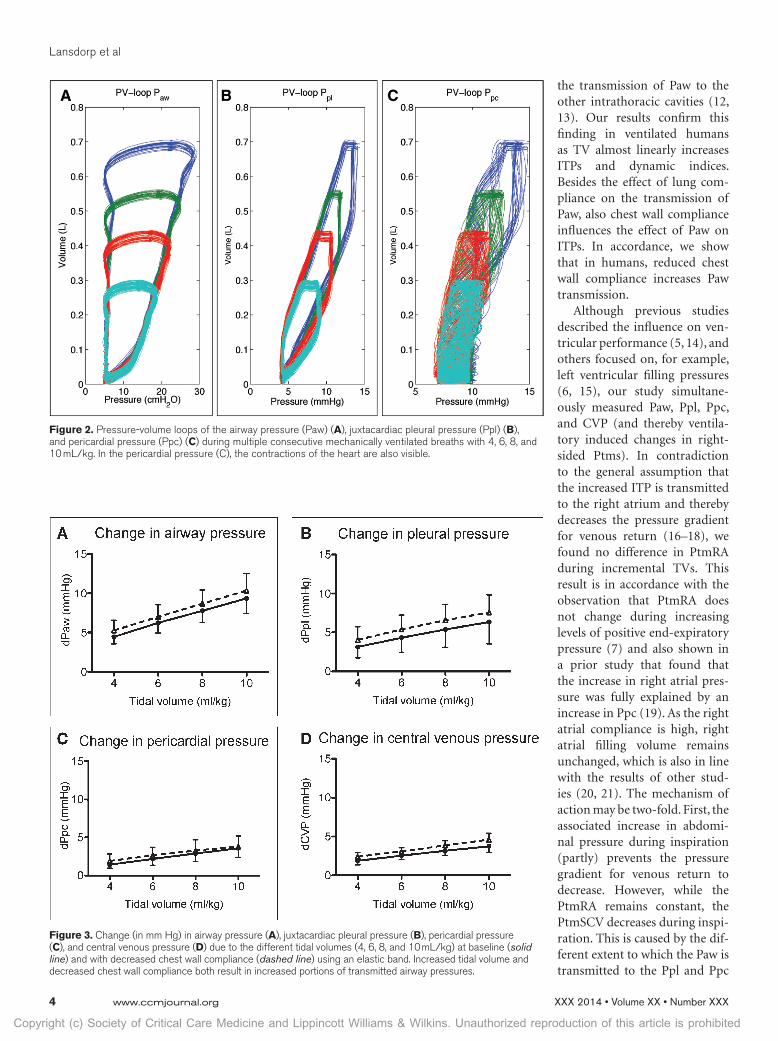
presents pressure-volume loops during consecutive breaths of Paw, Ppl, and Ppc with the four different TVs.
With increasing TVs (and adjusted respiratory rates, result-ing in a mean heart rate to respiratory rate of 3.9 ± 0.6 at 4 mL/kg), the change in ITPs increased significantly (p < 0.01) and linearly with 0.9 ± 0.2, 0.5 ± 0.3, 0.3 ± 0.1, and 0.3 ± 0.1 mm Hg/mL/kg for Paw, Ppl, Ppc, and CVP, respectively (Fig. 3). Elastic banding around the thorax significantly decreased chest wall compliance with 0.03 ± 0.01 L/cm H
2O (23% ±
12%, from 0.12 to 0.09 L/cm H2O), increased end-expiratory
Ppl, Ppc, and CVP (from 5.1 ± 1.7 mm Hg to 6.3 ± 1.2 mm Hg, 7.0 ± 2.3 mm Hg to 8.9 ± 2.1 mm Hg, and 10 ± 2.7 mm Hg to 11.6 ± 2.6 mm Hg, respectively, all p < 0.01), and decreased SVI (from 41.5 ± 5.9 to 39.5 ± 7.1 mL/m2, p < 0.01) at TV of 8 mL/kg. At the different TVs, the decreased chest wall compliance resulted in a 13% ± 7%, 40% ± 21%, 35% ± 16%, and 26% ± 12% increase in change in airway pressure (dPaw), change in Ppl (dPpl), change in Ppc (dPpc), and change in CVP (dCVP), respectively (all p < 0.01) (Fig. 3). At a TV of 8 mL/kg, this meant an increase in dPaw, dPpl, dPpc, and dCVP of 1.1 ± 0.7 mm Hg, 1.1 ± 0.8 mm Hg, 0.7 ± 0.4 mm Hg, and 0.8 ± 0.4 mm Hg, respectively (Table 2).
The percentage of Paw that was transmitted to the juxtacar-diac pleura, pericardium, and vena cava was 70% ± 27%, 37% ± 17%, and 43% ± 11%, respectively (Fig. 4A). These percent-ages did not change significantly with different TVs. However, a small but significant (p < 0.01) larger proportion of Paw was transmitted when chest wall compliance was reduced (77% ± 21%, 39% ± 19%, and 46% ± 11%, respectively, for juxtacar-diac pleura, pericardium, and vena cava). The different extent to which the Paw is transmitted to the Ppl, Ppc, and CVP resulted in a significant decrease in the PtmSVC (p < 0.01),
whereas PtmRA remained unchanged (p > 0.1) during positive pressure ventilation (Fig. 4B).
The alternating ITPs and Ptms during mechanical ventila-tion also caused the SVI to change periodically. SVI signifi-cantly decreased with increasing TV (from 43 ± 6 mL/m2 at 4 mL/kg to 39 ± 6 mL/m2 at 10 mL/kg, p < 0.01) and was sig-nificantly lower with decreased chest wall compliance (mean difference of –2.5 ± 3.3 mL/m2 over all TVs, p < 0.01). The cyclic changes in SVI during mechanical ventilation resulted in arterial pressure variations (PPV, SPV, and SVV) that were more pronounced at higher levels of TV and lower chest wall compliance (Fig. 5).
To determine whether the underlying mechanism of heart-lung interaction is related to volume status, the change of the Ptm variation over the different levels of TV was related to the value of the PPV. Although the PtmRA of the overall population was unchanged during mechanical ventilation, two distinct patterns became apparent. Although some patients consistently showed an increase, others showed a decrease in PtmRA (Fig. 6), which became more pronounced with increas-ing TVs. Figure 7 illustrates the quantification of this change in Ptm variation as a result of the increasing TV using the slope of the trend line. This slope was positive for patients in which the change in Ptm increased, suggesting that the influence of the afterload is becoming more pronounced with increasing TV.
DISCUSSIONThe present study demonstrates to what extent positive pres-sure ventilation influences ITPs and thereby Ptms and dynamic cardiovascular indices and how this is influenced by differ-ent levels of TV and chest wall compliance in ventilated ICU
patients. Our results show that the ratio of Paw that is distrib-uted to the pleura (about two thirds) is almost double the per-centage distributed to the peri-cardium and vena cava (about one third), TV in a clinically rel-evant range does not influence these percentages, and a lower chest wall compliance results in a larger portion of Paw that is transmitted to the Ppl, Ppc, and CVP. Our data also show that increased variations in ITPs also result in more pronounced variations in stroke volume and thereby higher values of the dynamic indices (PPV, SPV, and SVV). Additionally, we showed that the PtmSCV decreases dur-ing inspiration, whereas the PtmRA does not change.
TV is more relevant than Paw as lung compliance influences
Figure 1. Representative example of the simultaneous recording of the arterial blood pressure (ABP) and stroke volume index (SVI) (upper panel) and central venous pressure (CVP), airway pressure (Paw), juxtacardiac pleural pressure (Ppl), and pericardial pressure (Ppc) (lower panel) during mechanical ventilation at 8 mL/kg during volume-controlled ventilation.
Copyright (c) Society of Critical Care Medicine and Lippincott Williams & Wilkins. Unauthorized reproduction of this article is prohibited
Lansdorp et al
4 www.ccmjournal.org XXX2014•VolumeXX•NumberXXX
the transmission of Paw to the other intrathoracic cavities (12, 13). Our results confirm this finding in ventilated humans as TV almost linearly increases ITPs and dynamic indices. Besides the effect of lung com-pliance on the transmission of Paw, also chest wall compliance influences the effect of Paw on ITPs. In accordance, we show that in humans, reduced chest wall compliance increases Paw transmission.
Although previous studies described the influence on ven-tricular performance (5, 14), and others focused on, for example, left ventricular filling pressures (6, 15), our study simultane-ously measured Paw, Ppl, Ppc, and CVP (and thereby ventila-tory induced changes in right-sided Ptms). In contradiction to the general assumption that the increased ITP is transmitted to the right atrium and thereby decreases the pressure gradient for venous return (16–18), we found no difference in PtmRA during incremental TVs. This result is in accordance with the observation that PtmRA does not change during increasing levels of positive end-expiratory pressure (7) and also shown in a prior study that found that the increase in right atrial pres-sure was fully explained by an increase in Ppc (19). As the right atrial compliance is high, right atrial filling volume remains unchanged, which is also in line with the results of other stud-ies (20, 21). The mechanism of action may be two-fold. First, the associated increase in abdomi-nal pressure during inspiration (partly) prevents the pressure gradient for venous return to decrease. However, while the PtmRA remains constant, the PtmSCV decreases during inspi-ration. This is caused by the dif-ferent extent to which the Paw is transmitted to the Ppl and Ppc
Figure 2. Pressure-volume loops of the airway pressure (Paw) (A), juxtacardiac pleural pressure (Ppl) (b), and pericardial pressure (Ppc) (C) during multiple consecutive mechanically ventilated breaths with 4, 6, 8, and 10 mL/kg. In the pericardial pressure (C), the contractions of the heart are also visible.
Figure 3. Change (in mm Hg) in airway pressure (A), juxtacardiac pleural pressure (b), pericardial pressure (C), and central venous pressure (D) due to the different tidal volumes (4, 6, 8, and 10 mL/kg) at baseline (solid line) and with decreased chest wall compliance (dashed line) using an elastic band. Increased tidal volume and decreased chest wall compliance both result in increased portions of transmitted airway pressures.

Copyright (c) Society of Critical Care Medicine and Lippincott Williams & Wilkins. Unauthorized reproduction of this article is prohibited
Clinical Investigation
Critical Care Medicine www.ccmjournal.org 5
during each ventilatory cycle. Apparently, there is a decrease in venous return, but this effect is neutralized by the second mech-anism, which is the increase in afterload. Since the increase of transpulmonary pressure increases right ventricular afterload during lung inflation (22), this results in an increase in PtmRA. Indeed, we found that the effect of a reduced venous return on PtmRA is neutralized by a raised right ventricular afterload. This finding is in accordance with earlier published data that
showed that an inspiratory hold first results in an increase in right ventricular output, followed by a decrease (23).
A more detailed analysis of our data shows two distinct pat-terns within our patient population. Although some patients consistently showed an increase, others showed a decrease in PtmRA, which became more pronounced with increasing TVs. We hypothesize that this change of the Ptm variation is related to the patient’s volume status and that in patients with lower
TAbLE 2. Hemodynamic and Respiratory Variables During Each Stage of the Protocol
Parameter
Normal ComplianceDecreased Compliance due to
Elastic banding
TV (mL/kg) TV (mL/kg)
4 6 8 10 4 6 8 10
Respiratory variables
Respiratory rate (min–1) 21.3 ± 2.0 15.7 ± 1.2 11.7 ± 1.0 9.7 ± 1.2 22.1 ± 2.5 16.1 ± 1.3 12.3 ± 1.2 9.8 ± 0.9
Positive end-expiratory pressure (cm H2O)
6.4 ± 1.5 6.5 ± 1.5 6.4 ± 1.5 6.3 ± 1.2 6.1 ± 1.1 6.1 ± 1.2 6.1 ± 1.1 6.1 ± 1.2
Plateau pressure (cm H2O) 14.9 ± 2.4 18.9 ± 4.3 21.2 ± 3.8 22.6 ± 4.3 16.0 ± 2.8 20.8 ± 4.3 23.0 ± 4.4 24.9 ± 4.9
Peak pressure 18.6 ± 3.5 21.8 ± 4.0 24.5 ± 4.4 26.5 ± 5.0 21.0 ± 4.7 23.9 ± 4.8 26.6 ± 4.9 29.0 ± 5.6
Hemodynamic variables
Heart rate (min–1) 82.4 ± 11.9 82.9 ± 11.3 81.9 ± 12.4 83.9 ± 8.6 84.7 ± 9.6 83.6 ± 12.4 83.7 ± 8.7 83.9 ± 8.7
Mean arterial pressure (mm Hg)
73.0 ± 18.2 72.3 ± 18.0 71.7 ± 18.7 77.1 ± 9.5 79.8 ± 6.1 75.1 ± 5.8 74.9 ± 5.1 75.6 ± 4.5
Stroke volume index (mL/m2)
43.1 ± 7.2 42.9 ± 8.5 41.5 ± 6.1 40.5 ± 7.2 40.9 ± 7.6 40.4 ± 7.1 39.5 ± 7.2 39.4 ± 7.2
Intrathoracic pressures
Mean airway pressure (mm Hg)
9.3 ± 1.9 10.1 ± 1.9 10.6 ± 2.0 10.9 ± 1.9 9.6 ± 1.9 10.3 ± 2.0 10.9 ± 1.9 11.3 ± 2.2
Mean pleural pressure (mm Hg)
6.1 ± 2.1 6.3 ± 2.2 6.6 ± 2.2 6.6 ± 2.2 7.1 ± 2.1 7.2 ± 2.0 7.5 ± 1.9 7.6 ± 1.9
Mean pericardial pressure (mm Hg)
9.0 ± 2.0 9.1 ± 1.9 9.2 ± 1.8 9.2 ± 2.2 10.8 ± 3.4 10.6 ± 2.9 10.7 ± 2.5 10.6 ± 2.4
Mean central venous pressure (mm Hg)
11.0 ± 2.9 11.2 ± 3.0 11.1 ± 2.9 11.5 ± 3.6 13.8 ± 3.5 13.8 ± 3.6 13.2 ± 3.2 13.7 ± 4.0
Changes in intrathoracic pressures
Δ Airway pressure (mm Hg) 4.4 ± 0.9 6.2 ± 1.3 7.8 ± 1.5 9.3 ± 2.0 5.3 ± 1.3 7.0 ± 1.5 8.8 ± 1.7 10.4 ± 2.2
Δ Pleural pressure (mm Hg) 3.1 ± 1.4 4.3 ± 1.9 5.4 ± 2.3 6.3 ± 2.8 4.0 ± 1.7 5.4 ± 1.8 6.6 ± 2.0 7.6 ± 2.3
Δ Pericardial pressure (mm Hg)
1.4 ± 0.5 2.2 ± 0.8 2.7 ± 1.1 3.6 ± 1.2 1.9 ± 0.9 2.7 ± 1.1 3.4 ± 1.4 3.8 ± 1.4
Δ Central venous pressure (mm Hg)
1.9 ± 0.5 2.5 ± 0.5 3.2 ± 0.6 3.7 ± 0.8 2.4 ± 0.5 3.1 ± 0.5 3.9 ± 0.6 4.6 ± 0.8
Dynamic indices
Pulse pressure variation (%) 3.1 ± 2.0 5.7 ± 3.7 8.7 ± 4.9 12.3 ± 7.3 4.3 ± 2.7 6.3 ± 2.3 10.4 ± 4.3 14.4 ± 7.5
Systolic pressure variation (%) 2.0 ± 0.9 4.1 ± 1.8 6.3 ± 2.5 8.4 ± 3.5 2.4 ± 0.8 4.7 ± 1.6 7.4 ± 2.9 10.2 ± 3.9
Stroke volume variation (%) 6.8 ± 4.3 8.5 ± 3.8 12.0 ± 4.9 13.8 ± 5.2 9.1 ± 4.8 12.0 ± 5.8 14.1 ± 6.2 16.6 ± 6.0
TV=tidalvolume.Valuesarepresentedasmean±sd.

Copyright (c) Society of Critical Care Medicine and Lippincott Williams & Wilkins. Unauthorized reproduction of this article is prohibited
Lansdorp et al
6 www.ccmjournal.org XXX2014•VolumeXX•NumberXXX
dynamic indices the Ptm varia-tion of the right atrium increases with increasing TVs, suggesting a more pronounced role of the right ventricural afterload in nonpreload-dependent patients. However, no significant differ-ence was found in the change of the Ptm variation of the right atrium between the patients with a high PPV compared with the patients with a low PPV.
Besides the described influ-ences of mechanical ventilation on the right side of the heart, changes in ITPs also influence the pre- and afterload of the left
Figure 4. Change in airway pressure (Paw), juxtacardiac pleural pressure (Ppl), pericardial pressure (Ppc), and pressure in the vena cava (Pvc) (A) and the change in transmural pressure of the superior vena cava (Pvc – Ppl) and right atrium (Pvc – Ppc) (b) during mechanical ventilation with 8 mL/kg.
Figure 5. Change of dynamic indices as a result of increasing tidal volume and decreasing chest compliance as a percentage of the value at 8 mL/kg with normal compliance. Increased tidal volume and decreased chest wall compliance both result in increased values of the dynamic indices. Solid line indicates normal compliance and dashed line indicates decreased compliance. PPV = pulse pressure variation, SPV = systolic pressure variation, SVV = stroke volume variation.
Figure 6. Influence of increased airway pressure (Paw) on transmural pressure of the right atrium (PtmRA) and superior vena cava (PtmSVC). Both pressures are displayed with and without filtering of the heartbeat. In both patients, the PtmSVC decreases, just like the PtmRA in (A), whereas in (b), the PtmRA increases.

Copyright (c) Society of Critical Care Medicine and Lippincott Williams & Wilkins. Unauthorized reproduction of this article is prohibited
Clinical Investigation
Critical Care Medicine www.ccmjournal.org 7
ventricle. The increase in Ppl decreases left ventricular afterload by decreasing the pressure gradient between the left ventricle and the extrathoracic systemic circulation. Furthermore, the increase in transpulmonary pressure increases left ventricular preload (1).
We also demonstrate the influence of TV on ITPs and dynamic indices. Since the suggested thresholds (12%, 7%, and 12% for PPV, SPV, and SVV, respectively) (3, 24) are based on TV greater than 8 mL/kg, while in clinical practice it is preferred to ventilate with smaller TVs, we advocate that these thresh-olds should be adjusted for the actual applied TV. Although this has been suggested earlier (25), our study provides physiologi-cal and quantitative data for this correction in humans. Based on our results, published threshold values for the prediction of fluid responsiveness should be decreased with 19%, 18%, and 11% for PPV, SPV, and SVV, respectively, for each mL/kg TV when TV is lower (and increased when TV is higher) than 8 mL/kg. Furthermore, correction of the threshold for a change in chest wall compliance should be done with –23%, –18%, and –11% for each 10 mL/cm H
2O change in chest wall compliance
for PPV, SPV, and SVV, respectively. However, regarding the cor-rection for chest wall compliance, it should be noted that in our study, elastic binding of the thorax increased end-expiratory ITPs. Since elastic binding also influenced SVI, this might also increase preload dependency of the patient.
Several limitations of our study need to be addressed. First, the signal-to-noise ratio of Ppc was relatively low because of both the relatively small changes in pressure and movements of the beating heart. To prevent potential distortion of the Ppc due to the balloon used to measure Ppc, we used air-filled balloons with the smallest amount of air that gave similar pressure in the balloon as the surrounding pressure during ex vivo measure-ments. This method and the presented results are comparable to
the results of other animal and human studies (7, 26–30), which confirms its reliability. Second, we used the PiCCO device to monitor cardiac output and SVI. The pulse contour analysis used in the PiCCO device was cali-brated by transpulmonary ther-modilution; however, errors in accuracy and precision may be considerable (31, 32). Third, our patient population may not be similar to other ventilated ICU patients. Our patients underwent cardiac surgery including a medi-astinotomy and pericardiotomy. Although the pericardium and thorax were closed before the start of the measurements, ven-tricular interdependence caused by pericardial volume restraint may have been minimized in our patients (33). Furthermore, our
patients had no pulmonary complications resulting in impaired lung compliance. Therefore, conclusions drawn from this homo-geneous patient population to other ventilated ICU patients should be done with caution.
CONCLUSIONSIncreased TV and decreased chest wall compliance both increase the change in ITPs during mechanical ventilation and result in more pronounced variations in stroke volume and thereby higher values of the dynamic indices. We show that about two thirds of the Paw is transmitted to the pleura and one third to the pericardium and superior vena cava, resulting in a decrease of PtmSCV and an unchanged PtmRA.
ACKNOWLEDGMENTSWe thank Wim Kleinhans and Joris Kleinhans for their techni-cal assistance.
REFERENCES 1. Michard F: Changes in arterial pressure during mechanical ventilation.
Anesthesiology 2005; 103:419–428; quiz 449–455 2. Magder S: Clinical usefulness of respiratory variations in arterial pres-
sure. Am J Respir Crit Care Med 2004; 169:151–155 3.Marik PE, Cavallazzi R, Vasu T, et al: Dynamic changes in arterial
waveform derived variables and fluid responsiveness in mechanically ventilated patients: A systematic review of the literature. Crit Care Med 2009; 37:2642–2647
4. Pinsky MR: The hemodynamic consequences of mechanical ventila-tion: An evolving story. Intensive Care Med 1997; 23:493–503
5. Buda AJ, Pinsky MR, Ingels NB Jr, et al: Effect of intrathoracic pressure on left ventricular performance. N Engl J Med 1979; 301:453–459
6.PinskyM,Vincent JL,DeSmetJM:Estimating leftventricularfillingpressure during positive end-expiratory pressure in humans. Am Rev Respir Dis 1991; 143:25–31
Figure 7. Illustration of the quantification of the change of the transmural pressure variations as a result of increasing tidal volumes (TVs). The upper part shows the airway pressure (Paw) during the four different levels of TV. The middle and the lower parts illustrate the (change in) transmural pressure of two different patients during these levels of TV (of a patient with low and high dynamic indices, respectively). A positive slope (illustrated in the middle part which reflects the patients with low dynamic indices, being nonpreload-dependent) shows that the change of the transmural pressure of the right atrium increases (becomes more positive), indicating that the influence of the afterload is becoming more pronounced with increasing TVs. On the other hand, the patient with high dynamic indices (being preload-dependent) shows a negative slope, indicating that the preload is being decreased more than the afterload is being increased. Ptm_pc = transmural pressure of the pericard, PPV = pulse pressure variation.

Copyright (c) Society of Critical Care Medicine and Lippincott Williams & Wilkins. Unauthorized reproduction of this article is prohibited
Lansdorp et al
8 www.ccmjournal.org XXX2014•VolumeXX•NumberXXX
7.PinskyMR,DesmetJM,VincentJL:Effectofpositiveend-expiratorypressure on right ventricular function in humans. Am Rev Respir Dis 1992; 146:681–687
8. Denault AY, Gasior TA, Gorcsan J III, et al: Determinants of aortic pressure variation during positive-pressure ventilation in man. Chest 1999; 116:176–186
9. Romand JA, Shi W, Pinsky MR: Cardiopulmonary effects of positive pres-sure ventilation during acute lung injury. Chest 1995; 108:1041–1048
10. van den Berg PC, Pinsky MR: Systems approach to heart-lung inter-actions. Neth J Med 2000; 57:113–131
11. Lansdorp B, Lemson J, van Putten MJ, et al: Dynamic indices do not predict volume responsiveness in routine clinical practice. Br J Anaesth 2012; 108:395–401
12. Jardin F, Genevray B, Brun-Ney D, et al: Influence of lung and chest wall compliances on transmission of airway pressure to the pleural space in critically ill patients. Chest 1985; 88:653–658
13. Chapin JC, Downs JB, Douglas ME, et al: Lung expansion, airway pressure transmission, and positive end-expiratory pressure. Arch Surg 1979; 114:1193–1197
14. Gorcsan J III, Romand JA, Mandarino WA, et al: Assessment of left ventricular performance by on-line pressure-area relations using echocardiographic automated border detection. J Am Coll Cardiol 1994; 23:242–252
15. Pinsky MR, Guimond JG: The effects of positive end-expiratory pres-sure on heart-lung interactions. J Crit Care 1991; 6:10
16.GuytonAC,LindseyAW,AbernathyB,etal:Venous returnatvari-ous right atrial pressures and the normal venous return curve. Am J Physiol 1957; 189:609–615
17. Qvist J, Pontoppidan H, Wilson RS, et al: Hemodynamic responses to mechanical ventilation with PEEP: The effect of hypervolemia. Anesthesiology 1975; 42:45–55
18. Morgan BC, Martin WE, Hornbein TF, et al: Hemodynamic effects of inter-mittent positive pressure respiration. Anesthesiology 1966; 27:584–590
19.TybergJV,TaichmanGC,SmithER,etal:Therelationshipbetweenpericardial pressure and right atrial pressure: An intraoperative study. Circulation 1986; 73:428–432
20. van den Berg PC, Jansen JR, Pinsky MR: Effect of positive pressure on venous return in volume-loaded cardiac surgical patients. J Appl Physiol (1985) 2002; 92:1223–1231
21.Vieillard-BaronA,LoubieresY,SchmittJM,etal:Cyclicchanges inright ventricular output impedance during mechanical ventilation. J Appl Physiol (1985) 1999; 87:1644–1650
22. Jardin F, Delorme G, Hardy A, et al: Reevaluation of hemodynamic con-sequences of positive pressure ventilation: Emphasis on cyclic right ventricular afterloading by mechanical lung inflation. Anesthesiology 1990; 72:966–970
23. van den Berg PC, Grimbergen CA, Spaan JA, et al: Positive pres-sure inspiration differentially affects right and left ventricular out-puts in postoperative cardiac surgery patients. J Crit Care 1997; 12:56–65
24. Michard F, Boussat S, Chemla D, et al: Relation between respiratory changes in arterial pulse pressure and fluid responsiveness in septic patients with acute circulatory failure. Am J Respir Crit Care Med 2000; 162:134–138
25.VistisenST,Koefoed-Nielsen J, LarssonA:Shoulddynamicparam-eters for prediction of fluid responsiveness be indexed to the tidal volume? Acta Anaesthesiol Scand 2010; 54:191–198
26. Hamilton DR, Sas R, Semlacher RA, et al: The relationship between left and right pericardial pressures in humans: An intraoperative study. Can J Cardiol 2011; 27:346–350
27. Mann D, Lew W, Ban-Hayashi E, et al: In vivo mechanical behavior of canine pericardium. Am J Physiol 1986; 251:H349–H356
28.SlinkerBK,DitcheyRV,BellSP,etal:Rightheartpressuredoesnotequal pericardial pressure in the potassium chloride-arrested canine heart in situ. Circulation 1987; 76:357–362
29.SmisethOA,FraisMA,KingmaI,etal:Assessmentofpericardialcon-straint in dogs. Circulation 1985; 71:158–164
30.Hamilton DR, Devries G, Tyberg JV: Static and dynamic operatingcharacteristics of a pericardial balloon. J Appl Physiol (1985) 2001; 90:1481–1488
31. de Waal EE, Wappler F, Buhre WF: Cardiac output monitoring. Curr Opin Anaesthesiol 2009; 22:71–77
32.HadianM,KimHK,SeverynDA,etal:Cross-comparisonofcardiacoutput trending accuracy of LiDCO, PiCCO, FloTrac and pulmonary artery catheters. Crit Care 2010; 14:R212
33. Glantz SA, Misbach GA, Moores WY, et al: The pericardium substan-tially affects the left ventricular diastolic pressure-volume relationship in the dog. Circ Res 1978; 42:433–441