Embed Size (px)
Citation preview

1
NASA Electronic Parts and Packaging (NEPP)
Program
Mechanical Testing of MLCCs
NEPP Task: “Screening Techniques for Ceramic Capacitors with Microcracks”
Alexander Teverovsky
ASRC Federal Space and Defense [email protected]
Work performed at NASA Goddard Space Flight Center
2016

2
Abstract Cracking of multilayer ceramic capacitors (MLCCs), remains a serious problem for space systems.
This problem increases substantially for large size capacitors and in cases when manual soldering
is involved or the system experiences mechanical shock or vibration. In any case, a fracture occurs
when the sum of external and internal mechanical stresses exceeds the strength of the part. To
reduce the probability of cracking, the level of stress should be reduced, e.g. by optimizing the
assembly workmanship and rules for board design, and the strength of the parts increased by
selecting the most mechanically robust capacitors. The latter might possibly be achieved by
selecting MLCCs based on the in-situ measurements of mechanical characteristics using four types
of tests: flexural strength, hardness, fracture toughness, and flex bend testing. Note that military
specifications MIL-PRF-123 and MIL-PRF-55681 do not have requirements for mechanical
testing of the parts. However, specifications for automotive industry components employ two
types of mechanical tests: beam load (break strength) test per AEC-Q200-003 and board flex test
per AEC-Q200-005. A recent military specification for thin dielectric capacitors, MIL-PRF-
32535, has one mechanical test, board flex testing, that is similar to AEC-Q200-005. The purpose
of this report was assessment of the efficiency of different mechanical tests for selection robust
capacitors and comparison of mechanical characteristics of Base Metal Electrode (BME) and
Precious Metal Electrode (PME) capacitors. The report has three parts related to the first three
mechanical tests mentioned above.
Contents
Abstract ....................................................................................................................................... 2
Part I. Flexural Strength Testing of MLCCs ................................................................................... 4
Introduction ................................................................................................................................. 4
Test Method ................................................................................................................................ 8
Strength measurements per AEC-Q200-003 .......................................................................... 8
Comparison of results obtained using Chatillon and Instron testers....................................... 9
Effect of sample orientation for case size 2225 capacitors ................................................... 11
Effect of preconditioning ...................................................................................................... 12
Effect of terminations ........................................................................................................... 14
Effect of voids in the active area........................................................................................... 16
Effect of sample geometry .................................................................................................... 17
Effect of electrodes ............................................................................................................... 18
Test results and discussions ...................................................................................................... 19
Different lots of case size 1825 CDR35 capacitors .............................................................. 19
Effect of terminal solder dip testing and manual soldering .................................................. 20

3
Comparison of BME and PME capacitors ................................................................................ 24
BME and PME 0.33 uF capacitors rated to 50V .................................................................. 24
BME and PME capacitors with case size 1812 .................................................................... 24
MOR distributions for case size 1825 and 1210 PME and BME capacitors ........................ 25
Effect of case size for PME and BME capacitors ................................................................. 26
Comparison of BX and BP types of dielectrics ........................................................................ 27
Summary. .................................................................................................................................. 28
References ................................................................................................................................. 29
Part II. Vickers Hardness Testing ................................................................................................ 31
Introduction ............................................................................................................................... 31
Technique .................................................................................................................................. 32
Test results ................................................................................................................................ 34
Conclusion ................................................................................................................................ 36
References ................................................................................................................................. 36
Part III. Indentation Fracture Test (IFT) ...................................................................................... 38
Introduction ............................................................................................................................... 38
Fracture toughness ................................................................................................................ 38
Flexure Test technique .......................................................................................................... 39
Indentation Fracture Test ...................................................................................................... 40
Factors affecting IFT............................................................................................................. 42
Fracture toughness of MLCCs .............................................................................................. 43
Technique. ................................................................................................................................. 44
Test results ................................................................................................................................ 46
Conclusion ................................................................................................................................ 48
References ................................................................................................................................. 49

4
Part I. Flexural Strength Testing of MLCCs
Introduction Due to the brittleness of ceramic materials, their mechanical strength is typically measured using
the three point (3-p) or four point (4-p) bending test. During this testing a sample of ceramic
material that is placed on two supporting pins (typically rollers) at a distance L is stressed by a
loading top pin (roller) in the middle (3-p testing) or by two pins (rollers) at a distance L/2 (4-p
testing) until the sample breaks. During bending, the top area of the sample (concave side) is under
compressive stress, and the bottom (convex side) is under tensile stress. Because the tensile
strength of ceramics is approximately ten times less than the compressive strength, fracture occurs
at the bottom side so flexure testing assesses the tensile strength of ceramics.
The major factor affecting strength of ceramic materials is the presence of defects. Distributions
of stresses are different for the 3-p and 4-p bending tests and the 4-p testing creates a larger area
of high tensile stresses compared to the 3-p test. For this reason, there is a higher probability to
have critical defects in samples subjected to the 4-p bending, and this testing typically results in
lower values of strength compared to 3-p test. Although both tests are described by ASTM, the
4-p test is recommended for a more comprehensive evaluation of ceramic materials [1].
Advantages of the 3-p bending test are a simpler test fixture and the possibility of testing smaller
size parts that is essential for in-situ measurements on ceramic capacitors.
For a rectangular sample with the thickness d and width b in a three-point bending setup the
flexural strength, or modulus of rupture, MOR, is calculated as:
22
3
bd
FLMOR , (1)
where F is the load during fracture, and L is the distance between supporting pins.
Note that here and below, terms MOR and flexural strength will be used interchangeably.
Requirements for accurate bend-testing of samples with rectangular cross-sections have been
outlined in 1987 by Baraita, Mathews, and Quinn [1]. Analysis of assumptions of the simple beam
theory that was used to derive Eq.(1) have been summarized as follows: (i) The stress and strain
are proportional to the distance from the neutral axis; (ii) Stresses in longitudinal direction are
independent of the lateral distance; (iii) The strain is proportional to the distance from the neutral
axis and stresses are independent of lateral displacements. Note that stresses at the point of contact,
wedging stresses, cause local variations from linearity and disturb tensile stresses on the opposite
side. This might contradict condition (ii) especially for small size samples.
Estimations of possible errors showed that 3-p loading is much less sensitive to load bearing
position than 4-p loading [1]. On the other hand, a 3-p loaded sample is adversely affected by the
presence of wedging stresses at the point of maximum stress. Providing that the beam is
homogeneous and isotropic, and deflections are relatively small, the major sources of errors are
due to external factors. In particular, the most serious errors arise from load bearing friction, beam

5
twisting, and load bearing mislocation. Other errors, such as contact point tangency shift, wedging
stresses, and inaccuracy in load readout can also affect test results.
Analysis of requirements for the fixture, sample size and preparation that had been carried out in
[1] were later used in the “Standard Test Method for Flexural Strength of Advanced Ceramics at
Ambient Temperature”, ASTM-C1161-13 [2]. Requirements of the standard can be summarized
as follows:
1. Test specimens may be 3 by 4 by 45 to 50 mm in size that are tested on 40 mm outer span
four-point or three-point fixtures. Alternatively, test specimens and fixture spans half or
twice these sizes may be used (conditions A, B, and C). A: 2x1.5x25 mm, B: 4x3x45 mm,
C: 8x6x90 mm.
2. The flexure stress is computed based on a simple beam theory, Eq.(1), with assumptions
that the material is isotropic and homogeneous, the moduli of elasticity in tension and
compression are identical, and the material is linearly elastic.
3. The speed of the load application should be 0.2 mm/min for d = 1.5 mm and 1 mm/min for
d = 6 mm. The sensitivity to loading speed is due to the stress corrosion phenomena, which
increases in the presence of moisture [1]. For this reason, fast loading speeds are usually
used in strength tests.
4. Because the major factor affecting strength of ceramic materials is presence of defects,
surface preparation of test specimens can introduce machining microcracks which may
have a pronounced effect on test results [2].
Issues related to measurements of samples that are small compared to the ASTM requirements are
discussed in [3]. For short samples, distributions of stress are changed resulting in increasing shear
stresses, and the flexural strength can be calculated using a corrected expression:
L
d
bd
FLMOR 177.01
2
32
, (2)
The ratio d/L should be small to ensure the sample does not fail in shear.
The strength of a ceramic material is dependent on its inherent resistance to fracture and the size
and severity of flaws [2]. Variations in these cause a natural scatter in test results so the strength
of brittle materials is statistical in nature [4] and is usually described by Weibull distributions.
Larger samples are more likely to have defects, and the larger the specimen, the weaker it is likely
to be [1]. In general, the strength of ceramic materials is in the range from 97 MPa to 375 MPa
[5].
Literature data analyzed by De With [6] showed that the strength values for barium titanate
ceramics are between 100 and 150 MPa. The overall value of the strength for MLCCs ranges from
90 to 280 MPa, and a typical value for X7R capacitors is 120 MPa. Relatively high levels of the
strength are due to smaller size of capacitors compared to samples of bulk materials and to the
presence of metal electrodes. However, De With notes that because of experimental difficulties
with the small specimen size, not too much value should be given to the exact numerical values of
the strength.

6
The variability in strength is large for both the ceramic materials in bulk form and when fashioned
into multilayer capacitors, which is reflected by low values of the slopes, or moduli, m, of Weibull
distributions that are varying in the range from 3 to 11, typically, m = 5 [6].
Measurements of barium titanate (BaTiO3) specimens with different microstructures by Tuan and
Lin [7] have shown that the average strength is in the range 70 to 80 MPa, and the Weibull modulus
varied from 9 to 19. Measurements of the break strength on X7R capacitors with size 1206 from
8 different manufacturers by Bergenthal [8] resulted in MOR values from 160 to 330 MPa. In this
work, noticeable variations of MOR with concentration of silver in Ag/Pd electrodes was
observed: the strength increased from 220 MPa at 30% Ag to 350 MPa in case of pure silver
electrodes.
A detailed review of mechanical properties of barium titanate ceramics was published in 1989 by
Freiman and Pohanka [9]. It had been shown that stresses arising from the ferroelectric phase
transformation in these dielectric materials can be a driving force for crack growth. Stresses
measured above Curie temperature were greater than that measured in the ferroelectric state. The
cubic-to-tetragonal phase transformation creates internal stresses that are added to the applied
stress and lower the strength of barium titanate at room temperature.
The microstructure of the material, its chemical composition, and the composition and phase
content of the grain boundaries, as well as the external environment, i.e., relative humidity, are all
important factors in determining the fracture resistance of barium titanate. Factors affecting the
strength include also electric field that can promote or retard crack growth.
Due to chemical reactions with water molecules in microcracks, barium titanate, similar to other
ceramic materials and glasses, is sensitive to moisture-enhanced crack growth. Because at slower
rates of loading flaws have a longer time to grow, the probability of reaction with moisture is
greater, and the strength of the material is smaller. Moisture is a known factor contributing to
ceramic fracture by chemical reactions at the highly stressed crack tip (similar to creep). For this
reason, humidity in air can have a significant effect on results of flexural strength measurements
even at the rates specified in the ASTM-C1161-13 standard, for 0.2 to 1 mm/min [2]. Most likely
solvents and fluxes used for assembly processes can also enhance crack growth in ceramic
capacitors.
Grain size and porosity are also known factors affecting the strength. The formation of abnormal
grains is especially detrimental because it leads to formation of microcracks [7]. The presence of
microcracks can enhance the fracture toughness (see Part III). However, when concentration of
microcracks is high enough the strength might be reduced.
The effect of processing variables on the mechanical properties of barium-titanate positive
temperature coefficient of resistance (PTCR) ceramics has been studied by Blamey and Parry [10,
11]. It has been shown that conditions of both pre-sintering (compaction and addition of the
binder) and sintering (oxygen pressure) procedures affect the porosity and the strength of ceramics.
At oxygen pressures below 0.2 bar the strength measured by 4-p bending reduced substantially,
from 83 to 48 MPa.
Specific to MLCCs compared to bulk ceramic is the presence of terminals, internal electrodes, and
built-in stresses as a result of the parts’ processing. All these factors affect the strength of

7
capacitors and characteristics of ceramic materials are not directly transferable to the components
[6]. Analysis of stresses in MLCCs has shown that on the free edge, compressive stresses up to
425 MPa are present, while tensile stresses of ~ 65 MPa are present parallel to the free periphery.
At the termination edge, the stress distribution is complex but tensile stresses can reach 80 MPa.
Using a finite element analysis technique, Cozzolino and Ewell estimated a maximum tensile stress
in soldered capacitors of ~150 MPa [12]. Four point bending test measurements and finite element
analysis of three types of X7R capacitors with Ag/Pd electrodes carried out in [13] allowed for
calculations of the maximum tensile strength of the parts. The characteristic values of the strength
and slopes of Weibull distributions, m, were 273 MPa and m = 6.9 for 1206 capacitors, 247 MPa
and m = 5 for 1210 capacitors, and 167 MPa and m = 5.5 for 1812 capacitors.
Measurements of 10 samples of the same type of size 1825 X7R CDR-05 capacitors from two
manufacturers have been carried out as a part of failure investigations by the Indian Space
Research Organization, ISRO. Results showed that the parts had different values of MOR: from
160 to 180 MPa for the part that was susceptible to cracking and from 245 to 285 MPa for a more
robust part [14].
The presence of electrodes in capacitors affects their strength in a complex way. According to
Koripella [15], the presence of electrodes slightly increases the strength of capacitors. De With
[6] noted that electrodes might increase concentration of defects due to difficulties in the binder
removal and thus reduce the strength. On the other hand, compressive stresses in ceramic between
the electrodes can retard crack propagation. Also, when cracks have to extend through the metal
electrodes a part of accumulated energy is dissipated in the plastic deformation of metals.
Lanning and Muhlstein [16] argued that residual compressive stresses that are formed after device
sintering, not crack tip shielding by interactions with metals is a most important strengthening
mechanism in MLCCs. According to their measurements, base metal electrode, BME, X7R
capacitors of size 1206 with 3 electrodes had the characteristic strength of 190 MPa (m = 6.3)
whereas similar parts with 19 electrodes had a much greater strength of 236 MPa (m = 5.3). They
also noted that the fracture initiation sites in MLCCs are located outside the active area of
capacitors and for this reason electrical and mechanical failures cannot be related to the same flaws
in the part.
Al-Saffar et.al. investigated MOR in X7R MLCCs in the range of temperatures and voltages [17].
Increasing voltage from 0 to 150 V increased MOR from 130 MPa to 220 MPa. They also
observed decreasing of MOR as the thickness of the samples increased and increasing as the
number of electrodes increased [18]. The effect of applied electric field on the bending strength
and crack propagation in barium titanate ceramics was discussed by Seo and Kashimoto [19, 20].
The bending strength of composite ceramics can be increased or decreased based on the electric
field direction, and both the strengthened and weakened specimens tended to return to their original
strength by heating over the Tc (Curie temperature) of barium titanate.
In spite of long history of problems with cracking of ceramic capacitors and importance of their
mechanical characteristics, there is still insufficient information in literature on the in-situ
measurements of mechanical strength of MLCCs. The purpose of this part of the report is to
analyze the testing technique as it is described in AEC-Q200-003, assess test results for different

8
lots of ceramic capacitors, evaluate the effectiveness of this technique for revealing mechanically
weak parts, and compare the strength of PME and BME capacitors.
Test Method Strength measurements per AEC-Q200-003
The flexural test for MLCCs in AEC-Q200 qualification requirements is referred to as the “Beam
Load Test”. According to the Process Change Qualification Guidelines, 30 samples from one lot
are to be tested. Per AEC-Q200-003, only the force level at which the part breaks is measured
using a test fixture shown in Fig. 1a and no calculations of MOR are required. The part rupture
prior to any minimum user force requirement is considered a failure. The requirements for the
minimum force should be set in user specifications. However, no methodology for selecting the
minimal force is suggested, and no references to this test were found in the manufacturers’ catalogs
for automotive industry MLCCs.
Due to small sizes of MLCCs, the stress distribution will deviate from pure bending conditions,
and strictly speaking Eq.(1) is not applicable for characterization of ceramic materials used in the
part. Another complicated factor is the presence of variable number of metal electrodes inside the
capacitors and different designs and materials of terminations. However, the purpose of the testing
is mechanical characterization of capacitors rather than ceramic materials. In this regard, MOR
should be considered as an effective flexure strength that characterizes a specific type of
capacitors. If proven valuable, the effective MOR values might allow for comparison of the
mechanical robustness of different types of MLCCs.
Although the error of MOR measurements might be significant, studies carried out in [14] have
demonstrated a correlation between the probability of cracking under manual soldering conditions
and the break strength of the parts. The error of this technique is difficult to estimate. According
to Bergenthal [8] the error below 20% and as low as 10% is obtainable and MOR is a useful tool
for describing and comparing break strength.
Test results described below have been carried using different types of PME and BME capacitors
using a test set-up shown in Fig. 1. A Chatillon TCD225 digital force tester with 1000 N gage was
programmed to detect the breaking force at a loading speed of 6 mm/min. The speed was increased
compared to AEC-Q200-003 to make testing faster and avoid possible effect of moisture.
Additional tests showed that this change does not affect MOR distributions.
a)

9
b) c)
Figure 1. Schematic of the test per AEC-Q200-003 (a), an overall view of the set-up using
Chatillon tester (b), and examples of strength testing of 1210 capacitors (c).
Comparison of results obtained using Chatillon and Instron testers
To compare results obtained using Chatillon tester and a fixture shown in Fig.1 with the results
obtained using Instron and a fixture with rollers used for materials testing, seven groups of
capacitors have been tested using both techniques. The support fixture used in GSFC code 541
(Materials Engineering Branch) had a rollers’ span (base) of 5 mm and size of rollers 3.17 mm for
the base pins and 4.76 mm for the upper pin.
Four groups were 0.47 uF 50 V capacitors with case size 1825, and were marked as BME_A,
BME_C, PME_A and PME_C (last letter here and below indicate the manufacturer). Three more
groups were three lots of PME_A case size 2225, 0.47 uF 50 V capacitors (marked as A1, A2, and
A3). Each group had from 9 to 12 samples. Comparison of maximum loads and MOR values
calculated per Eq.(1) and obtained using different techniques is shown in Fig.2.
a) b)
0
20
40
60
80
100
120
140
0 50 100 150
max load_T
CD
225_avr,
N
max load_Instron_avr, N
BME_A
BME_C
PME_C
PME_V0
50
100
150
200
250
300
0 50 100 150 200 250 300
MO
R_
TC
D2
25_
avr,
MP
a
MOR_Instron_avr, MPa
BME_A
BME_C
PME_C
PME_V

10
c) d)
Figure 2. Correletion between average values of maximum loads (a, c) and MOR (b, d) for size
1825, 0.47 uF 50 V BME and PME capacitors from different manufacturers (a, b) and for three
lots of PME_A, size 2225, 0.47 uF 50 V, capacitors (c, d). Error bars correspond to standard
deviations.
In all cases maximum load values, L, obtained with Chatillon (TSD225) are greater than Instron
data; however, MOR values correlate much better. This is due to different bases used during the
measurements: 5 mm in c.541 set-up and 3.81 mm in c. 562 fixture (per AEC-Q200-003). The
result indicates that in spite of a not pure bending conditions, normalization for the base length
allows for a comparison of MOR values obtained by different set-ups.
Standard deviations for both tests are similar, thus confirming the similarity of test conditions. The
spread of data is due to the actual variation of the strength from sample to sample rather than
inaccuracy of the methods.
Distributions of MOR for capacitors based on combined, c.541 and c.562 data are shown in Fig.3.
Table 1 summarizes parameters of the distributions, slope m and characteristic MOR value, . The
table shows also quantity of the samples used and their thickness.
a) b)
Figure 3. Weibull distributions of the strength for 2 lots of BME and 2 lots of PME, size 1825,
0.47 uF, 50 V capacitors from three manufacturers (a) and for 3 lots of case size 2225 PME_A
0.47 uF 50 V capacitors (b).
0
20
40
60
80
100
120
140
160
180
200
0 50 100 150 200
ma
x lo
ad
_T
SD
22
5_
avr,
N
max load_Instron_avr, N
A1
A2
A3
0
20
40
60
80
100
120
140
160
180
200
0 50 100 150 200
MO
R_
TS
D2
25_
avr,
MP
a
MOR_Instron_avr, MPa
A1
A2
A3
0.47uF 50V , size 1825, BME and PME capacitors
MOR, MPa
cu
mu
lati
ve
pro
ba
bil
ity
, %
40 4001001
5
10
50
90
99
PME_C
BME_C
BME_A
PME_V
PME_A 0.47uF 50V size 2225, three lots
MOR, MPa
cu
mu
lati
ve
pro
ba
bil
ity
, %
40 4001001
5
10
50
90
99
A1
A2
A3

11
Table 1. Characteristics of distributions shown in Fig.3.
Sample QTY m ,
MPa d, mm
BME_A 1825 0.47uF 50V 19 5.8 150.8 1.08
BME_C 1825 0.47uF 50V 19 5.6 135.5 1.01
PME_C 1825 0.47uF 50V 19 6.0 228.9 0.85
PME_V 1825 0.47uF 50V 16 11.0 142.4 0.89
PME_A 2225 A1 22 6.1 135.8 1.01
PME_A 2225 A2 22 7.2 159.0 1.01
PME_A 2225 A3 22 7.9 157.1 1.01
At 90% confidence, the strength for PME_C 0.47 uF 50 V capacitors is greater compared to the
other lots. No substantial difference was observed between the strength of PME_V and BME_C
or BME_A capacitors.
Lots A2 and A3 of size 2225 capacitors had almost identical MOR distributions, whereas lot A1
had lower values of MOR suggesting that the strength is a lot-related characteristic. Weibull
modulus for all tested groups was in the range from 5.6 to 11, which is typical for flexural strength
testing of ceramic materials.
Effect of sample orientation for case size 2225 capacitors
A normal orientation of a sample during testing of size 2225 capacitors corresponds to bending of
the largest side (the load tool is perpendicular to the terminals). At this condition, the base is
determined by the size of the fixture (3.81 mm). In the “along terminations’ orientation, the base
is determined by the length between the middle areas of the terminations (L = 5.1 mm). Results
of testing for two types of size 2225 0.47 uF, 50 V and 0.01 uF 100 V capacitors are shown in
Fig.4.
Sample QTY m ,
MPa
d,
mm
PME_C 0.47uF
50V DC9606 10 6.0 187.4 1.2
Same along
electrodes 10 5.9 205.8 1.2
PME_C 0.01uF
100V DC9220 10 5.6 287.1 0.93
Same along
electrodes 10 8.4 302.1 0.93
Figure 4. Weibull distributions of MOR values calculated for two lots of Mfr.C, size 2225 PME
capacitors (0.47 uF, 50 V and 0.01 uF 100 V) for samples installed in different orientation. The
table shows relevant characteristics of the distributions.
No substantial difference of MOR values for samples from the same lot tested in different
orientations was observed. This confirms that the effective MOR values can characterize the
strength of ceramic capacitors.
Effect of orientation on size 2225 PME capacitors
MOR, MPa
cu
mu
lati
ve
pro
ba
bil
ity
, %
40 4001001
5
10
50
90
99
Mfr.C 0.47uF 50Vsame, along terminations
Mfr.C 0.01uF 100Vsame, along terminations

12
At the 90% confidence level, the strength of 0.47 uF, 50 V capacitors is less than for 0.01 uF 100
V capacitors. This can be due to the different number of metal electrode layers, to different
materials used, or to the difference in the thickness of the samples. According to literature data,
capacitors with larger numbers of electrodes might have a greater strength. As it will be shown
below, according to our data the presence of electrodes does not affect test results substantially.
Because 0.47 uF capacitors have a larger number of electrodes, but lower strength, this factor is
likely not significant.
It will be also shown below that thicker samples have lower strength. However, it seems unlikely
that increasing d by 30% would cause increasing MOR by 50%. It is possible that the difference
in the results shown in Fig.4 is due to materials and process variations. Considering that the parts
were both X7R capacitors and had close lot date codes, ceramic materials were likely the same.
This indicates that process variations as well as the thickness of the samples are the reasons of the
strength variations.
Effect of preconditioning
Eight groups with 5 to 20 samples each of PME_C CDR35BX104AKUS 0.1 uF 50 V, DC0205
were used for this study. Samples in the first group (20 pcs) marked below as “initial” were used
in “as is” condition.
Four groups of capacitors (40 samples total) were polished manually on two sides using #4000
paper and 1 um cloth polisher. Average thickness of capacitors in “as is” condition was 1.076 mm
(STD = 0.014 mm) and after polishing the thickness was about 10 um less, 1.066 mm (STD =
0.012 mm). It is assumed that polishing would obliterate surface flaws without a substantial
decreasing of the thickness of samples.
Three groups with five polished samples each were used to evaluate the effect of Vickers induced
damage on the strength measurements. All group had indentions made in the center of the chip at
the side opposite to the applied load. The groups of damaged capacitors differ by the level of stress
applied to the Vickers indenter (2.5 N, 5 N, and 10 N). The length of the formed cracks increased
from ~20 um to ~ 100 um.
To assess the effect of surface conditions, one group of 10 samples was immersed into activated
rosin flux (Kester 1544 Rosin soldering flux) and baked at 230 ºC for 30 sec. Another two groups
of samples (10 pcs each) were exposed to humid conditions (85% RH, 22 ºC) for 160 hours. One
of these groups consisted of virgin samples, and another group, to simulate the effect of soldering,
had samples stressed by the terminal solder dip (TSD) testing (3 cycles at 350 ºC, 5 sec dwell time
and 3 min cooling).

13
Sample QTY m ,
MPa d, mm
As is 25 6.8 216.7 1.076
polished 16 7.9 207.5 1.065
flux 10 6.1 215.9 1.076
moisture 10 9.3 197.4 1.076
TSD350+ moist. 20 6.8 204.9 1.076
Polish + 10N VH 5 8.2 74.9 1.065
Polish + 5N VH 5 6.8 94.7 1.065
Polish + 2.5N VH 5 4.7* 132* 1.065
*one sample was an outlier
Figure 5. Weibull distributions of MOR for size 1825, 0.1 uF, 50 V PME capacitors after
different treatment before testing.
Data for samples having damage caused by the Vickers indenter indicate that macrodefects with a
size of dozens of micrometers strongly affect results of the strength measurements. However,
distributions for the polished and virgin samples were similar. It is possible that either
microdefects on the surface of capacitors do not affect the strength substantially, or the polishing
process used did not remove defects from the surface. As it will be shown in Part III, microcracks
with a size of a few micrometers or less most likely do not affect results of bend testing.
A thermal shock at 350 ºC (TSD350) also did not reduc mechanical strength of capacitors. Similar
results were obtained using breakdown voltage measurements and indicate that these parts can
sustain thermal shock stresses related to manual soldering. Exposure to humid environments and
application of activated flux did not cause any significant changes in the distributions either, and
their slopes remained in a relatively narrow range, from 6.1 to 9.3.
The effect of preexisting cracks on the strength of 0.33 uF 50 V BME and PME capacitors is shown
in Fig.6. In all cases except for lot PME_V, a substantial decrease in MOR was observed. It
appears that in the presence of cracks the strength of BME capacitors is reduced more substantially
compared to PME capacitors. However, the cracks for this testing were introduced manually by
applying pressure with a Vickers indenter at the central area of the capacitors, so the crack
formation conditions were not controlled. Still, the results show that cracks might possibly have
a different effect on the strength of different types of capacitors.
Note that one out of 21 virgin samples of BME_A capacitors had a value of MOR that was
substantially less than for other parts in the lot. This might be due to the presence of structural
defects in the part.
C DR35BX104A KUS, 0.1uF , 50V , size 1825, Mfr.C
MOR, MPa
cu
mu
lati
ve
pro
ba
bil
ity
, %
40 4001001
5
10
50
90
99
initial
activated rosin flux
polished
moisture: 160hr, 85% RH, 22Cmoisture: 160hr, 85% RH, 22C
TSD350 & moisture
10N
5N2.5N

14
a) b)
Figure 6. Effect of Vickers’ indenter induced cracks on the strength of BME, size 1210 (a) and PME,
size 1825 (b) capacitors. The cracks were formed on the surface opposite to the applied stress.
Table 2. Characteristics of distributions shown in Fig.6.
Sample QTY m , MPa d, mm
BME_A 1210 20 5.0 289.3 0.77
BME_C 1210 21 3.6 331.2 0.81
BME_A 1210 fr 7 NA 151.1 0.77
BME_C 1210 fr 7 7.6 122.3 0.81
PME_V 1825 10 5.4 146.3 0.84
PME_C 1825 11 8.1 158.4 0.93
PME_V 1825 fr 8 7.0 126.5 0.84
PME_C 1825 fr 8 6.9 108.7 0.93
Effect of terminations
Formation of contacts in PME capacitors includes application of silver or Ag/Pd glass frit, high-
temperature glass sintering, electroplating of nickel followed by application of tin or Sn/Pb
finishing. These processes might build in additional stresses in the parts and chemicals used for
electroplating might facilitate crack formation. Both factors can affect mechanical strength of
capacitors. Also, stresses in the fixture used for MOR measurements might be different for
samples with and without terminations due to a “cushion” effect of solder. To assess these effects,
three types of X7R PME capacitors were manufactured using the same ceramic materials with and
without terminations. The samples were tested in as-is condition and after three cycles of solder
dip testing at 350 ºC. Results of testing are shown in Fig.7 and Fig.8 and summarized in Table 3.
Within measurement errors, no effect of terminations on the distributions of flexural strength in
these parts was observed.
One of 22 nF samples without terminations had MOR = 35.5 MPa after TSD350, which is
substantially less than the characteristic MOR value of 93.3 MPa for the group. This deviation is
significant at a confidence level of 90%. It is possible that the reduced MOR value is a result of
the thermal shock stresses. Both types of 2225 capacitors exhibited slightly reduced strength after
TSD testing. For capacitors with terminations, TSD testing reduced MOR by 5% to 7%. The
effect was more significant for parts without terminations where the decrease was 11% to 14%.
BME 0.33uF 50V , size 1210 capacitors
MOR, MPa
cu
mu
lati
ve
pro
ba
bil
ity
, %
50 5001001
5
10
50
90
99
initial
with cracks
BME_C
BME_A
PME 0.33uF 50V , size 1825 capacitors
MOR, MPa
cu
mu
lati
ve
pro
ba
bil
ity
, %
50 5001001
5
10
50
90
99
initial
with cracks
PME_C
PME_V

15
The presence of terminal materials likely lessens temperature gradients across the ceramic during
thermal shock and reduces the probability of cracking.
a) b)
c)
Figure 7. Distributions of MOR for different types of PME_V capacitors and test samples
without terminations.
Figure 8. Average MOR values for different types of X7R PME_V capacitors with and without
terminations. Error bars correspond to the standard deviations.
Case size 1825 capacitors had no significant changes in MOR distributions after solder dip testing.
It is possible that this is due to a smaller size of these parts compared to 2225 capacitors.
MOR values for both case size 2225 capacitors were similar indicating that approximately 20%
increase of the thickness of samples does not affect MOR values. Case size 1825 capacitors had
PME_V 1825, 33 nF , t= 0.87 mm
MOR, MPa
cu
mu
lati
ve
pro
ba
bil
ity
, %
30 2001001
5
10
50
90
99
with terminations
without terminations
without terminations,TSD350
with terminations,TSD350
PME_V 2225, 15 nF , t = 0.9 mm
MOR, MPa
cu
mu
lati
ve
pro
ba
bil
ity
, %
30 2001001
5
10
50
90
99
with terminations
without terminations
without terminations,TSD350
with terminations,TSD350
PME_V 2225, 22 nF , t = 1.08 mm
MOR, MPa
cu
mu
lati
ve
pro
ba
bil
ity
, %
30 2001001
5
10
50
90
99
with terminations
without terminations
without terminations,TSD350
with terminations,TSD350
0
20
40
60
80
100
120
140
PM
E_V
18
25
33
nF
PM
E_V
22
25
15
nF
PM
E_V
22
25
22
nF
MO
R,
Mpa
Effect of terminationsterm
w/o term

16
the thickness similar to 15 nF 2225 capacitors; however on average, their strength was ~ 20%
greater. Wider capacitors have a greater probability of having structural defects and hence a lower
strength.
Table 3. Effect of terminations on characteristics of MOR distributions.
Part Sample QTY m , MPa d, mm
PME_V 1825 33nF
As is 10 6.8 118.0 0.87
w/o terminations 10 5.4 108.4 0.87
w/o term. + 3c. TSD at 350 ºC 43 6.1 112.5 0.87
3c. TSD at 350 ºC 11 5.8 122.0 0.87
PME_V 2225 15nF
As is 10 6.4 93.4 0.9
w/o terminations 10 6.1 104.3 0.9
w/o term. + 3c. TSD at 350 ºC 43 7.7 93.7 0.9
3c. TSD at 350 ºC 15 5.1 87.9 0.9
PME_V 2225 22nF
As is 10 9.0 92.8 1.08
w/o terminations 10 8.4 108.1 1.08
w/o term. + 3c. TSD at 350 ºC 42 6.2* 93.9* 1.08
3c. TSD at 350 ºC 15 8.7 85.8 1.08
* One sample was an outlier.
According to Bergenthal [8], the presence of terminations might cause additional measurement
errors if one termination is larger than the other. In this case, the force may not be applied in a
perpendicular manner and result in some errors. He concluded that the most accurate
measurements can be obtained by testing capacitors without terminations. Our data did not reveal
any substantial variations in the spread of data for samples with and without terminations.
Effect of voids in the active area
Three experimental lots of 82 nF 50 V PME_M capacitors with case size 1206 (lots L1, L2, and
L3) had excessive voiding and were used in this study to evaluate the effect of internal defects on
the strength of capacitors. The presence of voids in all samples was confirmed by the bulk scan
acoustic microscopy.
A comparison of distributions for these three lots and three lots of established reliability CDR32
capacitors is shown in Fig.9. Although experimental parts and CDR32 capacitors could be
manufactured with different materials, a comparison shows that capacitors with voids had lower
strength. On average, the strength of capacitors with defects is more than two times less than for
CDR32 parts; however, some defective lots, e.g. L3, have MOR values only ~30% less than for
CDR32 10 nF capacitors. For these lots, the difference is not that dramatic as one might expect
based on concentration of voids in the part. It should be noted that because MOR values depend
mostly on the tensile strength of a surface layer at the side opposite to the applied force, parts with
defects located in the bulk of capacitors might not affect the strength substantially, and these parts
might have MOR values similar to defect-free capacitors.

17
Sample QTY m ,
MPa d, mm
PME_M 82nF L1 11 4.0 145.8 0.81
PME_M 82nF L3 11 6.8 214.8 0.79
PME_M 82nF L2 11 3.9 258.4 0.71
PME_C 39nF L1 18 4.8 480.3 0.82
PME_C 39nF L2 6 17.1 558.5 0.75
PME_C 10nF 44 5.4 331.2 0.97
Figure 9. Distributions of MOR for PME 1206 capacitors with multiple internal voids (L1, L2,
and L3) and established reliability quality CDR32 capacitors (a). The insert shows an example of
cross-sectioning of one of the experimental samples.
Effect of sample geometry
For this testing, thin (0.5 mm) and thick (1 mm) ceramic plates had been manufactured using the
same technological processes as for manufacturing of MLCCs. The sizes of the blank samples
were 2225, 2256, and 1206. An X7R ceramic material that is typically used in production of PME
capacitors was used to prepare plates of different size and thickness. Distributions of the flexural
strength for these samples and their characteristics are shown in Fig.10.
Decreasing of the thickness of size 2225 and 2256 samples two times resulted in increasing of
MOR by approximately 12% in both cases. This is consistent with other results of this work
showing that variations of thickness, although slightly, do affect the strength measurements, and
thicker samples have smaller values of MOR. Similar results were reported in [18], whereas
Bergenthal [8] showed that capacitors of different thickness have the same strength.
At the confidence level of 90% MOR values for 2256 samples are ~ 20% greater than for 2225
samples. This variation is greater than a possible error related to the base length measurements
and is likely due to the sample size effect. Using an equation that is corrected for small size,
Eq.(2), does not change this result substantially. The effect is likely due to a greater wedge stresses
for smaller length parts.
Slopes of distributions, m, for 2225 and 2256 plates were in a relatively narrow range, from 7.7 to
10. However, for 1206 plates it was much lower, m = 5. The characteristic value of MOR for
1206 plates was also substantially, ~ 70%, greater than for larger plates. Smaller size capacitors
appear to have a lower m and greater spread of data. This might be due to better accuracy of
measurements of larger size parts [8].
The results show that samples of the same material but different sizes might have substantially
different flexural strength. For this reason, this technique does not allow an accurate comparison
of MOR values for different EIA size capacitors. However, for the same size capacitors, but with
different thickness, normalization allows for a more accurate comparative analysis. Still, two
times difference in the thickness can cause ~ 12% MOR variations, and thicker samples tend to
have smaller strength.
PME size 1206 capacitors
MOR, MPa
cu
mu
lati
ve
pro
ba
bil
ity
, %
10 10001001
5
10
50
90
99
CDR32
experimentalsamples
82 nF
L1 L2 39 nF
10 nF
L1
L2
L3

18
Sample QTY m ,
MPa
d,
mm
2225 20 7.7 82.6 1.07
2225 20 8.3 93.0 0.53
2256 10 10.0 118.3 0.54
2256 10 4.8* 103.5* 1.08
2256 w/o
outlier 9 9.2 105.3 1.08
1206 24 5.0 177.3 0.5
*one sample was an outlier
Figure 10. MOR distributions for X7R ceramic plates of different size.
Effect of electrodes
Distributions of MOR for 2225 size PME_M samples manufactured from the same materials as
discussed in the previous section and same processes with 21 electrodes and for samples without
electrodes are shown in Fig. 11. Analysis shows that there is no substantial difference in the
distributions at the 90% confidence level.
Sample QTY m ,
MPa
d,
mm
PME_M 2225
plate 20 7.7 82.6 1.07
PME_M 2225
with electrodes 20 5.2 90.0 1.02
Figure 11. Effect of the presence of electrodes on distributions of MOR.
Test results summarized in Table 3 describe different types of PME_V capacitors manufactured
from the same ceramic materials but with different number of electrodes. Capacitors with 8
electrodes (15 nF) and 11 electrodes (22 nF) had practically the same strength. This confirms that
the presence of electrodes is not a decisive factor in the flexural strength testing. However,
Koripella [15] tested samples with and without electrodes and concluded that the presence of
electrodes slightly increased the strength of capacitors. Considering that the effect is due to
compressive stresses formed between electrodes [16], rather than to the arresting cracks by the
metal, the effect might vary with the process conditions, and reduction of the internal stresses
might make the effect of electrodes negligible. Also, the effect might depend on the thickness of
the cover plates and dielectric layers, and thicker layers might reduce the effect of electrodes.
C eramic plates
MOR, MPa
cu
mu
lati
ve
pro
ba
bil
ity
, %
30 3001001
5
10
50
90
99
2225
225612060.5 mm
0.54 mm
0.53 mm
1.07 mm
1.08 mm
PME_A 2225, effect of electrodes
MOR, MPa
cu
mu
lati
ve
pro
ba
bil
ity
, %
30 3001001
5
10
50
90
99
without electrodes,
t = 1.07 mm
with electrodes,
t = 1.02 mm

19
Test results and discussions Different lots of case size 1825 CDR35 capacitors
Results of testing of 5 different lot date codes of CDR35, 0.33 uF, 50 V capacitors from 2 vendors
and three lots of 0.47 uF, 50 V capacitors, also from two vendors are shown in Fig.12. Capacitors
with close date codes (0135 and 0140) from Mfr.C had practically identical distributions, whereas
parts manufactured approximately a year earlier and a year later had significantly different, more
than 50%, MOR values. Note that according to [14], the difference between MOR values between
a lot susceptible to cracking under manual soldering and a more robust lot was also approximately
50% (~170 MPa in the first case and ~265 MPa in the second). Our results confirm that different
lots of capacitors might have different propensity to crack formation under manual soldering
conditions.
Two lots of 0.47 uF capacitors from Mfr.C had similar distributions that were also close to the
results for 0.33 uF capacitors. For both, 0.33 uF and 0.47 uF, capacitors the flexural strength of
parts produced by Mfr.V was 20% to 35% less than for Mfr.C. Results indicate that both factors,
lot date code and vendor are significant and the flexural strength technique is capable of revealing
lots with reduced strength.
Sample QTY m , MPa d, mm
PME_V
DC1312 10 5.4 146.3 0.84
PME_C
DC1251 11 8.1 158.4 0.93
PME_C
DC0045 15 5.7 246.9 0.92
PME_C
DC0140 13 8.2 201.6 1.02
PME_C
DC0135 15 8.3 206.0 1
Sample QTY m ,
MPa d, mm
PME_C
DC1224 19 6.0 228.9 0.84
PME_V
DC1205 16 11.0 142.4 0.89
PME_C
DC0143 30 7.8 209.5 0.94
Figure 12. Weibull distributions of MOR for case size 1825 PME capacitors with different dates
of manufacturing and different vendors.
C DR35 capacitors rated to 0.33uF , 50V
MOR, MPa
cu
mu
lati
ve
pro
ba
bil
ity
, %
40 4001001
5
10
50
90
99
Mfr.V, DC1312
Mfr.C, DC1251Mfr.C, DC0140Mfr.C, DC0135Mfr.C, DC0045
C DR35 capacitors rated to 0.47uF , 50V
MOR, MPa
cu
mu
lati
ve
pro
ba
bil
ity
, %
40 4001001
5
10
50
90
99
Mfr.V, DC1205
Mfr.C, DC1224
Mfr.C, DC0143

20
Effect of terminal solder dip testing and manual soldering
Different types of capacitors from eleven groups were tested in “as is” condition and after terminal
solder dip testing (TSD350). During TSD350 one terminal of capacitors was touched to molten
solder at temperature 350 ºC for ~ 3 sec while another terminal that was clamped in a fixture
remained at room temperature. After dipping, the parts were cooled down to room temperature in
still air for ~3 min and then the procedure was repeated two more times. A description of parts
used for this study and a summary of test results is shown in Table 4.
MOR distributions for six out of 10 groups did not change substantially (see for example Fig.13a).
A close correlation between characteristic values of MOR measured initially and after TSD350 is
shown in Fig. 13b and indicate that for most lots thermal shock associated with manual soldering
does not reduce flexural strength.
Table 4. Results of the solder dip testing.
Part Number Type C, uF VR,
V size
d,
mm
QTY
init. m
init
QTY
TSD m
TSD
TSD
Outl
iers
Gr.4 C2225A105K5XAH BME_C 1 50 2225 1.65 15 8.2 151 15 6.1* 182* 1
Gr.5 CDR35BX104BKUS PME_C 0.1 100 1825 1.08 30 6.2 183.1 30 6.4* 192* 5
Gr.6 CDR04BX473BKUS PME_C 0.047 100 1812 0.85 12 11.3 212.2 12 9.9 223.8
Gr.7 CDR04BX473BKUS PME_C 0.047 100 1812 0.86 30 12.3 208.7 30 8.9 195.7
Gr.8 M123A12BXB104KS PME_C 0.1 50 1808 1.12 20 4.4 262.6 20 6.2 289.9
Gr.9 CDR34BX333BKUS PME_C 0.033 100 1812 0.87 20 14.7 204.7 20 7 186.7
Gr.10 1808AC103KAT1A BME_A 0.01 1000 1808 1.43 12 11.6 181.1 12 8.7 178.2
Gr.11 CDR35BX334AKUS PME_C 0.33 50 1825 0.92 15 5.7 246.9 15 4.7 222.2
Gr.13 CDR35BX334AKUS PME_C 0.33 50 1825 1 15 8.3 206 14 1.2 96.9 8
Gr.14 CDR35BX474AKUS PME_C 0.47 50 1825 0.94 30 7.7 209.5 30 1.1 108.7 9
Gr.15 CDR34BP472BFUS PME_A 0.0047 100 1812 0.84 30 5.9 410.4 30 5 390
* Calculated without outliers
a) b)
Figure 13. Typical distributions of MOR before and after TSD350 (a) and correlation between
initial and post-TSD350 characteristic values of MOR (b). Confidence bounds set at 95% are
overlapping, so distributions are not substantially different.
C DR04BX473BKUS, DC 0140, effect of TSD350
MOR, MPa
cu
mu
lati
ve
pro
ba
bil
ity
, %
40 4001001
5
10
50
90
99
initial
TSD350
0
100
200
300
400
500
0 100 200 300 400 500
MO
R_post_
TS
D,
MP
a
MOR_init, MPa
Effect of TSD350

21
Four lots of capacitors had one to nine samples with a significantly decreased strength (see Fig.14).
In some cases, samples fractured at the beginning of the testing, and no accurate reading of the
load could be made. For these samples, the MOR value was assumed to be 10 MPa.
It is possible that a substantial reduction of the strength for the three lots shown in Fig.11 was due
to generation of microcracks. If so, this technique might be useful for selecting lots that have a
low risk of failures caused by thermal shock during manual soldering. The appearance of fractured
samples for parts failed at normal and abnormally low loads was the same. Nevertheless, it is
conceivable that the low strength was a result of changes in the position of samples in the fixture
due to additional solder formed on terminations after testing. Tilting of the sample might increase
local stress and facilitate fracture of the part.
a) b)
c)
Figure 14. Effect of terminal solder dip testing on the strength for lots manifesting a substantial
decrease of MOR after the testing: Gr.13 (a), Gr.14 (b), and Gr.5 (c).
Measurements of breakdown voltages, VBR, in the suspected lots were used to verify the presence
of cracks. Similar to MOR testing, these measurements were carried out using virgin and post-
TSD350 capacitors. Although flexural and VBR testing are sensitive to different types of cracks,
the first to defects at the surface of capacitors, and the second to defects in active areas, it is
possible, that thermal shock testing would generate cracks that extend from the surface to internal
areas of the capacitors.
C DR35BX334A KUS, DC 0135, effect of TSD350
MOR, MPa
cu
mu
lati
ve
pro
ba
bil
ity
, %
4 40010 1001
5
10
50
90
99
initial
TSD350
C DR35BX474A KUS, DC 0143, effect of TSD350
MOR, MPa
cu
mu
lati
ve
pro
ba
bil
ity
, %
4 40010 1001
5
10
50
90
99
initial
TSD350
C DR35BX104BKUS, DC 0141, effect of TSD350
MOR, MPa
cu
mu
lati
ve
pro
ba
bil
ity
, %
10 10001001
5
10
50
90
99
initial
TSD350
C 2225A 105K5XA H effect of TSD350
MOR, MPa
cu
mu
lati
ve
pro
ba
bil
ity
, %
10 10001001
5
10
50
90
99
TSD350 initial

22
Some degradation of VBR was observed for Gr.4 only (see Fig.15a). Distributions of breakdown
voltages measured before and after TSD350 for other lots were similar (see 15b). Apparently only
Gr.4, a commercial BME capacitor, might have VBR reduction due to cracking as a result of TSD
testing.
Note also that moduli of Weibull distributions for VBR were in the range from 15 to 70. These
values are much greater compared to MOR distributions and, contrary to results of [9] indicate that
mechanical and electrical breakdowns of the parts have a different nature. This difference is
mostly due to different location of defects that affect VBR (bulk defects) and MOR (surface
defects) measurements [16].
a)
Figure 15. Effect of TSD350 on distributions of breakdown voltages in BME 2225, Gr.4 (a) and
PME 1825 (b) capacitors.
To check whether the post-TSD350 failures during MOR testing were caused by solder build-up
and changes in the terminals’ shape, additional TSD350 testing was carried out using samples from
Gr.5, Gr.9, and Gr.15. After TSD350 testing, these samples were cleaned to make electrodes more
even and uniform by a careful grinding off of additional solder formed on terminals. To increase
the level of stress, half of samples from Gr.5 after a regular one-side TSD350 testing were
subjected to additional thermal shock testing at the second terminal. Results of these tests are
displayed in Fig.16. For comparison, previous test results are also shown.
a) b)
C 2225A 105K5XA H effect of TSD350
breakdown voltage, V
cu
mu
lati
ve
pro
ba
bil
ity
, %
500 1000600 700 800 9001
5
10
50
99
TSD350
initial
Effect of TSD350 on C DR35 capacitors
breakdown voltage, V
cu
mu
lati
ve
pro
ba
bil
ity
, %
500 1500700 900 1100 13001
5
10
50
99
Gr.14Gr.13
Gr.5
initial
TSD350
C DR35BX104BKUS, DC 0141, effect of TSD350
MOR, MPa
cu
mu
lati
ve
pro
ba
bil
ity
, %
10 10001001
5
10
50
90
99
initial
TSD350 one-side
TSD350 one-side, cleaning
TSD350 two-side, cleaning
manual soldering
C DR34BX333BKUS effect of TSD350
MOR, MPa
cu
mu
lati
ve
pro
ba
bil
ity
, %
30 3001001
5
10
50
90
99
initial
TSD350 one-side
TSD350 one-side, cleaning

23
c)
Figure 16. Distributions of MOR for Gr.5 (a), Gr.9 (b), and Gr.15 (c) capacitors measured after
grinding off of terminations.
Contrary to the initial testing that was carried out without cleaning, a distribution of MOR for the
“one-side, cleaning” subgroup of capacitors shown in Fig.16a had no anomalies and was close to
the initial distribution. However, when both sides were stressed, one sample reduced MOR
substantially in spite of the cleaning. Apparently, both factors, crack generation and changes in
the size and shape of terminals, play role in MOR degradation after TSD350 testing. However,
the second factor seemed prevalent.
Capacitors from Gr.9 and Gr.15 after TSD350 and cleaning of the terminals had no outliers.
However, no significant degradation in Gr.9 was observed for capacitors tested without cleaning.
To evaluate further the effect of manual soldering on flexural strength of capacitors, three groups
of capacitors, Gr.5, Gr.7, and Gr.14, were manually soldered onto a cold PWB using a soldering
iron at 350 ºC. No special precautions to avoid contact of the parts with the soldering iron was
made. After electrical testing in humid environments, the parts were desoldered from the board
using the Weller desoldering iron (tweezers, WTA 50) at 350 ºC, and then cleaned from the
excessive solder as described above.
Capacitors from Gr.5 after manual soldering-desoldering (see Fig. 16a) had no significant
deviations from the initial MOR distribution. Distributions for capacitors from Gr.7 and Gr.14
(see Fig.17) also had no anomalies or outliers, but their flexural strength reduced ~ 20% compared
to the initial values. The effect might be due to exposure of X7R MLCCs to high temperatures
exceeding Curie point during manual desoldering. Another reason for the reduced strength for
parts with mechanically removed solder from terminations, is possible damage during grinding.
Bergenthal [8] noted that this risk might be greater than the error caused by measurement with the
termination in place.
C DR34BP472BFUS, effect of TSD350
MOR, MPa
cu
mu
lati
ve
pro
ba
bil
ity
, %
100 10001
5
10
50
90
99
initial
TSD350 one-side, cleaning

24
a) b)
Figure 17. Distributions of flexural strength for Gr.7 (a) and Gr.14 (b) capacitors initially, after
TSD350, and after manual soldering and desoldering.
Comparison of BME and PME capacitors BME and PME 0.33 uF capacitors rated to 50V
Results of the strength measurements for two groups of BME, size 1210, and PME, size 1825, 0.33
uF 50 V capacitors are shown in Fig.18. Same size capacitors from different vendors had similar
distributions, but PME capacitors had ~ 50% lower MOR values. This result might be due to the
difference in the processes and materials used for BME and PME capacitors. However, as the
results above have shown, the difference can be also due to different sizes of the parts.
Sample QTY m ,
MPa d, mm
BME_A 0.33uF
50V 1210 20 5.0 289.3 0.77
BME_C 0.33uF
50V 1210 21 3.6 331.2 0.81
PME_V 0.33uF
50V 1825 10 5.4 146.3 0.84
PME_C 0.33uF
50V 1825 11 8.1 158.4 0.93
Figure 18. Weibull distributions of MOR for PME, size 1825, and BME, size 1210, 0.33 uF 50V
capacitors.
BME and PME capacitors with case size 1812
Two lots of 1 uF 50 V BME capacitors, one lot of 1 uF 50 V PME capacitors, and two lots of 0.1
uF 50 V PME capacitors with the same case size, 1812, have been tested in this study. Two lots
of PME capacitors were from Mfr.V, one lot of BME capacitors was from Mfr.A, and two other
lots (one BME and one PME) were from Mfr.C. Results of these measurements are shown in Fig.
19. Contrary to the previous case, PME and BME capacitors from the same vendors had similar
distributions of MOR.
C DR04BX473BKUS, DC 0140, effect of TSD350
MOR, MPa
cu
mu
lati
ve
pro
ba
bil
ity
, %
40 4001001
5
10
50
90
99
initial
TSD350 one-side
manual soldering
C DR35BX474A KUS, DC 0143, effect of TSD350
MOR, MPa
cu
mu
lati
ve
pro
ba
bil
ity
, %
20 4001001
5
10
50
90
99
initial
TSD350 one-side
manual soldering
0.33uF 50V capacitors
MOR, MPa
cu
mu
lati
ve
pro
ba
bil
ity
, %
10 10001001
5
10
50
90
99
PME_V
PME_C
BME_C
BME_A
size 1825
size 1210

25
The thickness of PME_V samples for 1 uF capacitors was approximately two times greater than
for 0.1 uF (0.7 mm and 1.42 mm); nevertheless, they had very close values of MOR. Considering
that 1 uF capacitors had a substantially greater number of electrodes, and there is a trend of
decreasing MOR with the sample thickness, we might assume that increasing number of electrodes
might somewhat increase the flexural strength of capacitors, which is in agreement with results of
[6, 18].
Sample QTY m ,
MPa
d,
mm
PME_V mil
0.1uF 50V 20 5.6 158.4 0.7
PME_C
0.1uF 50V 22 4 276.1 0.73
PME_V com
1uF 50V 20 8.2 148.5 1.42
BME_C 1uF
50V 18 7.6 250.3 1.14
BME_A 1uF
50V 19 5.5 211.9 1.06
Figure 19. MOR in BME and PME capacitors with case size 1812.
Note that two lots of PME 0.1 uF capacitors, one from Mfr.V and one from Mfr.C, each had one
sample with a substantially lower strength. It is reasonable to assume that this was due to the
presence of structural defects, e.g. microcracks, reducing the strength of the parts.
Results of this study did not reveal any substantial difference in the strength of PME and BME
capacitors. It appears that lots of PME and BME capacitors have a similar probability of having
samples with structural defects that might reduce their strength. Three types out of 53 tested lots
of PME and one out of 24 lots of BME capacitors had outliers on MOR distributions.
MOR distributions for case size 1825 and 1210 PME and BME capacitors
To compare flexural strength of PME and BME capacitors, distributions of the characteristic
values of MOR distributions for case sizes 1825 and 1210 capacitors have been plotted in normal
coordinates in Fig. 20. Results show that BME capacitors of relatively small sizes (1210 and less)
have average strength values similar to PME capacitors. The strength of BME capacitors with
larger case sizes (1825) appear to be less than for PME capacitors. An average characteristic MOR
for 1825 PME capacitors is 194 MPa at a standard deviation of 38 MPa, and for BME capacitors
these values are 131 MPa and 24 MPa.
PME and BME capacitors w ith case size 1812
MOR, MPa
cu
mu
lati
ve
pro
ba
bil
ity
, %
40 4001001
5
10
50
90
99
BME_C
PME_C
BME_APME_V mil.
PME_V com.

26
a) b)
Figure 20. Distributions of characteristic values of MOR for BME and PME capacitors with
case size 1825 (a) and 1210 (b).
Effect of case size for PME and BME capacitors
Characteristic values of MOR for all samples tested in this study are plotted in normal coordinates
in Fig.21 separately, for each case size of BME and PME capacitors. In spite of a substantial
spread of data, there is a trend of decreasing the strength with increasing size of the parts.
a) b)
Figure 21. Effect of case size on the strength of PME (a) and BME (b) capacitors.
The characteristic values and slopes of the relevant MOR distributions are shown in the column
charts in Fig.22 separately for BME and PME capacitors. For both part types there is a trend of
decreasing characteristic MOR values with the size of capacitors. On average, the slopes of the
distributions, m, are somewhat greater for PME compared to BME capacitors, m_PME = 7.9 ± 2.92
and m_BME = 6.8 ± 1.98. MOR values for BME and PME capacitors were similar for cases size
1210 and 1812. However, the strength of 1825 and 1206 size capacitors was ~25% and ~40%
greater for the PME technology.
A greater strength of a smaller size parts might give an additional explanation to the known fact
that smaller capacitors are less prone to board flex failures. Because BME technology allows for
developing same value capacitors with substantially smaller sizes, these parts might be less
vulnerable to assembly-related stresses.
PME and BME capacitors w ith case size 1825
MOR, MPa
cu
mu
lati
ve
pro
ba
bil
ity
, %
0 600120 240 360 4801
5
10
50
99
PME
BME
PME and BME capacitors w ith case size 1210
MOR, MPa
cu
mu
lati
ve
pro
ba
bil
ity
, %
0 600120 240 360 4801
5
10
50
99
PME
BME
Different lots of PME capacitors
MOR, MPa
cu
mu
lati
ve
pro
ba
bil
ity
, %
0 600120 240 360 4801
5
10
50
99
2225
1825
1812
1808
1210
1206
Different lots of BME capacitors
MOR, MPa
cu
mu
lati
ve
pro
ba
bil
ity
, %
0 600120 240 360 4801
5
10
50
99
1825
1812
1210
1206
27
a) b)
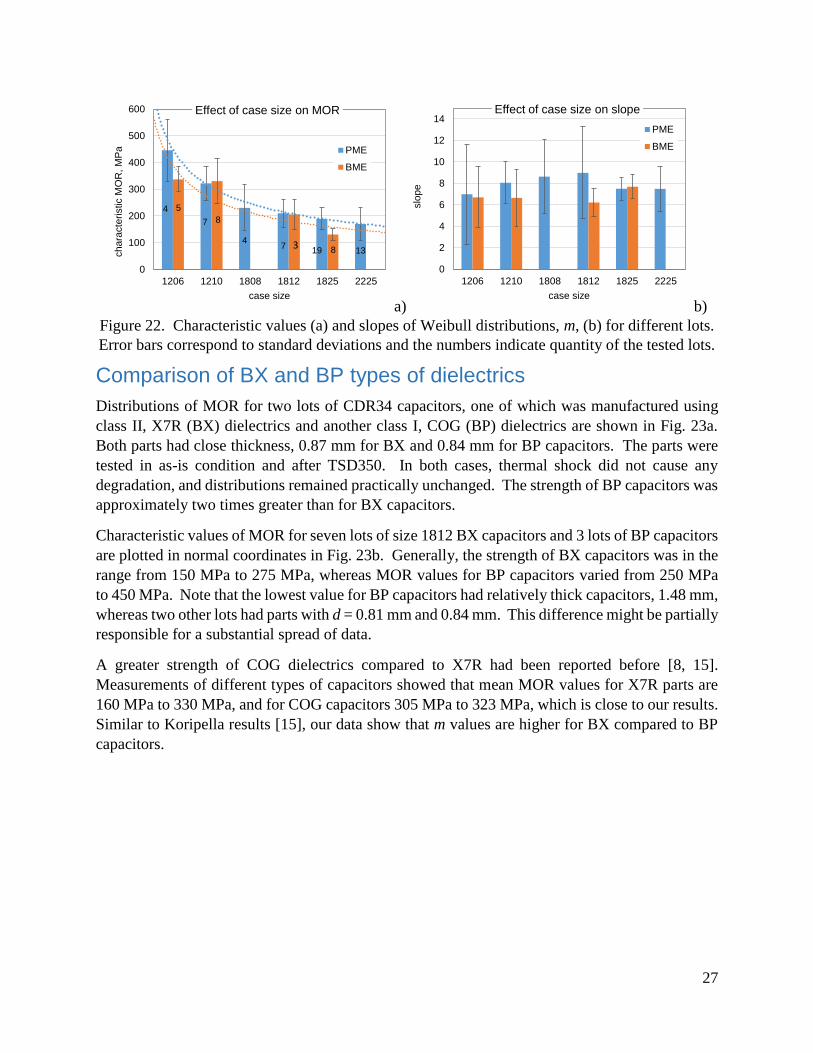
Figure 22. Characteristic values (a) and slopes of Weibull distributions, m, (b) for different lots.
Error bars correspond to standard deviations and the numbers indicate quantity of the tested lots.
Comparison of BX and BP types of dielectrics
Distributions of MOR for two lots of CDR34 capacitors, one of which was manufactured using
class II, X7R (BX) dielectrics and another class I, COG (BP) dielectrics are shown in Fig. 23a.
Both parts had close thickness, 0.87 mm for BX and 0.84 mm for BP capacitors. The parts were
tested in as-is condition and after TSD350. In both cases, thermal shock did not cause any
degradation, and distributions remained practically unchanged. The strength of BP capacitors was
approximately two times greater than for BX capacitors.
Characteristic values of MOR for seven lots of size 1812 BX capacitors and 3 lots of BP capacitors
are plotted in normal coordinates in Fig. 23b. Generally, the strength of BX capacitors was in the
range from 150 MPa to 275 MPa, whereas MOR values for BP capacitors varied from 250 MPa
to 450 MPa. Note that the lowest value for BP capacitors had relatively thick capacitors, 1.48 mm,
whereas two other lots had parts with d = 0.81 mm and 0.84 mm. This difference might be partially
responsible for a substantial spread of data.
A greater strength of COG dielectrics compared to X7R had been reported before [8, 15].
Measurements of different types of capacitors showed that mean MOR values for X7R parts are
160 MPa to 330 MPa, and for COG capacitors 305 MPa to 323 MPa, which is close to our results.
Similar to Koripella results [15], our data show that m values are higher for BX compared to BP
capacitors.
4
7
47
19 13
5
8
8
0
100
200
300
400
500
600
1206 1210 1808 1812 1825 2225
ch
ara
cte
ristic M
OR
, M
Pa
case size
Effect of case size on MOR
PME
BME
3
0
2
4
6
8
10
12
14
1206 1210 1808 1812 1825 2225
slo
pe
case size
Effect of case size on slope
PME
BME

28
a) b)
Figure 23. Weibull distributions of the flexural strength for CDR34 (case size 1812) BX and BP
capacitors (a) and distributions of characteristic MOR values for several lots of BP and BX
capacitors in normal coordinates (b).
Summary. Although the specification for the flexural strength testing exists (AEC-Q200-003), this method
has limited application for quality assurance purposes. The measured break load depends on the
size of capacitors, and for this reason cannot be used to compare the strength of different size
MLCCs. The purposes of this work was evaluation of the technique for quality assurance of
MLCCs and comparison of the strength of PME and BME capacitors.
Effect of sample preparation and terminations.
The flexural strength method determines tensile strength at the surface of capacitors and for this
reason is more sensitive to the presence of surface defects and less sensitive to defects, e.g. voids,
in the active area of capacitors.
Polishing of the samples did not affect MOR measurements suggesting that possible surface
microdefects formed during manufacturing are likely not significant. However, macrodefects, e.g.
cracks with a size of more than 10 m that were created by the Vickers indenter, can reduce the
strength more than 2 times.
Distributions of MOR values did not change substantially after exposure of the parts to high
humidity and application of activated rosin flux.
Measurements of MOR on samples with and without terminations that experienced different
treatment (high-temperature sintering of silver glass and applications of chemicals during
electroplating) showed that the presence of terminations does not affect flexural strength of
capacitors.
Effect of EIA case size and electrodes.
Effective MOR values depend on the EIA size of capacitors, and case size 1206, on average, have
MOR values approximately twice the value for 2225 capacitors. This means, that only the same
EIA size capacitors can be used for comparative analysis of the lots.
Same EIA size capacitors with different thickness have close MOR values. However, thicker
samples tend to have lower strength, and two times increasing thickness might reduce MOR by ~
C DR34 BX and BP capacitors
MOR, MPa
cu
mu
lati
ve
pro
ba
bil
ity
, %
100 10001
5
10
50
90
99
BXBP
initial
after TSD350
PME BX and BP capacitors w ith case size 1812
MOR, MPa
cu
mu
lati
ve
pro
ba
bil
ity
, %
0 500100 200 300 4001
5
10
50
99
BX
BP
29
20%. This effect should be considered when comparing capacitors with substantially different
thickness.
No significant difference in MOR values for capacitors with and without metal electrodes or
samples manufactured using the same ceramic materials, but with different number of electrodes,
was observed.
Effect of lot date codes.
Mechanical strength is a lot-related characteristic of MLCCs. Variations of MOR values from lot
to lot might exceed 50%. It is possible, that lots with higher strength would be less susceptible to
crack formation.
Three out of 53 lots of PME capacitors and one out of 24 lots of BME capacitors had outliers that
might be due to the presence of defects in the parts. However, more statistical analysis is needed
to demonstrate the effectiveness of this technique for selecting lots with mechanically robust
capacitors.
Effect of the terminal solder dip testing and manual soldering.
Terminal solder dip testing of 11 lots showed that only in one case degradation of MOR can be
attributed to crack formation caused by the thermal shock stress.
Considering errors related to changes in configuration of the terminals due to solder build-up and
risks associated with the process of mechanical cleaning, this technique is likely not effective for
selecting parts that would be more robust under manual soldering stresses.
To evaluate the effect of stresses associated with manual soldering, capacitors from three lots were
manually soldered and desoldered using a soldering iron at 350 ºC without special precautions that
are typically required for this process. After these stresses MOR values reduced on average by ~
20%. However, no anomalies in the distributions were observed. Apparently, abusing capacitors
during manual soldering might damage the parts that are susceptible to crack formation either due
to the presence of defects or high level of internal stresses.
Comparison of BME and PME technology.
Comparison of MOR values for BME and PME capacitors showed no substantial difference for
cases size 1210 and 1812. However, the strength of 1825 and 1206 size capacitors was ~25% to
40% greater for the PME technology.
There is a trend of decreasing strength with increasing EIA size of the parts for both PME and
BME capacitors. This might be one of the reasons for the smaller case size capacitors being less
prone to assembly related cracking. Considering that the same value BME capacitors have smaller
size, replacement of PME with BME capacitors might be beneficial for cracking reduction.
Class I and class II dielectrics.
The flexural strength of case size 1812 BX capacitors was in the range from 150 MPa to 275 MPa,
whereas for BP capacitors it is substantially greater, 250 MPa to 450 MPa. These results are
consistent with literature data.
References [1] F. I. Baraita, W. T. Mathews, and G. D. Quinn, "Errors associated with flexture tewsting of brittle materials,"
U.S. Army materials technology laboratory MTL TR 87-35, MTL TR 87-35, 1987

30
[2] Standard Test Method for Flexural Strength of Advanced Ceramics at Ambient Temperature, C1161 − 13,
ASTM, 2013
[3] M P Metcalfe, N. Tzelepi, and D. Wilde, "The Effect of Test Specimen Size on Graphite Strength Size on
Graphite Strength," ASTM Symposium on Graphite Testing for Nuclear Applications, Seattle, WA, 19-20
September, 2013, http://web.ornl.gov/sci/physical_sciences_directorate/mst/INGSM14/ASTM_program.shtml.
[4] G. D. Quinn, B. T. Sparenberg, P. Koshy, L. K. Ives, S. Jahanmir, and D. D. Arola, "Flexural Strength of
Ceramic and Glass Rods," Journal of Testing and Evaluation, vol. 37, pp. 222-244, May 2009.
[5] P. Zhang, S. X. Li, and Z. F. Zhang, "General relationship between strength and hardness," Materials Science
and Engineering: A, vol. 529, pp. 62-73, 11/25/ 2011.
[6] G. De With, "Structural integrity of ceramic multilayer capacitor materials and ceramic multilayer capacitors,"
Journal of the European Ceramic Society, vol. 12, pp. 323-336, 1993.
[7] W. H. Tuan and S. K. Lin, "The microstructure-mechanical properties relationships of BaTiO3," Ceramics
International, vol. 25, pp. 35-40, 1999.
[8] J. Bergenthal, "Mechanical strength properties of multilayer ceramic capacitors," in Capacitor and Resistor
Technology Symposium, CARTS'91, 1991.
[9] S. Freiman and R. Pohanka, "Review of mechanically related failures of ceramic capacitors and capacitor
materials," Journal of the american ceramic society, vol. 72, pp. 2258-2263, 1989.
[10] J. M. Blamey and T. V. Parry, "THE EFFECT OF PROCESSING VARIABLES ON THE MECHANICAL
AND ELECTRICAL-PROPERTIES OF BARIUM-TITANATE POSITIVE-TEMPERATURE-
COEFFICIENT-OF-RESISTANCE CERAMICS .1. ADDITIVES AND PROCESSING PRIOR TO
SINTERING," Journal of Materials Science, vol. 28, pp. 4311-4316, Aug 1993.
[11] J. M. Blamey and T. V. Parry, "THE EFFECT OF PROCESSING VARIABLES ON THE MECHANICAL
AND ELECTRICAL-PROPERTIES OF BARIUM-TITANATE POSITIVE-TEMPERATURE-
COEFFICIENT-OF-RESISTANCE CERAMICS .2. SINTERING ATMOSPHERES," Journal of Materials
Science, vol. 28, pp. 4317-4324, Aug 1993.
[12] M. Cozzolino and G. Ewell, "A Fracture Mechanics Approach to Structural Reliability of Ceramic
Capacitors," IEEE Transactions on Components, Hybrids, and Manufacturing Technology, vol. 3, pp. 250 -
257, 1980.
[13] K. Franken, H. R. Maier, K. Prume, and R. Waser, "Finite-element analysis of ceramic multilayer capacitors:
Failure probability caused by wave soldering and bending loads," Journal of the American Ceramic Society,
vol. 83, pp. 1433-1440, Jun 2000.
[14] S. K. Dash, P. Kumar, M. P. James, S. Kamat, K.Venkatesh, V.Venkatesh, et al., "Study of Cracks in Ceramic
Chip Capacitors (CDR-05) of Two Different Makes," International Journal of Emerging Technology and
Advanced Engineering, vol. 3, pp. 85-90, 2013.
[15] C. Koripella, "Mechanical behavior of ceramic capacitors," IEEE Transactions on Components, Hybrids, and
Manufacturing Technology, vol. 14, pp. 718 - 724, 1991.
[16] W. R. Lanning and C. L. Muhlstein, "Strengthening Mechanisms in MLCCs: Residual Stress Versus Crack Tip
Shielding," Journal of the American Ceramic Society, vol. 97, pp. 283-289, 2014.
[17] R. Al-Saffar and R. Freer, "The effect of multicomponent stress on the mechanical properties of multilayer
ceramic capacitors," in Electronic Ceramic Materials and Devices, 2000, pp. 451-462, <Go to
ISI>://WOS:000183415600043.
[18] R. Al-Saffar, R. Freer, I. Tribick, and P. Ward, "Flexure strength of multilayer ceramic capacitors," British
Ceramic Transactions, vol. 98, pp. 241-245, 1999.
[19] S. Seo and A. Kishimoto, "Effect of polarization treatment on bending strength of barium titanate/zirconia
composite," Journal of the European Ceramic Society, vol. 20, pp. 2427-2431, 12// 2000.
[20] A. Kishimoto, "The control of mechanical strength by an electric field in ceramic composites dispersed with
piezoelectric particles," Journal of Electroceramics, vol. 24, pp. 115-121, 2010.

31
Part II. Vickers Hardness Testing
Introduction Hardness of materials can be defined as a resistance to indentation. A square based diamond
pyramid indenter is used during the Vickers hardness test. The pyramid has an angle of 136º
between the faces [21]. At this angle, the surface area of the footprint with diagonal D is
854.1
2DA (1)
Vickers hardness is calculated as a ratio of the applied force P to the surface area of the footprint:
2
854.1
D
PVH
(2)
If P is measured in kgf and D in mm, VH number is in kgf/mm2. If P is in newtons and D is in
meters, then VH is measured in GPa.
Microhardness testing that is typically used for ceramic capacitors refers to testing with loads less
than 1 kgf (~10N). At these loads, the size of the footprints is typically less than 100 um, and
considering that the depth of the indentation is 1/7 of the diagonal length, rather thin samples can
be used for the testing. This justifies using Vickers microhardness test for in-situ measurements
on ceramic capacitors having cover plate thicknesses of more than a few dozen micrometers.
Vickers hardness test method for advanced ceramic materials is specified in ASTM C1327-15
published in 2015 [22]. This documents recommends using specimens that are at least 0.5 mm
thick at a load of 9.81 N (1 kgf). However, because cracks may influence the measurements, for
materials exhibiting cracking, a lower force is recommended. Due to the indentation size effect
(ISE) that is a variation of VH values with the size of imprint or load, it is recommended that the
hardness measurements are carried out over a broad range of indentation forces.
Cracking during the testing would dissipate a portion of energy that is used to create impression
by plastic deformation of the material. For this reason, one might expect higher hardness values
for materials exhibiting cracking [23]. However, a substantial reduction of the load to avoid
cracking would reduce the imprint size and increase measurement errors.
Investigations showed that the measured hardness decreases as loads increase [23, 24]. The
reasons for the ISE are the friction between the indenter facets and the test specimen and the elastic
resistance of the material. A more significant ISE was observed for hard materials with VH more
than 12.5 GPa. However, variations of VH with load might be negligible for materials having
relatively low hardness.
Quinn, Patel, and Lloyd [25] studied the effect of loading rates on results of hardness
measurements in materials with significantly different hardness. Results show that variation of
loading rates in the range from 0.03 N/s to 10 N/s have negligible effect upon Vickers hardness
measurements.

32
Correlation between the strength and hardness in different types of materials have been analyzed
in [5]. Results show that for plastic materials, e.g. Cu and Cu-Zn alloys, the hardness is
approximately three times greater than the strength. However, the ratio is much greater for ceramic
materials and for these materials no correlation between hardness and strength was observed.
Examples of values of the strength and hardness for different types of ceramic materials cited in
[5] are shown in Table II.1.
Table II.1. Strength, hardness, and ratio of hardness and strength in ceramic materials.
Ceramic Strength,
MPa
HV,
GPa Ratio
PZT 350 9.8 28
B4C 155 28.4 183
Si3N4 375 14.7 39
Al2O3 310 15.2 49
SiC 355 24.5 73
TiB2 275 26.5 96
MgO 97 7.7 79
Wereszczak, Riester, and Brederl [26, 27] measured hardness for three types of X7R case size
0805 0.1 uF ceramic capacitors from different manufacturers. Average Berkovich hardness values
were close and varied from 11.4 GPa to 11.9 GPa at a standard deviations based on 40 samples
varying from 0.6 to 1. The authors noted that hardness is not a direct indicator of the potential
mechanical robustness of capacitors. However, because hardness is typically decreasing with
porosity of ceramics, its value might provide some insight into the effects of porosity and grain
size of the materials used in capacitors.
Our studies of Vickers hardness of 6 types of different X7R capacitors showed VH in the range
from 6.5 to 10.5 GPa at standard deviations from 1 to 1.7 [28]. These results are somewhat less
than in the Wereszczak’s studies.
Although literature data on the in-situ measurements of hardness of ceramic capacitors are limited,
one study indicates a possible correlation between VH values and the probability of cracking of
capacitors during assembly. Dash and co-workers [14] found that a lot of CDR05 capacitors from
manufacturer A had a significantly larger proportion of post-assembly cracks compared to
manufacturer B. In-situ measurements of Vickers hardness showed greater values for Mfr.B
capacitors (average VH number 833, or ~8.3 GPa) compared to capacitors from Mfr.A that had
average VH number 716, or ~7.2 GPa.
In spite of promising results obtained in [14], it is still not clear whether a 15% difference in VH
values might indicate different propensity of capacitors to cracking. The purpose of this part of
the report was getting hardness values for variety of different types of capacitors to assess possible
variations of VH and compare hardness of materials used for PME and BME X7R capacitors.
Technique Test method used in this study was similar to the one described in [28]. Vickers indenter was fixed
in a Chatillon TSD225 digital force tester with a 100 N gage. The tester was programmed to apply

33
forces of 1, 2, and 3N in a 5 sec intervals that were sufficient to shift a sample in a new position
for indentation.
Measurements were carried out using more than 30 lots of different types of PME and 8 lots of
BME X7R ceramic capacitors with a relatively large thickness of cover plates (see Fig.II-1). Most
parts had cover plate thicknesses of more than 100 um.
From 3 to 5 samples with polished surfaces were used for each test. Average size of each imprint
was determined using SEM images. Typically, at a load of 3 N, the value of D did not exceed 30
um. An example of distributions of imprint sizes at different loads is shown in Fig. II-2.
Figure II-1. Distributions of cover plate
thicknesses for capacitors used in this study.
Figure II-2. Distributions of the imprint
diagonal length at different loads for
M123A13BX474BKS capacitors.
The square value of the imprint size was plotted against the load for each sample, and the value of
VH was calculated using slopes of D2 vs P approximation lines. An example of the D2 – P
characteristics for five samples of one of lots of X7R capacitors is shown in Fig. II-3. The average
value of VH for this lot was 9.7 GPa at a standard deviation of 0.18. Linearity of the data in the
range of loads from 1 N to 3 N indicates that the size effect does not play a significant role for
these measurements. However, most samples had cracks at loads more than 1 N.
Figure II-3. Variations of the surface area of imprints with the load for 5 samples of LT
capacitors.
C ov er plate thickness
thickness, um
cu
mu
lati
ve
pro
ba
bil
ity
, %
0 30060 120 180 2401
5
10
50
99
M123A 13BX474BKS capacitors
D, um
cu
mu
lati
ve
pro
ba
bil
ity
, %
0 306 12 18 241
5
10
50
99
1 N
2 N
3 N
y = 191.65x
0
100
200
300
400
500
600
700
0 1 2 3 4
D^2
, u
m^2
load, N
Vickers test, LT capacitors
SN1
SN2
SN3
SN4
SN5

34
Test results Results of testing of three lots of CDR35 0.33 F and two lots of CDR04 0.47 F capacitors are
shown in Fig. II-4. Statistical analysis showed no significant difference between the same part
type lots at 90% confidence level. An average value of VH for all 0.33 F capacitors was 8.95
GPa at standard deviation of 0.6 and for 0.47 F capacitors these values were 9.46 GPa 0.62.
Results show no substantial difference in Vickers hardness between 0.33uF and 0.47 F capacitors.
Figure II-4. Average values of Vickers hardness for 3 lots of CDR35 0.33uF and two lots of
CDR04 0.47uF capacitors. Error marks correspond to standard deviations for each group.
Four types of PME_V capacitors that were manufactured using the same ceramic materials, but
vary by size and nominal, were tested with and without terminations. Five samples were tested
from each group. Capacitors without terminations did not go through silver glass frit application
and high-temperature sintering and nickel and solder electroplating processes that requires
immersion of capacitors in the relevant electrolytes. Also, electroplating process goes along with
hydrogen generation that can affect cracks formation and growth in ceramics [29]. All these
processes might potentially change mechanical characteristics of the surface layers of capacitors
and their hardness. Results of measurements are shown in Fig. II-5 and indicate no substantial
difference between parts with and without terminations. Average VH values varied from 9.1 to
9.9 GPa and coefficients of variations from 0.8% to 6.2%. The average coefficient of variation
that indicated the accuracy of measurements was 4.2%.
Distributions of VH for the four types of ceramic capacitors are shown in Fig. II-6. Considering
that the presence of terminations does not affect VH, results for both, terminated and un-terminated
samples were used for these distributions. Analysis shows that at 90% confidence VH values for
33 nF capacitors are lower than for 22 nF and 100 nF parts. This indicates that different lots of
similar types of capacitors might have different hardness due to some process variations. A larger
sample size and better accuracy of measurements are necessary to improve resolution of this
technique.
0
2
4
6
8
10
12
lot 1 lot 2 lot 3
VH
, M
pa
Different lots of CDR capacitors
CDR35, 0.33uF CDR04, 0.47uF

35
Figure II-5. Average VH values for size
1825 33 nF, size 1812 100 nF, and size
2225 15 nF and 22 nF capacitors with and
without terminations.
Figure II-6. Distributions of VH values for
different lots of PME_V capacitors
manufactured using the same ceramic material
and same processes.
Hardness measurements on a similar value 0.47 F 50 V and 0.33 F 50 V BME and PME
capacitors (see Fig. II-7) did not reveal any substantial difference between different part types.
Average VH values for BME capacitors, from 8.5 GPa to 9.7 GPa appear somewhat greater than
for PME capacitors, from 8.5 GPa to 9.1 GPa. However, comparison of distributions of average
VH values for 8 lots of BME and 30 lots of PME capacitors (see Fig. II-8) showed that this
difference is not significant. On average, all PME capacitors had VH = 9.4 GPa at STD = 0.52
and all BME capacitors had VH = 9.1 GPa at STD = 0.55.
Figure II-6. Average Vickers hardness
values for 0.47 F 50V and 0.33 F 50 V
PME and BME capacitors.
Figure II-7. Distributions of average VH values
for BME (circles) and PME (inverted triangles)
capacitors. Dashed and dotted lines correspond
to 90% confidence bounds.
0
2
4
6
8
10
12
33 nF 100 nF 15 nF 22 nF
VH
, G
Pa
PME_V capacitors
with terminations without terminations
PME_V capacitors
VH, GPa
cu
mu
lati
ve
pro
ba
bil
ity
, %
7 128 9 10 111
5
10
50
99
15 nF 2225
33 nF 1825
100 nF 1812
22 nF 2225
0
2
4
6
8
10
12
0.47uF 50V 0.33uF 50V
VH
, G
pa
BME_C BME_A PME_V PME_C
V ickers Hardness Test for PME and BME C apacitors
VH, GPa
cu
mu
lati
ve
pro
ba
bil
ity
, %
7 128 9 10 111
5
10
50
99

36
Conclusion In-situ measurements of Vickers hardness is possible using capacitors with relatively thick cover
plates. The value of load should be low enough so the depth of the indentation is more than ~2
times less that the thickness of the cover plate.
The presence of terminations does not affect VH measurements. However, different lots of
capacitors might have different hardness values.
Vickers hardness testing of 30 lots of PME and 8 lots BME X7R capacitors failed to reveal any
substantial difference between PME and BME capacitors. The observed average VH values varied
from 8.5 GPa to 10.2 GPa. A typical standard deviations were 0.5 to 0.6 GPa.
It is possible, that improvements in the technique, in particular, better polishing, larger sample
size, and use of specialized Micro Vickers Hardness testers, would reduce measurements’ errors
to below 3%, and allow for revealing differences in lots of ceramic capacitors.
References [1] F. I. Baraita, W. T. Mathews, and G. D. Quinn, "Errors associated with flexture tewsting of brittle materials,"
U.S. Army materials technology laboratory MTL TR 87-35, MTL TR 87-35, 1987
[2] Standard Test Method for Flexural Strength of Advanced Ceramics at Ambient Temperature, C1161 − 13,
ASTM, 2013
[3] M P Metcalfe, N. Tzelepi, and D. Wilde, "The Effect of Test Specimen Size on Graphite Strength Size on
Graphite Strength," ASTM Symposium on Graphite Testing for Nuclear Applications, Seattle, WA, 19-20
September, 2013, http://web.ornl.gov/sci/physical_sciences_directorate/mst/INGSM14/ASTM_program.shtml.
[4] G. D. Quinn, B. T. Sparenberg, P. Koshy, L. K. Ives, S. Jahanmir, and D. D. Arola, "Flexural Strength of
Ceramic and Glass Rods," Journal of Testing and Evaluation, vol. 37, pp. 222-244, May 2009.
[5] P. Zhang, S. X. Li, and Z. F. Zhang, "General relationship between strength and hardness," Materials Science
and Engineering: A, vol. 529, pp. 62-73, 11/25/ 2011.
[6] G. De With, "Structural integrity of ceramic multilayer capacitor materials and ceramic multilayer capacitors,"
Journal of the European Ceramic Society, vol. 12, pp. 323-336, 1993.
[7] W. H. Tuan and S. K. Lin, "The microstructure-mechanical properties relationships of BaTiO3," Ceramics
International, vol. 25, pp. 35-40, 1999.
[8] J. Bergenthal, "Mechanical strength properties of multilayer ceramic capacitors," in Capacitor and Resistor
Technology Symposium, CARTS'91, 1991.
[9] S. Freiman and R. Pohanka, "Review of mechanically related failures of ceramic capacitors and capacitor
materials," Journal of the american ceramic society, vol. 72, pp. 2258-2263, 1989.
[10] J. M. Blamey and T. V. Parry, "THE EFFECT OF PROCESSING VARIABLES ON THE MECHANICAL
AND ELECTRICAL-PROPERTIES OF BARIUM-TITANATE POSITIVE-TEMPERATURE-
COEFFICIENT-OF-RESISTANCE CERAMICS .1. ADDITIVES AND PROCESSING PRIOR TO
SINTERING," Journal of Materials Science, vol. 28, pp. 4311-4316, Aug 1993.
[11] J. M. Blamey and T. V. Parry, "THE EFFECT OF PROCESSING VARIABLES ON THE MECHANICAL
AND ELECTRICAL-PROPERTIES OF BARIUM-TITANATE POSITIVE-TEMPERATURE-
COEFFICIENT-OF-RESISTANCE CERAMICS .2. SINTERING ATMOSPHERES," Journal of Materials
Science, vol. 28, pp. 4317-4324, Aug 1993.
[12] M. Cozzolino and G. Ewell, "A Fracture Mechanics Approach to Structural Reliability of Ceramic
Capacitors," IEEE Transactions on Components, Hybrids, and Manufacturing Technology, vol. 3, pp. 250 -
257, 1980.
[13] K. Franken, H. R. Maier, K. Prume, and R. Waser, "Finite-element analysis of ceramic multilayer capacitors:
Failure probability caused by wave soldering and bending loads," Journal of the American Ceramic Society,
vol. 83, pp. 1433-1440, Jun 2000.

37
[14] S. K. Dash, P. Kumar, M. P. James, S. Kamat, K.Venkatesh, V.Venkatesh, et al., "Study of Cracks in Ceramic
Chip Capacitors (CDR-05) of Two Different Makes," International Journal of Emerging Technology and
Advanced Engineering, vol. 3, pp. 85-90, 2013.
[15] C. Koripella, "Mechanical behavior of ceramic capacitors," IEEE Transactions on Components, Hybrids, and
Manufacturing Technology, vol. 14, pp. 718 - 724, 1991.
[16] W. R. Lanning and C. L. Muhlstein, "Strengthening Mechanisms in MLCCs: Residual Stress Versus Crack Tip
Shielding," Journal of the American Ceramic Society, vol. 97, pp. 283-289, 2014.
[17] R. Al-Saffar and R. Freer, "The effect of multicomponent stress on the mechanical properties of multilayer
ceramic capacitors," in Electronic Ceramic Materials and Devices, 2000, pp. 451-462, <Go to
ISI>://WOS:000183415600043.
[18] R. Al-Saffar, R. Freer, I. Tribick, and P. Ward, "Flexure strength of multilayer ceramic capacitors," British
Ceramic Transactions, vol. 98, pp. 241-245, 1999.
[19] S. Seo and A. Kishimoto, "Effect of polarization treatment on bending strength of barium titanate/zirconia
composite," Journal of the European Ceramic Society, vol. 20, pp. 2427-2431, 12// 2000.
[20] A. Kishimoto, "The control of mechanical strength by an electric field in ceramic composites dispersed with
piezoelectric particles," Journal of Electroceramics, vol. 24, pp. 115-121, 2010.
[21] L. Dillinger, "Hardness testing. Ideas for metallographic procedures," Leco Met Tips, vol. 9, pp. 1-8, 2006.
[22] Standard Test Method for Vickers Indentation Hardness of Advanced Ceramics, C1327 − 15, ASTM, 2015
[23] J. Gong, J. Wu, and Z. Guan, "Examination of the indentation size effect in low-load vickers hardness testing
of ceramics," Journal of the European Ceramic Society, vol. 19, pp. 2625-2631, 11// 1999.
[24] J. H. Gong, "Comment on "Measurement of hardness on traditional ceramics", H. Kim and T. Kim, J. Eur.
Ceram. Soc., 22, 1437-1445 (2002)," Journal of the European Ceramic Society, vol. 23, pp. 1769-1772, Sep
2003.
[25] G. D. Quinn, P. J. Patel, and I. Lloyd, "Effect of Loading Rate Upon Conventional Ceramic Microindentation
Hardness," Journal of Research of the National Institute of Standards and Technology, vol. 107, pp. 299-306,
2002.
[26] A. Wereszczak, L. Riester, and K. Brederl. (1998). In-situ mechanical property evaluation of dielectric
ceramics in multilayer capacitors. Available: www.osti.gov/bridge/servlets/purl/755654-
4MKsH7/native/755654.pdf
[27] A. A. Wereszczak, L. Riester, and K. Breder, In-Situ Mechanical Property Evaluation of Dielectric Ceramics
in Multilayer Capacitors, 2000.
[28] A. Teverovsky, "Effect of Manual-Soldering-Induced Stresses on Ceramic Capacitors," NASA Electronic
Parts and Packaging (NEPP) Program, Part I NEPP Report, 2008
[29] H. Zhang, J. X. Li, W. Y. Chu, Y. J. Su, and L. J. Qiao, "Effect of humidity and hydrogen on the promotion of
indentation crack growth in lead-free ferroelectric ceramics," Materials Science and Engineering B-Advanced
Functional Solid-State Materials, vol. 167, pp. 147-152, Mar 2010.

38
Part III. Indentation Fracture Test (IFT)
Introduction
Microcracks existing at the surface of a capacitor might not affect its performance if they do not
cross opposite electrodes. However, stresses created during or after soldering might cause crack
extension resulting in electrical failures with time of operation. Obviously, capacitors using
tougher materials that can resist crack extension would be more reliable. The ability of a material
to withstand stresses in the presence of cracks is determined by its fracture toughness, Kc. This
characteristic as well as the strength are considered the most important mechanical parameters that
determine robustness of ceramics capacitors [1].
Fracture toughness
Crack extension occurs when the applied stress exceeds a certain critical level, c. The magnitude
of the stress that is applied to a sample is increased at the crack tip, and is controlled by the stress
intensity factor. Analysis shows that for homogenous and linear elastic materials with a crack of
size a located at the surface of a sample perpendicular to the applied stress (see Fig.III-1a), the
critical stress is:
aY
Kcc
, (III-1a)
where Y is a geometry factor that depends on loading method and the shape and size of the sample
and crack.
Values of KIc (number I corresponds to the mode I of crack loading) for brittle materials vary from
~0.5 MPa×m0.5 for glasses to ~5 MPa×m0.5 for Si3N4. For metals, fracture toughness is in the
range from ~5 to 200 MPa×m0.5 and for Alumina ceramic 3 to 4 MPa×m0.5. Typically, Kc increases
with temperature (materials became more ductile) and decreases with a loading rate.
When a stress is applied to a sample having a crack, the fracture occurs if the crack is large
enough. The critical size of the crack, ac depends on the fracture toughness:
21
Y
Ka c
c , (III-1b)
The finite element modeling of stresses in 1206 X7R capacitors after soldering onto a board and
bending showed that the critical size of the crack at the termination is 18 m [2]. This is more
than an order of magnitude smaller than the critical crack length for capacitors soldered onto a
board determined by Cozzolino and Ewell [3].
For ideally brittle materials, the fracture toughness is independent of the crack extension and a flat
crack resistance curve (R-curve) is obtained. However, many ceramics have a diverse behavior
and the crack growth resistance increases with the extension of cracks [4].
Fracture toughness for ceramics is one of the most controversial issues in materials testing, with
more than 30 different tests and many variations for each test [4]. All methods can be divided into
two groups: Flexure Test and Indentation Fracture Test (IFT) [5]. The first one is similar to that

39
which is used for measuring the Flexural Strength, however specimens with cracks or notches are
used. The second one employs Vickers hardness method. According to the IFT technique, Kc is
determined based on measurements of the length of cracks emanating from the indent corners (see
Fig. III-1b).
a) b)
Figure III-1. A schematic of fracture toughness measurement using mode I of crack loading (a)
and Vickers indenter (b).
Flexure Test technique
Standard ASTM C-1421 [6] covers three types of the fracture toughness methods for advanced
ceramics at ambient temperature. Values of the fracture toughness depend on the method used.
The precracked beam test specimen test determines KIpb, the surface crack in flexure determines
KIsc, and the chevron-notched beam test specimen determines KIvb. The values of fracture
toughness depend on the crack formation in the sample. The crack can be formed either as a
straight-through crack via bridge flexure (pb), or as a semi-elliptical surface crack formed via
Knoop indentation (sc), or it can be formed and propagated in a chevron notch (vb). All methods
involve application of force to a beam test specimen in three- or four-point flexure. The test
specimen either contains a sharp crack initially (pb, sc) or develops one during loading (vb). The
standard size of the test specimen is 3 by 4 mm in cross section and from 20 to 50 mm of the
length.
If a significant R-curve behavior is suspected, then the sc method should be used for estimates of
small-crack fracture toughness, whereas the vb test may be used for estimates of longer-crack
fracture toughness.
The procedure for precracked beam method includes:
Preparation of Crack Starter: either by the machined notch, or one or more Vickers or Knoop
indentations.
Formation of Precrack by compressing the specimen in a fixture until a distinct pop-in sound is
heard and/or a pop-in precrack is seen. The precrack length should be between 0.35 and 0.60 of
the sample width.
Fracture Test by inserting the test specimen into the flexure fixture and recording applied force
versus displacement.

40
Post Test Measurements by measuring the crack length at three positions and calculating KIpb. It
is expected that the maximum possible error for this test is 3 %.
The procedure for the surface-crack in fixture method is more complex and includes:
Precracking by using a Knoop indenter with a force that is sufficient to create a crack that is greater
than the naturally-occurring flaws in the material, but less than the specimen size. Removal of
Indented Zone by calculating the depth of the Knoop impression (d/30) and removing the residual
stress damage zone by mild grinding, hand grinding, or hand polishing with abrasive papers.
Fracture Test: bend beam testing with the load recording.
Post Test Measurements by examining the fracture surfaces of the test specimen and measuring
the initial precrack dimensions. It is noted that fractographic techniques and fractographic skills
are needed for this step.
This test is expected to have an overall precision of approximately 6 5 %.
The values of fracture toughness, determined by these techniques can be functions of test rate
because of the effects of environments. This time-dependent phenomenon is known as slow crack
growth (SCG).
Difficulties in sample preparation and implementation of the standardized methods to measure Kc
resulted in very limited experimental data for barium titanate ceramics used for capacitors
manufacturing. Another factor limiting the significance of Kc measurements for prediction of
mechanical behavior of capacitors is the presence of metal electrodes and built-in stresses that
make test results on bulk materials different compared to capacitors and thus not directly
transferable to the components [1].
Indentation Fracture Test
A relatively simple IFT method that allows in-situ evaluation of Kc values for ceramic capacitors
had been used by several authors. This method consists of using a Vickers indenter in order to
generate cracks at the corners of the indent and calculating Kc based on the length of cracks.
Analysis of the fracture process and experimental data showed that the relation between fracture
toughness and ratio of crack-to-indent size has a universal behavior [4]. Multiple semi-empirical
equations (about 20) exist in literature for determining the indentation fracture toughness by IFT
[4, 7-9]. Parameters in these equations are selected to provide a good agreement with the fracture
toughness data received using conventional testing methods.
Two crack patterns, so-called half-penny, or radial, and Palmqvist are commonly occur during ITF
testing (see Fig. III-2). Both types of cracks emanated from the corner of the Vickers hardness
indentation are used to determine the indentation fracture toughness.
Figure III-2. Median, or half-penny (left) and lateral, or Palmkvist (right) cracks around Vickers
indentation [10].

41
Since IFT is not a standard test, the calculated value for the toughness is suggested to be called Kc
instead of KIc [9]. In a recent analysis, Chicot et al. [9] have compared different equations and
suggested the most adequate average relations depending on the cracking mode as follows:
5.1
5.0
_)_(c
P
H
EK MRMRc
, for radial-median crack, and (III-2)
5.0
4.0
)(la
P
H
EK
d
PPc
, for Palmqvist cracks (III-3)
where E is the Young’s modulus, H is the Vickers hardness, P is the load, c is the length of the
crack from the center, ad is the size of impression, R_M = 0.015 and P = 0.0059 are constants.
Analysis of various brittle materials showed that the equation for the median cracks provides best
fit for relatively large cracks, c/a >~2.5, whereas the equation for the Palmqvist cracks gives better
results at 0.25 ~< l/a <~ 2.5 [10].
The c/a ratio is presumed to be indicative of the type of crack system [8]. As a general rule, it is
assumed that if c/a > 2, the crack model is considered as half-penny type, and at c/a < 2, the
Palmqvist model can be used. The common assumption that normally governs this classification
is that cracks in brittle materials with relatively low toughness are considered to follow half-penny
model, and cracks with relatively high toughness can be considered to match Palmqvist model.
Details of IFT application and factors affecting results of measurements are described in [11]. It
has been shown that Eq.(III-2) allows for a good correlation between the conventional Kc and IFT
measurements. Analysis showed that an accuracy of better than 30 to 40% is attainable.
Precautions must be taken in selecting a working range of indentation loads which satisfies the
requirement that the pattern is well developed and yet that no chipping occurs. Also, the lateral
cracks spread outward from the deformation zone, beneath the indentation surface, may interact
with the radial system and change results of measurements.
Although IFT method has attracted a lot of attention because of its simplicity and the capability of
using small size samples, it is hindered with considerable errors compared to the standard fracture
toughness test methods [8]. One of the most important factors that lead to computational errors
when using the indentation test is the disregard of secondary cracks that might have formed in the
specimen around the indented zone. Another cause of error is related to cracks propagating along
the depth of the sample.
The IFT technique is the most controversial, has not been standardized so far, and has been
criticized by several authors, in particular, by Quinn and Bradt from NIST [12]. They concluded
that this technique is not reliable as a fracture toughness test for ceramics or for other brittle
materials and what the IFT actually measures in terms of fracture resistance cannot be readily
defined. It was recommended that this technique no longer be used for the fracture toughness
testing of ceramic materials.
However, a reasonable correlation between IFT and standard testing have been shown in several
studies. Analysis of the effectiveness and applicability of IFT for Kc measurements has been
carried out recently by Marshall and co-workers [13]. The authors argue that the technique remains

42
an unrivalled quick, convenient and economical means for comparative, site-specific toughness
evaluation. It is often the only way to probe small scale specimens and components, for example,
modern microelectronic and micromechanical systems, where “bulk” properties may no longer
apply. It is advocated as an exploratory test—an incomparably quick, convenient and versatile
method for probing fracture susceptibility. The overall result of analysis is that any perceived
limitations of the indentation technique are greatly outweighed by an overwhelming abundance of
advantages.
Factors affecting IFT
Fracture toughness of barium titanate depends on variety of internal and external factors and
residual mechanical stresses in the sample [1]. Internal factors include microstructure of the
material, its chemical composition, and the composition and phase content of the grain boundaries
[14]. The most important external environmental factor is relative humidity because barium
titanate, like almost all ceramics, is sensitive to moisture-enhanced crack growth.
The toughness of ceramics in the ferroelectric state (at room temperature) is greater than for the
paraelectric state (above the Curie temperature) [1]. However, the strength shows the opposite
trend, which is attributed to the relief of internal residual stresses.
The effect of compositions and sintering atmospheres on the mechanical and electrical properties
of four formulations of n-doped barium titanate PTCR ceramics has been investigated by Blamy
and Parry [15, 16]. Fracture toughness was evaluated using miniature single-edge notched (SEN)
beam and indentation test. Kc values measured by ITF (up to 2.1 MPa×m0.5) were almost two
times greater than those measured by the SEN testing. Different compositions had ~ 40%
variations in fracture toughness. The sintering atmosphere was changed from 100% nitrogen to
100% oxygen. A composition with 99% BaTiO3 slightly increased Kc, from 0.6 to 0.7 MPa×m0.5;
however, a more substantial variation occurred with compositions having ~ 80% of BaTiO3, where
Kc increased from ~0.35 to ~ 1 MPa×m0.5 as concentration of oxygen increased to 20%. However,
capacitors with excessive oxygen in the composition of cover layers (40% compared to a more
robust part that had ~ 20% of oxygen) were found having greater propensity to cracking in [17].
This apparently contradicts the results obtained by Blamy and Parry, so it is not clear whether
variations in concentration of oxygen might be responsible for the changes in the propensity to
cracking in ceramic capacitors.
The presence of abnormal grains in barium titanate ceramics might lead to formation of
microcracks [18]. It is assumed that to some degree, microcracks can enhance the fracture
toughness. However, as the number of microcracks is high enough for microcracks to connect to
one another, the strength is reduced.
Poling of ferroelectric ceramics (cooling through Curie point under bias) affects fracture
toughness. Measurements of a doped lead zirconate titanate (PZT) ceramic in [19] showed that
Kc reached 1.51 ± 0.02 MPa×m0.5 in the direction parallel and reduced to 0.62 ± 0.01 MPa×m0.5
normal to the poling axis. For a non-poled (isotropic) specimen Kc was 1.09±0.02 MPa×m0.5.
Similar results were obtained by Zhang and co-authors [20, 21]: the fracture toughness parallel
and perpendicular to polarization direction of PZT samples was 1.43 ± 0.03 MPa×m0.5 and 2.05 ±
0.06 MPa×m0.5, respectively. Anisotropy of the fracture toughness was also observed in [22]:
cracks propagating parallel to the poling direction were considerably shorter than that

43
perpendicular to the poling direction. The effect has been explained by either domain switching
at the crack tip or residual stress introduced by poling. However, according to some authors [1]
poling has a negligible effect on fracture toughness and can be observed at high fields (> 10 kV/cm)
only. Wang and co-authors reported on the effect of applied electric field in lead zirconate titanate
(PZT) piezo stack actuators [23]. In the absence of electric field Kc was ~0.75 MPa×m0.5 and
changed ~ 30% at the field of 12 kV/cm.
A substantial variation in the toughness evaluation might be incurred if the cracks are not measured
immediately after indentation. Measurement on soda-lime glass in air [11] showed that the crack
size increased as a logarithm of time and increased from 175 um to 275 um as time after indention
increased from 1 sec to 1E6 sec. The effect is most apparent in the air, but even in oil, generally
regarded as a relatively inert test medium, the effect is significant.
Delayed cracking under operating electric fields is one of the major reliability issues for
ferroelectric devices [21]. Humid air-induced delayed cracking is due to water adsorption, which
decreases the surface energy of PZT ceramics. Results for potassium sodium niobate ferroelectric
ceramics show that crack growth occurs in humid air of 70 and 90% RH but was not observed at
RH ≤ 30%. It is assumed that the critical humidity for crack growth without an electric field is
~50% RH.
Studies have shown that Kc values might change not only due to the presence of moisture in air,
but also due to the presence of hydrogen that can penetrate into ceramics during forming gas
annealing or in electroplating processes and cause degradation of physical characteristics of
materials. Zhang and co-authors [20, 21] studied the effect of humidity and hydrogen on fracture
properties of ferroelectric ceramics. Hydrogen fissures initiate and grow along grain boundaries
in PZT ceramics during hydrogen charging once the hydrogen concentration in the sample exceeds
a critical value. Recombination of hydrogen atoms at the defects at the grain boundaries can
generate high-pressure to form hydrogen fissures. As a result, hydrogen decreases the fracture
toughness and induces delayed cracking of ferroelectric ceramics. The experimental results show
that the fracture toughness of indentation cracks decreases linearly with both hydrogen
concentration in the sample and the logarithm of the indenting dwell time. The results are
consistent with the assumption that hydrogen decreases the cohesive strength and the surface
energy of ceramics.
Fracture toughness of MLCCs
Cozzolino and Ewel measured fracture toughness on three NPO and three BX materials from three
manufacturers using the indentation technique [3]. Kc values did not change substantially varying
from 2.2 to 3.4 MPa×m0.5 for BX, and from 2.3 to 3.8 MPa×m0.5 for NPO ceramics.
Significantly lower values of fracture toughness were obtained by Rawal and co-authors from
AVX [24]. IFT measurements for 3 types of X7R, two types of NPO and one type of Z5U
capacitors showed Kc in the range from 1.4 to 1.5 MPa×m0.5 for NPO, 0.6 to 1.2 MPa×m0.5 for
X7R, and 0.85 MPa×m0.5 for Z5U capacitors. A close value of fracture toughness (0.91 MPa×m0.5)
for Y5V, 22uF, size1206 capacitors taken out of the production process after the sintering was
measured in [25].
Freiman and Pohanka [14] reviewed mechanical characteristics of different ceramic capacitors
published by 1989. Values of fracture toughness for 17 different types of capacitors obtained by

44
the indentation fracture technique varied about a factor of 2, from 0.7 to 1.4 MPa×m0.5. Kc for
X7R varied from 0.7 to 1.2 MPa×m0.5 and for NPO it was ~1.4 MPa×m0.5. Analysis of data
published by 1993 that was carried out by De With [1], showed that Kc values for different types
of BaTiO3 ceramics in ferroelectric state vary from 0.8 to 1.5 MPa×m0.5.
The effect of metal electrodes on fracture toughness on three types of commercial ceramic
capacitors has been studied by Koripella [26]. Fracture toughness was measured by precracking
the samples with and without electrodes followed by four point bend testing. Results show that
different types of dielectrics have similar values of the fracture toughness, close to 1 MPa×m0.5.
However, COG dielectrics have somewhat higher values of Kc. Fracture toughness values for
X7R and Z5U dielectrics are about same; 0.8 MPa×m0.5 for samples with no electrodes and 1
MPa×m0.5 for samples with electrodes. Slightly higher values are measured on COG dielectrics:
1 MPa×m0.5 for samples with no electrodes and 1.5 MPa×m0.5 for samples with electrodes.
Increased fracture toughness in samples with electrodes was assumed to be due to electrodes acting
to deflect the crack path. According to De-With [1], cracks are retarded because of compressive
stresses that are present in ceramic layers between electrodes due to the difference in CTE for
metal electrodes and ceramic. The ductility of metals that increase dissipation of energy when a
crack crossing electrodes is also a factor. Electrodes cause anisotropy in fracture toughness: the
fracture resistance for a fracture plane perpendicular to electrodes is typically 30% higher than for
a plane parallel to the electrodes.
Mechanical characteristics of barium titanate dielectric ceramics in three commercially available
X7R, 0.1 uF, size 0805 multilayer capacitors (MLCCs) were measured by Wereszczak and co-
authors [27, 28]. The Young's modulus and hardness of the dielectric ceramics in these three types
of capacitors were similar, while there were statistically significant differences in their fracture
toughness that was measured in-situ by the IFT method. Because crack growth during fracture
toughness testing can be affected by residual stresses, the cover layer region was chosen to be at a
location (i.e., as far away from the termination metal as allowed) where the effect of stresses is
minimal. Similar to other studies. The fracture toughness of capacitors was in the range from 1.1
to 1.5 MPa×m0.5.
Technique. In this study, fracture toughness was measured at loads of 1, 2, and 3 N using the same capacitors
and processes as described in Part II of this report for the Vickers hardness test. The crack size
was measured in the SEM, and Kc values were calculated using Eq.(III-2). Literature data for
Young’s modulus of barium titanate ceramics vary from ~60 GPa to ~200 GPa; however, for X7R
ceramic capacitors it appear to be close to ~ 100 GPa [26, 29]. For this reason, for Kc calculations
we assumed E = 100 GPa.
Examples of samples with median cracks are shown in Fig.III-3 a, b. However, this type of
cracking was observed relatively rarely, and more often cracking occurred along with spalling and
chip-outs as shown in Fig.II-3 c, d. In many cases spalling and chip-outs expose a porous structure
of ceramic materials.
Obviously, crack formation during IFT deviates substantially from the ideal, half-penny model.
Nevertheless, the length of cracks were measured in all cases in an attempt to reveal differences in
the crack propensity for different types of capacitors.

45
a) b)
c) d)
Figure III-3. Examples of cracking during Indentation Fracture Test.
Estimations of Kc have been made for cases when variations of the crack length with the load P
could be reasonably well approximated with a straight line in c1.5 vs. P coordinates as it is shown
in Fig. III-4. This chart displays variations of the crack length with the load for 4 samples of the
same type of PME_L capacitors. The average Kc value for these capacitors is 1.43 MPa×m0.5 at a
standard deviation of 0.22. The spread of data is relatively large and exceeds 25%.
Results of Kc measurements for two part types of PME_V capacitors made using the same
materials and processes are shown in Fig. III-5. The average value for the 5 samples of PN1 was
1.13 MPa×m0.5 at a standard deviation of 0.24. Another part type, PN2, had similar average values
and standard deviations, 1.06 MPa×m0.5 and 0.15. However, the spread of the data was also large
and exceeded ±20%.

46
Figure III-4. Variations of the crack length in
power 3/2 vs. load for four types of PME_L
capacitors. Here and below, numbers in the
legend indicate Kc values in MPa×m0.5.
Figure III-5. Fracture toughness for 5 samples
of PN1 and four samples of PN2
manufactured from the same materials.
Test results Fracture toughness measurements for 10 types of BX PME capacitors from Mfr.C were in the
range from 0.9 to 1.4 MPa×m0.5 (see Fig. III-6 and Table III-1). These data are close to what has
been reported in literature and considering the accuracy of measurements, Kc values for Gr.3 (0.89
MPa×m0.5 ) are lower than for Gr.4, Gr.9, Gr.13 and Gr.15 that have Kc exceeding 1.3 MPa×m0.5.
This indicates that IFT measurements can indicate parts that have low Kc values and might be
more susceptible to cracking.
Table III-1. Results of Kc measurements for
10 types of PME capacitors
PN Kc,
MPa_m0.5 Gr1 CDR35BX104AKUS 1.36
Gr3 M123A13BXB474KS 0.89
Gr4 CDR34BP222BKUS 1.33
Gr6 CDR35BX104BKUS 1.07
Gr8 CDR04BX473BKUS 1.00
Gr9 M123A12BXB104KS 1.38
Gr10 CDR34BX333BKUS 1.08
Gr13 CDR35BX334AKUS 1.35
Gr15 CDR35BX474AKUS 1.41
Gr17 CDR35BX683BKUS 1.04
Figure III-6. C1.5 vs. load variations for
different types of PME capacitors
Results of measurements on samples from different lots of the same part types of PME capacitors
are shown in Fig. III-7. No significant difference between lots with different date codes (parts
were manufactured between 2001 and 2003) was observed. However, it appears that fracture
toughness for M123BX474 capacitors is ~ 30% less than for CDR35BX334 capacitors.
0
20
40
60
80
100
120
140
160
180
0 1 2 3 4 5
c^1
.5,
(um
)^1
.5
load, N
PME_L capacitors
PME_L1, 1.7
PME-L2, 1.32
PME_L3, 1.49
PME_L4, 1.20
0.00
0.20
0.40
0.60
0.80
1.00
1.20
1.40
1.60
1.80
PN 1 PN 2
Kc,
Mpa
_m
^0.5
PME_V capacitors
SN1 SN2 SN3 SN4 SN5
0
20
40
60
80
100
120
140
160
180
200
0 1 2 3 4 5
c^1
.5,
(um
)^1.5
load, N
PME capacitors
Gr3, 0.89
Gr6, 1.07
Gr10, 1.08
Gr15, 1.41

47
Figure III-7. Fracture toughness for different lots (L1, l2, and L3) for three types of capacitors.
Results of measurements for four types of size 1825, 0.47 F 50 V capacitors from different
manufacturers are shown in Fig. III-8a. Two part types were BME and two were PME capacitors.
For BME capacitors, fracture toughness was 0.69 and 0.76 MPa×m0.5, which is somewhat lower
than for PME capacitors, 0.8 and 0.85 MPa×m0.5. However, a different type of BME capacitors
from the same manufacturers had greater Kc values in the range from 0.79 to 1.07 MPa×m0.5 (see
Fig III-8b).
a) b)
Figure III-8. Results for fracture toughness measurements for 0.47 F 50 V PME and BME
capacitors (a) and for different lots of 0.33uF 50V BME capacitors (b).
Comparison between fracture toughness for different types of PME BX, PME BP and BME X7R
capacitors is shown in Fig. III-9 and Table III-2. As expected, on average, BP capacitors have
higher Kc values, 1.46 MPa×m0.5, compared to BX capacitors. No statistically significant
difference was found between PME and BME capacitors.
Considering that the strength of BX and X7R ceramic materials is ~ 200 MPa and the fracture
toughness is ~ 1 MPa×m0.5, the critical crack size can be estimated using Eq.(III-1b). At Y 1
[30], ac 8 m. This value is consistent with literature data [2, 3] and our results from Part I of
this report. It has been shown that fine polishing which removed micrometer-size cracks did not
affect MOR, but introduction of cracks with size ~ 20 um reduced the strength of the samples
almost two times.
1.03 1.07
0.83
1.35
1.000.89
1.33
0.00
0.20
0.40
0.60
0.80
1.00
1.20
1.40
1.60
Kc,
Mpa
_m
^0.5
Different lots of capacitors
L1
L2
L3
0
50
100
150
200
250
300
0 1 2 3 4 5
c^1
.5,
um
^1.5
load, N
0.47uF 50V PME and BME capacitors
BME_C, 0.69
BME_A, 0.76
PME_V, 0.8
PME_C, 0.85
0
50
100
150
200
250
0 1 2 3 4 5
c^1
.5,
um
^1.5
load, N
0.33uF 50V BME capacitors
BME_A, 0.79
BME_C1, 1.03
BME_C2, 0.99
BME_C3, 1.07

48
PME BX
PME BP
BME X7R
average 1.08 1.46 0.95
STD 0.20 0.19 0.23
N 12 2 6
Figure III-9. Fracture toughness for different types of capacitors. Dashed lines indicate ± 20%
variation of Kc from the average value.
Table III-2. Kc values for different types of capacitors, MPa×m0.5.
PME BX PME BP BME X7R
M123_C 0.47uF 0.87 PME_BP_C 2.2nF 1.33 BME_A 0.33uF 0.79
M123_C 0.1uF 1.39 PME_BP_A 4.7nF 1.59 BME_A 0.47uF 0.76
CDR35_C 0.1uF 1.07 BME_A 0.01uF 1.28
CDR04_C 0.047uF 1.10 BME_C 0.33uF 1.03
CDR34_C 0.033uF 1.08 BME_C 0.47uF 0.69
CDR35_C 0.33uF 1.24 BME_C 1uF 1.14
CDR35_C 0.47uF 1.41
CDR36_C 0.068uF 1.04
PME_V 0.47uF 0.80
PME_V 0.01uF 1.04
PME_V 0.015uF 1.13
PME_C 0.47uF 0.85
Conclusion In spite of the controversy of the technique, in-situ measurements of fracture toughness on MLCCs
using IFT method can provide useful information regarding robustness of capacitors under
soldering conditions. This technique can be used for relatively large size capacitors having
thickness of the cover layers exceeding the size of the introduced cracks. However, an accuracy
of measurement better than ±20% is required. Improvements in the accuracy can be achieved by
better polishing, increasing the number of samples, and by using a specialized equipment for
Vickers testing (Micro Vickers Hardness tester).
Experiments show that Kc values are in the range from 0.8 to 1.4 MPa×m0.5 for PME BX, from
1.3 to 1.6 MPa×m0.5 for PME BP, and from 0.7 to 1.3 MPa×m0.5 for BME capacitors. Considering
the accuracy of measurements, there is no statistical difference between fracture toughness of PME
and BME capacitors.
0
0.2
0.4
0.6
0.8
1
1.2
1.4
1.6
1.8
PME BX PME BP BME
Kc,
Mp
a_
m^0
.5
Different types of capacitors
PN1 PN2 PN3 PN4 PN5 PN6
PN7 PN8 PN9 PN10 PN11 PN12

49
Estimations show that cracks with the size less than a few micrometers should not affect
measurements of the modulus of rupture, MOR.
References
[1] G. De With, "Structural integrity of ceramic multilayer capacitor materials and ceramic multilayer capacitors,"
Journal of the European Ceramic Society, vol. 12, pp. 323-336, 1993.
[2] J. A. Ahmar and S. Wiese, "A crack propagation analysis of multilayer ceramic capacitors," in 2015 European
Microelectronics Packaging Conference (EMPC), 2015, pp. 1-4.
[3] M. Cozzolino and G. Ewell, "A Fracture Mechanics Approach to Structural Reliability of Ceramic Capacitors,"
IEEE Transactions on Components, Hybrids, and Manufacturing Technology, vol. 3, pp. 250 - 257, 1980.
[4] M. Szutkowska, "Fracture toughness of advanced alumina ceramics and alumina matrix composites used for
cutting tool edges," Journal of Acheivements in Materials and Manufacturing Engineering, vol. 54, 2012.
[5] D. Kopeliovich. (2012). Flexural strength tests of ceramics. Available:
http://www.substech.com/dokuwiki/doku.php?id=flexural_strength_tests_of_ceramics
[6] Determination of Fracture Toughness of Advanced Ceramics at Ambient Temperature, C1421, ASTM, 2016
[7] F. Sergejev and M. Antonov, "Comparative study on indentation fracture toughness measurements of cemented
carbides," Proceedings of Estonian Academy of Science and Engineering, vol. 12, pp. 388–398, 2006.
[8] A. Moradkhani, H. Baharvandi, M. Tajdari, H. Latifi, and J. Martikainen, "Determination of fracture toughness
using the area of micro-crack tracks left in brittle materials by Vickers indentation test," Journal of Advanced
Ceramics, vol. 2, pp. 87-102, 2013.
[9] D. Chicot and A. Tricoteaux, "Mechanical Properties of Ceramic by Indentation: Principle and Applications,"
in Ceramic Materials, W. Wunderlich, Ed., 2010.
[10] K. Niihara, R. Morena, and D. P. H. Hasselman, "Evaluation of K1c of brittle solids by the indentation methode
with low crack-to-indent ratios," Journal of Materials Science Letters, vol. 1, pp. 13-16, 1982.
[11] G. R. Anstis, P. Chantikul, B. R. Lawn, and D. B. Marshall, "A critical evaluation of indentation techniques for
measuring fructure toughness. 1. Direct crack measurements," Journal of the American Ceramic Society, vol.
64, pp. 533-538, 1981.
[12] G. D. Quinn and R. C. Bradt, "On the Vickers Indentation Fracture Toughness Test," Journal of the American
Ceramic Society, vol. 80, pp. 673-680, 2007.
[13] D. B. Marshall, R. F. Cook, N. P. Padture, M. L. Oyen, A. Pajares, J. E. Bradby, et al., "The Compelling Case
for Indentation as a Functional Exploratory and Characterization Tool," Journal of the American Ceramic
Society, vol. 98, pp. 2671-2680, Sep 2015.
[14] S. Freiman and R. Pohanka, "Review of mechanically related failures of ceramic capacitors and capacitor
materials," Journal of the american ceramic society, vol. 72, pp. 2258-2263, 1989.
[15] J. M. Blamey and T. V. Parry, "The effect of processing variables on the mechanical and electrical properties
of barium titanate positive temperature coefficient of resistance ceramics. 2. Sintering atmospheres.," Journal
of Materials Science, vol. 28, pp. 4317-4324, Aug 1993.
[16] J. M. Blamey and T. V. Parry, "Strength and toughness of barium titanate ceramics," Journal of Materials
Science, vol. 28, pp. 4988-4993, 1993.
[17] S. K. Dash, P. Kumar, M. P. James, S. Kamat, K.Venkatesh, V.Venkatesh, et al., "Study of Cracks in Ceramic
Chip Capacitors (CDR-05) of Two Different Makes," International Journal of Emerging Technology and
Advanced Engineering, vol. 3, pp. 85-90, 2013.
[18] W. H. Tuan and S. K. Lin, "The microstructure-mechanical properties relationships of BaTiO3," Ceramics
International, vol. 25, pp. 35-40, 1999.
[19] R. Bermejo, H. Grünbichler, J. Kreith, and C. Auer, "Fracture resistance of a doped PZT ceramic for multilayer
piezoelectric actuators: Effect of mechanical load and temperature," Journal of the European Ceramic Society,
vol. 30, pp. 705-712, 2// 2010.
[20] H. Zhang, Y. J. Su, L. J. Qiao, W. Y. Chu, D. Wang, and Y. X. Li, "The effect of hydrogen on the fracture
properties of 0.8(Na1/2Bi1/2)TiO3-0.2(K1/2Bi1/2)TiO3 ferroelectric ceramics," Journal of Electronic
Materials, vol. 37, pp. 368-372, Mar 2008.
[21] H. Zhang, J. X. Li, W. Y. Chu, Y. J. Su, and L. J. Qiao, "Effect of humidity and hydrogen on the promotion of
indentation crack growth in lead-free ferroelectric ceramics," Materials Science and Engineering B-Advanced
Functional Solid-State Materials, vol. 167, pp. 147-152, Mar 2010.

50
[22] R. M. Wang, X. W. Zhao, W. Y. Chu, Y. J. Su, and L. J. Qiao, "Etching-enhanced growth of indentation crack
in barium titanate single crystal," Materials Letters, vol. 61, pp. 1162-1165, 2// 2007.
[23] H. Wang and A. A. Wereszczak, "Effects of Electric Field and Biaxial Flexure on the Failure of Poled Lead
Zirconate Titanate," Ieee Transactions on Ultrasonics Ferroelectrics and Frequency Control, vol. 55, pp. 2559-
2570, Dec 2008.
[24] B. S. Rawal, R. Ladew, and R. Garcia, "Factors responsible for thermal shock behavior of chip capacitors,"
AVX technical information, 1987.
[25] J. d. Toonder, C. Rademaker, and C. Hu, "Residual stresses in multilayer ceramic capacitors: measurement and
computation," Journal of Electronic Packaging, vol. 125, pp. 506-511, 2003.
[26] C. Koripella, "Mechanical behavior of ceramic capacitors," IEEE Transactions on Components, Hybrids, and
Manufacturing Technology, vol. 14, pp. 718 - 724, 1991.
[27] A. Wereszczak, L. Riester, and K. Brederl. (1998). In-situ mechanical property evaluation of dielectric
ceramics in multilayer capacitors. Available: www.osti.gov/bridge/servlets/purl/755654-
4MKsH7/native/755654.pdf
[28] A. A. Wereszczak, L. Riester, and K. Breder, In-Situ Mechanical Property Evaluation of Dielectric Ceramics
in Multilayer Capacitors, 2000.
[29] G.S.White, C.Nguyen, and B.Rawal, "Young's modulus and thermal diffusivity measurements of barium
titanate based dielectric ceramics," AVX technical information.
[30] Wikipedia. (2016). Fracture mechanics. Available: https://en.wikipedia.org/wiki/Fracture_mechanics