Embed Size (px)
Citation preview

Mechanical stochastic tug-of-war models cannotexplain bidirectional lipid-droplet transportAmbarish Kunwara,1, Suvranta K. Tripathyb,1, Jing Xub,c, Michelle K. Mattsonb, Preetha Anandb, Roby Siguab,Michael Vershinind, Richard J. McKenneye, Clare C. Yuf, Alexander Mogilnera,2,3, and Steven P. Grossb,2,3
aDepartment of Neurobiology, Physiology and Behavior, University of California, Davis, CA 95616; bDepartment of Developmental and Cell Biology,University of California, Irvine, CA 92697; fDepartment of Physics and Astronomy, University of California, Irvine, CA 92697; dDepartment of Physics andAstronomy, University of Utah, Salt Lake City, UT 84112; and eDepartment of Pathology and Cell Biology, Columbia University, New York,NY 10032 cSchool of Natural Sciences, University of California, Merced, CA 95343
Edited by Charles S. Peskin, New York University, New York, NY, and approved September 15, 2011 (received for review May 18, 2011)
Intracellular transport via the microtubule motors kinesin anddynein plays an important role in maintaining cell structure andfunction. Often, multiple kinesin or dynein motors move the samecargo. Their collective function depends critically on the singlemotors’ detachment kinetics under load, which we experimentallymeasure here. This experimental constraint—combined with otherexperimentally determined parameters—is then incorporated intotheoretical stochastic and mean-field models. Comparison of mod-eling results and in vitro data shows good agreement for thestochastic, but not mean-field, model. Many cargos in vivo movebidirectionally, frequently reversing course. Because both kinesinand dynein are present on the cargos, one popular hypothesis ex-plaining the frequent reversals is that the opposite-polarity motorsengage in unregulated stochastic tugs-of-war. Then, the cargos’motion can be explained entirely by the outcome of these oppo-site-motor competitions. Here, we use fully calibrated stochasticand mean-field models to test the tug-of-war hypothesis. Neithermodel agrees well with our in vivo data, suggesting that, in addi-tion to inevitable tugs-of-war between opposite motors, there isan additional level of regulation not included in the models.
Bidirectional motion of subcellular cargos such as mRNA par-ticles, virus particles, endosomes, and lipid droplets is quite
common (1), driven by plus-end kinesin and minus-end dynein.Bidirectional motion emerges when frequent switches occur be-tween travel directions, and travel direction reflects which motor(s) dominates. Cells can regulate the switching frequency to con-trol “net” transport, but the physical mechanism(s) underlyingthis control remains open. Two mechanisms have been proposed.The first suggests that plus-end and minus-end motors alwaysengage in stochastic unregulated tugs-of-war, and overall cargomotion is explained by the outcomes of these mechanical tugs-of-war. This model was proposed theoretically to explain lipid-droplet motion (2) but has been adopted to explain endosomemotion (3, 4). An alternative model suggests that in addition tocompetition between opposite-polarity motors, there is a “switch”mechanism or mechanisms that achieve further coordinationbetween the motors. Such regulation may be dynamic (5), static(6), or a combination of the two. The crucial question is this: Cantug-of-war models, which exclusively consider cargos with fixeddistributions of motors moving along microtubules unaffectedby regulatory pathways, explain the characteristics of motilityin vivo? Alternatively, are there significant motility characteristicsnot captured by tug-of-war models, pointing to a richer transportsubsystem with important regulatory contributions?
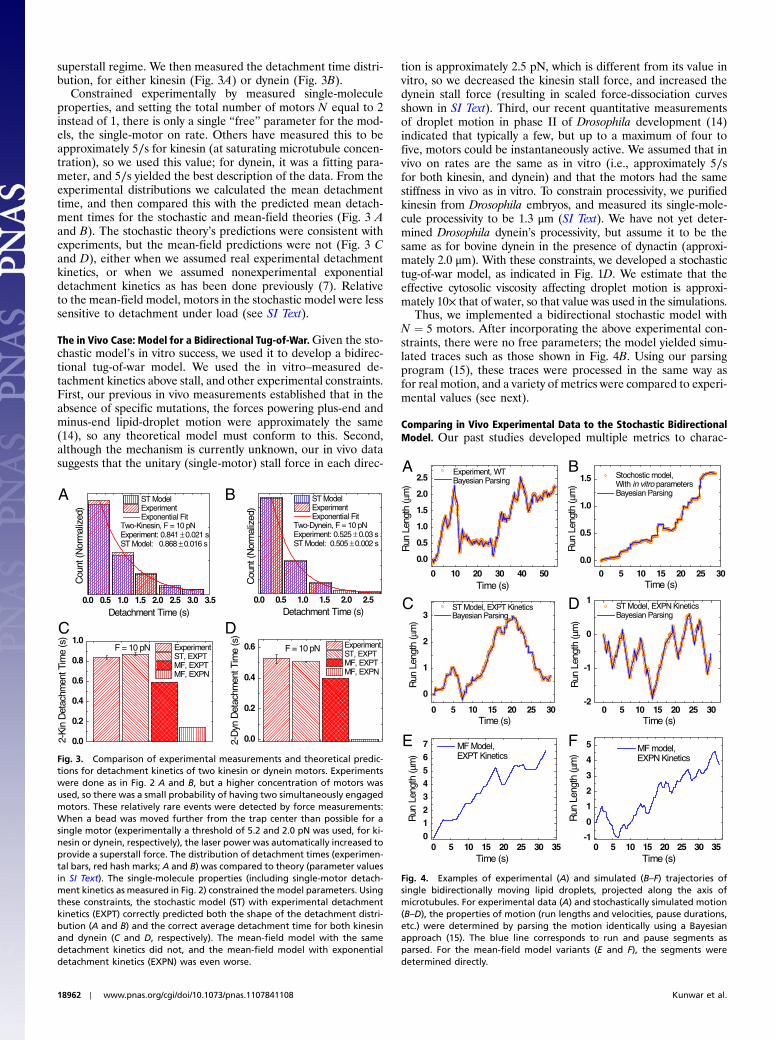
There are two theoretical approaches to modeling collectivemotor transport. The mean-field approach (Fig. 1A) assumes allengaged motors share load equally (7). The stochastic model(Fig. 1B) simulates individual motors going through their me-chanochemical cycle (8), where each motor’s movement is deter-mined by the load the cargo applies to that motor. The externalload on the cargo and instantaneous positions of each motordefine the cargo’s position. Thus, different motors in the group
move with different rates and experience different instantaneousforces; the cargo mechanically couples the motors. Each unidir-ectional model is the basis for a corresponding bidirectionaltug-of-war model (Fig. 1 C and D).
Here, we consider both classes of models and compare theo-retical predictions with experimentally observed motility. We startwith models maximally constrained by experimental observationsof single-motor behavior and then relax these constraints to in-vestigate both quantitative and qualitative differences betweenmodel predictions and actual data. We note that motor detach-ment kinetics under high load affect motors’ ensemble function(9), but complete data was not available. We thus measured sin-gle-motor detachment kinetics in the superstall regime and usedthis to constrain the models. The stochastic unidirectional modelquantitatively captured multiple-motor function as measuredexperimentally in vitro, but the mean-field model did not. In vivo,neither model explains bidirectional lipid-droplet motion.
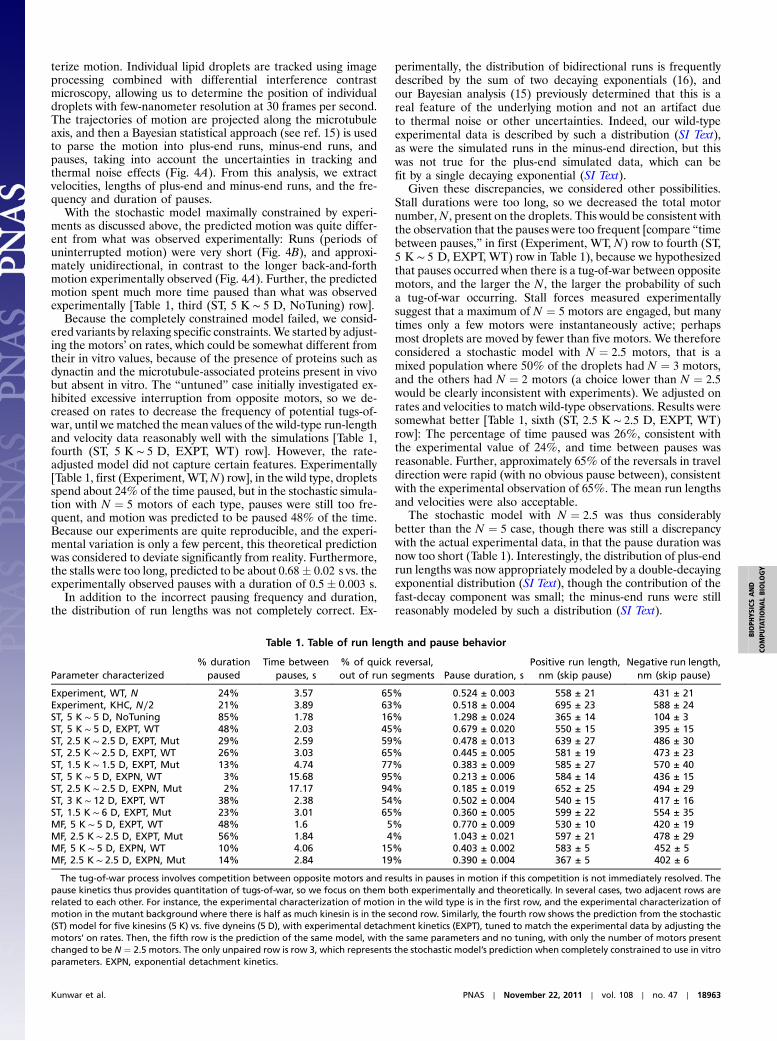
ResultsExperimental Measurement of Kinesin and Dynein DetachmentKinetics. Kinesin’s superforce off rate was reported as 2∕s (10),and limited measurements showed that dynein’s off rate slightlyabove stall was about 10∕s (9). Here, we measured the off ratesmore systematically, using an optical trap–based method. We ra-pidly increased the force on amoving bead (SI Text) andmeasuredthe time to detachment (Fig. 2A, kinesin; Fig. 2B, dynein). Fromsuch events, we determined the detachment time distributionsfor specific superforce values, shown, e.g., for kinesin and dyneinat approximately twice the stall force (Fig. 2 C and D) (see alsoSI Text). The detachment times for each superforce value are sum-marized for kinesin (Fig. 2E) and dynein (Fig. 2F). In contrast to apossible constant off rate (10), kinesin had an off rate increasingwith force. At low loads, dynein is sensitive to load, detaching ea-sily (9), but at higher load it exhibited a catch-bond type behavior,with off rate decreasing with load. The superforce experimentsalso allowed us to determine the probability of backward steppingfor the motors. Kinesin (11) and dynein (12) can back-step underload, but this was relatively rare in both directions (<20%), andthe typical backward travel distance was short, so we believe it isfunctionally irrelevant with regard to the behavior of kinesin or
Author contributions: A.K., S.K.T., C.C.Y., A.M., and S.P.G. designed research; A.K. andS.K.T. performed research; A.K., S.K.T., J.X., M.K.M., P.A., R.S., M.V., and R.J.M.contributed new reagents/analytic tools; A.K., S.K.T., A.M., and S.P.G. analyzed data;and A.K., S.K.T., A.M., and S.P.G. wrote the paper.
The authors declare no conflict of interest.
This article is a PNAS Direct Submission.1A.K. and S.K.T. contributed equally to this work.2A.M. and S.P.G. contributed equally to this work.3To whom correspondence may be addressed. E-mail: [email protected] [email protected].
This article contains supporting information online at www.pnas.org/lookup/suppl/doi:10.1073/pnas.1107841108/-/DCSupplemental.
18960–18965 ∣ PNAS ∣ November 22, 2011 ∣ vol. 108 ∣ no. 47 www.pnas.org/cgi/doi/10.1073/pnas.1107841108

dynein ensembles opposing each other. It was not included in ourtheoretical model.
Development of a Stochastic Unidirectional Theoretical Model forKinesin and Dynein. Our older stochastic models for kinesin (8),and dynein (9, 13) were experimentally verified under someconditions (8, 9, 13). Here, we incorporate the measured detach-ment data into these models. The force-dissociation rate belowstall is given by ΩðFÞ ¼ expðF∕FdÞ, as determined previouslyto match experimental data (8, 9). In the superstall regime, itwas obtained by using simple fitting functions to approximatethe measured detachment rates in Fig. 2 E and F. For kinesin,it was ΩðFÞ ¼ 1.07þ 0.186 F, and for dynein was ΩðFÞ ¼ 1∕ð0.254 ½1 − expð−F∕1.97ÞÞ. The stall forces for kinesin and dy-nein were 4.7 0.04 pN and 1.36 0.02 pN, respectively, deter-mined from in vitro stall-force distributions (see theDefinitions ofthe Stall Force (Fs) and Detachment Force (Fd) and Their Measure-ments section in SI Text). Fd was the average detachment forceobtained from experimental data (4.01 0.07 pN for kinesinand 0.87 0.04 pN for dynein). The dissociation rate near stallmay be smoother than assumed in our model, but the modelcorrectly captures the decline of the dissociation rate above stall.Associated corrections, if any, are not expected to alter the con-clusions of this paper. The complete force-dissociation relationsin our model are summarized in Fig. 2G and H (see also SI Text).
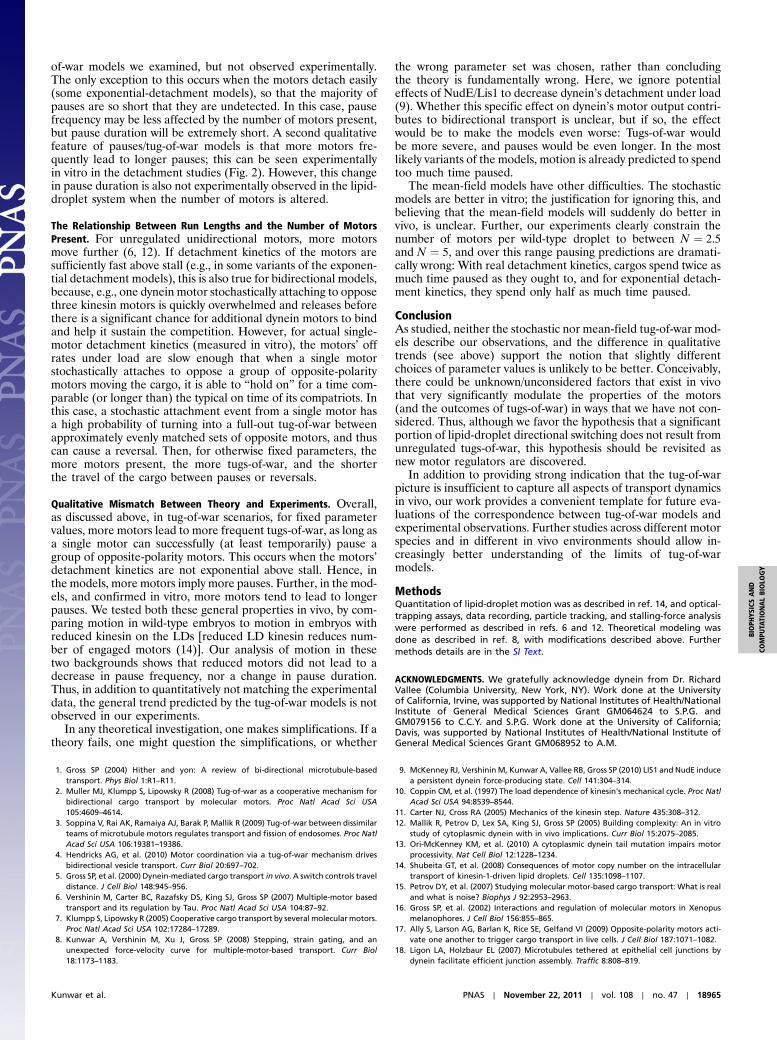
Comparison of Stochastic and Mean-Field Theories with in VitroExperiments for Unidirectional Motion: Detachment Times for Two-Motor Superstall Experiments. We experimentally tested the newlyconstrained theories using detachment times under superstall fortwo-motor events. With moderate motor density, beads aremostly moved by single motors, but are occasionally moved bytwo (motor density is chosen to make three-motor events rare).If a bead in a parabolic potential produced by an optical trapmoved past a well-defined threshold force (slightly larger thanFs for a single motor), it was moved by two motors, and softwareincreased the laser power abruptly to put the two motors into the
A
B
C
D
Unidirectional Mean Field Models
Unidirectional Stochastic Models
Bidirectional Mean Field Model
Bidirectional Stochastic Model
Fig. 1. Models of unidirectional (A and B) and bidirectional (C and D) trans-port schematic illustrations of a cargo (green) moved byN ¼ 3 kinesin (red) ordynein (dark blue) motors, as modeled by the mean-field theory (A) or thestochastic model (B). Overall forces opposing motion (fpos;fneg) are distribu-ted equally in the mean-field model (fd per dynein, fk per kinesin), but notin the stochastic model (fa–fc for dynein, fx–f z for kinesin). (C and D) Atug-of-war between kinesin and dynein, as modeled in the mean-fieldtheory (C) wheremotors share load equally, or the stochastic model (D) wherethey need not.
-0.2 0.0 0.2 0.4 0.6 0.8 1.0
15.1 pN
9.7 pN
Bea
d P
ositi
on (n
m)
Time (s)
5.6 pN
KinesinA
-0.5 0.0 0.5 1.0 1.5 2.0 2.5 3.0
9.75 pN
3.4 pN
Bea
d P
ositi
on (n
m)
Time (s)
2.08 pN
5 pN
DyneinB
0.2 0.4 0.6 0.8 1.00
10
20
30
40 Kinesin
Cou
nt
Detachment Time (s)
F = 9.7 pN0.34 ± 0.013 sec
C
0.3 0.6 0.9 1.2 1.50
5
10
15
20
25Dynein
F = 2.08 pN0.15 ± 0.014 sec
Cou
nt
Detachment Time (s)
D
6 8 10 12 14 16
0.3
0.4
0.5 Kinesin
Det
achm
ent T
ime,
Td
(s)
Force, F (pN)
Experiment Fit
Td = 1/(1.07 + 0.186*F)
E
2 3 4 5 6 7 8 9 10 11
0.15
0.18
0.21
0.24
0.27 Dynein
Det
achm
ent T
ime,
Td
(s)
Force, F (pN)
Experiment Fit
Td = 0.254*[1-Exp(-F/1.97)]
F
0 2 4 6 8 101
2
3
4
Fstall = 5 pNFd = 4 pN
Dis
soci
atio
n R
ate
Ω (s
-1)
Force (pN)
Kinesin, in vitro
G
0 2 4 6 8 10
2
4
6
8
Fstall = 1.25 pNFd = 0.87 pN
Dynein, in vitro
Dis
soci
atio
n R
ate
Ω (s
-1)
Force (pN)
H
Fig. 2. Experimental characterization of in vitro single-molecule kinesin anddynein detachment kinetics. (A and B): Examples of experimental data traces.Beads with a single active kinesin (A) or dynein (B) (binding fraction < 0.35)were brought in contact with the microtubule at saturating ATP. Motionstarted (at approximately −0.2 s in these plots), causing displacement ofthe bead from the optical-trap center (traces start increasing). At a prede-fined displacement (here occurring at t ¼ 0), the laser power was automati-cally increased, applying enough force to stall the moving bead (plateauimmediately after t ¼ 0). After a delay, the motor detached from the micro-tubule (black arrow), allowing the bead to rapidly return to the trap center.By controlling optical-trap power, we controlled the applied force. The de-tachment time was the interval between when trap power increased andwhen the bead detached; a histogram of such times is shown for one specificforce for kinesin (C) and dynein (D). The characteristic detachment times weredetermined by fitting with decaying exponentials (red curves in C and D); theresults of such fits are summarized in E and F for kinesin and dynein, respec-tively. G and H show the complete in vitro force-dissociation rate curvesincluding detachment probabilities below stall (see SI Text).
Kunwar et al. PNAS ∣ November 22, 2011 ∣ vol. 108 ∣ no. 47 ∣ 18961
BIOPH
YSICSAND
COMPU
TATIONALBIOLO
GY
superstall regime. We then measured the detachment time distri-bution, for either kinesin (Fig. 3A) or dynein (Fig. 3B).
Constrained experimentally by measured single-moleculeproperties, and setting the total number of motors N equal to 2instead of 1, there is only a single “free” parameter for the mod-els, the single-motor on rate. Others have measured this to beapproximately 5∕s for kinesin (at saturating microtubule concen-tration), so we used this value; for dynein, it was a fitting para-meter, and 5∕s yielded the best description of the data. From theexperimental distributions we calculated the mean detachmenttime, and then compared this with the predicted mean detach-ment times for the stochastic and mean-field theories (Fig. 3 Aand B). The stochastic theory’s predictions were consistent withexperiments, but the mean-field predictions were not (Fig. 3 Cand D), either when we assumed real experimental detachmentkinetics, or when we assumed nonexperimental exponentialdetachment kinetics as has been done previously (7). Relativeto the mean-field model, motors in the stochastic model were lesssensitive to detachment under load (see SI Text).
The in Vivo Case: Model for a Bidirectional Tug-of-War.Given the sto-chastic model’s in vitro success, we used it to develop a bidirec-tional tug-of-war model. We used the in vitro–measured de-tachment kinetics above stall, and other experimental constraints.First, our previous in vivo measurements established that in theabsence of specific mutations, the forces powering plus-end andminus-end lipid-droplet motion were approximately the same(14), so any theoretical model must conform to this. Second,although the mechanism is currently unknown, our in vivo datasuggests that the unitary (single-motor) stall force in each direc-
tion is approximately 2.5 pN, which is different from its value invitro, so we decreased the kinesin stall force, and increased thedynein stall force (resulting in scaled force-dissociation curvesshown in SI Text). Third, our recent quantitative measurementsof droplet motion in phase II of Drosophila development (14)indicated that typically a few, but up to a maximum of four tofive, motors could be instantaneously active. We assumed that invivo on rates are the same as in vitro (i.e., approximately 5∕sfor both kinesin, and dynein) and that the motors had the samestiffness in vivo as in vitro. To constrain processivity, we purifiedkinesin from Drosophila embryos, and measured its single-mole-cule processivity to be 1.3 μm (SI Text). We have not yet deter-mined Drosophila dynein’s processivity, but assume it to be thesame as for bovine dynein in the presence of dynactin (approxi-mately 2.0 μm). With these constraints, we developed a stochastictug-of-war model, as indicated in Fig. 1D. We estimate that theeffective cytosolic viscosity affecting droplet motion is approxi-mately 10× that of water, so that value was used in the simulations.
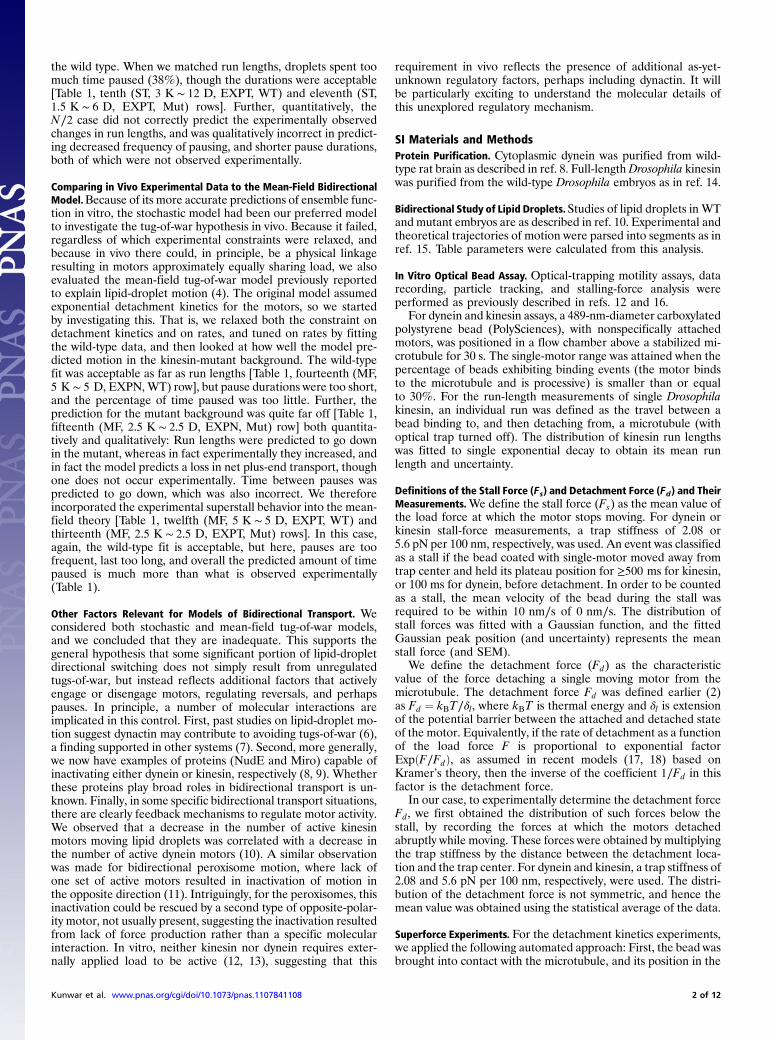
Thus, we implemented a bidirectional stochastic model withN ¼ 5 motors. After incorporating the above experimental con-straints, there were no free parameters; the model yielded simu-lated traces such as those shown in Fig. 4B. Using our parsingprogram (15), these traces were processed in the same way asfor real motion, and a variety of metrics were compared to experi-mental values (see next).
Comparing in Vivo Experimental Data to the Stochastic BidirectionalModel. Our past studies developed multiple metrics to charac-
0.0 0.5 1.0 1.5 2.0 2.5 3.0 3.5
Cou
nt (N
orm
aliz
ed)
Two-Kinesin, F = 10 pNExperiment: 0.841 ± 0.021 sST Model: 0.868 ± 0.016 s
Detachment Time (s)
ST ModelExperiment Exponential Fit
A
0.0 0.5 1.0 1.5 2.0 2.5
Cou
nt (N
orm
aliz
ed)
Detachment Time (s)
Two-Dynein, F = 10 pNExperiment: 0.525 ± 0.03 sST Model: 0.505 ± 0.002 s
ST ModelExperiment Exponential Fit
B
0.0
0.2
0.4
0.6
0.8
1.0
2-K
in D
etac
hmen
t Tim
e (s
)
ExperimentST, EXPTMF, EXPT MF, EXPN
F = 10 pN
C
0.0
0.2
0.4
0.6 F = 10 pN
2-D
yn D
etac
hmen
t Tim
e (s
)
ExperimentST, EXPTMF, EXPT MF, EXPN
D
Fig. 3. Comparison of experimental measurements and theoretical predic-tions for detachment kinetics of two kinesin or dynein motors. Experimentswere done as in Fig. 2 A and B, but a higher concentration of motors wasused, so there was a small probability of having two simultaneously engagedmotors. These relatively rare events were detected by force measurements:When a bead was moved further from the trap center than possible for asingle motor (experimentally a threshold of 5.2 and 2.0 pN was used, for ki-nesin or dynein, respectively), the laser power was automatically increased toprovide a superstall force. The distribution of detachment times (experimen-tal bars, red hash marks; A and B) was compared to theory (parameter valuesin SI Text). The single-molecule properties (including single-motor detach-ment kinetics as measured in Fig. 2) constrained the model parameters. Usingthese constraints, the stochastic model (ST) with experimental detachmentkinetics (EXPT) correctly predicted both the shape of the detachment distri-bution (A and B) and the correct average detachment time for both kinesinand dynein (C and D, respectively). The mean-field model with the samedetachment kinetics did not, and the mean-field model with exponentialdetachment kinetics (EXPN) was even worse.
0 10 20 30 40 50
0.0
0.5
1.0
1.5
2.0
2.5
Run
Len
gth
(µm
)
Time (s)
Experiment, WT Bayesian Parsing
0 5 10 15 20 25 30
0.0
0.5
1.0
1.5
Run
Len
gth
(µm
)Time (s)
Stochostic model, With in vitro parameters
Bayesian Parsing
0 5 10 15 20 25 30
0
1
2
3
Run
Len
gth
(µm
)
Time (s)
ST Model, EXPT Kinetics Bayesian Parsing
0 5 10 15 20 25 30-2
-1
0
1
Run
Len
gth
(µm
)
Time (s)
ST Model, EXPN Kinetics Bayesian Parsing
0 5 10 15 20 25 30 3501234567
Run
Len
gth
( µm
)
Time (s)
MF Model, EXPT Kinetics
0 5 10 15 20 25 30 35-1
0
1
2
3
4
5
Run
Len
gth
(µm
)
Time (s)
MF model, EXPN Kinetics
A B
C D
E F
Fig. 4. Examples of experimental (A) and simulated (B–F) trajectories ofsingle bidirectionally moving lipid droplets, projected along the axis ofmicrotubules. For experimental data (A) and stochastically simulated motion(B–D), the properties of motion (run lengths and velocities, pause durations,etc.) were determined by parsing the motion identically using a Bayesianapproach (15). The blue line corresponds to run and pause segments asparsed. For the mean-field model variants (E and F), the segments weredetermined directly.
18962 ∣ www.pnas.org/cgi/doi/10.1073/pnas.1107841108 Kunwar et al.
terize motion. Individual lipid droplets are tracked using imageprocessing combined with differential interference contrastmicroscopy, allowing us to determine the position of individualdroplets with few-nanometer resolution at 30 frames per second.The trajectories of motion are projected along the microtubuleaxis, and then a Bayesian statistical approach (see ref. 15) is usedto parse the motion into plus-end runs, minus-end runs, andpauses, taking into account the uncertainties in tracking andthermal noise effects (Fig. 4A). From this analysis, we extractvelocities, lengths of plus-end and minus-end runs, and the fre-quency and duration of pauses.
With the stochastic model maximally constrained by experi-ments as discussed above, the predicted motion was quite differ-ent from what was observed experimentally: Runs (periods ofuninterrupted motion) were very short (Fig. 4B), and approxi-mately unidirectional, in contrast to the longer back-and-forthmotion experimentally observed (Fig. 4A). Further, the predictedmotion spent much more time paused than what was observedexperimentally [Table 1, third (ST, 5 K ∼ 5 D, NoTuning) row].
Because the completely constrained model failed, we consid-ered variants by relaxing specific constraints.We started by adjust-ing the motors’ on rates, which could be somewhat different fromtheir in vitro values, because of the presence of proteins such asdynactin and the microtubule-associated proteins present in vivobut absent in vitro. The “untuned” case initially investigated ex-hibited excessive interruption from opposite motors, so we de-creased on rates to decrease the frequency of potential tugs-of-war, until we matched the mean values of the wild-type run-lengthand velocity data reasonably well with the simulations [Table 1,fourth (ST, 5 K ∼ 5 D, EXPT, WT) row]. However, the rate-adjusted model did not capture certain features. Experimentally[Table 1, first (Experiment, WT,N) row], in the wild type, dropletsspend about 24% of the time paused, but in the stochastic simula-tion with N ¼ 5 motors of each type, pauses were still too fre-quent, and motion was predicted to be paused 48% of the time.Because our experiments are quite reproducible, and the experi-mental variation is only a few percent, this theoretical predictionwas considered to deviate significantly from reality. Furthermore,the stalls were too long, predicted to be about 0.68 0.02 s vs. theexperimentally observed pauses with a duration of 0.5 0.003 s.
In addition to the incorrect pausing frequency and duration,the distribution of run lengths was not completely correct. Ex-
perimentally, the distribution of bidirectional runs is frequentlydescribed by the sum of two decaying exponentials (16), andour Bayesian analysis (15) previously determined that this is areal feature of the underlying motion and not an artifact dueto thermal noise or other uncertainties. Indeed, our wild-typeexperimental data is described by such a distribution (SI Text),as were the simulated runs in the minus-end direction, but thiswas not true for the plus-end simulated data, which can befit by a single decaying exponential (SI Text).
Given these discrepancies, we considered other possibilities.Stall durations were too long, so we decreased the total motornumber,N, present on the droplets. This would be consistent withthe observation that the pauses were too frequent [compare “timebetween pauses,” in first (Experiment, WT, N) row to fourth (ST,5 K ∼ 5 D, EXPT, WT) row in Table 1), because we hypothesizedthat pauses occurred when there is a tug-of-war between oppositemotors, and the larger the N, the larger the probability of sucha tug-of-war occurring. Stall forces measured experimentallysuggest that a maximum of N ¼ 5 motors are engaged, but manytimes only a few motors were instantaneously active; perhapsmost droplets are moved by fewer than five motors. We thereforeconsidered a stochastic model with N ¼ 2.5 motors, that is amixed population where 50% of the droplets had N ¼ 3 motors,and the others had N ¼ 2 motors (a choice lower than N ¼ 2.5would be clearly inconsistent with experiments). We adjusted onrates and velocities to match wild-type observations. Results weresomewhat better [Table 1, sixth (ST, 2.5 K ∼ 2.5 D, EXPT, WT)row]: The percentage of time paused was 26%, consistent withthe experimental value of 24%, and time between pauses wasreasonable. Further, approximately 65% of the reversals in traveldirection were rapid (with no obvious pause between), consistentwith the experimental observation of 65%. The mean run lengthsand velocities were also acceptable.
The stochastic model with N ¼ 2.5 was thus considerablybetter than the N ¼ 5 case, though there was still a discrepancywith the actual experimental data, in that the pause duration wasnow too short (Table 1). Interestingly, the distribution of plus-endrun lengths was now appropriately modeled by a double-decayingexponential distribution (SI Text), though the contribution of thefast-decay component was small; the minus-end runs were stillreasonably modeled by such a distribution (SI Text).
Table 1. Table of run length and pause behavior
Parameter characterized% duration
pausedTime between
pauses, s% of quick reversal,out of run segments Pause duration, s
Positive run length,nm (skip pause)
Negative run length,nm (skip pause)
Experiment, WT, N 24% 3.57 65% 0.524 ± 0.003 558 ± 21 431 ± 21Experiment, KHC, N∕2 21% 3.89 63% 0.518 ± 0.004 695 ± 23 588 ± 24ST, 5 K ∼ 5 D, NoTuning 85% 1.78 16% 1.298 ± 0.024 365 ± 14 104 ± 3ST, 5 K ∼ 5 D, EXPT, WT 48% 2.03 45% 0.679 ± 0.020 550 ± 15 395 ± 15ST, 2.5 K ∼ 2.5 D, EXPT, Mut 29% 2.59 59% 0.478 ± 0.013 639 ± 27 486 ± 30ST, 2.5 K ∼ 2.5 D, EXPT, WT 26% 3.03 65% 0.445 ± 0.005 581 ± 19 473 ± 23ST, 1.5 K ∼ 1.5 D, EXPT, Mut 13% 4.74 77% 0.383 ± 0.009 585 ± 27 570 ± 40ST, 5 K ∼ 5 D, EXPN, WT 3% 15.68 95% 0.213 ± 0.006 584 ± 14 436 ± 15ST, 2.5 K ∼ 2.5 D, EXPN, Mut 2% 17.17 94% 0.185 ± 0.019 652 ± 25 494 ± 29ST, 3 K ∼ 12 D, EXPT, WT 38% 2.38 54% 0.502 ± 0.004 540 ± 15 417 ± 16ST, 1.5 K ∼ 6 D, EXPT, Mut 23% 3.01 65% 0.360 ± 0.005 599 ± 22 554 ± 35MF, 5 K ∼ 5 D, EXPT, WT 48% 1.6 5% 0.770 ± 0.009 530 ± 10 420 ± 19MF, 2.5 K ∼ 2.5 D, EXPT, Mut 56% 1.84 4% 1.043 ± 0.021 597 ± 21 478 ± 29MF, 5 K ∼ 5 D, EXPN, WT 10% 4.06 15% 0.403 ± 0.002 583 ± 5 452 ± 5MF, 2.5 K ∼ 2.5 D, EXPN, Mut 14% 2.84 19% 0.390 ± 0.004 367 ± 5 402 ± 6
The tug-of-war process involves competition between opposite motors and results in pauses in motion if this competition is not immediately resolved. Thepause kinetics thus provides quantitation of tugs-of-war, so we focus on them both experimentally and theoretically. In several cases, two adjacent rows arerelated to each other. For instance, the experimental characterization of motion in the wild type is in the first row, and the experimental characterization ofmotion in the mutant background where there is half as much kinesin is in the second row. Similarly, the fourth row shows the prediction from the stochastic(ST) model for five kinesins (5 K) vs. five dyneins (5 D), with experimental detachment kinetics (EXPT), tuned to match the experimental data by adjusting themotors’ on rates. Then, the fifth row is the prediction of the same model, with the same parameters and no tuning, with only the number of motors presentchanged to be N ¼ 2.5motors. The only unpaired row is row 3, which represents the stochastic model’s prediction when completely constrained to use in vitroparameters. EXPN, exponential detachment kinetics.
Kunwar et al. PNAS ∣ November 22, 2011 ∣ vol. 108 ∣ no. 47 ∣ 18963
BIOPH
YSICSAND
COMPU
TATIONALBIOLO
GY

Critical Test of the Stochastic Theory: Prediction of Motion in aDecreased Kinesin Heavy Chain (KHC) Background. Many aspects ofthis N ¼ 2.5 version of the stochastic model [Table 1, sixth (ST,2.5 K ∼ 2.5 D, EXPT, WT) row] were acceptable, so we tested itfurther. A good way to test a theory is to fix unknown parametersby fitting experimental data under one in vivo condition, and thenuse the theory (with fixed parameters) to predict what shouldoccur in a second in vivo condition where any changes in para-meters are known/measured a priori [see, e.g., the prediction oflysosomal run lengths in neurons, as affected by decreasingdynein processivity (13)]. Here, we took such an approach. Usinga kinesin-null mutation KHC-27 (which makes no protein), wecreated embryos from KHC-27∕þ mothers, that is, mothers thathad one null and one wild-type copy of the gene (14). In this back-ground, lipid droplets are moved by 50% less kinesin (as deter-mined by biochemistry, measuring droplet-bound kinesin, andby force measurements, assessing the number of active motors)(14). Thus, by construction, instead of N ¼ 2.5, in this new back-ground N ≈ 1.25; for simplicity (and also to match experimentalconstraints, which clearly indicate significant contribution from asecond motor in the mutant case), we modeled this theoreticallyusing an equal combination of N ¼ 1 and N ¼ 2 droplets. Forcemeasurements indicate that the number of active dynein motorswas also decreased by 50% (14); such feedback is common, andhas been observed in a number of systems (17), although itsmechanistic underpinnings are unknown. We looked at the samedevelopmental phase as for the wild-type embryos, so we usedthe same values of all the adjustable parameters that we fixed byfitting the wild-type motion. With these constraints, there are noadjustable parameters.
In this test, the stochastic N ¼ 1.5 theory [Table 1, seventh (ST,1.5 K ∼ 1.5 D, EXPT, Mut) row] failed to correctly reproducethe experimental observations in a number of qualitative as wellas quantitative ways. First, the stochastic model simulationspredicted that the percentage of time paused decreased (from26% to 13%). This was theoretically expected (given the pausefrequency differences between the N ¼ 5 and N ¼ 2.5 simula-tions, and see discussion in SI Text), but not what was observedexperimentally, where total time paused was approximately con-stant within experimental error [24% vs 21%; Table 1, first(Experiment, WT, N) row vs. second (Experiment, KHC, N∕2)row]. Similarly, theoretically, the time between pauses increaseddramatically [Table 1, seventh (ST, 1.5 K ∼ 1.5 D, EXPT, Mut)row vs. sixth (ST, 2.5 K ∼ 2.5 D, EXPT, WT) row], and pauseduration decreased, because of fewer engaged motors, but this wasnot observed experimentally. Finally, experimentally, the decreaseinN resulted in longer run lengths in both directions, but in theory,the effect was not observed in the plus-end direction, and the pre-dicted increase in minus-end run length (21%) was smaller thanobserved (36%). Thus, although some of the model predictionswere qualitatively in agreement with the experimental data (e.g.,the predicted increase in velocities in each direction), some werenot (pause frequencies and durations, and plus-end run lengthsincreasing), and even those that had a correct trend had magni-tudes that were not consistent with experiments. We conclude thatalthough the stochastic tug-of-war model with actual in vitro de-tachment kinetics and in vitro processivities recovers some of thefeatures observed in the wild-type motion, it is not an accuratemodel of the experimental process.
Additional Variants. Overall, we considered relaxing a number ofother constraints, including adjusting single-motor processivity, try-ing exponential instead of experimentally measured detachmentkinetics, and allowing uneven numbers of motors (see SI Text fordetails). We also investigated mean-field tug-of-war models in ad-dition to the stochastic models (see SI Text). None of these variantscorrectly described the data (see SI Text and Table 1).
DiscussionExperimental Measurements and Their Ramifications. Our recentNudE/Lis1 studies (9) highlight the importance of single-motordetachment kinetics for ensemble function under load; such ki-netics are expected to be of particular importance in determiningoutcomes of hypothetical tugs-of-war between groups of motors.We systematically measured both kinesin and dynein detachmentkinetics in vitro, and found neither as expected. Dynein had“catch-bond” detachment kinetics, with its detachment rate de-creasing with increasing load. This could, in principle, contributeto dynein being able to serve as an “anchor” to hold subcellularorganelles in place (18) under high load. We expect that thesecharacterizations of the motors’ detachment kinetics will be use-ful for theoretical models describing how ensembles of motorsfunction together. We constrained two classes of models—sto-chastic and mean-field—by these data and compared their pre-dictions to ensemble motor behavior in vitro. The stochasticmodel describes the in vitro data reasonably well, but the mean-field theory model does not.
Tug-of-War Scenarios to Explain Bidirectional Motion. Many cargosmove bidirectionally, reversing travel direction every few seconds.The key determinant in net, or average transport, is the durationof runs (periods of travel between reversals) in each direction.Because run length is determined by reversal frequency, it isimportant to understand the reversal process. Tug-of-war modelsare appealing because they suggest that the reversals reflectunregulated (stochastic and mechanical) competitions betweenopposite-polarity motors on the cargo (a group of plus-end kine-sins and a group of minus-end dyneins), allowing us, in principle,to use single-motor properties measured in vitro to predict andunderstand emergent transport in vivo.
We evaluated such models critically, within the context oflipid-droplet (LD) motion inDrosophila embryos, using a strategypreviously used studying multiple dynein motors in vivo, in cul-tured neurons. We constrained the models’ “free” parameters asmuch as possible via experimental data and then determined thevalues of any unconstrained parameters by fitting the theory’spredictions to one experimental set of in vivo (wild-type) data.Once the theory’s parameters were fixed, it was used to predictthe outcome of a known change, with no further adjustment. Inthe previous study, modeling essentially unidirectional transport(13), the “known change” was a (in vitro measured) reduction insingle-motor processivity, caused by the dynein Loa mutation.Here, the known change was the reduction in the total motornumber N on the cargo. In the dynein Loa study we achievedquantitative agreement between theory and experiment, but here,for bidirectional transport, we were unable to do so. Thus, weconclude that although tugs-of-war likely exist some of the time,using this mechanism alone one cannot explain bidirectional mo-tion—there must be an additional mechanism (likely enzymatic)that contributes to regulation of the motors.
One could wonder about whether we failed to find the rightchoice of parameters, but specific qualitative discrepanciesbetween the theoretical predictions and experimental observa-tions (discussed below) suggest to us that this is unlikely.
The Importance of Pauses. In a tug-of-war model, pauses occurwhen the opposite motors “battle,” and as such are a crucial read-out, sensitive to the tug-of-war process. The frequency of pausesis determined by a combination of the number of motors presenton the cargos, and the on rates of those motors. The pause dura-tions are determined both by the number of motors engaged inthe tug-of-war, the individual motors’ on rates, and the detach-ment kinetics of the motors under load. One key feature oftug-of-war models is that the more motors are present, the moreopportunities for battles one has, and thus the higher the fre-quency of pauses. This was true for almost all variants of the tug-
18964 ∣ www.pnas.org/cgi/doi/10.1073/pnas.1107841108 Kunwar et al.
of-war models we examined, but not observed experimentally.The only exception to this occurs when the motors detach easily(some exponential-detachment models), so that the majority ofpauses are so short that they are undetected. In this case, pausefrequency may be less affected by the number of motors present,but pause duration will be extremely short. A second qualitativefeature of pauses/tug-of-war models is that more motors fre-quently lead to longer pauses; this can be seen experimentallyin vitro in the detachment studies (Fig. 2). However, this changein pause duration is also not experimentally observed in the lipid-droplet system when the number of motors is altered.
The Relationship Between Run Lengths and the Number of MotorsPresent. For unregulated unidirectional motors, more motorsmove further (6, 12). If detachment kinetics of the motors aresufficiently fast above stall (e.g., in some variants of the exponen-tial detachment models), this is also true for bidirectional models,because, e.g., one dynein motor stochastically attaching to opposethree kinesin motors is quickly overwhelmed and releases beforethere is a significant chance for additional dynein motors to bindand help it sustain the competition. However, for actual single-motor detachment kinetics (measured in vitro), the motors’ offrates under load are slow enough that when a single motorstochastically attaches to oppose a group of opposite-polaritymotors moving the cargo, it is able to “hold on” for a time com-parable (or longer than) the typical on time of its compatriots. Inthis case, a stochastic attachment event from a single motor hasa high probability of turning into a full-out tug-of-war betweenapproximately evenly matched sets of opposite motors, and thuscan cause a reversal. Then, for otherwise fixed parameters, themore motors present, the more tugs-of-war, and the shorterthe travel of the cargo between pauses or reversals.
Qualitative Mismatch Between Theory and Experiments. Overall,as discussed above, in tug-of-war scenarios, for fixed parametervalues, more motors lead to more frequent tugs-of-war, as long asa single motor can successfully (at least temporarily) pause agroup of opposite-polarity motors. This occurs when the motors’detachment kinetics are not exponential above stall. Hence, inthe models, more motors imply more pauses. Further, in the mod-els, and confirmed in vitro, more motors tend to lead to longerpauses. We tested both these general properties in vivo, by com-paring motion in wild-type embryos to motion in embryos withreduced kinesin on the LDs [reduced LD kinesin reduces num-ber of engaged motors (14)]. Our analysis of motion in thesetwo backgrounds shows that reduced motors did not lead to adecrease in pause frequency, nor a change in pause duration.Thus, in addition to quantitatively not matching the experimentaldata, the general trend predicted by the tug-of-war models is notobserved in our experiments.
In any theoretical investigation, one makes simplifications. If atheory fails, one might question the simplifications, or whether
the wrong parameter set was chosen, rather than concludingthe theory is fundamentally wrong. Here, we ignore potentialeffects of NudE/Lis1 to decrease dynein’s detachment under load(9). Whether this specific effect on dynein’s motor output contri-butes to bidirectional transport is unclear, but if so, the effectwould be to make the models even worse: Tugs-of-war wouldbe more severe, and pauses would be even longer. In the mostlikely variants of the models, motion is already predicted to spendtoo much time paused.
The mean-field models have other difficulties. The stochasticmodels are better in vitro; the justification for ignoring this, andbelieving that the mean-field models will suddenly do better invivo, is unclear. Further, our experiments clearly constrain thenumber of motors per wild-type droplet to between N ¼ 2.5and N ¼ 5, and over this range pausing predictions are dramati-cally wrong: With real detachment kinetics, cargos spend twice asmuch time paused as they ought to, and for exponential detach-ment kinetics, they spend only half as much time paused.
ConclusionAs studied, neither the stochastic nor mean-field tug-of-war mod-els describe our observations, and the difference in qualitativetrends (see above) support the notion that slightly differentchoices of parameter values is unlikely to be better. Conceivably,there could be unknown/unconsidered factors that exist in vivothat very significantly modulate the properties of the motors(and the outcomes of tugs-of-war) in ways that we have not con-sidered. Thus, although we favor the hypothesis that a significantportion of lipid-droplet directional switching does not result fromunregulated tugs-of-war, this hypothesis should be revisited asnew motor regulators are discovered.
In addition to providing strong indication that the tug-of-warpicture is insufficient to capture all aspects of transport dynamicsin vivo, our work provides a convenient template for future eva-luations of the correspondence between tug-of-war models andexperimental observations. Further studies across different motorspecies and in different in vivo environments should allow in-creasingly better understanding of the limits of tug-of-warmodels.
MethodsQuantitation of lipid-droplet motion was as described in ref. 14, and optical-trapping assays, data recording, particle tracking, and stalling-force analysiswere performed as described in refs. 6 and 12. Theoretical modeling wasdone as described in ref. 8, with modifications described above. Furthermethods details are in the SI Text.
ACKNOWLEDGMENTS. We gratefully acknowledge dynein from Dr. RichardVallee (Columbia University, New York, NY). Work done at the Universityof California, Irvine, was supported by National Institutes of Health/NationalInstitute of General Medical Sciences Grant GM064624 to S.P.G. andGM079156 to C.C.Y. and S.P.G. Work done at the University of California;Davis, was supported by National Institutes of Health/National Institute ofGeneral Medical Sciences Grant GM068952 to A.M.
1. Gross SP (2004) Hither and yon: A review of bi-directional microtubule-basedtransport. Phys Biol 1:R1–R11.
2. Muller MJ, Klumpp S, Lipowsky R (2008) Tug-of-war as a cooperative mechanism forbidirectional cargo transport by molecular motors. Proc Natl Acad Sci USA105:4609–4614.
3. Soppina V, Rai AK, Ramaiya AJ, Barak P, Mallik R (2009) Tug-of-war between dissimilarteams of microtubule motors regulates transport and fission of endosomes. Proc NatlAcad Sci USA 106:19381–19386.
4. Hendricks AG, et al. (2010) Motor coordination via a tug-of-war mechanism drivesbidirectional vesicle transport. Curr Biol 20:697–702.
5. Gross SP, et al. (2000) Dynein-mediated cargo transport in vivo. A switch controls traveldistance. J Cell Biol 148:945–956.
6. Vershinin M, Carter BC, Razafsky DS, King SJ, Gross SP (2007) Multiple-motor basedtransport and its regulation by Tau. Proc Natl Acad Sci USA 104:87–92.
7. Klumpp S, Lipowsky R (2005) Cooperative cargo transport by several molecularmotors.Proc Natl Acad Sci USA 102:17284–17289.
8. Kunwar A, Vershinin M, Xu J, Gross SP (2008) Stepping, strain gating, and anunexpected force-velocity curve for multiple-motor-based transport. Curr Biol18:1173–1183.
9. McKenney RJ, VershininM, Kunwar A, Vallee RB, Gross SP (2010) LIS1 and NudE inducea persistent dynein force-producing state. Cell 141:304–314.
10. Coppin CM, et al. (1997) The load dependence of kinesin's mechanical cycle. Proc NatlAcad Sci USA 94:8539–8544.
11. Carter NJ, Cross RA (2005) Mechanics of the kinesin step. Nature 435:308–312.12. Mallik R, Petrov D, Lex SA, King SJ, Gross SP (2005) Building complexity: An in vitro
study of cytoplasmic dynein with in vivo implications. Curr Biol 15:2075–2085.13. Ori-McKenney KM, et al. (2010) A cytoplasmic dynein tail mutation impairs motor
processivity. Nat Cell Biol 12:1228–1234.14. Shubeita GT, et al. (2008) Consequences of motor copy number on the intracellular
transport of kinesin-1-driven lipid droplets. Cell 135:1098–1107.15. Petrov DY, et al. (2007) Studying molecular motor-based cargo transport: What is real
and what is noise? Biophys J 92:2953–2963.16. Gross SP, et al. (2002) Interactions and regulation of molecular motors in Xenopus
melanophores. J Cell Biol 156:855–865.17. Ally S, Larson AG, Barlan K, Rice SE, Gelfand VI (2009) Opposite-polarity motors acti-
vate one another to trigger cargo transport in live cells. J Cell Biol 187:1071–1082.18. Ligon LA, Holzbaur EL (2007) Microtubules tethered at epithelial cell junctions by
dynein facilitate efficient junction assembly. Traffic 8:808–819.
Kunwar et al. PNAS ∣ November 22, 2011 ∣ vol. 108 ∣ no. 47 ∣ 18965
BIOPH
YSICSAND
COMPU
TATIONALBIOLO
GY

Supporting InformationKunwar et al. 10.1073/pnas.1107841108SI TextDetails of Detachment Studies. To measure the off rates moresystematically, we used an optical trap–based method. Kinesinor dynein were attached to polystyrene beads, but in limitedamounts, so that approximately one of every three beads boundand moved, making sure that we were in the single-motor regime.We then applied the following automated approach. First, thebead was brought into contact with the microtubule, and itsposition in the optical trap was detected using the quadrantphotodiode. For the subset of beads with active motors, whenthe motor attached to, and started walking along, the microtu-bule, it moved the bead toward the edge of the optical trap. Whenthe bead reached a predefined location (typically 100 nm forkinesin, and 70 nm for dynein, from the trap center), our auto-mated software increased the laser power, so that the motor wassuddenly under a “superforce” situation; the magnitude of thesuperforce was determined by how much power was used. Wethen measured the time to detachment (i.e., the time betweenwhen the laser power was increased and the moment when themotor detached from the microtubule, allowing the bead to fallback rapidly toward the trap center). Examples of such eventsare shown in Fig. 2A for kinesin and Fig. 2B for dynein. By fittinga single decaying exponential function to such distributions, weextracted a characteristic off rate for each superforce value, sum-marized for different applied superforces in Fig. 2E for kinesinand Fig. 2F for dynein.
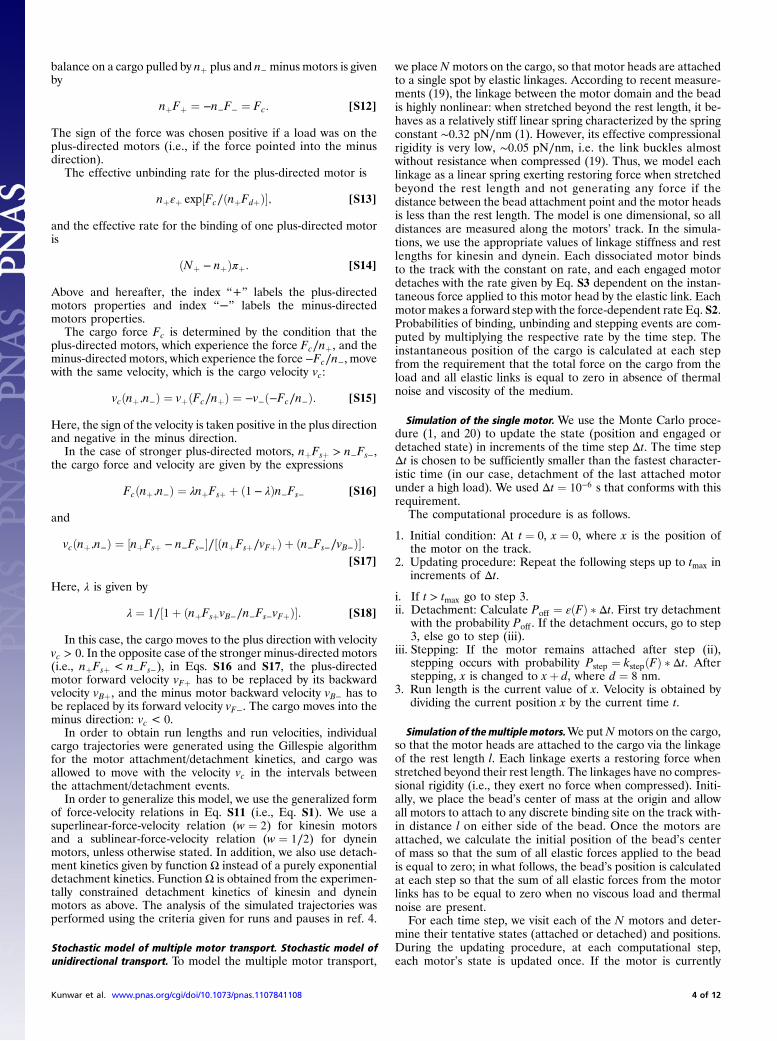
Performance of Unidirectional Stochastic vs. Mean-Field ModelUnder Load.We previously suggested that because of uneven loadsharing (1), the stochastic model had improved ensemble perfor-mance under load. However, at that time the two models haddifferent superforce assumptions. Now, more appropriately, wecompare models with identical parameter values and superforcebehavior. Consistent with the previous suggestion, we find thatbinding events even below stall last longer for the stochastic mod-el (Fig. S1A) than for the mean-field model, with the differenceincreasing as one goes to higher loads. Runs are a bit more con-fusing: The mean-field model predicts slightly longer runs thanfor the stochastic model (Fig. S1 B and C), but this actually re-flects the fact that the stochastic model allows brief backward“blips” of motion of the cargo because of detachment of thelead motor, whereas the mean-field model does not consider thepossibility that motors could be ahead or behind each other.When corrected for the blips, the stochastic run lengths are long-er, consistent with the longer binding times (Fig. S1 B and C,arrow marked) Note that the superstall behavior we implement,based on the experimental measurements, dramatically improvesthe ensemble behavior when compared with the use of exponen-tial detachment kinetics above stall (as originally assumed byKlumpp et al. (2) (compare MF, EXPN in Fig S9A to MF, EXPTin Fig S9C). Specifically, the exponential detachment assumptionmakes the ensemble very sensitive to applied load (Fig. S1 Band C showing predicted run lengths), and thus the group ofmotors detaches quickly. Obviously, a mean-field prediction withthis kind of detachment is even further from actual experiments(compare MF, EXPN in Fig S9A to MF, EXPT in Fig S9C). Inconclusion, constrained by single-molecule data, the stochasticmodel appears to describe ensemble behavior in vitro reasonablywell, whereas neither version of the mean-field theory is asaccurate.
Variants of the Stochastic Model: Lower Processivity. Because relax-ing the on rate and motor number constraint failed, we consid-ered relaxing further constraints. Although some studies suggestthat single-motor kinesin processivity is the same in vivo as invitro (3), we considered the possibility that here it was lower. Wetherefore looked at a stochastic model with N ¼ 5motors, whereboth kinesin and dynein processivities were chosen to be approxi-mately 500 nm. As for the long-processivity N ¼ 5 case above,droplets spent too much time paused (39% vs. the experimental24%), so this model was rejected. We thus again consideredthe possibility of the wild type being described byN ¼ 2.5motors.As for the long-processivity case above, by tuning on rates appro-priately, this was again close enough that it reasonably matchedthe wild-type experimental data. We thus examined predictionsfor the kinesin heavy chain 27∕þ embryos, modeled using thesame parameters as the wild type, but now choosing N ¼ 1.5.Similar to the longer processivities N ¼ 1.5 case, this was closerto experimental data, but still unacceptable. In particular, therewas still the qualitative problem that the percentage of timestalled decreased (from 23% to 15%), whereas experimentallythey did not, and although the plus-end and minus-end runlengths did increase, the magnitude of the effect (between 4%and 12%) was much smaller than observed experimentally (be-tween 25% and 36%). Thus, we conclude that neither the N ¼ 5nor N ¼ 2.5 stochastic tug-of-war models with in vitro superstallbehavior are acceptable, regardless of the choice of on rates orsingle-motor processivities.
Variants of the Stochastic Model: Exponential Detachment Kinetics.In principle, there could also be factors in vivo that alter single-motor detachment kinetics. Others have suggested that tug-of-war models correctly reproduce the data, when exponentialdetachment kinetics are assumed (4), so we considered them withthe N ¼ 5 stochastic model (Fig. 4D). Because the motors detachmuch more readily under load, exponential detachment kineticsmakes pauses less likely, and when we tuned the motors’ on ratesto reproduce the observed run lengths, we observe very fewpauses [3% of time paused vs. the experimentally observed 24%;Table 1, eighth (ST, 5 K ∼ 5 D, EXPN, WT) row], and the timebetween pauses was extremely long. The predicted mean pauseduration (0.21 0.006 s) was much shorter than that observedexperimentally (0.52 0.003 s). Again, the increase in runlengths with decreasing number of motors present (Table 1) issignificantly smaller than that observed experimentally.
Variants of the Stochastic Model: Uneven Numbers of Motors. Ourexperimental measurements indicate that overall stall forces ineach direction are approximately balanced, and suggest thatthe single-motor stall force is approximately 2.5 pN. In principle,one could get such a force of approximately 2.5 pN from approxi-mately two dynein motors, though it is unclear how such a forcewould come about from kinesin functioning with in vitro proper-ties. Nonetheless, because others have modeled bidirectionaltransport assuming uneven numbers of motors (5), we consideredthe case of the wild-type lipid droplet with three kinesin motorsfunctioning with in vitro (approximately 5 pN) stall forces, op-posed by 12 dynein motors with in vitro (1.25 pN) stall forces(chosen to balance forces, because this is observed experimen-tally). We assumed experimental in vitro detachment kinetics andsingle-molecule processivities, and tuned the on rates of themotors, in order to match mean experimental run lengths for
Kunwar et al. www.pnas.org/cgi/doi/10.1073/pnas.1107841108 1 of 12
the wild type. When we matched run lengths, droplets spent toomuch time paused (38%), though the durations were acceptable[Table 1, tenth (ST, 3 K ∼ 12 D, EXPT, WT) and eleventh (ST,1.5 K ∼ 6 D, EXPT, Mut) rows]. Further, quantitatively, theN∕2 case did not correctly predict the experimentally observedchanges in run lengths, and was qualitatively incorrect in predict-ing decreased frequency of pausing, and shorter pause durations,both of which were not observed experimentally.
Comparing in Vivo Experimental Data to the Mean-Field BidirectionalModel.Because of its more accurate predictions of ensemble func-tion in vitro, the stochastic model had been our preferred modelto investigate the tug-of-war hypothesis in vivo. Because it failed,regardless of which experimental constraints were relaxed, andbecause in vivo there could, in principle, be a physical linkageresulting in motors approximately equally sharing load, we alsoevaluated the mean-field tug-of-war model previously reportedto explain lipid-droplet motion (4). The original model assumedexponential detachment kinetics for the motors, so we startedby investigating this. That is, we relaxed both the constraint ondetachment kinetics and on rates, and tuned on rates by fittingthe wild-type data, and then looked at how well the model pre-dicted motion in the kinesin-mutant background. The wild-typefit was acceptable as far as run lengths [Table 1, fourteenth (MF,5 K ∼ 5 D, EXPN,WT) row], but pause durations were too short,and the percentage of time paused was too little. Further, theprediction for the mutant background was quite far off [Table 1,fifteenth (MF, 2.5 K ∼ 2.5 D, EXPN, Mut) row] both quantita-tively and qualitatively: Run lengths were predicted to go downin the mutant, whereas in fact experimentally they increased, andin fact the model predicts a loss in net plus-end transport, thoughone does not occur experimentally. Time between pauses waspredicted to go down, which was also incorrect. We thereforeincorporated the experimental superstall behavior into the mean-field theory [Table 1, twelfth (MF, 5 K ∼ 5 D, EXPT, WT) andthirteenth (MF, 2.5 K ∼ 2.5 D, EXPT, Mut) rows]. In this case,again, the wild-type fit is acceptable, but here, pauses are toofrequent, last too long, and overall the predicted amount of timepaused is much more than what is observed experimentally(Table 1).
Other Factors Relevant for Models of Bidirectional Transport. Weconsidered both stochastic and mean-field tug-of-war models,and we concluded that they are inadequate. This supports thegeneral hypothesis that some significant portion of lipid-dropletdirectional switching does not simply result from unregulatedtugs-of-war, but instead reflects additional factors that activelyengage or disengage motors, regulating reversals, and perhapspauses. In principle, a number of molecular interactions areimplicated in this control. First, past studies on lipid-droplet mo-tion suggest dynactin may contribute to avoiding tugs-of-war (6),a finding supported in other systems (7). Second, more generally,we now have examples of proteins (NudE and Miro) capable ofinactivating either dynein or kinesin, respectively (8, 9). Whetherthese proteins play broad roles in bidirectional transport is un-known. Finally, in some specific bidirectional transport situations,there are clearly feedback mechanisms to regulate motor activity.We observed that a decrease in the number of active kinesinmotors moving lipid droplets was correlated with a decrease inthe number of active dynein motors (10). A similar observationwas made for bidirectional peroxisome motion, where lack ofone set of active motors resulted in inactivation of motion inthe opposite direction (11). Intriguingly, for the peroxisomes, thisinactivation could be rescued by a second type of opposite-polar-ity motor, not usually present, suggesting the inactivation resultedfrom lack of force production rather than a specific molecularinteraction. In vitro, neither kinesin nor dynein requires exter-nally applied load to be active (12, 13), suggesting that this
requirement in vivo reflects the presence of additional as-yet-unknown regulatory factors, perhaps including dynactin. It willbe particularly exciting to understand the molecular details ofthis unexplored regulatory mechanism.
SI Materials and MethodsProtein Purification. Cytoplasmic dynein was purified from wild-type rat brain as described in ref. 8. Full-lengthDrosophila kinesinwas purified from the wild-type Drosophila embryos as in ref. 14.
Bidirectional Study of Lipid Droplets. Studies of lipid droplets in WTand mutant embryos are as described in ref. 10. Experimental andtheoretical trajectories of motion were parsed into segments as inref. 15. Table parameters were calculated from this analysis.
In Vitro Optical Bead Assay. Optical-trapping motility assays, datarecording, particle tracking, and stalling-force analysis wereperformed as previously described in refs. 12 and 16.
For dynein and kinesin assays, a 489-nm-diameter carboxylatedpolystyrene bead (PolySciences), with nonspecifically attachedmotors, was positioned in a flow chamber above a stabilized mi-crotubule for 30 s. The single-motor range was attained when thepercentage of beads exhibiting binding events (the motor bindsto the microtubule and is processive) is smaller than or equalto 30%. For the run-length measurements of single Drosophilakinesin, an individual run was defined as the travel between abead binding to, and then detaching from, a microtubule (withoptical trap turned off). The distribution of kinesin run lengthswas fitted to single exponential decay to obtain its mean runlength and uncertainty.
Definitions of the Stall Force (Fs) and Detachment Force (Fd ) and TheirMeasurements.We define the stall force (Fs) as the mean value ofthe load force at which the motor stops moving. For dynein orkinesin stall-force measurements, a trap stiffness of 2.08 or5.6 pN per 100 nm, respectively, was used. An event was classifiedas a stall if the bead coated with single-motor moved away fromtrap center and held its plateau position for ≥500 ms for kinesin,or 100 ms for dynein, before detachment. In order to be countedas a stall, the mean velocity of the bead during the stall wasrequired to be within 10 nm∕s of 0 nm∕s. The distribution ofstall forces was fitted with a Gaussian function, and the fittedGaussian peak position (and uncertainty) represents the meanstall force (and SEM).
We define the detachment force (Fd) as the characteristicvalue of the force detaching a single moving motor from themicrotubule. The detachment force Fd was defined earlier (2)as Fd ¼ kBT∕δl, where kBT is thermal energy and δl is extensionof the potential barrier between the attached and detached stateof the motor. Equivalently, if the rate of detachment as a functionof the load force F is proportional to exponential factorExpðF∕FdÞ, as assumed in recent models (17, 18) based onKramer’s theory, then the inverse of the coefficient 1∕Fd in thisfactor is the detachment force.
In our case, to experimentally determine the detachment forceFd, we first obtained the distribution of such forces below thestall, by recording the forces at which the motors detachedabruptly while moving. These forces were obtained by multiplyingthe trap stiffness by the distance between the detachment loca-tion and the trap center. For dynein and kinesin, a trap stiffness of2.08 and 5.6 pN per 100 nm, respectively, were used. The distri-bution of the detachment force is not symmetric, and hence themean value was obtained using the statistical average of the data.
Superforce Experiments. For the detachment kinetics experiments,we applied the following automated approach: First, the bead wasbrought into contact with the microtubule, and its position in the
Kunwar et al. www.pnas.org/cgi/doi/10.1073/pnas.1107841108 2 of 12

optical trap was detected using the quadrant photodiode. For thesubset of beads with active motors, when the motor attached to,and started walking along, the microtubule, it moved the beadtoward the edge of the optical trap. When the bead reached apredefined location (typically 100 nm for kinesin, and 70 nmfor dynein, from the trap center), our automated software in-creased the laser power, so that the motor was suddenly undera superforce situation; the magnitude of the superforce was de-termined by how much power was used. We then measured thetime to detachment (i.e., the time between when the laser powerwas increased and the moment when the motor detached fromthe microtubule, allowing the bead to fall back rapidly towardthe trap center). The distribution of detachment times was fittedto a single exponential decay. The obtained decay constant anduncertainly presented in each plot represent the averagedetachment time and SEM, respectively. Statistical significancewas determined using the Student’s t test.
Theoretical Simulations. Generalized mean-field models of multiplemotor transport. Generalized mean-field model of unidirectionaltransport. Force-velocity relations of single motors can be wellapproximated by the following mathematical expression:
vðFÞ ¼ vð1 − ðF∕FsÞwÞ; [S1]
where v is the unloaded velocity of the single motor, F is the loadforce, and Fs is the stall force. If the motor moves in steps oflength d, then the motor can be described effectively with theload-dependent rate of stepping:
kstepðFÞ ¼ ðv∕dÞ½1 − ðF∕FsÞw: [S2]
The force-dissociation relation of a single motor can be writtenas
εðFÞ ¼ εΩðFÞ; [S3]
where ε is the load-free dissociation rate, and function ΩðFÞdetermines the load dependence of the detachment-rate. Recentmodels have assumed function ΩðFÞ as exponential functionbased on Kramer’s theory (i.e., ΩðFÞ ¼ ExpðF∕FdÞ, where Fdis the detachment force).
Recent work (17) extended the mean-field model proposedin ref. 18 onto a variety of single-motor force-velocity relations.Importantly, in both refs. 17 and 18, the force-dissociation ratefor motors was assumed to be an exponentially increasing func-tion of load, so that εiðFÞ ¼ iεExpðF∕iFdÞ, where i is the numberof engaged motors. In our generalized model, a cargo particle istransported cooperatively by N molecular motors; out of N, vari-able number iðtÞ motors are engaged at any given moment. Theengaged motors share the applied load F equally, so the force F∕iis applied to each of i engaged motors. Thus, the cargo has thevelocity:
viðFÞ ¼vð1 − ðF∕iFsÞwÞ for F ≤ iFs
0 for F ≥ iFs: [S4]
Here, exponent w determines the linearity/nonlinearity of theforce-velocity curve. For w ¼ 1, the force-velocity curve is linearand reduces to the case investigated in ref. 18; for w > 1, force-velocity curves are superlinear; and for w < 1, force-velocitycurves are sublinear.
The number of engaged motors increases with the rate
πi ¼ ðN − iÞπ [S5]
and decreases with the rate
εiðFÞ ¼ iεΩðF∕iÞ; [S6]
where π is the attachment rate of a single motor, ε is the detach-ment rate of unloaded single motor, and N is the total motornumber on the cargo. The new feature of the mode is the forcedependence of the dissociation rate of a single motor is givenby function Ω, which can, in principle, have many differentfunctional forms.
We use the stationary solutions of the master equationobtained in ref. 18 expressing the probability for the system tohave i engaged motors in terms of the motor parameters,
P0 ¼"1þ ∑
N−1
i¼0
Yij¼0
πjεjþ1
#−1and Pi ¼ P0
Yi−1j¼0
πjεjþi
; [S7]
to find the average velocity of the cargo,
V ¼ ∑N
i¼1
viPi
1 − P0
; [S8]
and average run length of the cargo,
X ¼ 1þ ∑N−1
i¼1
Yij¼1
vjþ1πjvjεjþ1
: [S9]
For w ¼ 1 and ΩðFÞ ¼ ExpðF∕FdÞ for any F, the model is iden-tical to the one proposed in ref. 18. For kinesin motors, we usew ¼ 2, and for dynein motors we use w ¼ 1∕2 in the force-velocityrelations, unless otherwise stated.
The average detachment time of cargo can be obtained from asimple argument that in the stationary state effective unbindingrate of cargo from any one of the attached state is equal tothe effective binding rate of an unattached cargo. The resultingexpression is given by (18):
T1;N ¼ 1
ε1
1þ ∑
N−1
i¼1
Yin¼1
πnεnþ1
!: [S10]
Generalized mean-field model of bidirectional transport. To studythe bidirectional transport, Muller et. al. (4), developed a modelof bidirectional cargo transport in which Nþ plus-directed andN− minus-directed motors attach and detach from a microtubulestochastically with given on and off rates. The bidirectional modelis an extension of the model of unidirectional transport (18). Theforce-velocity relation for the motors was assumed to be a linearfunction of the applied load, and force-dissociation rate of themotors was assumed to be an exponentially increasing functionof the load. When bound to the microtubule, the motor walksforward with the velocity vF , which decreases linearly with theexternal force and reaches zero at the stall force Fs. Under super-stall external forces (F > Fs), the motor walks backward slowlywith backward velocity vB
vðFÞ ¼vFð1 − F∕FsÞ for F ≤ Fs
vBð1 − F∕FsÞ for F ≥ Fs: [S11]
The rates for unbinding of one of the bound motors and for bind-ing of an additional motor on the cargo are found based on theassumption that (i) the presence of opposing motors inducesa load force, and (ii) each plus motor feels the load Fþ (andgenerates the force −Fþ), and each minus motor feels the load−F− (and generates the force F−); this means that the force
Kunwar et al. www.pnas.org/cgi/doi/10.1073/pnas.1107841108 3 of 12
balance on a cargo pulled by nþ plus and n− minus motors is givenby
nþFþ ¼ −n−F− ¼ Fc: [S12]
The sign of the force was chosen positive if a load was on theplus-directed motors (i.e., if the force pointed into the minusdirection).
The effective unbinding rate for the plus-directed motor is
nþεþ exp½Fc∕ðnþFdþÞ; [S13]
and the effective rate for the binding of one plus-directed motoris
ðNþ − nþÞπþ: [S14]
Above and hereafter, the index “+” labels the plus-directedmotors properties and index “−” labels the minus-directedmotors properties.
The cargo force Fc is determined by the condition that theplus-directed motors, which experience the force Fc∕nþ, and theminus-directed motors, which experience the force −Fc∕n−, movewith the same velocity, which is the cargo velocity vc:
vcðnþ;n−Þ ¼ vþðFc∕nþÞ ¼ −v−ð−Fc∕n−Þ: [S15]
Here, the sign of the velocity is taken positive in the plus directionand negative in the minus direction.
In the case of stronger plus-directed motors, nþFsþ > n−Fs−,the cargo force and velocity are given by the expressions
Fcðnþ;n−Þ ¼ λnþFsþ þ ð1 − λÞn−Fs− [S16]
and
vcðnþ;n−Þ ¼ ½nþFsþ − n−Fs−∕½ðnþFsþ∕vFþÞ þ ðn−Fs−∕vB−Þ:[S17]
Here, λ is given by
λ ¼ 1∕½1þ ðnþFsþvB−∕n−Fs−vFþÞ: [S18]
In this case, the cargo moves to the plus direction with velocityvc > 0. In the opposite case of the stronger minus-directed motors(i.e., nþFsþ < n−Fs−), in Eqs. S16 and S17, the plus-directedmotor forward velocity vFþ has to be replaced by its backwardvelocity vBþ, and the minus motor backward velocity vB− has tobe replaced by its forward velocity vF−. The cargo moves into theminus direction: vc < 0.
In order to obtain run lengths and run velocities, individualcargo trajectories were generated using the Gillespie algorithmfor the motor attachment/detachment kinetics, and cargo wasallowed to move with the velocity vc in the intervals betweenthe attachment/detachment events.
In order to generalize this model, we use the generalized formof force-velocity relations in Eq. S11 (i.e., Eq. S1). We use asuperlinear-force-velocity relation (w ¼ 2) for kinesin motorsand a sublinear-force-velocity relation (w ¼ 1∕2) for dyneinmotors, unless otherwise stated. In addition, we also use detach-ment kinetics given by function Ω instead of a purely exponentialdetachment kinetics. Function Ω is obtained from the experimen-tally constrained detachment kinetics of kinesin and dyneinmotors as above. The analysis of the simulated trajectories wasperformed using the criteria given for runs and pauses in ref. 4.
Stochastic model of multiple motor transport. Stochastic model ofunidirectional transport. To model the multiple motor transport,
we placeN motors on the cargo, so that motor heads are attachedto a single spot by elastic linkages. According to recent measure-ments (19), the linkage between the motor domain and the beadis highly nonlinear: when stretched beyond the rest length, it be-haves as a relatively stiff linear spring characterized by the springconstant ∼0.32 pN∕nm (1). However, its effective compressionalrigidity is very low, ∼0.05 pN∕nm, i.e. the link buckles almostwithout resistance when compressed (19). Thus, we model eachlinkage as a linear spring exerting restoring force when stretchedbeyond the rest length and not generating any force if thedistance between the bead attachment point and the motor headsis less than the rest length. The model is one dimensional, so alldistances are measured along the motors’ track. In the simula-tions, we use the appropriate values of linkage stiffness and restlengths for kinesin and dynein. Each dissociated motor bindsto the track with the constant on rate, and each engaged motordetaches with the rate given by Eq. S3 dependent on the instan-taneous force applied to this motor head by the elastic link. Eachmotor makes a forward step with the force-dependent rate Eq. S2.Probabilities of binding, unbinding and stepping events are com-puted by multiplying the respective rate by the time step. Theinstantaneous position of the cargo is calculated at each stepfrom the requirement that the total force on the cargo from theload and all elastic links is equal to zero in absence of thermalnoise and viscosity of the medium.
Simulation of the single motor. We use the Monte Carlo proce-dure (1, and 20) to update the state (position and engaged ordetached state) in increments of the time step Δt. The time stepΔt is chosen to be sufficiently smaller than the fastest character-istic time (in our case, detachment of the last attached motorunder a high load). We used Δt ¼ 10−6 s that conforms with thisrequirement.
The computational procedure is as follows.
1. Initial condition: At t ¼ 0, x ¼ 0, where x is the position ofthe motor on the track.
2. Updating procedure: Repeat the following steps up to tmax inincrements of Δt.
i. If t > tmax go to step 3.ii. Detachment: Calculate Poff ¼ εðFÞ Δt. First try detachment
with the probability Poff . If the detachment occurs, go to step3, else go to step (iii).
iii. Stepping: If the motor remains attached after step (ii),stepping occurs with probability Pstep ¼ kstepðFÞ Δt. Afterstepping, x is changed to xþ d, where d ¼ 8 nm.
3. Run length is the current value of x. Velocity is obtained bydividing the current position x by the current time t.
Simulation of the multiple motors.We putN motors on the cargo,so that the motor heads are attached to the cargo via the linkageof the rest length l. Each linkage exerts a restoring force whenstretched beyond their rest length. The linkages have no compres-sional rigidity (i.e., they exert no force when compressed). Initi-ally, we place the bead’s center of mass at the origin and allowall motors to attach to any discrete binding site on the track with-in distance l on either side of the bead. Once the motors areattached, we calculate the initial position of the bead’s centerof mass so that the sum of all elastic forces applied to the beadis equal to zero; in what follows, the bead’s position is calculatedat each step so that the sum of all elastic forces from the motorlinks has to be equal to zero when no viscous load and thermalnoise are present.
For each time step, we visit each of the N motors and deter-mine their tentative states (attached or detached) and positions.During the updating procedure, at each computational step,each motor’s state is updated once. If the motor is currently
Kunwar et al. www.pnas.org/cgi/doi/10.1073/pnas.1107841108 4 of 12

unattached, we allow it to attach with a probability Pon ¼ π Δt,determined by the on rate π, to any binding site on the track with-in distance l on either side from the bead’s center of mass. Ifthe motor is currently attached, a load Fi felt by the ith motoris obtained by multiplying the extension of its link Δli by the link’sstiffness k, and there are three possibilities: The motor can re-main stationary, advance, or detach. Probabilities of these threeevents are determined from the single-motor model based onthe current load on the motor: (i) Poff is calculated using Eq. S3irrespective of the direction of the force applied to the motor; (ii)Pstep is calculated using Eq. S2 for backward loads Fi < Fs; forbackward load greater than Fs, Pstep ¼ 0; a forward load doesnot alter the motor cycle, so we substitute Fi ¼ 0 for forwardloads in Eq. S2. If the motor steps, its position xi is changedto xi þ d. When we determine the tentative states and positionsof all N motors, we update the states and positions of all motorssimultaneously. Then, the number of engaged motors n and theirlocations are recorded and the bead position is updated.
Updating cargo position in the presence of viscous load and thermalnoise. In the presence of the viscous load, the position of the beadis determined not by the balancing of the elastic motor forces tozero, but by the viscous force and thermal force that the beadexperiences. In the absence of any force, the bead would executea Brownian motion due to the thermal noise. Over a time intervalof Δt, the displacement of the bead due to these thermal kickscan be drawn from a normal distribution with a mean-square dis-placement 2DΔt, where D is the diffusion constant of the bead.We neglected the thermal motion of the linkages. If the bead issubjected to the net force f , this causes it to move with velocityvdrift ¼ f∕γ. The net motion of the bead over the time interval Δtis given by the sum of deterministic drift xdrift ¼ vdrift Δt anddiffusion 2DΔt due to thermal noise. The net force f on the cargois given by f ¼ ∑N
i f i, where f i is the elastic restoring force exertedby the ith linkage on the cargo, which magnitude depends on theextension of the ith linkage.
Stochastic model of bidirectional transport. The stochastic modelof the unidirectional transport can be easily extended for thebidirectional transport by just adding motors that move in the op-posite direction (which have different single-motor parameters,such as on rate, off rate, velocity, etc.). The length of the linkagefor kinesin motors was taken as 110 nm, and the length of thelinkage for dynein motors was taken as 50 nm. Calculation ofthe cargo position is done similar to the unidirectional case. Inthe absence of viscous drag and thermal noise, position of thecargo is calculated using the simple force balance. In the presenceof thermal noise and viscous drag, the cargo position is calculatedin the manner similar to the unidirectional case. However, in thiscase net force f is the sum of the forces exerted by both sets ofmotors moving in opposite directions.
Parameter Values Used. Fig. 3: (A) Parameter values used forthe simulations of stochastic model were v ¼ 1 μm∕s, k ¼0.32 pN∕nm, Fd ¼ 4 pN, Fs ¼ 5 pN, π ¼ 5∕s, ε ¼ 1∕s withΩðFÞ ¼ ExpðF∕FdÞ for F < Fs and ΩðFÞ ¼ 1.07þ 0.186 Ffor F ≥ Fs. Simulations were started with the initial number ofmotors set to steady-state values. (C) Parameters used formean-field models (MF, EXPT & MF, EXPN) were N ¼ 2,Fd ¼ 4 pN, Fs ¼ 5 pN, π ¼ 5∕s, ε ¼ 1∕s. ΩðFÞ ¼ ExpðF∕FdÞfor all F was used for exponential detachment kinetics (B) Para-meter values used for the simulations of stochastic model werev ¼ 0.8 μm∕s, k ¼ 0.32 pN∕nm, Fd ¼ 0.87 pN, Fs ¼ 1.25 pN,π ¼ 5∕s, ε ¼ 1∕s with ΩðFÞ ¼ ExpðF∕FdÞ for F < Fs and ΩðFÞ ¼1∕ð0.254 ð1 − Expð−F∕1.96646ÞÞÞ for F ≥ Fs. Simulationswere started with the initial number of motors set to steady-statevalues.(D) Parameters used for mean-field models (MF, EXPT &MF, EXPN) were N ¼ 2, Fd ¼ 0.87 pN, Fs ¼ 1.25 pN, π ¼ 5∕s,
ε ¼ 1∕s. ΩðFÞ ¼ ExpðF∕FdÞ for all F was used for exponentialdetachment kinetics.
Table 1: (ST, 5 K ∼ 5 D, NoTuning) Data was obtained from100 simulated tracks with maximum duration of 30 s for fivekinesin versus five dynein motors on a cargo with all motorsinitially attached to the microtubule. The radius of cargo wastaken as 0.25 μm. Parameter values for kinesin were v ¼ 1 μm∕s,k ¼ 0.32 pN∕nm, Fd ¼ 2.00 pN, Fs ¼ 2.50 pN, π ¼ 5∕s, ε ¼0.71∕s with ΩðFÞ ¼ ExpðF∕FdÞ for F < Fs and ΩðFÞ ¼ 1.535þ0.186 F for F ≥ Fs. Parameter values for dynein werev ¼ 0.8 μm∕s, k ¼ 0.32 pN∕nm, Fd ¼ 1.74 pN, Fs ¼ 2.50 pN,π ¼ 5∕s, ε ¼ 0.4∕s with ΩðFÞ ¼ ExpðF∕FdÞ for F < Fs andΩðFÞ ¼ 1∕ð0.254 ð1 − Expð−F∕1.96646ÞÞÞ for F ≥ Fs.
(ST, 5 K ∼ 5 D, EXPT,WT) Data was obtained from 100 simu-lated tracks with maximum duration of 30 s for five kinesin versusfive dynein motors on a cargo with all motors initially attachedto the microtubule. (ST, 2.5 K ∼ 2.5 D, EXPT, Mut) Data wasobtained from a mixture of, 50 simulated tracks for three kinesinversus three dynein motors and 50 simulated tracks for two kine-sin versus two dynein motors, on a cargo with all motors initiallyattached to the microtubule where each track had a maximumduration of 30 s.
The radius of cargo was taken as 0.25 μm. Parameter valuesfor kinesin were v ¼ 0.57 μm∕s, k ¼ 0.32 pN∕nm, Fd ¼ 2.00 pN,Fs ¼ 2.50 pN, π ¼ 0.95∕s, ε ¼ 0.35∕s with ΩðFÞ ¼ ExpðF∕FdÞfor F < Fs and ΩðFÞ ¼ 1.535þ 0.186 F for F ≥ Fs. Parametervalues for dynein were v ¼ 0.85 μm∕s, k ¼ 0.32 pN∕nm,Fd ¼ 1.74 pN, Fs ¼ 2.50 pN, π ¼ 1.19∕s, ε ¼ 0.37∕s with ΩðFÞ ¼ExpðF∕FdÞ for F < Fs and ΩðFÞ ¼ 1∕ð0.254 ð1 − Expð−F∕1.96646ÞÞÞ for F ≥ Fs.
(ST, 2.5 K ∼ 2.5 D, EXPT, WT) Data was obtained from amixture of 50 simulated tracks for three kinesin versus threedynein motors and 50 simulated tracks for two kinesin versustwo dynein motors, on a cargo with all motors initially attachedto the microtubule where each track had a maximum duration of30 s. (ST, 1.5 K ∼ 1.5 D, EXPT, Mut) Data was obtained from amixture of 50 simulated tracks for two kinesin versus two dyneinmotors and 50 simulated tracks for one kinesin versus one dyneinmotor, on a cargo with all motors initially attached to the micro-tubule where each track had a maximum duration of 30 s.
The radius of cargo was taken as 0.25 μm. Parameter valuesfor kinesin were v ¼ 0.52 μm∕s, k ¼ 0.32 pN∕nm, Fd ¼ 2.00 pN,Fs ¼ 2.50 pN, π ¼ 1.10∕s, ε ¼ 0.35∕s with ΩðFÞ ¼ ExpðF∕FdÞfor F < Fs and ΩðFÞ ¼ 1.535þ 0.186 F for F ≥ Fs. Parametervalues for dynein were v ¼ 0.80 μm∕s, k ¼ 0.32 pN∕nm,Fd ¼ 1.74 pN, Fs ¼ 2.50 pN, π ¼ 1.29∕s, ε ¼ 0.37∕s with ΩðFÞ ¼ExpðF∕FdÞ for F < Fs and ΩðFÞ ¼ 1∕ð0.254 ð1 − Expð−F∕1.96646ÞÞÞ for F ≥ Fs.
(ST, 5 K ∼ 5 D, EXPN, WT) Data was obtained from 100 si-mulated tracks with maximum duration of 30 s for five kinesinversus five dynein motors on a cargo with all motors initiallyattached to the microtubule. (ST, 2.5 K ∼ 2.5 D, EXPN, Mut)Data was obtained from a mixture of 50 simulated tracks for threekinesin versus three dynein motors and 50 simulated tracks fortwo kinesin versus two dynein motors, on a cargo with all motorsinitially attached to the microtubule where each track had amaximum duration of 30 s.
The radius of cargo was taken as 0.25 μm. Parameter values forkinesin were v ¼ 0.50 μm∕s, k ¼ 0.32 pN∕nm, Fd ¼ 0.60 pN,Fs ¼ 2.50 pN, π ¼ 0.9∕s, ε ¼ 0.26∕s with ΩðFÞ ¼ ExpðF∕FdÞfor all F. Parameter values for dynein were v ¼ 0.75 μm∕s,k ¼ 0.32 pN∕nm, Fd ¼ 0.55 pN, Fs ¼ 2.50 pN, π ¼ 0.9∕s,ε ¼ 0.27∕s with ΩðFÞ ¼ ExpðF∕FdÞ for all F
(ST, 3 K ∼ 12 D, EXPT, WT) Data was obtained from 100simulated tracks with maximum duration of 30 s for 3 kinesinversus 12 dynein motors on a cargo with all motors initially at-tached to the microtubule. (ST, 1.5 K ∼ 6 D, EXPT, Mut) Datawas obtained from a mixture of, 50 simulated tracks for two
Kunwar et al. www.pnas.org/cgi/doi/10.1073/pnas.1107841108 5 of 12
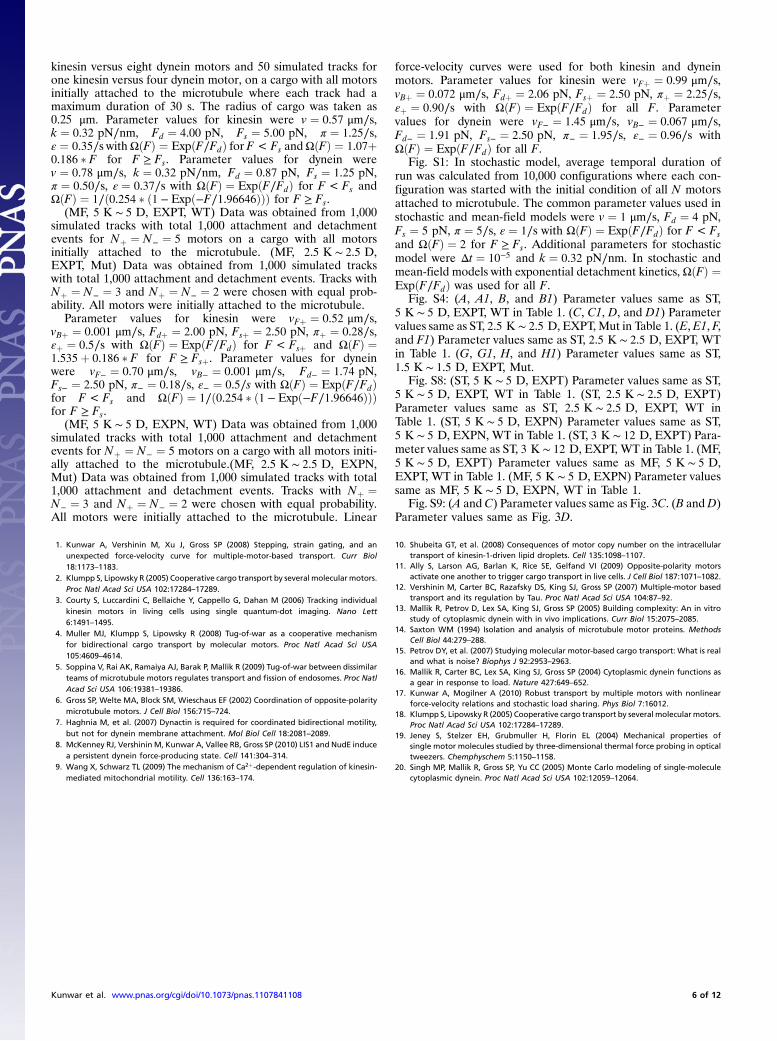
kinesin versus eight dynein motors and 50 simulated tracks forone kinesin versus four dynein motor, on a cargo with all motorsinitially attached to the microtubule where each track had amaximum duration of 30 s. The radius of cargo was taken as0.25 μm. Parameter values for kinesin were v ¼ 0.57 μm∕s,k ¼ 0.32 pN∕nm, Fd ¼ 4.00 pN, Fs ¼ 5.00 pN, π ¼ 1.25∕s,ε ¼ 0.35∕s withΩðFÞ ¼ ExpðF∕FdÞ for F < Fs andΩðFÞ ¼ 1.07þ0.186 F for F ≥ Fs. Parameter values for dynein werev ¼ 0.78 μm∕s, k ¼ 0.32 pN∕nm, Fd ¼ 0.87 pN, Fs ¼ 1.25 pN,π ¼ 0.50∕s, ε ¼ 0.37∕s with ΩðFÞ ¼ ExpðF∕FdÞ for F < Fs andΩðFÞ ¼ 1∕ð0.254 ð1 − Expð−F∕1.96646ÞÞÞ for F ≥ Fs.
(MF, 5 K ∼ 5 D, EXPT, WT) Data was obtained from 1,000simulated tracks with total 1,000 attachment and detachmentevents for Nþ ¼ N− ¼ 5 motors on a cargo with all motorsinitially attached to the microtubule. (MF, 2.5 K ∼ 2.5 D,EXPT, Mut) Data was obtained from 1,000 simulated trackswith total 1,000 attachment and detachment events. Tracks withNþ ¼ N− ¼ 3 and Nþ ¼ N− ¼ 2 were chosen with equal prob-ability. All motors were initially attached to the microtubule.
Parameter values for kinesin were vFþ ¼ 0.52 μm∕s,vBþ ¼ 0.001 μm∕s, Fdþ ¼ 2.00 pN, Fsþ ¼ 2.50 pN, πþ ¼ 0.28∕s,εþ ¼ 0.5∕s with ΩðFÞ ¼ ExpðF∕FdÞ for F < Fsþ and ΩðFÞ ¼1.535þ 0.186 F for F ≥ Fsþ. Parameter values for dyneinwere vF− ¼ 0.70 μm∕s, vB− ¼ 0.001 μm∕s, Fd− ¼ 1.74 pN,Fs− ¼ 2.50 pN, π− ¼ 0.18∕s, ε− ¼ 0.5∕s with ΩðFÞ ¼ ExpðF∕FdÞfor F < Fs and ΩðFÞ ¼ 1∕ð0.254 ð1 − Expð−F∕1.96646ÞÞÞfor F ≥ Fs.
(MF, 5 K ∼ 5 D, EXPN, WT) Data was obtained from 1,000simulated tracks with total 1,000 attachment and detachmentevents for Nþ ¼ N− ¼ 5 motors on a cargo with all motors initi-ally attached to the microtubule.(MF, 2.5 K ∼ 2.5 D, EXPN,Mut) Data was obtained from 1,000 simulated tracks with total1,000 attachment and detachment events. Tracks with Nþ ¼N− ¼ 3 and Nþ ¼ N− ¼ 2 were chosen with equal probability.All motors were initially attached to the microtubule. Linear
force-velocity curves were used for both kinesin and dyneinmotors. Parameter values for kinesin were vFþ ¼ 0.99 μm∕s,vBþ ¼ 0.072 μm∕s, Fdþ ¼ 2.06 pN, Fsþ ¼ 2.50 pN, πþ ¼ 2.25∕s,εþ ¼ 0.90∕s with ΩðFÞ ¼ ExpðF∕FdÞ for all F. Parametervalues for dynein were vF− ¼ 1.45 μm∕s, vB− ¼ 0.067 μm∕s,Fd− ¼ 1.91 pN, Fs− ¼ 2.50 pN, π− ¼ 1.95∕s, ε− ¼ 0.96∕s withΩðFÞ ¼ ExpðF∕FdÞ for all F.
Fig. S1: In stochastic model, average temporal duration ofrun was calculated from 10,000 configurations where each con-figuration was started with the initial condition of all N motorsattached to microtubule. The common parameter values used instochastic and mean-field models were v ¼ 1 μm∕s, Fd ¼ 4 pN,Fs ¼ 5 pN, π ¼ 5∕s, ε ¼ 1∕s with ΩðFÞ ¼ ExpðF∕FdÞ for F < Fsand ΩðFÞ ¼ 2 for F ≥ Fs. Additional parameters for stochasticmodel were Δt ¼ 10−5 and k ¼ 0.32 pN∕nm. In stochastic andmean-field models with exponential detachment kinetics, ΩðFÞ ¼ExpðF∕FdÞ was used for all F.
Fig. S4: (A, A1, B, and B1) Parameter values same as ST,5 K ∼ 5 D, EXPT, WT in Table 1. (C, C1, D, and D1) Parametervalues same as ST, 2.5 K ∼ 2.5 D, EXPT,Mut in Table 1. (E,E1, F,and F1) Parameter values same as ST, 2.5 K ∼ 2.5 D, EXPT, WTin Table 1. (G, G1, H, and H1) Parameter values same as ST,1.5 K ∼ 1.5 D, EXPT, Mut.
Fig. S8: (ST, 5 K ∼ 5 D, EXPT) Parameter values same as ST,5 K ∼ 5 D, EXPT, WT in Table 1. (ST, 2.5 K ∼ 2.5 D, EXPT)Parameter values same as ST, 2.5 K ∼ 2.5 D, EXPT, WT inTable 1. (ST, 5 K ∼ 5 D, EXPN) Parameter values same as ST,5 K ∼ 5 D, EXPN, WT in Table 1. (ST, 3 K ∼ 12 D, EXPT) Para-meter values same as ST, 3 K ∼ 12 D, EXPT, WT in Table 1. (MF,5 K ∼ 5 D, EXPT) Parameter values same as MF, 5 K ∼ 5 D,EXPT, WT in Table 1. (MF, 5 K ∼ 5 D, EXPN) Parameter valuessame as MF, 5 K ∼ 5 D, EXPN, WT in Table 1.
Fig. S9: (A and C) Parameter values same as Fig. 3C. (B andD)Parameter values same as Fig. 3D.
1. Kunwar A, Vershinin M, Xu J, Gross SP (2008) Stepping, strain gating, and anunexpected force-velocity curve for multiple-motor-based transport. Curr Biol18:1173–1183.
2. Klumpp S, Lipowsky R (2005) Cooperative cargo transport by several molecularmotors.Proc Natl Acad Sci USA 102:17284–17289.
3. Courty S, Luccardini C, Bellaiche Y, Cappello G, Dahan M (2006) Tracking individualkinesin motors in living cells using single quantum-dot imaging. Nano Lett6:1491–1495.
4. Muller MJ, Klumpp S, Lipowsky R (2008) Tug-of-war as a cooperative mechanismfor bidirectional cargo transport by molecular motors. Proc Natl Acad Sci USA105:4609–4614.
5. Soppina V, Rai AK, Ramaiya AJ, Barak P, Mallik R (2009) Tug-of-war between dissimilarteams of microtubule motors regulates transport and fission of endosomes. Proc NatlAcad Sci USA 106:19381–19386.
6. Gross SP, Welte MA, Block SM, Wieschaus EF (2002) Coordination of opposite-polaritymicrotubule motors. J Cell Biol 156:715–724.
7. Haghnia M, et al. (2007) Dynactin is required for coordinated bidirectional motility,but not for dynein membrane attachment. Mol Biol Cell 18:2081–2089.
8. McKenney RJ, Vershinin M, Kunwar A, Vallee RB, Gross SP (2010) LIS1 and NudE inducea persistent dynein force-producing state. Cell 141:304–314.
9. Wang X, Schwarz TL (2009) The mechanism of Ca2þ-dependent regulation of kinesin-mediated mitochondrial motility. Cell 136:163–174.
10. Shubeita GT, et al. (2008) Consequences of motor copy number on the intracellulartransport of kinesin-1-driven lipid droplets. Cell 135:1098–1107.
11. Ally S, Larson AG, Barlan K, Rice SE, Gelfand VI (2009) Opposite-polarity motorsactivate one another to trigger cargo transport in live cells. J Cell Biol 187:1071–1082.
12. Vershinin M, Carter BC, Razafsky DS, King SJ, Gross SP (2007) Multiple-motor basedtransport and its regulation by Tau. Proc Natl Acad Sci USA 104:87–92.
13. Mallik R, Petrov D, Lex SA, King SJ, Gross SP (2005) Building complexity: An in vitrostudy of cytoplasmic dynein with in vivo implications. Curr Biol 15:2075–2085.
14. Saxton WM (1994) Isolation and analysis of microtubule motor proteins. MethodsCell Biol 44:279–288.
15. Petrov DY, et al. (2007) Studying molecular motor-based cargo transport: What is realand what is noise? Biophys J 92:2953–2963.
16. Mallik R, Carter BC, Lex SA, King SJ, Gross SP (2004) Cytoplasmic dynein functions asa gear in response to load. Nature 427:649–652.
17. Kunwar A, Mogilner A (2010) Robust transport by multiple motors with nonlinearforce-velocity relations and stochastic load sharing. Phys Biol 7:16012.
18. Klumpp S, Lipowsky R (2005) Cooperative cargo transport by several molecularmotors.Proc Natl Acad Sci USA 102:17284–17289.
19. Jeney S, Stelzer EH, Grubmuller H, Florin EL (2004) Mechanical properties ofsingle motor molecules studied by three-dimensional thermal force probing in opticaltweezers. Chemphyschem 5:1150–1158.
20. Singh MP, Mallik R, Gross SP, Yu CC (2005) Monte Carlo modeling of single-moleculecytoplasmic dynein. Proc Natl Acad Sci USA 102:12059–12064.
Kunwar et al. www.pnas.org/cgi/doi/10.1073/pnas.1107841108 6 of 12
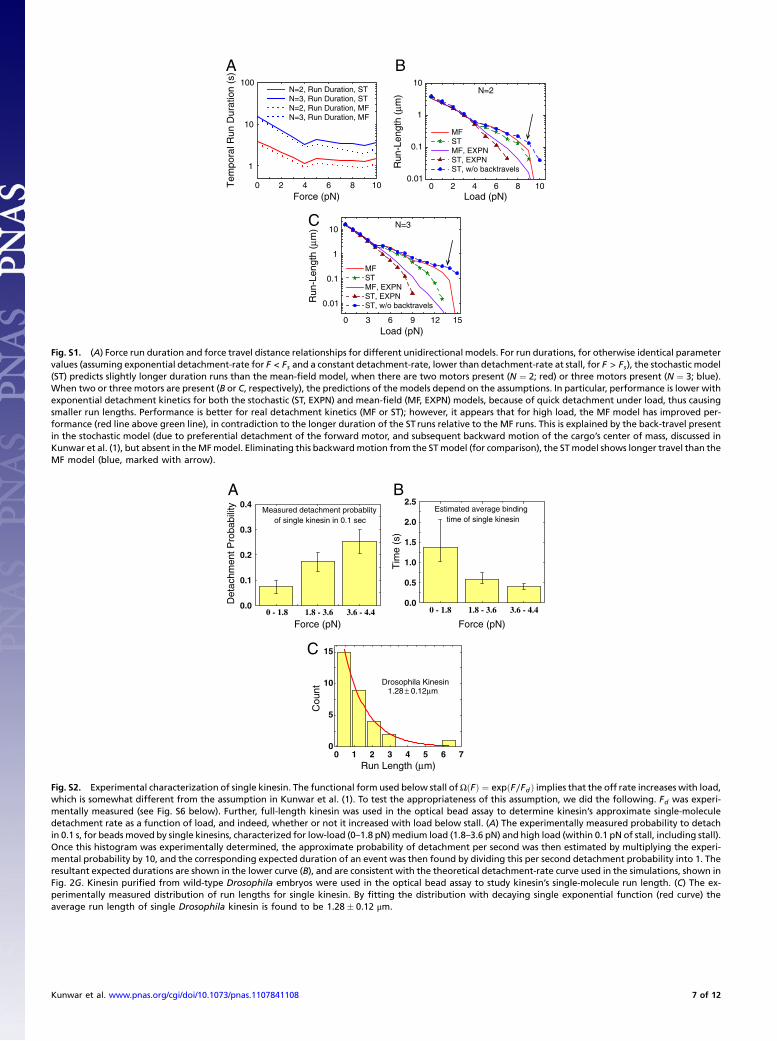
0 2 4 6 8 10
1
10
100
Tem
pora
l Run
Dur
atio
n (s
)
Force (pN)
N=2, Run Duration, STN=3, Run Duration, STN=2, Run Duration, MFN=3, Run Duration, MF
0 2 4 6 8 100.01
0.1
1
10N=2
Run
-Len
gth
(µm
)
Load (pN)
MF ST MF, EXPN ST, EXPN ST, w/o backtravels
0 3 6 9 12 15
0.01
0.1
1
10
Run
-Len
gth
(µm
)
Load (pN)
MF ST MF, EXPN ST, EXPN ST, w/o backtravels
N=3
A B
C
Fig. S1. (A) Force run duration and force travel distance relationships for different unidirectional models. For run durations, for otherwise identical parametervalues (assuming exponential detachment-rate for F < Fs and a constant detachment-rate, lower than detachment-rate at stall, for F > Fs), the stochastic model(ST) predicts slightly longer duration runs than the mean-field model, when there are two motors present (N ¼ 2; red) or three motors present (N ¼ 3; blue).When two or three motors are present (B or C, respectively), the predictions of the models depend on the assumptions. In particular, performance is lower withexponential detachment kinetics for both the stochastic (ST, EXPN) and mean-field (MF, EXPN) models, because of quick detachment under load, thus causingsmaller run lengths. Performance is better for real detachment kinetics (MF or ST); however, it appears that for high load, the MF model has improved per-formance (red line above green line), in contradiction to the longer duration of the ST runs relative to the MF runs. This is explained by the back-travel presentin the stochastic model (due to preferential detachment of the forward motor, and subsequent backward motion of the cargo’s center of mass, discussed inKunwar et al. (1), but absent in theMFmodel. Eliminating this backwardmotion from the STmodel (for comparison), the STmodel shows longer travel than theMF model (blue, marked with arrow).
0 - 1.8 1.8 - 3.6 3.6 - 4.40.0
0.1
0.2
0.3
0.4
Det
achm
ent P
roba
bilit
y
Force (pN)
Measured detachment probablity of single kinesin in 0.1 sec
0 - 1.8 1.8 - 3.6 3.6 - 4.40.0
0.5
1.0
1.5
2.0
2.5
Tim
e (s
)
Force (pN)
Estimated average binding time of single kinesin
A B
0 1 2 3 4 5 6 70
5
10
15
Cou
nt
Run Length (µm)
Drosophila Kinesin1.28 ± 0.12µm
C
Fig. S2. Experimental characterization of single kinesin. The functional form used below stall ofΩðFÞ ¼ expðF∕FdÞ implies that the off rate increases with load,which is somewhat different from the assumption in Kunwar et al. (1). To test the appropriateness of this assumption, we did the following. Fd was experi-mentally measured (see Fig. S6 below). Further, full-length kinesin was used in the optical bead assay to determine kinesin’s approximate single-moleculedetachment rate as a function of load, and indeed, whether or not it increased with load below stall. (A) The experimentally measured probability to detachin 0.1 s, for beads moved by single kinesins, characterized for low-load (0–1.8 pN) medium load (1.8–3.6 pN) and high load (within 0.1 pN of stall, including stall).Once this histogram was experimentally determined, the approximate probability of detachment per second was then estimated by multiplying the experi-mental probability by 10, and the corresponding expected duration of an event was then found by dividing this per second detachment probability into 1. Theresultant expected durations are shown in the lower curve (B), and are consistent with the theoretical detachment-rate curve used in the simulations, shown inFig. 2G. Kinesin purified from wild-type Drosophila embryos were used in the optical bead assay to study kinesin’s single-molecule run length. (C) The ex-perimentally measured distribution of run lengths for single kinesin. By fitting the distribution with decaying single exponential function (red curve) theaverage run length of single Drosophila kinesin is found to be 1.28 0.12 μm.
Kunwar et al. www.pnas.org/cgi/doi/10.1073/pnas.1107841108 7 of 12
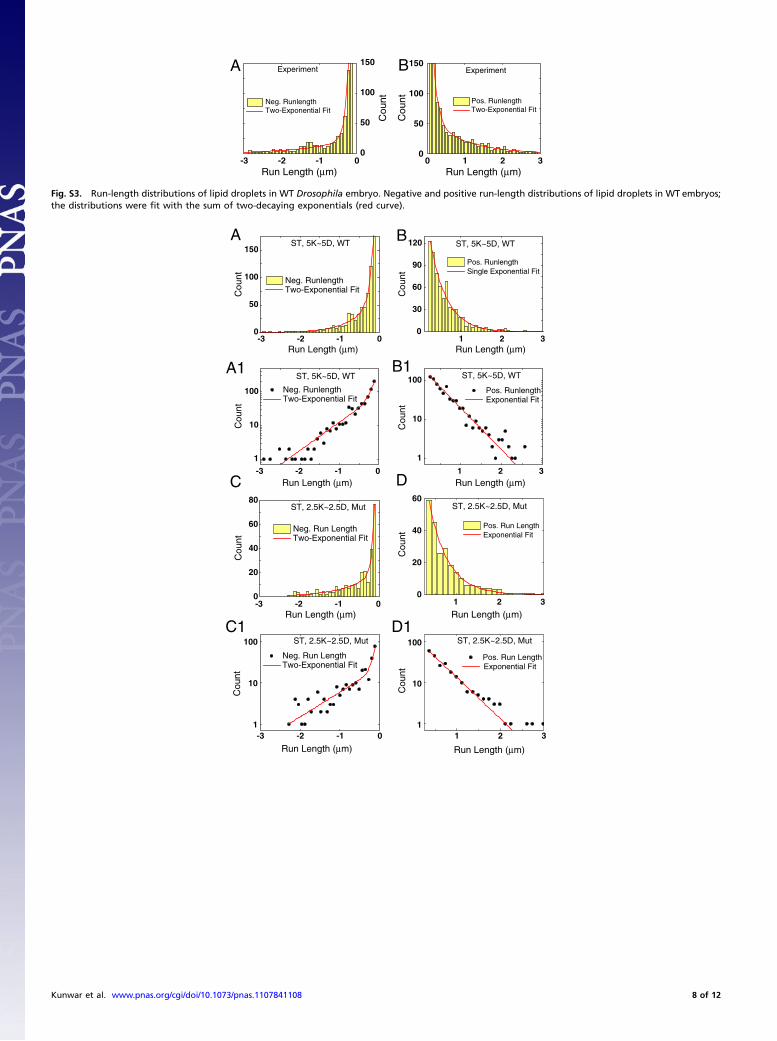
-3 -2 -1 00
50
100
150Experiment
Cou
nt
Run Length (µm)
Neg. Runlength Two-Exponential Fit
0 1 2 30
50
100
150Experiment
Cou
nt
Run Length (µm)
Pos. Runlength Two-Exponential Fit
A B
Fig. S3. Run-length distributions of lipid droplets in WT Drosophila embryo. Negative and positive run-length distributions of lipid droplets in WT embryos;the distributions were fit with the sum of two-decaying exponentials (red curve).
-3 -2 -1 00
50
100
150ST, 5K~5D, WT
Neg. Runlength Two-Exponential FitC
ount
Run Length (µm)1 2 3
0
30
60
90
120 ST, 5K~5D, WT
Pos. Runlength Single Exponential Fit
Cou
nt
Run Length (µm)
-3 -2 -1 0
1
10
100
ST, 5K~5D, WT
Neg. Runlength Two-Exponential Fit
Cou
nt
Run Length (µm)1 2 3
1
10
100 ST, 5K~5D, WT
Pos. Runlength Exponential Fit
Cou
nt
Run Length (µm)
-3 -2 -1 00
20
40
60
80ST, 2.5K~2.5D, Mut
Neg. Run Length Two-Exponential Fit
Cou
nt
Run Length (µm)1 2 3
0
20
40
60ST, 2.5K~2.5D, Mut
Run Length (µm)
Cou
nt
Pos. Run Length Exponential Fit
Exponential Fit
-3 -2 -1 01
10
100 ST, 2.5K~2.5D, Mut
Neg. Run Length Two-Exponential Fit
Cou
nt
Run Length (µm)1 2 3
1
10
100 ST, 2.5K~2.5D, Mut
Run Length (µm)
Cou
nt
Pos. Run Length
A B
A1 B1
C D
C1 D1
Kunwar et al. www.pnas.org/cgi/doi/10.1073/pnas.1107841108 8 of 12
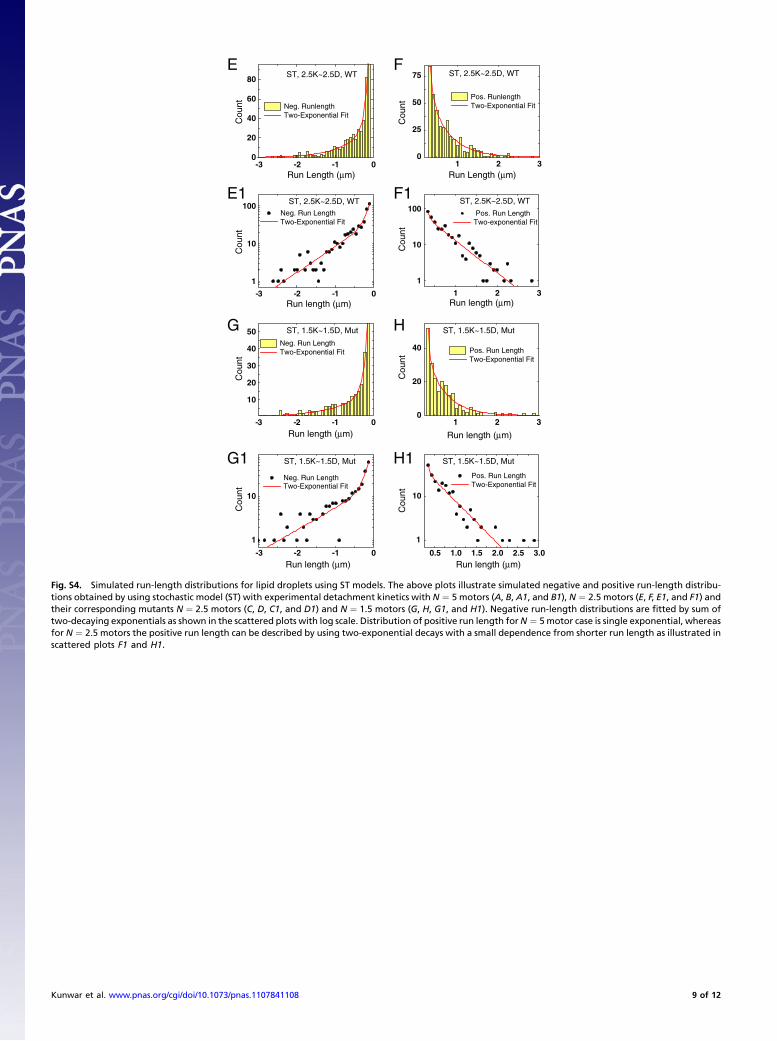
-3 -2 -1 00
20
40
60
80
Run Length (µm)
Cou
nt
ST, 2.5K~2.5D, WT
Neg. Runlength Two-Exponential Fit
1 2 30
25
50
75
Cou
nt
Run Length (µm)
ST, 2.5K~2.5D, WT
Pos. Runlength Two-Exponential Fit
-3 -2 -1 0
1
10
100 Neg. Run Length Two-Exponential Fit
Run length (µm)
Cou
nt
ST, 2.5K~2.5D, WT
1 2 3
1
10
100 Pos. Run Length Two-exponential Fit
Run length (µm)
Cou
nt
ST, 2.5K~2.5D, WT
-3 -2 -1 0
10
20
30
40
50 Neg. Run Length Two-Exponential Fit
Cou
nt
Run length (µm)
ST, 1.5K~1.5D, Mut
1 2 30
20
40 Pos. Run Length Two-Exponential Fit
Cou
nt
Run length (µm)
ST, 1.5K~1.5D, Mut
-3 -2 -1 0
1
10
Neg. Run Length Two-Exponential Fit
Cou
nt
Run length (µm)
ST, 1.5K~1.5D, Mut
0.5 1.0 1.5 2.0 2.5 3.0
1
10
Pos. Run Length Two-Exponential Fit
Cou
nt
Run length (µm)
ST, 1.5K~1.5D, Mut
E F
E1 F1
G H
G1 H1
Fig. S4. Simulated run-length distributions for lipid droplets using ST models. The above plots illustrate simulated negative and positive run-length distribu-tions obtained by using stochastic model (ST) with experimental detachment kinetics with N ¼ 5motors (A, B, A1, and B1), N ¼ 2.5motors (E, F, E1, and F1) andtheir corresponding mutants N ¼ 2.5 motors (C, D, C1, and D1) and N ¼ 1.5 motors (G, H, G1, and H1). Negative run-length distributions are fitted by sum oftwo-decaying exponentials as shown in the scattered plots with log scale. Distribution of positive run length forN ¼ 5motor case is single exponential, whereasfor N ¼ 2.5motors the positive run length can be described by using two-exponential decays with a small dependence from shorter run length as illustrated inscattered plots F1 and H1.
Kunwar et al. www.pnas.org/cgi/doi/10.1073/pnas.1107841108 9 of 12
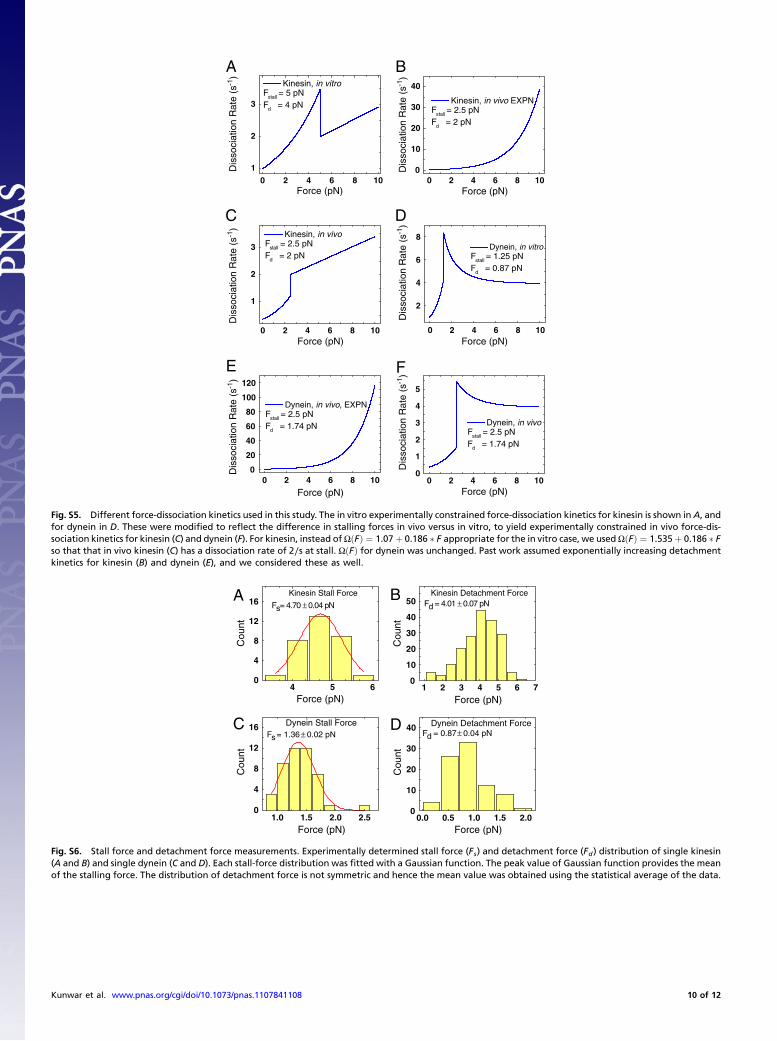
0 2 4 6 8 101
2
3
Dis
soci
atio
n R
ate
(s-1
)D
isso
ciat
ion
Rat
e (s
-1)
Dis
soci
atio
n R
ate
(s-1
)
Force (pN)
Kinesin, in vitro F
stall = 5 pN
Fd = 4 pN
0 2 4 6 8 100
10
20
30
40
Dis
soci
atio
n R
ate
(s-1
)D
isso
ciat
ion
Rat
e (s
-1)
Dis
soci
atio
n R
ate
(s-1
)
Force (pN)
Kinesin, in vivo EXPN F
stall = 2.5 pN
Fd = 2 pN
0 2 4 6 8 10
1
2
3
Kinesin, in vivo F
stall = 2.5 pN
Fd = 2 pN
Force (pN)0 2 4 6 8 10
2
4
6
8 Dynein, in vitro
Fstall
= 1.25 pNF
d = 0.87 pN
Force (pN)
0 2 4 6 8 100
20
40
60
80
100
120
Dynein, in vivo, EXPN F
stall = 2.5 pN
Fd = 1.74 pN
Force (pN)0 2 4 6 8 10
0
1
2
3
4
5
Dynein, in vivo F
stall = 2.5 pN
Fd = 1.74 pN
Force (pN)
A B
C D
E F
Fig. S5. Different force-dissociation kinetics used in this study. The in vitro experimentally constrained force-dissociation kinetics for kinesin is shown in A, andfor dynein in D. These were modified to reflect the difference in stalling forces in vivo versus in vitro, to yield experimentally constrained in vivo force-dis-sociation kinetics for kinesin (C) and dynein (F). For kinesin, instead ofΩðFÞ ¼ 1.07þ 0.186 F appropriate for the in vitro case, we usedΩðFÞ ¼ 1.535þ 0.186 Fso that that in vivo kinesin (C) has a dissociation rate of 2∕s at stall. ΩðFÞ for dynein was unchanged. Past work assumed exponentially increasing detachmentkinetics for kinesin (B) and dynein (E), and we considered these as well.
4 5 60
4
8
12
16
Cou
nt
Force (pN)
Kinesin Stall Force
Fs= 4.70 ± 0.04 pN
1 2 3 4 5 6 70
10
20
30
40
50Kinesin Detachment Force
Force (pN)
Cou
nt
Fd = 4.01 ± 0.07 pN
1.0 1.5 2.0 2.50
4
8
12
16
Cou
nt
Force (pN)
Dynein Stall ForceFs = 1.36 ± 0.02 pN
0.0 0.5 1.0 1.5 2.00
10
20
30
40
Cou
nt
Force (pN)
Dynein Detachment ForceFd = 0.87 ± 0.04 pN
A B
C D
Fig. S6. Stall force and detachment force measurements. Experimentally determined stall force (Fs) and detachment force (Fd ) distribution of single kinesin(A and B) and single dynein (C and D). Each stall-force distribution was fitted with a Gaussian function. The peak value of Gaussian function provides the meanof the stalling force. The distribution of detachment force is not symmetric and hence the mean value was obtained using the statistical average of the data.
Kunwar et al. www.pnas.org/cgi/doi/10.1073/pnas.1107841108 10 of 12
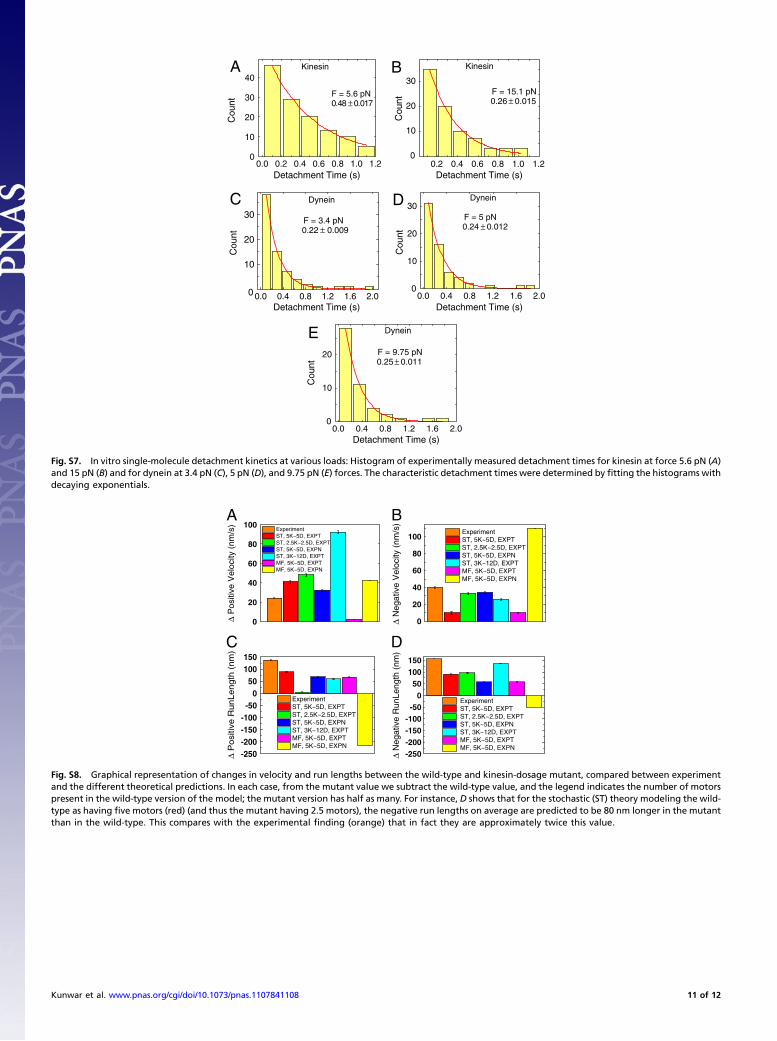
0.0 0.2 0.4 0.6 0.8 1.0 1.20
10
20
30
40
Cou
nt
Detachment Time (s)
F = 5.6 pN0.48 ± 0.017
Kinesin
0.2 0.4 0.6 0.8 1.0 1.20
10
20
30
Kinesin
Cou
nt
Detachment Time (s)
F = 15.1 pN0.26 ± 0.015
0.0 0.4 0.8 1.2 1.6 2.00
10
20
30
Dynein
F = 3.4 pN0.22 ± 0.009
Cou
nt
Detachment Time (s)0.0 0.4 0.8 1.2 1.6 2.0
0
10
20
30Dynein
Detachment Time (s)
F = 5 pN0.24 ± 0.012
Cou
nt
0.0 0.4 0.8 1.2 1.6 2.00
10
20
Dynein
Detachment Time (s)
F = 9.75 pN0.25 ± 0.011
Cou
nt
A B
C D
E
Fig. S7. In vitro single-molecule detachment kinetics at various loads: Histogram of experimentally measured detachment times for kinesin at force 5.6 pN (A)and 15 pN (B) and for dynein at 3.4 pN (C), 5 pN (D), and 9.75 pN (E) forces. The characteristic detachment times were determined by fitting the histograms withdecaying exponentials.
0
20
40
60
80
100
∆ P
ositi
ve V
eloc
ity (
nm/s
)
ExperimentST, 5K~5D, EXPTST, 2.5K~2.5D, EXPTST, 5K~5D, EXPNST, 3K~12D, EXPTMF, 5K~5D, EXPTMF, 5K~5D, EXPN
0
20
40
60
80
100
∆ N
egat
ive
Vel
ocity
(nm
/s)
ExperimentST, 5K~5D, EXPTST, 2.5K~2.5D, EXPTST, 5K~5D, EXPNST, 3K~12D, EXPTMF, 5K~5D, EXPTMF, 5K~5D, EXPN
-250-200-150-100-50
050
100150
∆ P
osi
tive R
unLength
(nm
)
ExperimentST, 5K~5D, EXPTST, 2.5K~2.5D, EXPTST, 5K~5D, EXPNST, 3K~12D, EXPTMF, 5K~5D, EXPTMF, 5K~5D, EXPN
-250-200-150-100
-500
50100150
∆ N
egat
ive
Run
Leng
th (
nm)
ExperimentST, 5K~5D, EXPTST, 2.5K~2.5D, EXPTST, 5K~5D, EXPNST, 3K~12D, EXPTMF, 5K~5D, EXPTMF, 5K~5D, EXPN
A B
C D
Fig. S8. Graphical representation of changes in velocity and run lengths between the wild-type and kinesin-dosage mutant, compared between experimentand the different theoretical predictions. In each case, from the mutant value we subtract the wild-type value, and the legend indicates the number of motorspresent in the wild-type version of the model; the mutant version has half as many. For instance, D shows that for the stochastic (ST) theory modeling the wild-type as having five motors (red) (and thus the mutant having 2.5 motors), the negative run lengths on average are predicted to be 80 nm longer in the mutantthan in the wild-type. This compares with the experimental finding (orange) that in fact they are approximately twice this value.
Kunwar et al. www.pnas.org/cgi/doi/10.1073/pnas.1107841108 11 of 12

A B
C D
0.0 0.5 1.0 1.5 2.0 2.5 3.0
Two-Kinesin, F = 10 pNExperiment: 0.841 ±0.021 s MF, EXPN Model: 0.141 s
Detachment Time (s)
Cou
nt (
Nor
mal
ized
) Experiment MF, EXPN
0.0 0.5 1.0 1.5 2.0 2.5 3.0
Two-Kinesin, F = 10 pNExperiment: 0.841 ±0.021 s MF, EXPT Model: 0.593 s
Detachment Time (s)
Cou
nt (
Nor
mal
ized
) Experiment MF, EXPT
0.0 0.5 1.0 1.5 2.0 2.5Detachment Time (s)
Cou
nt (
Nor
mal
ized
)
Two-Dynein, F = 10 pNExperiment: 0.525 ± 0.03 s MF, EXPN Model: 10-5 s
Experiment MF, EXPN
0.0 0.5 1.0 1.5 2.0 2.5Detachment Time (s)
Cou
nt (
Nor
mal
ized
)
Two-Dynein, F = 10 pNExperiment: 0.525 ± 0.03 s MF, EXPT Model: 0.4 s
Experiment MF, EXPT
Fig. S9. Comparison of experimental measurements and unidirectional mean-field model predictions for detachment kinetics of two kinesin or dynein motors(histogram representation of additional data summarized in Fig. 3 C and D). The experimental conditions are described in Fig. 3 caption (main text). Thedistribution of detachment times (experimental bars, red hash marks; A, B, C, and D) was compared to the mean-field model with either experimental detach-ment kinetics (EXPT) or exponential detachment kinetics (EXPN). The single-molecule properties below stall (including single-motor detachment kinetics asmeasured in Fig. 2) constrained the model parameters as well. Using these constraints, themean-field model with the EXPT detachment kinetics did not explainthe experimental results (C and D), and the mean-field model with exponential detachment kinetics (EXPN) was even worse (A and B).
Kunwar et al. www.pnas.org/cgi/doi/10.1073/pnas.1107841108 12 of 12


![arXiv:1904.04327v1 [cs.CE] 1 Apr 2019 eling](https://img.dokumen.tips/doc/110x75/61de12f5e870c639f31003d7/arxiv190404327v1-csce-1-apr-2019-eling.jpg)


