Embed Size (px)
Citation preview

Journal of Agricultural Technology 2012, Vol. 8(4): 1217-1228
1217
Mechanical properties of soybean pod as a function of moisture content and energy Mohsen Azadbakht, Mohammad Hadi Khoshtaghaza*, Barat Gobadian and Saeid Minaei
Department of Agricultural Machinery Mechanics, Faculty of Agriculture, Tarbiat Modares University, Tehran, Iran Mohsen Azadbakht, Mohammad Hadi Khoshtaghaza, Barat Gobadian and Saeid Minaei (2012) Mechanical properties of soybean pod as a function of moisture content and energy. Journal of Agricultural Technology 8(4): 1217-1228. In soybean combine harvesters, threshing is accomplished by two mechanical actions of impact and friction forces. In this research, the effects of initial moisture content and needed impact and friction energy on threshing of soybean pods were studied. The impact energy was measured by pendulum impact system. The experiments were conducted at three initial moisture content levels of 16, 25 and 35 % w.b. for both impact and friction tests. Three energy levels of 0.173, 0.284 and 0.446 J were used for impact test and three energy levels of 1.056, 1.291 and 1.526 J for friction test. The threshing percentage was measured in each test method. By using a frictional device, kinetic friction coefficients of soybean pods were measured as 0.59 (at 16% w.b.) and 0.8 (at 35 % w.b.). The results showed that moisture content and energy had significantly effects (p<0.01) on the threshing percentage. Maximum threshing percentage of impact and friction tests were 83 % and 81 %, which occurred at 16 % moisture content and 0.446 J and 1.526 J energy levels, respectively, also minimum threshing percentage of impact and friction methods were 3 % and 0.033 % which was occurred at 35 % moisture content and 0.173 J and 1.056 J energy, respectively. Key words: Soybean pod, Threshing, Impact, Friction, Energy, Initial moisture content. Introduction
Usually soybean is harvested in the cold season with high air relative humidity and possibility of rainfall. In this condition, the moisture content of soybean pod is high, so grain combine harvester can`t thresh and separate the bean from it`s pod properly. Since the farmers should harvest and sell soybean on time and also they have to prepare land for the next cultivation, having a pre-threshing dryer unit which can reduce some moisture content of soybean pod in field, for proper working of combine is necessary. Determination of
* Corresponding author: Mohammad Hadi Khoshtaghaza; e-mail: [email protected]
Journal of Agricultural Technology 2012 Vol. 8(4): 1217-1228 Available online http://www.ijat-aatsea.com
ISSN 1686-9141

1218
mechanical properties of soybean pod is needed for desighning and fabrication of pre-threshing dryer on combine harvester. Also, mechanical properties are important parameters to design threshing equipment and to analyze, optimize, and control of the seed damage during the threshing, storage, transport and commercialization of grain. The design and control of equipment are difficult due to the lack of information on the behavior of the mechanical and physical properties with high moisture content and early harvesting. Equipment size is usually overestimated to compensate for this lack of information, leading to a non-ideal design with cost implications as well as inferior quality of the product. These behaviors of the mechanical can only be put in practice by the precise knowledge of the mechanical and physical properties of the grain with high moisture content and early harvesting. These works are realized to foresee of mechanical properties of the soybean pod with high moisture content.
There are numerous methods to measure the mechanical properties proposed in the specialized literatures. De Simone et al. (2000), Mesquita and Hanna (1993) and Hoag (1972) in their research, the relation between moisture and energy for threshing of beans and soybeans are found by impact and friction methods, two belt system, ballistic pendulum, respectively. Skromme (1977) reported higher capacity and lower damage to kernels with a twin-rotor system than with a conventional transverse threshing cylinder. The power requirement of the twin-rotor system is expected to be similar to that of the conventional cylinder and concave due to the higher rotational speed, greater length, and smaller diameter of the twin-rotor system. Brandenburg and Park (1982) made a two belt system for threshing operation between two parallel belt with beneath surfaces. Result of their experiment was less losses and more clean seeds. Similar experiments with two belt system and vertical belts were done on threshing grains and vegetables. The amounts of threshing increased by increasing of width and velocity of belts and reduce of distance between them.
In grain combine harvesters, threshing mechanism of soybean is mainly accomplished by mechanical action of impact force. Threshing performance is related to moisture content. So the main objective of this study was to find the relation of primitive moisture content and energy consumption on soybean pod threshing by two mechanical actions of impact and friction forces. Materials and methods Sample preparation
Soybean pod samples were selected from the experimental farm in Gorgan, Iran. Samples were stored in a refrigerator at 3°C prior to the drying experiments. Three 50 g samples were dried in an oven at 103ºC for 17 h to

Journal of Agricultural Technology 2012, Vol. 8(4): 1217-1228
1219
determine initial moisture content. During harvesting of soybean with combine, its moisture content usually is around 15 to 25% (w.b.), which after rain it is about 35% . Therefore, soybean sample moisture contents were selected at the range of 15, 25 and 35% (w.b.). Impact test
For impact test, pendulum system was built as seen in Fig. 1. The distance between two beams (7) is 21.5 cm which is equal to the length of pivot axle (5). The length of pendulum arm (4) (height of pendulum axle to the center of the weight (68.5 g) (2) is 32 cm. There is a gap in sample support (3) that held the pods vertically. Calibration plate (9) was calibrated from 0 to 90°. By this plate and a Canon VHS camera (50 frame.s-1), angle of impact and return was measured.
Fig. 1. Pendulum impact system.
1. Sample 2. Weight 3. Sample support 4. Pendulum arm 5. Pivot axle 6. Bearing 7. Beam 8. Camera 9. Calibration plate
To create different levels of energy, three weights (11.08, 34.13, and 77.6 g) were used. These weights were selected in try and error method which pods break in the minimum amount, and the beans not damaged in the maximum amount. According to the Fig. 2, the amount of work between place 1 and 2 is equal to the sum of change of kinetic and potential energy (Vahedian, 2004).
∆ = ∆(푇 + 푉 ) (1)

1220
After impact, the situation of pendulum in return angle will be in place (2). Kinetic energy in place 1 and 2 is zero, so the amount of work after impact is:
∆ = ∆휐 = 푀푔[ℎ − ℎ ] = 푀푔[ℎ − (ℎ − ℎ )] = 푀푔ℎ (2) where, h1= length of pendulum arm(R) = 32 cm, 훼 = 90, ℎ = 푅푐표푠훼 , ℎ = ℎ − ℎ . According to the Eq. (2), three energy levels of 0.173, 0.284 and 0.446 J were measured. To do the experiment, first 50 g of each soybean pod sample in different moisture content levels were weighed and held vertically in the support place to release the pendulum. Pod samples which their beans were separated by impact, weighed and divided to the initial weight to calculate the threshing percentage. This process was repeated three times for all the moisture levels and the data were analyzed by using of completely randomized design (CRD) and SAS software.
Fig. 2. Impact and return angle.
Friction test
Friction device was used in this experiment (Fig. 3).

Journal of Agricultural Technology 2012, Vol. 8(4): 1217-1228
1221
Fig. 3. Friction device.
(1.Weight 2.Pulley 3.Desk 4.Lower wooden plate 5.Upper wooden plate 6.pod 7.Support 8.Base of pully 9.Extera weight)
The weight (1), that is connected to the upper wooden plate (5) by a string
with a negligible friction, release down. By this action, the upper wooden plate (5) starts to move. The wooden plates (4 and 5) used in this test has equal dimension 42×12 cm and one of the surface was jagged by saw. The space between each jag surface was considered 1 cm (approximately equal to pod width). On the upper wooden plate a 100 g weight was loaded. This amount was measured during several examinations so that in the static status pods don’t fail. Between these surfaces two full pods with 16, 25, 35 percents moisture level were putted and kinetic coefficient of friction was calculated with the Eq. 5.
According to the Fig. 4 by moving weight (1), Eq. 3 can be used, and according to Fig. 5 by moving plate (5) and the loaded of extra weight (9), Eq. 4 can be used.
1222
Fig. 4. Weight motion.
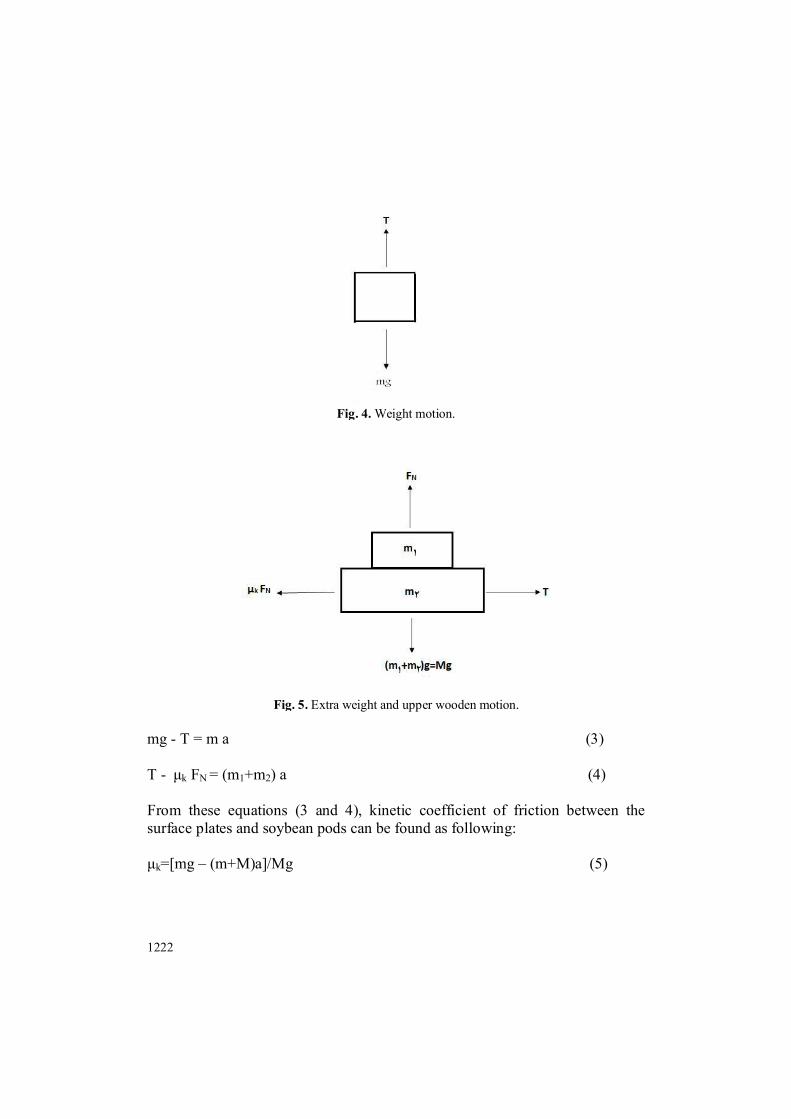
Fig. 5. Extra weight and upper wooden motion.
mg - T = m a (3) T - μk FN = (m1+m2) a (4) From these equations (3 and 4), kinetic coefficient of friction between the surface plates and soybean pods can be found as following: μk=[mg – (m+M)a]/Mg (5)

Journal of Agricultural Technology 2012, Vol. 8(4): 1217-1228
1223
where, m2= Extra weight mass (g), m1= Upper wooden plate mass (g), M= m1+ m2 , μk =kinetic coefficient of friction, a= Acceleration of the system (m.s-2), g= 9.8 (m.s-2), m= Weight mass (1). The acceleration of the system was calculated from Eq. 6: x= ½ at2 (6) where, t= Time (s), a= Acceleration (m.s-2) Finally, kinetic coefficient of frictions was obtained 0.59, 0.67 and 0.8 for 16, 25 and 35% moisture content of spybean pods, respectively. By the amount of kinetic coefficient of friction and base on work and energy, from Eq. 7 energy levels of 1.056, 1.291 and 1.526 J were calculated.
U=μK N x (7) where, U= energy, N= equal mass of M and x= distance moving. In the experiment, two pods were placed between both wooden corrugated plates and the above energy was applied to separate the soybean pods by friction force. Weight of seperated pods were divided to the initial weight to calculate the percent of threshing due to friction. Completely randomized design (CRD) was used to analyze the data by SAS software.
Results and discussions
The results of ANOVA of soybeanthreshing percentage under different energy and primary moisture content for impact and friction test are shown in Tables 1 and 2, respectively. Effects of energy and moisture on percent of threshing were significantly at probability level of 1 %.
Table 1. Variance analysis of threshing soybean pods under different energy and primary moisture contents (impact test).
Source of variation Degrees of freedom
Sum of squares Mean square F
Moisture (Mc) 2 0.721 0.36 ** 583.85 Energy (J) 2 0.721 0.363 ** 587.56 J ×Mc 4 0.01 0.002 * 4.07 Error 18 0.011 0.0006
** * Significant in statistic level of 1 and 5 %.
1224
Table 2. Variance analysis of threshing soybean pod under different energy and primary moisture contents (friction test)
Source of variation
Degrees of freedom
Sum of squares Mean square F
Moisture (Mc) 2 0.856 0.428 ** 1130.93 Energy (J) 2 0.502 0.251 ** 663.87 J ×Mc 4 0.017 0.004 ** 11.6 Error 18 0.006 0.0003
**Significant statistical level of 1%. Result also showed that interaction effect of moisture and energy on
threshing at probability levels of 5 and 1 % were significantly for impact and friction tests, respectively. Compare of mean (LSD method)was used to compare means of energy levels in each moisture level and compare means of different moisture levels for each energy level which and the resuls were shown in Tables 3 and 4. Table 3. Energy and moisture content compare of mean on the percent of soybean pod threshing (impact test)
Energy (J) Moisture (w.b.%) 16 25 35 0.173 0.402 Ca Cb 0.149 Bc 0.033 0.284 Ba 0.671 Bb 0.363 Ab 0.317 0.446 Aa 0.834 Ab 0.539 Ac 0.400
* Same capital letters in each column and same small letters in each raw show not significant different (LSD 1%). Table 4. Energy and moisture content compare of mean on the percent of soybean pod threshing (friction test)
Energy (J) Moisture (w.b.%) 16 25 35 1.056 0.396 Ca Cb 0.140 Cc 0.033 1.291 Ba 0.541 Bb 0.216 Bc 0.144 1.526 Aa 0.810 Ab 0.420 Ac 0.324
* Same capital letters in each column and same small letters in each raw show not significant different (LSD 1%).
The moisture contents of 16 % and 25% were significantly different in threshing at different energy and moisture content levels. As seen in Table 3, the amount of threshing increased by increasing the energy level. Also it was

Journal of Agricultural Technology 2012, Vol. 8(4): 1217-1228
1225
observed that maximum and minimum threshing was 83.4% at 16 % moisture content and 0.446 J energy. Minimum thresh was 3.3% at 35 % moisture content and 0.173 J energy. Soybean pods with higher moisture, contacted between its edges of the pods were stronger than lower moisture, so more energy was needed to separate two edges at 35 % moisture content. Hoag (1972) reported, in an experiment by ballistic pendulum, by reducing the moisture content of soybean pods, the amount of breaking energy reduced. Soybean pod with moisture content between 10 to 15% needed energy for threshing was 0.013 to 0.018 J.
There was no significant difference between 0.284 and 0.446 J energy levels (Table 3). It means that if moisture of pod is very high, increase in energy consume does not have any effect on the amount of threshing. At energy levels of 0.173 and 0.446 J, there was significant difference between different moisture levels and in both energy levels by increasing in moisture, threshing reduced. At energy level of 0.284 J, there was no significant difference in threshing between moisture levels of 25 and 35%.
There was significantly difference between threshing at different energy levels and each moisture content levels (Table 4). The result showed that percentage of threshing increased by increasing friction energy. It was also observed that maximum threshing was 81% at 16 % moisture and 1.526 Jand minimum threshing was 0.033% at 35% moisture and 1.056 J. Mesquita and Hanna (1993) found that by two belt system, soybean pod with 10% moisture content had good threshing action and 93% of the beans got out of the pods, however at 16 and 21% moisture, threshing action reduce to 90 and 79%. They reported that 0.12 J energy needed for threshing soybean pod.
The effects of different energy on threshing of pods at different initial moisture content in impact and friction tests are shown in Figures 6 and 7, respectively. By increasing energy and decreasing moisture content, threshing increased in all of the three moisture content levels.

1226
Fig. 6. Effects of energy on threshing soybean pod at different moisture in impact test.
Fig. 7. Effects of energy on threshing of soybean pod at different moisture in friction test
The results of this research are in agreement with the findings of the other
research workers. De Simone et al. (2000) reported that the relation between moisture and energy for threshing of beans was found by impact and friction methods. They reported that in both methods probability of breaking the pods vary with moisture, and breaking them with high moisture is more difficult. Tne result of impact test on bean pods showed that dry pods needed less energy than wet pod to break. Pods with 13.3 and 15.3% moisture content broke completely and beans got out of the pods. But pods with 17.3% moisture, cracked slowly and with 18.4% moisture never broke. In impact method needed energy for threshing, was reported between 0.09 to 0.015 J and in friction method it was between 0.21 to 0.48 J. In friction experiment, they realized that pods with 13.3% moisture completely opened and beans got out of the pods, in 17.3% moisture, beans were still in the pods (pods just open) and in 18.4% moisture,
Journal of Agricultural Technology 2012, Vol. 8(4): 1217-1228
1227
beans never got out of the pods. In friction tests, they found that friction coefficient between pods increased by increasing of moisture content. Conclusion
It is concluded that the needed energy for soybean pod threshing with two tests was increased when its moisture content increased in impact and friction force. By increasing impact and friction energy, the amount of pod threshing increased. At all the energy levels, maximum threshing was occured at minimum moisture content. Statistical analysis with impact energy showed that the maximum threshing was at 16 % moisture content and 0.446 J energy level, which was 83.4 %, and the minimum threshing was 3.3 % at 35 % moisture content and 0.173 J energy level. Statistical analysis with friction energy showed that maximum threshing was at 16 % moisture content and 1.526 J energy level which was 81 % and the minimum threshing was 0.033 % at 35% moisture content and 1.056 J energy level. The coefficient of friction between the pods increased according to their moisture content. Low levels of energy are required for the threshing of pods by impact test, while higher levels of energy are required for the threshing of pods done by friction test.
Acknowledgment
The authors are thankful to Dr. Esmaeilzadeh for his guidance during the experiment and Dr. Rezaei Asl, for his helps and suggestions during preparation of this manuscript. References Alemi, H., Khoshtaghaza, M.H. and Minaee, S. (2009). Mechanical properties determination of
Soybean seed by quasi-static loading. JFST. 6(2): (in Farsi). Berlage, A.G., D.M. Bisland and P.M. Holman (1986). Belt thresher with adjustable threshing
action. Transactions of the ASAE29CiyAn'A\5. Brandenburg, N.R. and J.K. Park (1982). Experimental seed combine. Transactions of the
ASAE 25(3): 598-602, 606. De Simone, M.E., Gracia lopez, C. and Filgueira, R.R. (2000). Mechanical threshing dry beans
pods. ASAE Meeting Presentation. No: 006066. Mesquita, C.M. and Hanna, M.A. (1993). Soybean threshing mechanics: І. Frictional rubbing
by flat belt. Trans of the ASAE. 36(2): 275-279. Hoag, D.L. (1972). Properties related to soybean shatter. Trans of the ASAE. 15(3): 494–497. Shelton, D.P., K. Von Bargen and A.S. Al-Jiburi (1979). Nebraska on-farm fuel use survey.
Agricultural Engineering 60(8):38-39. Sirisomboon, P., Pornchaloempong, P. and Romphophak, T. (2007). Physical properties of
green soybean: Criteria for sorting. Journal of Food Engineering 79: 18-22.

1228
Skromme, L.H. (1977). Progress report on twin rotor combine concept of rotary threshing and separation. In Proceedings of the First International Grain and Forage Harvesting Conference, 188-191, 195. St. Joseph, MI: ASAE.
Spokas, L., Steponavicius, D. and Petkevicius, S. (2008). Impact of technological parameters of threshing apparatus on grain damage. Agronomy Research 6: 367–376.
Ukatu, A.C. (2006). A modified threshing unit for soya beans. Biosystems Engineering 95: 371-377.
Vahedian, E. (2004). Vector Mechanics for engineers statics and dynamics. Vol.2 dynamics.Third Edi. Nashre Oloom Tehran (in Farsi).
(Published in July 2012)