Embed Size (px)
Citation preview

MECHANICAL PROPERTIES OF SOFT CLAY STABILIZED WITH
CEMENT-RICE HUSKS (RH)
MARDIHA BINTI MOKHTAR
A thesis submitted in fulfillment
of the requirement for the award of the
Degree of Master of Engineering (Civil-Geotechnics)
Faculty of Civil and Environmental Engineering
Universiti Tun Hussein Onn Malaysia
SEPTEMBER 2011

v
ABSTRACT
Chemical stabilization has been extensively used for the improvement of soft
clay soils, in enhancing the shear strength and limiting the deformation behaviours.
Cement is widely used as a stabilizing material for soils, but the increasing price is
causing economic concerns among practitioners and clients alike. The quest for
alternative cheaper stabilizing agents is therefore more urgent than before. Rice husk is a
major agricultural waste in Malaysia and the common disposal method of open burning
has notoriously contributed to environmental pollution. The possibility of admixing rice
husks with cement for stabilizing soft soils could be a solution to both problems. This
study was aimed at assessing the usefulness of cement-rice husks as an effective soil
stabilizer for improving the mechanical properties of clay soils. Laboratory experiments
were carried out on a stabilized soft clay to study the inter-relationships between shear
wave velocity, one-dimensional compressibility and unconfined compressive strength.
Bulk clay samples were collected from the Research Centre for Soft Soils (RECESS) of
UTHM. The stabilized specimens were prepared with the clay admixed with 5 % and 10
% cement and various quantities of rice husks, then compacted into cylindrical
specimens measuring 38 mm in diameter and 76 mm high. The specimens were then left
to cure for different periods up to a month. The stabilized specimens were observed to
undergo increase in stiffness and strength, as well as significant reduction in
compressibility, highlighting the great potential of cement-rice husk as an alternative
soft soil stabilizer.
Keywords: Clay soil stabilization, cement, rice husk, shear wave velocity, one-
dimensional compressibility, unconfined compressive strength

vi
ABSTRAK
Penstabilan secara kimia telah digunakan secara meluas dalam penstabilan tanah, untuk
menaikkan nilai kekuatan ricih tanah dan menghadkan ciri-ciri pemendapan tanah.
Simen telah lama digunakan sebagai bahan penstabil tanah, tetapi kenaikan harganya
merisaukan ekonomi pengguna yang terbabit. Oleh itu, permintaan terhadap agen
penstabil yang lebih murah sangatlah diutamakan. Sekam padi merupakan antara bahan
buangan utama daripada sektor pertanian di Malaysia dan kaedah pelupusannya iaitu
secara pembakaran terbuka telah menyumbang kepada berlakunya pencemaran udara.
Kecenderungan untuk mencampurkan sekam padi dengan simen dalam penstabilan
tanah lembut mungkin merupakan jalan penyelesaian terhadap kedua-dua masalah
tersebut. Matlamat kajian ini adalah untuk mengkaji kegunaan simen-sekam padi
sebagai bahan penstabil tanah yang berkesan dalam memperbaiki ciri-ciri mekanikal
tanah liat. Ujikaji-ujikaji makmal dijalankan terhadap tanah liat terstabil untuk mengkaji
hubungan antara halaju gelombang ricih, pemampatan satu dimensi dan kekuatan
mampatan tak terkurung. Sampel tanah liat diambil dari Pusat Penyelidikan Tanah
Lembut (RECESS), UTHM. Spesimen yang terstabil disediakan dengan mencampurkan
tanah liat dengan 5 % dan 10 % simen dan pelbagai kuantiti sekam padi. Kemudiannya,
dimampatkan menjadi spesimen silinder berukuran 38 mm dan ketinggian 76 mm.
Spesimen-spesimen tersebut kemudiannya diawet pada tempoh berlainan sehingga
sebulan. Spesimen-spesimen tersebut dipantau bagi memastikan terdapatnya kenaikan
nilai-nilai kekukuhan dan kekuatannya, serta penurunan mendapan yang efektif, yang
menunjukkan terdapatnya potensi untuk simen-sekam padi sebagai bahan penstabil
alternatif untuk tanah liat.
Kata kunci: penstabilan tanah liat, simen, sekam padi, halaju gelombang ricih,
pemampatan satu dimensi dan kekuatan mampatan tak terkurung.

vii
CONTENTS
TITLE i
DECLARATION ii
DEDICATION iii
ACKNOWLEDGEMENTS iv
ABSTRACT v
ABSTRAK vii
CONTENTS vii
LIST OF TABLES xi
LIST OF FIGURES xiii
LIST OF SYMBOLS xvi
LIST OF APPENDICES xx
CHAPTER 1 INTRODUCTION1.1 Research Background 1
1.2 Problem Statement 4
1.3 Research Objectives 5
1.4 Scope of Research 5
1.5 Important of Study 6
1.6 Structure of Thesis 6

viii
CHAPTER II LITERATURE REVIEW 7
2.1 Soft Soil 7
2.2 Soft Soil Stabilization with Deep Mixing 8
2.2.1 The Mixing Process 8
2.3 Stabilizing Agent 10
2.3.1 Ordinary Portland Cement 10
2.3.2 Rice Husk 12
2.3.2.1 Properties and Pozzolanic Effect of RiceHusk
13
2.4 Measurement of Stiffness using Seismic Method 14
2.5 Measurement of vs for Stabilized Soil 15
2.6 Bender Element (BE) Test 16
2.6.1 BE Test in Geotechnical Testing 17
2.6.2 Determination of Shear Wave Travel Time 18
2.6.3 Methods for Determining Travel Time 20
2.6.4 Near Field Effect 21
2.6.5 Bender Element (BE) Test in Stabilized Soils 21
2.7 Unconfined Compressive Strength (UCS) 22
2.7.1 UCS Test in Stabilized Soil 23
2.8 Correlation between Shear Wave Velocity and UCS Test 24
2.9 Compressibility Studies 25
2.9.1 Compressibility Behaviour on Stabilized Soil 26
CHAPTER III MATERIALS AND METHODOLOGY 48
3.1 Introduction 48
3.2 Preparation of Raw Materials 49
3.2.1 Clay Soil 49
3.2.2 Ordinary Portland Cement (OPC) 49

ix
3.2.3 Rice Husk (RH) 50
3.2.4 Calculation for the Quantities of Cement and RH 51
3.3 X-ray Fluorescence (XRF) Analysis 52
3.4 Unconfined Tests 53
3.4.1 Specimen Preparation 53
3.4.2 Bender Element (BE) Tests 54
3.4.2.1 Effects of Stacking and Trigger Types on vs 55
3.4.3 Unconfined Compressive Strength (UCS) Test 55
3.5 One-dimensional Compressibility (Oedometer) Test 56
3.5.1 Preparation of Specimens 56
3.5.2 Oedometer Tests 57
CHAPTER IV RESULTS: ANALYSIS AND DISCUSSIONS 73
4.1 Introduction 73
4.2 Physical Properties for Stabilized Specimens 73
4.3 Unconfined Tests 75
4.3.1 Shear Wave Velocity 75
4.3.1.1 Effect of RH Size Fractions on vs 76
4.3.2 Unconfined Compressive Strength (UCS) 77
4.3.2.1 Stress-strain Behaviour 77
4.3.2.2 Deformation Modulus 78
4.3.2.3 4.3.2.3 Relationship between Eo – Go 79
4.3.3 Factors Governing the Improved Properties 80
4.3.3.1 Cement and RH Content Effect 80
4.3.3.2 Curing Period Effect 81
4.3.4 Correlation between qu, vs and Go 82
4.4 One-dimensional Compressibility Tests 83
4.4.1 Nominal ‘zero’ of Vertical Stress 83
4.4.2 Effective Yield Stress for Stabilized Specimens 84
4.4.3 Compressibility of the Stabilized Specimens 85

x
4.4.4 Consolidation Behaviour 85
4.4.4.1 Coefficient of Consolidation (cv) 86
4.4.4.2 Coefficient of Volume Compressibility (mv) 87
CHAPTER V CONCLUSIONS AND RECOMMENDATIONS 110
5.1 Introduction 110
5.2 Findings 110
5.3 Recommendations 112
REFERENCES 114
APPENDIX 123

LIST OF TABLES
2.1 World production rate for rice paddy and rice husk (million
metrictons) by Mehta (1992)
27
2.2 Micro analysis of the external surface of the rice husk
(Jauberthie, et al., 2000)
27
2.3 Micro analysis of the interior of the rice husk (Jauberthie, et
al., 2000)
28
2.4 Micro analysis of the internal surface of the rice husk
(Jauberthie, et al., 2000)
28
2.5 The seismic methods employed in determination of
stiffness-depth profiles
29
2.6 Shear strength of clays (Head, 1982) 30
2.7 Preconsolidation pressures and curing times of the
oedometer specimens (Feng et al., 2001)
31
3.1 Properties of clay soil 57
3.2 Chemical compositions for clay, cement and rice husk 58
3.3 Bender element test specimens 59
3.4 Specimens for unconfined compressive strength and
oedometer tests
59
3.5 Sequence of stress application for the oedometer test 60
4.1 The differences of travel time (t) determined by first major 88

xii
peak-to-peak (p-p) and trough-to-trough (t-t)
4.2 The differences shear wave velocities (vs) between the
travel time determined by first major peak-to-peak (p-p) and
trough-to-trough (t-t)
89
4.3 The difference of maximum shear modulus (Go) derived
from vp-p and vt-t
90
4.4 The Eo(experimental) and Eo(theoretical) results 91
4.5 The oedometer test results (settlement) for 7-day specimens
cured
91
4.6 cv values for stabilized specimen and unstabilized clay (7
days)
92
4.7 mv values for stabilized specimen and unstabilized clay (7days)
92

LIST OF FIGURES
2.1 Soil map of Batu Pahat, Johor (adapted from the Soil Map of
Malaya, 1962)
32
2.2 Stabilized columns mechanically interact with the unstabilized
soil
33
2.3 The mixing process in dry deep mixing (Larsson, 2003) 34
2.4 P-wave and S-wave (GDS, 2005) 34
2.5 The influence of compaction moisture content (w) on the
dynamic response of stabilized specimens (Hoyos et al., 2004)
35
2.6 The Go values evaluated with the bender elements against those
from the cyclic triaxial tests (Sahaphol and Miura, 2005).
35
2.7 Variations of shear wave velocity with penetration positions (a)
varying the penetration rate, (b) varying the sample size, (c)
varying the consolidation pressure (Chan et al., 2010)
36
2.8 An example of the received trace when square wave is used
(Jovičić et al., 1996)
37
2.9 The comparison of the travel times from the different methods
associated with three different values of effective consolidation
pressures (Kumar and Madhusudhan, 2010)
38
2.10 The methods for determining travel time (a) first time of arrival
(to) and first peak to peak time (tpp), (b) cross-correlation
method (Kumar and Madhusudhan, 2010)
39
2.11 An initial downward deflection of a trace, corresponding to low
values of Rd, before the actual arrival of the shear wave
40

xiv
(Sanches-Salinero et al., 1986)
2.12 Procedure of bender element test at construction site (Asaka
and Abe, 2009)
40
2.13 Principle of unconfined compressive strength test 41
2.14 The relationship between the unconfined compressive strength
and fiber content after curing for 28 days (Tang et al., 2006)
41
2.15 The relationship between normalized strength at 28 days with
the normalized strengths at other time intervals (Tan et al.,
2002)
42
2.16 Influence of curing temperature on qu (Kitazume and
Nishimura, 2009)
42
2.17 Empirical correlations between qu and vs for lime-cement
stabilized expansive clays (a) Site1 (b) Site 2 (Madhyannapu et
al., 2010)
43
2.18 Comparison of predicted and calculated strengths for quality
assessment (Madhyannapu et al., 2010)
44
2.19 The variation in shear wave velocity, evaluated from bender
element and the resonant column free-free tests (RCff), with the
strengths from UCS tests (Åhnberg and Holmén, 2009)
44
2.20 The relationship between qu and vs compared to other
investigations (Åhnberg and Holmén, 2009)
45
2.21 The time-compression diagram 45
2.22 The compression curves of mud-cement specimens (Feng et al.,
2001)
46
2.23 Consolidation curves for unstabilized and 1 % lime stabilized
soils (Sakr and Shahin, 2009)
46

xv
2.24 Effect of curing time on preconsolidation pressure or yield
stress at 1 % lime (Sakr and Shahin, 2009)
47
3.1(a) Methodology flow chart (physical tests) 61
3.1(b) Methodology flow chart (mechanical tests) 62
3.2 Clay soil 63
3.3 Clay samples retrieve at RECESS using motorized auger 63
3.4 Particle size distribution of clay soil 64
3.5 Ordinary portland cement 64
3.6 Rice husk ( > 425 m) 65
3.7 Rice husk (< 425 m) 65
3.8 Particle size distribution of RH 66
3.9 Physical quantities of various percentages of cement and RH 67
3.10 The compaction mould and tools for the preparation of
unconfined specimens
68
3.11 GDS Bender Element Test Systems 69
3.12 The S-wave travel time determined using the first major peak-
to-peak (p-p) and trough-to-trough (t-t) methods
69
3.13 The wizard screen of time domain stacking and trigger type 70
3.14 Manual acceptance with manual trigger 70
3.15 Automatic stacking with manual trigger 71
3.16 Automatic stacking with software trigger 71
3.17 Unconfined compression test machine (Geocomp LoadTrac II) 72

xvi
4.1 The cement and rice husk content effect on the water content 93
4.2 Bulk density - curing time 93
4.3 Relationship between vs determined from p-p and t-t 94
4.4 Example of good signal 94
4.5 Example of bad signal 95
4.6 vs for specimens stabilized with RH only for 3 days 95
4.7 vs for specimens stabilized with RH only for 7 days 96
4.8 vs for specimens stabilized with RH only for 14 days 96
4.9 vs for specimens stabilized with RH only for 28 days 97
4.10 vs for specimens stabilized with 5 % cement admixed with RH
for 3 days
97
4.11 vs for specimens stabilized with 5 % cement admixed with RH
for 7 days
98
4.12 vs for specimens stabilized with 5 % cement admixed with RH
for 14 days
98
4.13 vs for specimens stabilized with 5 % cement admixed with RH
for 28 days
99
4.14 The stress-strain curves obtained from UCS tests for cemented
clay after curing for 28 days
99
4.15 The stress-strain curves obtained from UCS tests for for RH
admixed with cemented clay after curing for 28 days
100
4.16 The deviation of Ep, E50 and Eo from stress-strain curve 100
4.17 Relationship of E – qu 101

xvii
4.18 The correlation between Eo(theoretical) and Eo(experimental) 101
4.19 The effect of cement and RH contents on qu for the stabilized
specimens after 28 days of curing period
102
4.20 The effect of cement and RH contents on Go for the stabilized
specimens after 28 days of curing period
102
4.21 The ratio gain in qu 103
4.22 The ratio gain in Go 103
4.23 Relationship of qu-vs 104
4.24 Relationship of qu-Go 104
4.25 Comparison of qu-vs between the present study with other
researchers
105
4.26 y' obtained using the RL fitting method 105
4.27 y' against curing time 106
4.28 Relationship of y' – qu 106
4.29 The compressibility results for the oedometer test (7 days) 107
4.30 The compression curve for 5C2RH at 7 and 28 days 107
4.31 The compression curve for 5C3.5RH at 7 and 28 days 108
4.32 The compression curve for 5C5RH at 7 and 28 days 108
4.33 Determination of pre and post yield region 109

xvi
LIST OF SYMBOLS AND ABBREVIATIONS
() - time shift
A - cross section area
Al2O3 - Alumina
BE - Bender element
C - cement
C2S - Dicalcium silicate
C2SHx, C3S2Hx - hydrated calcium silicates
C3A - Tricalcium aluminate
C3AHx, C4AHx - hydrated calcium aluminates
C3S - Tricalcium silicate
C4AF - Tetracalcium alumino-ferrite
Ca(OH)2 - hydrated lime
Ca2+ - Calcium ion
CaO - Calcium Oxide
CCxy(t), - cross-correlation function
CO2 - Carbon dioxide
C-S-H - calcium silicate hydrate
cu - undrained shear strength

xvii
cv - coefficient of consolidation
DMM - Deep Mixing Method
DSM - deep soil mixing
e - void ratio
e.g. - for example
E50 - secant modulus at 50 % of peak stress
Eo - initial tangent modulus
Ep - peak stress
f - frequency of the transmitted signal
Fe2O3
Gs
-
-
Iron Oxide
Specific gravity
Go - Maximum shear modulus
i.e. - in other words
K+ - Potassium ion
K2O - Potassium Oxide
kHz - kilohertz
L - effective distance traveled by the shear wave through the soil
specimen
l - distance traveled
m - meter
Mg2+ - Magnesium Oxide

xviii
MgO - Magnesium Oxide
mm - milimeter
mv - coefficient of volume compressibility
Na2O - Sodium Oxide
NCL - normal consolidation line
NDT - Nondestructive test
OPC - Ordinary Portland cement
P - compressive force
Pc - preconsolidation pressure
POC - palm oil clinker
qu - unconfined compressive strength
R2 - coefficient of correlation
RCff - column free-free tests
Rd - near field effect
RECESS - Research Centre for Soft Soils
RH - Rice husk
RHA - rice husk ash
RL - regression line
SASW - Spectral analysis surface wave
SiO2 - Silica

xix
SO3 - Sulphur Trioxide
SO42+ - Sulfate ion
t - tonne
t - travel time
TiO2 - Titanium Oxide
to - first time of arrival
tpp - first peak to peak time
UCS - unconfined compressive strength test
UTHM - Universiti Tun Hussein Onn Malaysia
v - Poisson’s ratio
vs - shear wave velocity
w - moisture content
Ws - dry weight
Ww - wet weight
X(T) - degree of correlation of the received signal
XRF - X-ray Fluorescence
Y(T) - transmitted signal
m - micro meter
- density
y' - yield stress

xx
LIST OF APPENDICES
APPENDIX TITLE PAGE
A Shear wave velocities for 5C specimens 123
B Shear wave velocities for 10C specimens 125
C Shear wave velocities for 5C2RH specimens 127
D Shear wave velocities for 5C3.5RH specimens 129
E Shear wave velocities for 5C5RH specimens 131
F Examples of specimens after the unconfined
compression tests
133
G The results of XRF test 138

CHAPTER II
LITERATURE REVIEW
2.1 Soft Soil
Generally, the term soft soils include soft clay soils, soils with large fractions of fine
particles such as silts, clay soils which have high moisture content, peat foundations,
and loose sand deposits near or under the water table (Kamon and Bergado, 1992).
From the soil map of the study area, Parit Raja, Batu Pahat shown in Figure
2.1, it can be seen that the site sits on low humic gley soils, which is poorly drained
soils deposited over coastal plains and in the valleys and flood plains of the larger
rivers, of very variable fertility (Soil Map of Malaya, 1962).
Soft soils pose high moisture content, low shear strength and exhibits high
compressibility. Utilizing such materials as a foundation material is almost
impossible without some means of improving the adverse properties. Although
several methods, such as prefabricated vertical drains, geotextile reinforcing, cement
and lime stabilization, have been successfully implemented to treat such soils, there
always remains the motivation for further improvement of the methods, especially in
terms of efficiency and economics (Amer and Indra, 2007).

8
2.2 Soft Soil Stabilization with Deep Mixing
The research and development of current Deep Mixing Method (DMM) began in the
late 1960s using lime as a stabilizing agent. DMM was put into practice in Japan and
Nordic countries in the middle of the 1970s, and then spread to China and South East
Asia. More than two decades of practice have seen the equipment improved,
stabilizing agents changed, and the applications diversified (CDIT, 2002).
According to EuroSoilStab (2002), deep stabilization is a method to stabilize
soft soils by adding dry or wet binders in order to reduce settlements and/or to
improve the stability. The soil can be stabilized either by forming columns of
stabilized soil (column stabilization) or by stabilizing the upper soil layers of organic
soils (mass stabilization).
Columns with a very high strength giving high strength elements can be
made. Such columns are brittle with a very low strain at failure and acts as bearing
elements. The columns can also be made semi-hard with an appropriate strength
level and not as brittle as the high strength columns (Holm, 1999). This means that
the semi-hard columns can interact with the unstabilized soil between the columns,
as schematically shown in Figure 2.2.
2.2.1 The Mixing Process
The most important factor in the success for application of DMM is ensuring that the
injection and mixing processes of the stabilizing agents with the soil are thorough
and effective, so that homogeneous, well-mixed, stabilized columns of soil are
produced. The effectiveness of the mixing process relies on the use of augers
consisting of appropriate and adequate cutting and mixing sections (Al-Tabba et al.,
1999).

9
According to Larsson et al. (2005), there are three steps in the mixing
process for the dry mixing method including the penetration of the mixing device,
the dispersion of binders into the soil and molecular diffusion as shown in Figure 2.3.
The first part of the mixing process is the rotation and the penetration of the
mixing device through the column. At this part, the soil structure is broken up. The
second stage is the dispersion of stabilizing agent into the soft soil. The stages in the
dispersion process are as follows:
i. Incorporation of dry stabilizing agent particles:
The dry stabilizing agent is distributed in the soft soil by compressed
air. The stabilizing agent is forced into the soil through a hole in the
kelly rod just above the mixing device.
ii. Wetting:
The air in the powder, agglomerates or aggregates is replaced when
the dry stabilizing agent is incorporated with the soil as water is
drawn from the surrounding soil. The air can also be replaced
mechanically by the compaction device.
iii. Breakdown of agglomerates and aggregates:
When the stabilizing agent is wetted, the remaining agglomerates and
aggregates must be broken up, to avoid lumps. This can be achieved
by shearing the soil or by direct impact.
After installation of the columns, the mixing process continues as molecular
diffusion. Different types of stabilizing agents have different properties with respect
to molecular reaction.

10
2.3 Stabilizing Agent
According to CDIT (2002), the stabilizing agents used in practice are, in the majority
of cases, Portland cement and limes, but dozens of stabilizing agents are now
available on the market. Some of these newly developed special stabilizing agents
are designed for the improvement of clay soils with high water contents or organic
soils, for which ordinary cement or lime is not very effective. Some other stabilizing
agents are designed for cases where the rate of strength increase has to be controlled
for the convenience of the construction. These stabilizing agents react slowly with
soil and exhibit smaller strength in the short term, but result in sufficiently high
strength in the long term in comparison with ordinary cement.
2.3.1 Ordinary Portland Cement
Cement stabilization has been widely used to improve the engineering properties of
the clayey soils (e.g. Broms 1999, Feng et al. 2001, Lorenzo and Bergado 2006, Xiao
and Lee 2008).
Cement is a hydraulic type stabilizing agent. According to Bergado et al.
(1996), there are two major chemical reactions which are induced by the addition of
cement to clay and govern the soil cement stabilization process: the primary
hydration reaction of the cement and water, and the secondary pozzolanic reactions
between the limes released by the cement and the clay minerals. The primary
hydration products are hydrated calcium silicates (C2SHx, C3S2Hx), hydrated calcium
aluminates (C3AHx, C4AHx) and hydrated lime Ca(OH)2. The first two of the
hydration products listed above are the main cementitious products formed and the
hydrated lime is deposited as a separate crystalline solid phase. These cement
particles bind the adjacent cement grains together during hardening and form a
hardened skeleton matrix, which encloses unaltered soil particles.
11
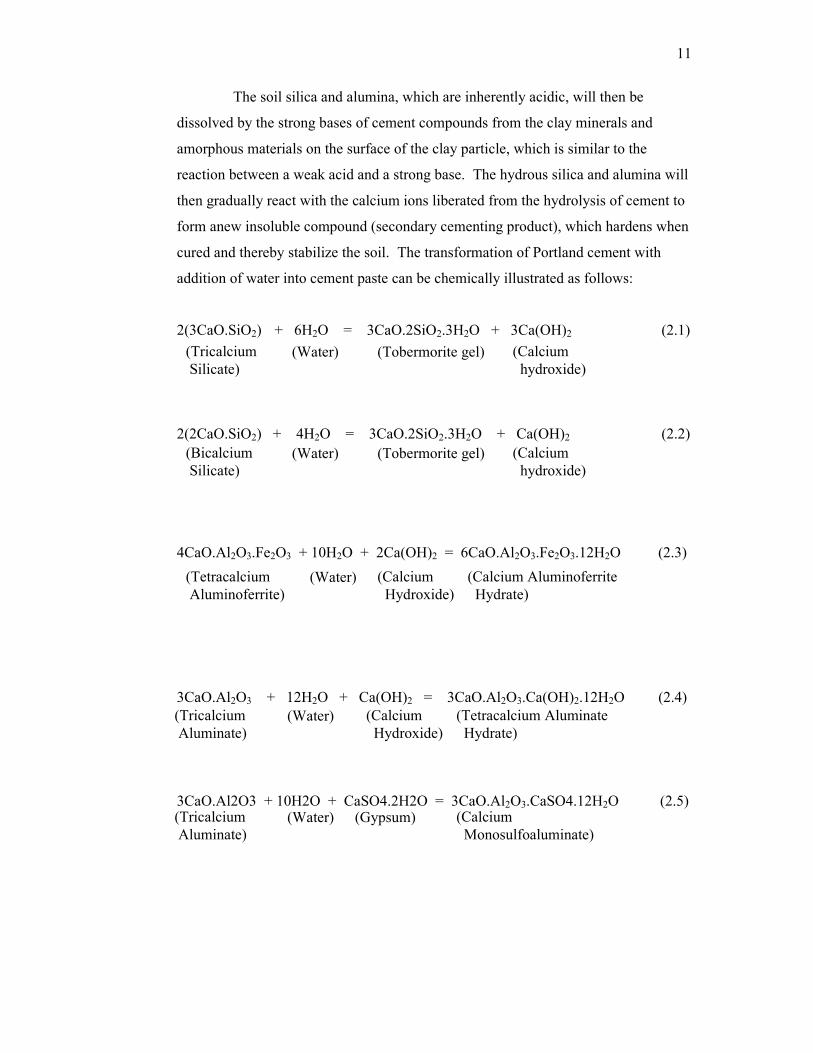
The soil silica and alumina, which are inherently acidic, will then be
dissolved by the strong bases of cement compounds from the clay minerals and
amorphous materials on the surface of the clay particle, which is similar to the
reaction between a weak acid and a strong base. The hydrous silica and alumina will
then gradually react with the calcium ions liberated from the hydrolysis of cement to
form anew insoluble compound (secondary cementing product), which hardens when
cured and thereby stabilize the soil. The transformation of Portland cement with
addition of water into cement paste can be chemically illustrated as follows:
2(3CaO.SiO2) + 6H2O = 3CaO.2SiO2.3H2O + 3Ca(OH)2 (2.1)
2(2CaO.SiO2) + 4H2O = 3CaO.2SiO2.3H2O + Ca(OH)2 (2.2)
4CaO.Al2O3.Fe2O3 + 10H2O + 2Ca(OH)2 = 6CaO.Al2O3.Fe2O3.12H2O (2.3)
3CaO.Al2O3 + 12H2O + Ca(OH)2 = 3CaO.Al2O3.Ca(OH)2.12H2O (2.4)
3CaO.Al2O3 + 10H2O + CaSO4.2H2O = 3CaO.Al2O3.CaSO4.12H2O (2.5)
(TricalciumSilicate)
(Water) (Tobermorite gel) (Calciumhydroxide)
(BicalciumSilicate)
(Water) (Tobermorite gel) (Calciumhydroxide)
(TetracalciumAluminoferrite)
(Water) (CalciumHydroxide)
(Calcium AluminoferriteHydrate)
(TricalciumAluminate)
(Water) (CalciumHydroxide)
(Tetracalcium AluminateHydrate)
(TricalciumAluminate)
(Water) (Gypsum) (CalciumMonosulfoaluminate)

12
Bergado et al. (1996) further explained that the reactions which take place in
soil-cement stabilization can be represented in the equation below. The reactions
given are for tricalcium silicate (C3S) only, because they are the most important
constituents of Portland cement:
C3S + H2O C3S2Hx + Ca(OH)2 (2.6)
Ca(OH)2 Ca++ + 2(OH)- (2.7)
Ca++ + 2(OH)- + SiO2 (soil silica) CSH (2.8)
Ca++ + 2(OH)- + Al2O3 (soil alumina) CAH (2.9)
2.3.2 Rice Husk
According to FAO (2009), global rice paddy production in 2009 was approximately
668 million tones and Malaysia’s contribution was 2.45 million tones. Rice husk
(RH) is the outer covering of the rice grain and is obtained during the milling
process.
Commercially, RH produced in Malaysia is ground with broken rice to be
used as animal feed. A large part of this agricultural by-product is burnt as fuel
during rice processing and the resulting ash is sold as fertilizer. Other applications of
RH are as silicon carbide whiskers, and as aggregates and fillers for concrete and
board production. However, most RH is disposed of openly or in landfills, risking
(Primary CementitiousProducts)
(Secondary CementitiousProducts)
(Secondary CementitiousProducts)
13
potential pollution and contamination, leading to further environmental problems
(Johnson and Yunus, 2009).
Mehta (1992) stated that about 20 % of a dried rice paddy is made up of the
rice husks. The current world production of rice paddy is around 500 million tons
and hence 100 million rice husk are produced, as shown in Table 2.1. According to
Lee et al. (2007), the amount of rice husk generated annually by the local rice mills
in Malaysia is estimated to be 3.41 million cubic meter.
2.3.2.1 Properties and Pozzolanic Effect of Rice Husk
Pozzolanic materials are natural materials or by-products of industry, when mixed
with water and alkali or alkaline earth hydroxide activators, react to form
cementitious compounds (Marian and Raymond, 1999). Dwivedi et al. (2006) stated
that when certain pozzolanic materials containing amorphous silica are added during
the hydration of Portland cement, the reaction with lime produces additional amount
of calcium silicate hydrate (C-S-H), the main cementing component.
Hypothetically, the high silica content of rice husks could contribute to the
pozzolanic reaction of cement during hydration and enhance the bonding strength of
the soil mass. In their work on mortar admixed with rice husks and cement,
Jauberthie et al. (2000) observed that the pozzolanic role of rice husk was due to the
existence of silica in amorphous and fine grained quartz in the mixture (Tables 2.2 to
2.4). Pozzolanic effect exhibits cementitious properties that increase the rate at
which the material gains strength.
According to Sing et al. (2007), the chemical reaction between silica from
rice husk with cement and soil is represented by Equations 2.10 and 2.11. Like a
reaction between a week acid and a strong base, the strong base eventually dissolves
the silica within the rice husk and clay soil to form hydrous silica. The hydrous silica
will gradually react with the calcium ions produced from the cement hydrolysis to
generate insoluble and cementitous materials known as secondary silicate. That
means the solution of silica actually generates additional bonding forces in the

14
cemented soil. Upon curing, the secondary cementitous products will harden and
provide secondary bondage strength to the stabilized soil. This reaction is referred to
as secondary pozzolanic reaction.
Ca(OH)2 Ca+ + 2(OH)- (2.10)
Ca+ + 2(OH)- + SiO2 CaO.SiO2.H2O (2.11)
2.4 Measurement of Stiffness using Seismic Method
There are two categories of seismic wave: body waves, comprising compression (P)
and shear (S) waves, and surface waves, which include Rayleigh (R) waves (Ortigao,
2007).
P-wave (often referred to as ‘Pressure’ wave) is a longitudinal wave in which
the direction of motion of the particles is in the direction of propagation as shown in
Figure 2.4 (a). On the other hand, S-wave (also referred to as ‘Shear’ wave), as
shown in Figure 2.4 (b), is a transverse wave in which the direction of motion of the
particles is perpendicular to the direction of propagation where the shear distortion is
applied (GDS, 2005).
It should be noted that in saturated uncemented soils, the propagation of P-
wave will represent a short term undrained loading. In such case the compressibility
of the pore water will tend to dominate the compressibility behaviour of the soil.
The result is that the measured P-wave velocity is likely to be close to that of water
(i.e. 1500 m/s) since most of the energy will travel through the pore water and will
not reflect the true undrained stiffness of the soil. Thus for stiffness measurements in
soils, only shear wave velocities should be used since these are not affected by the
compressibility of the pore fluid (Ortigao, 2007).
Silica from ricehusk and clay soil
Secondary calciumsilicate hydrate

15
Geotechnical engineers generally require stiffness measurements to be made
at different depths in order to determine a stiffness-depth profile. Ortigao (2007) had
summarized the seismic methods employed in determination of stiffness-depth
profiles, as shown in Table 2.5.
2.5 Measurement of vs for Stabilized Soil
Measurements of vs in various soils have attracted increased attention over the last
decades (e.g Heineck et al. 2005, Leong et al. 2005, Karl et al. 2006 and Zhou and
Chen 2007). However, comparatively few investigations on stabilized soils have
been reported (Åhnberg and Holmén, 2009).
Hoyos et al. (2004) carried out a series of resonant column tests on
chemically stabilized specimens of a sulfate-rich expansive clay and tested for the
effects of different stabilizer types, stabilizer dosages, compaction moisture contents
and confining pressures. Three stabilizers were experimented with: sulfate resistant
type V cement, low calcium class F fly ash and lime mixed with polypropylene
fibers.
Figure 2.5 shows the influence of compaction moisture content (w) on the
dynamic response of stabilized specimens. The maximum shear modulus (Go) from
all stabilized specimens were highly susceptible to even slight changes in w, with the
most dramatic cases observed in the cement-stabilized specimens. This can be
attributed to the fact that stiffness enhancement in stabilized soils being highly
dependent on the cementitious nature of each stabilizer. It can be noted that highly
cementitious stabilizers, such as type V cement, yielded the highest Go at higher
levels of hydration. On the other hand, fly ash-based stabilization was not found to
make significant contribution to Go. Similar observation was made of the 5 %
cement-and lime/fibers-based treatment. This shows that foreign elements with
negligible or zero cementitious properties will not react chemically with the soil,
hence resulting in marginal stiffness increase by their addition to soils.
16
Madhyannapu et al. (2010) reviewed the process and results of a quality management
program performed during and immediately after the construction of two deep soil
mixing (DSM) test sections. The SASW test method was performed to evaluate the
degree of improvement achieved through the measurement of shear wave velocities
of the columns and surrounding soils. From the test, the S-wave velocities recorded
were 1.3 and 1.5 times of those recorded in untreated site, evidence of considerable
improvement in stiffness in and around the DSM columns compared to original soil
site.
2.6 Bender Element (BE) Test
Bender elements are piezoelectric ceramic devices used in geotechnical laboratory
dynamic testing. The use of bender elements to measure shear wave velocity in soils
was first attempted by Shirley and Hampton (1977). Bender elements work as
cantilevers which flex or bend when excited by the voltage differential of an electric
signal and vice versa, i.e., they bend when excited by a voltage input, and generate a
voltage differential when forced to bend. The transducers are used in pairs, where
one operates as the transmitter and the other the receiver.
The bender elements work by having the transmitter transform an input
electric signal into a mechanical motion, which in turn disturbs the medium in which
it is embedded. This disturbance propagates through the medium in the form of
mechanical waves and is detected by the receiver. The receiver is then forced to
bend, and consequently generating an output electric signal due to its piezoelectric
properties mentioned above. The input voltage or transmitted signal, and the
received signal are both recorded on a timescale, allowing the travel time of the shear
waves to be determined.
The primary objective of the BE test is to measure the travel time of a wave
propagating through a soil specimen from the transmitting to the receiving
transducers (Shirley and Hampton, 1977). The shear wave velocity, vs, can be
determined by

17
vs = L/t (2.12)
where L is the effective distance traveled by the shear wave through the soil
specimen, which equals the tip to tip distance between the bender elements and t is
the travel time of the shear wave. Accordingly, Go can be calculated from the shear
wave velocity as follows
Go = vs2 (2.13)
where is the density of soil.
2.6.1 BE Test in Geotechnical Testing
According to Puppala et al. (2006) and Chan (2009), one of the main advantages of
the shear wave velocity measurement is that the numbers of specimens required are
significantly reduced, because it provides a repeatable measurement of the same soil
specimen under varying conditions, such as curing period.
Due to this advantage, BE test has been much adopted for measuring shear
wave velocity, such as demonstrated by Sahaphol and Miura (2005), Wang et al.
(2007), Landon et al. (2007) and Zhou et al. (2008).
Sahaphol and Miura (2005) reported that the maximum shear modulus (Go) of
soils is one of the important parameters in small strain level geotechnical problems
(i.e. the study of earthquake effects and soil structure interaction). In their study of
crushable volcanic soils, measurements of Go from bender element and cyclic triaxial
tests were compared. The Go values evaluated with the bender elements are plotted
against those from the cyclic triaxial tests in Figure 2.6. Both measurements agreed
well, though stiffness in the cyclic test was derived from direct measurement of the
stress-strain change while the bender element test used transient waves.

18
As the BE test generally requires that the transducer pair be plugged on to
opposite ends of a test specimen, there is a valid concern of the effect of such
intrusion on the quality of the measurements made. Chan et al. (2010) conducted a
study in this direction by varying the receiver BE’s penetration depth and rate,
confining pressure, as well as the test specimen size, but with a fixed aspect ratio of
2. Based on the data collected (Figure 2.7), it was concluded that BE installation
causes almost no disturbance irrespective of the factors mentioned above, hence can
be readily performed on clay samples in the laboratory and field with little sensitivity
to such variations.
2.6.2 Determination of Shear Wave Travel Time
The travel time of the shear wave between two points in a soil specimen can be used
to calculated shear wave velocity and hence shear stiffness. However, the proposed
methods that use the time-domain estimates to determine the travel time are
controversial.
The detection of travel time is not straightforward and this has resulted in
different researchers using a range of methods to obtain the correct travel time. For
example, Jovičić et al. (1996) has recommended using the first time of arrival
method (Section 2.6.3). However, they stress that great care is required to reduce
system noise, and the pulse frequency must be adjusted to minimize near field affects
(Section 2.6.4).
Jovičić et al. (1996) also suggested to use a sine pulse instead of a square one
as the input signal when performing the BE test. Figure 2.8 shows an example of the
received trace when square wave is used. As a square wave is composed of a
spectrum of different frequencies, this result in significant difficulty of identifying
the characteristic points on the received signal, like the point of first deflection (0)
and the reversal point (1).
19
Chan (2005) grouped the techniques to ascertain the travel time into two main
categories: time domain and frequency domain. The time domain methods refer to
plots of electrical signals versus time, while the frequency domain methods involve
analyzing the spectral breakdown of the signals and comparing phase shifts of the
components. Chan (2005) also explored the different techniques from both groups in
stabilized clay specimens and drew the conclusion that neither of the methods gives
more consistent results.
Kumar and Madhusudhan (2010) performed BE tests on dry sand samples at
different relative densities and effective confining pressures. Three methods of
interpretations, namely, (1) the first time of arrival, (2) the first peak to peak, and (3)
the cross-correlation method, were employed. The explanation of these methods can
be referred to in Section 2.6.3.
A comparison was made by the authors among the travel times obtained by
the different methods adopted for analyzing the results of the BE testing. The travel
time (t) was also obtained by using the resonant column method. Figure 2.9 shows
the comparison of the travel times from the different methods associated with three
different values of effective consolidation pressures. From the results, the first peak
to peak, the cross-correlation method and the resonant column tests provide results
close to one another. However, the first time of arrival method sometimes gave a
much different result compared to the other methods. This indirectly suggests the
subjectivity and inconsistency of the method for determining the shear wave arrival
time, due very much in part to the difficulty of selecting the ‘correct’ point of
departure.
20
2.6.3 Methods for Determining Travel Time
A brief description of three most common methods for determining travel time is
provided as follows:
i. First time of arrival
The first time of arrival (to) refers to the time between the start of the transmitted
signal and the start of the major cycle of the received signal (Viggiani and
Atkinson 1995, Jovičić et al.1996, Arulnathan et al. 1998, Kumar and
Madhusudhan 2010). Figure 2.10 (a) shows an example of this method.
ii. First peak to peak time
The first peak to peak time (tpp) method (Viggiani and Atkinson 1995,
Arulnathan et al. 1998, Kumar and Madhusudhan 2010) is based on to the time
between the peak of the transmitted signal and the first peak of the cycle of the
received signal (Figure 2.10a).
iii. Cross-correlation
The cross-correlation method essentially refers to the cross-correlation function
CCxy(t), which is a measure of the degree of correlation of the received signal,
X(T), and the transmitted signal, Y(T), versus the time shift (). An example of
the cross-correlation function is shown in Figure 2.10 (b). Full details for
determination of this method can be referred to in Viggiani and Atkinson (1995).

21
2.6.4 Near Field Effect
The shape of the received signal is affected by the presence of near field effect,
which can distort the received signal and makes identification of the travel time
difficult, particularly in the time domain (Jovičić et al.1996 and Arulnathan et al.
1998). Sanches-Salinero et al. (1986) recognized that the Rd ratio controls the shape
of the received signal through the degree of attenuation that occurs as the wave
travels through the sample. Rd is given by:
Rd = l/ = l f/vs (2.14)
Where l is the distance traveled and f is the frequency of the transmitted signal.
Figure 2.11 shows an initial downward deflection of a trace, corresponding to low
values of Rd, before the actual arrival of the shear wave. This is a manifestation of
the near field effect, which is almost absent in higher range of Rd values.
2.6.5 Bender Element (BE) Test in Stabilized Soils
Research on stabilized soils with bender elements has gained increased attention in
recent years (e.g Heineck et al. 2005, Puppala et al. 2006, Chan 2007, Hird and Chan
2008, Åhnberg and Holmén 2009 and Asaka and Abe 2009).
Bender element tests were conducted by Puppala et al. (2006) on cement and
lime stabilized clay specimens and the results were analyzed to study the variation in
stiffness properties of clay specimens at different chemical stabilizers. The authors
reported that the Go of untreated clay is low and in the range of 20 – 50 Mpa. The
authors also reported that cement stabilized clay provided rapid enhancement of Go
with respect to curing time, whereas lime stabilized clay did not exhibit an
immediate increase in Go. These indicate that the time required for pozzolanic
reactions was longer for lime stabilization than for the cement stabilization.

22
The change in shear wave signals throughout the 7-day curing period on
stabilized clays was studied by Chan (2007) using BEs. The results showed that
apart from the expected shorter travel time, the amplitude of the signal improved
over time too. These two observations combined reflect the increased stiffness of
the material as hydration of the cement proceeded with time.
The quality of cement-stabilized grounds was inspected at two construction
sites by Asaka and Abe (2009), where the BE test procedure is summarized in Figure
2.12. The stabilizers used for Sites A and B were blast-furnace slag and low Cr (VI)
leaching respectively. BE test results showed significant vs increment in Site A
compared to Site B, indicating the influence of difference stabilizer type on the same
soil type.
2.7 Unconfined Compressive Strength (UCS)
The test procedure for UCS test was as described in BS 1377: 1990: Part 7,
where a cylindrical specimen of soil is subjected to a steadily increasing axial load
until failure occurs. The axial load is the only force or stress which is applied
(Figure 2.13). Equation for qu is as stated in Eq. 2.15. Table 2.6 shows the
description of clays according to the undrained shear strength (cu) values where cu =
qu/2 (Nagaraj and Miura, 2001).
qu = P/A (2.15)
Where;
qu = unconfined compressive strength
P = compressive force
A = cross section area
23
2.7.1 UCS Test on Stabilized Soil
The unconfined compressive strength (qu) is most frequently used as an index of the
strength of stabilized soil (Lee and Lee, 2002). In spite of the different stabilizers
used, many researchers have adopted the UCS test for its simplicity. Attom (2008)
studied the strength characteristics of Irbid clayey soil mixed with iron filling and
iron filling-cement mixture. UCS test results showed increased qu and secantial
modulus of elasticity with the addition of both stabilizers, but the iron filling-cement
mixture was found to be more effective between the two.
Tang et al. (2007) carried out a study on strength of short polypropylene fiber
reinforced and cement stabilized clayey soil. Figure 2.14 shows the effect of fiber
content on the uncemented soil and cemented soil after curing for 28 days. It is
indicated that fiber plays a more important role in cemented soil than it does in
uncemented soil where the influenced of fiber inclusion on uncemented soils is not
significant. This is because for fiber-reinforced cemented soil, the interactions
between the fiber surface and the hydrated products make main contribution to the
higher strength than the uncemented soil.
Tan et al. (2002) stated that a primary concern in the characterization study of
improved soil is to estimate the expected increase in improvement, usually based on
properties after 1 day or 7 days of curing. This will give an early indication of
whether a particular mix proportion can achieve the design strength at 28 days, the
usual benchmark for determination strength. Figure 2.15 shows the relationship
between normalized strength at 28 days with the normalized strengths at other time
intervals. The relationships are generally linear and range between 1.2 to 2.9 times
of strength for 7 - 28 days comparison.
Kitazume and Nishimura (2009) presented the variations of qu with
temperature observed for the Kawasaki clay as shown in Figure 2.16 for different
binder contents and curing days. The results indicate that the higher curing
temperature and longer curing period led to higher strength achieved.

24
2.8 Correlation between Shear Wave Velocity and UCS Test
Madhyannapu et al. (2010) developed an empirical correlation between the UCS (qu)
versus shear wave velocity (vs) from the laboratory test conducted on lime-cement
stabilized expansive soils. The main intent of this correlation was to interpret the
strength properties from vs and vice versa. The correlation of qu versus vs is
presented in Figure 2.17 (Site 1 and Site 2). The authors claimed that the
correlations developed are useful in field quality assessments where the strength is
deduced from the vs-qu correlation. It was further shown that the predicted qu
corresponded closely to the measured strengths of UCS tests (Figure 2.18).
The usefulness of the qu-vs relationship was also demonstrated by Åhnberg
and Holmén (2009), with stabilized soil samples collected from more than twenty
different geotechnical engineering projects. The types of soil in their research range
from very soft to sand. The stabilizing agents used included different types of
cement, lime, ground granulated blast-furnace slag and fly ash. Figure 2.19 shows
the variation in shear wave velocity, evaluated from bender element and the resonant
column free-free tests (RCff), with the strengths from UCS tests. The results shown
in Figure 2.24 relate only to specimens having water contents greater than 40 %. The
authors also stated that the relationship between qu and vs in their research agree
fairly well with those reported by other researchers as showed in Figure 2.20.
Clearly, such correlations are time-saving and marginally labour-intensive for
quality control of stabilization on site. However, it should be cautioned that different
soil and binder types result in different correlations, making site specific correlations
necessary for reliable predictions to be made from the vs measured.
REFERENCES
Åhnberg, H. & Holmén, M. (2009). Assessment of Strength of Stabilized Soils By
Geophysical Laboratory Testing. International Symposium on Deep Mixing
and Admixture Stabilization. Okinawa, Japan. LT-2.
Al-Tabbaa, A., Al-Tabbaa, A. M. & Ayotamuno, J. M. (1999). Laboratory-Scale
Dry Soil Mixing of a Sand.
Proc. of The International Conference on Dry Mix Methods for Deep Soil
Stabilization. Sweden: A.A. Balkema. pp. 73-84.
Amer, A. A & Indra S. H. (2007). Potential Of Bottom Ash, Pulverised Fly Ash and
Lime For Improvement of Soft Soils. Proc. of the World Engineering
Congress. Penang, Malaysia. pp. 415-420.
Arulnathan, R., Boulanger, R. W. & Riemer, M. F. (1998). Analysis of Bender
Element Tests. Geotechnical Testing Journal, Vol. 21, No. 2, pp. 120-131.
Asaka, Y. and Abe, T. (2009). Non-destructive Testing Using Bender Elements and
Its application to Cement-Treated Ground. International Symposium on Deep
Mixing and Admixture Stabilization. Okinawa, Japan. QA-1.
Attom, M. F. (2008). Shear Strength Characteristics of Irbid Clayey Soil Mixed With
Iron Filling and Iron Filling-Cement Mixture. Environ Geol (55): Springer,
pp. 781-788.
Basha, E. A., Hashim, R., Mahmud, H. B. & Muntohar, A. S. (2005). Stabilization
of Residual Soil with Rice Husk and Cement. Construction and Building
Materials (19): Elsevier Ltd., pp. 448-453.

115
Bergado, D.T., Anderson, L.R., Miura, N. & Balasubramaniam, A.S. (1996). Soft
Ground Improvement In Lowland And Other Environments. New York:
ASCE Press.
British Standards Institution (BSI). (1990). British Standard Methods of Test for
Soils for Civil Engineering Purposes. Part 5: Compressibility, Permeability
and Durability Tests. BS1377.
British Standards Institution (BSI). (1990). British Standard Methods of Test for
Soils for Civil Engineering Purposes. Part 7:Shear Strength Tests (total
stress). BS1377.
Broms, B. B. (1986). Stabilization of Soft Clay with Lime and Cement Columns in
Southeast Asia: Applied Research Project RP10/83. Nanyang Technical
Institute, Singapore.
Broms, B. B. (1999). Keynote Lecture: Design of Lime, Lime/Cement and Cement
Columns. Proc. of The International Conference on Dry Mix Methods for
Deep Soil Stabilization. Sweden: A.A. Balkema. pp. 125-153.
Chan, C. M. & Tan, S. F. C. (2008). Peat Reutilisation Via The Comstab Method. An
International Conference on Geotechnical Engineering. Chiangmai,
Thailand. pp. 361-367.
Chan, C. M. (2005). A Laboratory Investigation of Shear Wave Velocity in Stabilized
Soft Soils. University of Sheffield: Ph.D. Thesis.
Chan, C. M. (2009). Shear Wave Velocity Measurement in Stabilized Soil Specimen:
Arrival Time Determination. International Symposium on Deep Mixing and
Admixture Stabilization. Okinawa, Japan. QA-2.
Chan, C.M. (2007). 1-D Compressibility of Stabilised Clays in an Instrumented
Oedometer. Prosiding Kebangsaan Awam’07. Kedah, Malaysia. pp. 550-
557.

116
Chan, K. H., Boonyatee, T. & Mitachi, T. (2010). Effect of Bender Element
Installation in Clay Samples. Geotechnique, 60(4), pp. 287-291.
Coastal Development Institute of Technology (CDIT). (2002). The Deep Mixing
Method (Principle, Design and Construction). Tokyo: A.A. Balkema
Publishers.
Dwivedi, V. N., Singh, N. P., Das, S. S. & Singh, N. B. (2006). A New Pozzolanic
Material for Cement Industry: Bamboo Leaf Ash. International Journal of
Physical Sciences, Vol. 1 (3), pp. 106-111.
Erdoğdu, K. and Türker, P. (1998). Effects of Fly Ash Particle Size on Strength of
Portland Cement Fly Ash Mortars. Cement and Concrete Research, Vol. 28,
No. 9: Elsevier Science Ltd, pp. 1217-1222.
EuroSoilStab. (2002). Development of Design and Construction Methods to
Stabilize Soft Organic Soils (Design Guide Soft Soil Stabilization). Brussels:
CT97-0351.
Fam, M. and Santamarina, C. (1996). Study of Clay-Cement Slurries with
Mechanical and Electromagnetic Wave Measurements in An Oedometer.
ASTM Geotechnical Testing Journal, Vol. 18, No. 3, pp. 307-314.
FAO. (2009). Rice Market Monitor, Vol. XII, Issue 1. Retrieved August 11, 2009,
from http://www.fao.org/es/ESC/en/15/70/highlight_71.html
Feng, T. W., Lee, J.Y. & Lee, Y. J. (2001). Consolidation Behaviour of A Soft Mud
Treated With Small Cement Content. Journal of Engineering Geology (59):
Elsevier Ltd., pp. 327-335.
GDS Instruments Ltd. (2005). Bender Elements: The GDS Bender Elements System
Handbook for Vertical and Horizontal Elements: Bender Element Hardware
Handbook.

117
Ghosh, A. and Dey, U. (2009). Bearing Ratio of Reinforced Fly Ash Overlying Soft
Soil and Deformation Modulus of Fly Ash. Journal of Geotextiles and
Geomembranes: Elsevier, pp. 313-320.
Grigolato, E. (2008). 1 Day Seminar on X-Ray Techniques. Universiti Tun Hussein
Onn Malaysia: Bruker Biosciences.
Hassan, M. M. (2009). Engineering Characteristics of Cement Stabilized Soft
Finnish Clay – A Laboratory Study. Helsinki University of Technology:
Licentiate Thesis.
Head, K. H. (1982). Manual of Soil Laboratory Testing Volume 2: Permeability,
Shear Strength and Compressibility Tests. London: PENTECH PRESS.
Heineck, K. S., Coop, M. R. & Consoli, N. C. (2005). Effect of Microinforcement of
Soils From Small to Large Shear Strains. Journal of Geotechnical and
Environmental Engineering, Vol. 131, No. 8: ASCE, pp. 1024-1033.
Hird, C. & Chan, C. M. (2006). One-Dimensional Compression Tests on Stabilized
Clays Incorporating Shear Wave Velocity Measurements. Geotechnical
Testing Journal, Vol. 31, No. 2: ASTM, pp. 166-174.
Holm, G. (1999). Keynote Lecture: Applications of Dry Mix Methods for Deep Soil
Stabilization. Proc. of The International Conference on Dry Mix Methods for
Deep Soil Stabilization. Sweden: A.A. Balkema. pp. 3-13.
Horpibulsuk, S., Bergado, D. T. & Lorenzo, G. A. (2004). Compressibility of
Cement-Admixed Clay at High Water Content. Gĕotechnique, Vol. 54, No.2 ,
pp. 151-154.
Hoyos, L. R., Puppala, A. J. & Chainuwat, P. (2004). Dynamic Properties of
Chemically Stabilized Sulfate Rich Clay. Journal of Geotechnical and
Geoenvironmental Engineering, Vol. 130, No. 2: ASCE, pp. 153-162.

118
Ibrahim, K. A. (2007). Alternative Road Construction Materials Using Clay
Admixed With Natural Wastes. Universiti Tun Hussein Onn Malaysia: Final
Year Project.
Jauberthie, R., Rendell, F., Tamba, S. & Cisse, I. (2000). Origin of the Pozzolanic
Effect of Rice Husks. Journal of Construction and Building Materials (14).
Elsevier Ltd., pp. 419-423.
Johnson, A, C. & Yunus, N. (2009). Particleboards from Rice Husk: A Brief
Introduction to Renewable Materials of Construction. JURUTERA (June
2009). pp. 12-15.
Jovičić, V., Coop, M. R. and Simić, M. (1996). Objective Criteria for Determining
Gmax from Bender Element Tests. Geotechnique. 46(2), pp. 357-362.
Kamaluddin, M. (1995). Strength and Deformation Characteristics of Cement
Treated Bangkok Clay. D. Eng. Dissertation No. GT-94-1, Asian Institute of
Technology, Bangkok, Thailand.
Kamon, M. & Bergado, D. T. (1992). Ground Improvement Techniques. Proc. of the
9th Asian Regional Conf. on Soil Mech. and Found. Engineering, Vol. 2.
Bangkok. pp. 526-546.
Karl, L., Haegeman & Degrande, G. (2006). Determination of The Material Damping
Ratio and The Shear Wave Velocity with The Seismic Cone Penetration Test.
Journal of Soil Dynamics and Earthquake Engineering (26): Elsevier Ltd.,
pp. 1111-1126.
Kitazume, M. & Nishimura, S. (2009). Influence of Specimen Preparation and
Curing Conditions on Unconfined Compression Behaviour of Cement-
Treated Clay. International Symposium on Deep Mixing and Admixture
Stabilization. Okinawa, Japan. IC-7.

119
Kumar, J. & Madhusudan, B. N. (2010). A Note on The Measurement of Travel
Times Using Bender and Extender Elements. Journal of Soil Dynamics and
Earthquake Engineering (30): Elsevier Ltd., pp. 630-634.
Landon, M. M., DeGroot, D. J. and Sheahan, T. C. (2007). Nondestructive Sample
Quality Assessment of a Soft clay Using Shear Wave Velocity. Journal of
Technologies (8), pp. 58-70.
Larsson, S., Dahlström, M. & Nilsson, B. (2005). Uniformity of Lime-Cement
Columns for Deep Mixing: A Field Study. Ground Improvement (9), No. 1,
pp. 1-15.
Lee, K. H. & Lee, S. (2002). Mechanical Properties of Weakly Bonded Cement
Stabilized Kaolin. KSCE Journal of Civil Engineering, Vol. 6, No. 4, pp. 389-
398.
Leong, E. C., Yeo, S. H. & Rahardjo, H. (2005). Measuring Shear Wave Velocity
Using Bender Elements. Geotech. Test. J., 28(5), pp. 488-498.
Lorenzo, G. A. & Bergado, D. T. (2004). Fundamental Parameters of Cement-
Admixd Clay-New Approach. Journal of Geotechnical and
Geoenvironmental Engineering, Vol 130, No 10: ASCE, pp. 1042-1050.
Lorenzo, G. A. & Bergado, D. T. (2006). Fundamental Characteristics of Cement-
Admixed Clay in Deep Mixing. Journal of Materials in Civil Engineering,
Vol. 18, No. 2: ASCE, pp. 161-174.
Madhyannapu, R. S., Puppala, A. J., Nazarian, S., P. E. & Yuan, D. (2010). Quality
Assessment and Quality Control of Deep Soil Mixing Construction for
Stabilizing Expansive Subsoils. Journal of Geotechnical and
Geoenvironmental Engineering, Vol. 136, No. 1: ASCE, pp. 119-128.
Marian, P. R. & Raymond, S. R. (1999). Geotechnical Materials in Construction.
Mississippi: McGraw-Hill.

120
Mehta, P.K. (1992). Rice Husk Ash – A Unique Supplementary Cement Material.
Advances in Concrete Technology. Malhotra, CANMET, Ottawa, Canada.
Nagaraj, T. S. & Miura, N. (2001). Soft Clay Behaviour Analysis and Assessment.
Netherlands: A.A Balkema.
Ortigao, J. A. R. (2007). Wave Propagation and Microstrain Behaviour of Soils.
Geotechnical and Geoenvironmental Engineering, Vol 133, No 4: ASCE, pp.
424-
Oyetola. E. B. and Abdullahi, M. (2006). The Use of Rice Husk Ash in Low – Cost
Sandcrete Block Production. Leonardo Electronic Journal of Practices and
Puppala, A. J., Kadam, R., Madhyannapu, R. S. & Hoyos L. R. (2006). Small-Strain
Shear Moduli of Chemically Stabilized Sulfate-Bearing Cohesive Soils.
Journal of Geotechnical and Geoenvironmental Engineering, Vol. 132, No. 2:
ASCE, pp. 322-336.
Rao, S. M. & Shivananda, P. (2005). Compressibility Behaviour of Lime-Treated
Clay. Geotecnical and Geological Engineering (23): Springer, pp. 309-319.
Robani, R. & Chan, C. M. (2009). Relationship of vs and qu for Soft Clay Stabilized
with Cement-POC. Persidangan Kebangsaan Kejuruteraan Awam Kelima
(AWAM’09). Kuala Lumpur, Malaysia. GTC 13.
Romano, J. S. & Rodrigues, F. A. (2008). Cements Obtained From Rice Hull:
Encapsulation of Heavy Metals. Journal of Hazardous Materials (154):
Elsevier Ltd., pp. 1075-1080.
Sahaphol, T. & Miura, S. (2005). Shear Moduli of Volcanic Soils. Journal of Soil
Dynamics and Earthquake Engineering (25): Elsevier Ltd., pp. 157-165.

121
Sakr, M. A. and Shahin, M. A. (2009). Utilization of Lime for Stabilizing Soft Clay
Soil of High Organic Content. Geotech. Geol. Eng. (27), pp. 105-113.
Sanches-Salinero, Roesset, J. M. & Stoke, K. H. (1986). Analytical Studies of Body
Wave Propagation and Attenuation. Report GR86-15, University of Texas.
Sarkawi, S. S. & Aziz, Y. (2003). Ground Rice Husk as Filler in Rubber
Compounding. Jurnal Teknologi, 39 (A): Universiti Teknologi Malaysia, pp.
135-148.
Shirly, D. J. and Hampton, L .D (1977). Shear Wave Measurements in Laboratory
Sediments. J Acoust Soc Am; 63(2).607-613.
Show, K. Y., Tay, J. H. & Goh, A. T. C. (2003). Reuse of Incinerator Fly Ash in Soft
Soil Stabilization. Journal of Materials in Civil Engineering, Vol. 15, No 4:
ASCE, pp. 335-343.
Sing, W. L., Hashim, R. & Basha, E. A. (2007). Chemical Reactions of Residual
Soil Stabilized by Portland Cement and Rice Husk. Proc. of the World
Engineering Congress. Penang, Malaysia. pp. 399-407.
Soil Map of Malaya (1962). Prepared by the Soil Science Division, Division of
Agriculture, Ministry of Agriculture and Co-operates, Kuala Lumpur,
Malaysia.
Tan, T. S., Goh, T. L. & Yong, K. Y. (2002). Properties of Singapore Marine Clays
Improved by Cement Mixing. Geotechnical Testing Journal, Vol. 25, No. 4:
ASTM, pp. 1-12.
Tang, C., Shi, B., Gao, W., Chen, F. & Cai, Y. (2007). Strength and Mechanical
Behavior of Short Polypropylene Fiber Reinforced and Cement Stabilized
Clayey Soil. Geotextiles and Geomembranes (25): Elsevier, pp. 194-202.
Technology, Bangkok, Thailand.

122
Viggiani, G. and Atkinson, J. H. (1995). Interpretation of Bender Element Tests.
Geotechnique, 45(1), pp. 149-154.
Wang, Y. H., Lo, K. F. and Dong, X. B. (2007). Measurement Biases in the Bender
Element Test. Journal of Geotechnical and Geoenvironmental Engineering,
Vol. 133, No. 5: ASCE, pp. 564-574.
Xiao, H. W. & Lee, F. H. (2008). Curing Time Effect on Behavior of Cement
Treated Marine Clay. Proc. of World Academy of Science, Engineering and
Technology, Vol. 33. Singapore: PWASET. pp. 71-78.
Zhou, Y. G. & Chen, Y. M. (2007). Laboratory Investigation on Assessing
Liquefaction Resistance of Sandy Soils by Shear Wave Velocity. Journal of
Geotechnical and Geoenvironmental Engineering, Vol. 133, No. 8: ASCE,
pp. 959-972.
Zhou, Y. G., Chen, Y. M. and Asaka, Y. and Abe, T. (2008). Surface-Mounted
Bender Elements for Measuring Horizontal Shear Wave Velocity of Soils.
Journal of Zhejiang University SCIENCE A, 9(11): Springerlink, pp. 1490-
1496.


![III Perbaikan Tanah secara perkuatan [Compatibility Mode]](https://img.dokumen.tips/doc/110x75/5571f9bf49795991699054fb/iii-perbaikan-tanah-secara-perkuatan-compatibility-mode.jpg)