Embed Size (px)
Citation preview
MECHANICAL ENGINEERING DEPARTMENT
INDIAN INSTITUTE OF SCIENCE - BANGALORE
NOV-2012
A BRIEF ILLUSTRATION OF RAMAN SPECTROSCOPY
ASSIGNMENT-MATERIALS & STRUCTURE PROPERTY CORELATION
VIJAY MOHAN - 09899 || PRADEEP – 09790 || RAHUL - 09771


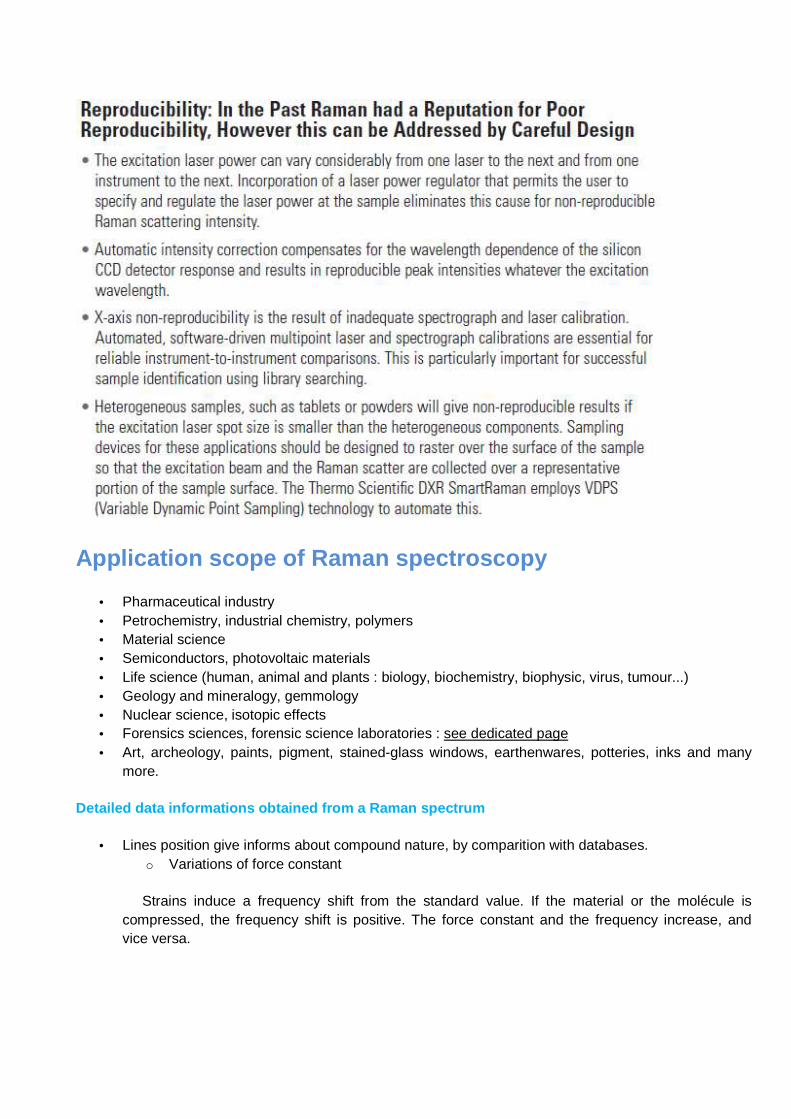
Application scope of Raman spectroscopy
• Pharmaceutical industry • Petrochemistry, industrial chemistry, polymers • Material science • Semiconductors, photovoltaic materials • Life science (human, animal and plants : biology, biochemistry, biophysic, virus, tumour...) • Geology and mineralogy, gemmology • Nuclear science, isotopic effects • Forensics sciences, forensic science laboratories : see dedicated page • Art, archeology, paints, pigment, stained-glass windows, earthenwares, potteries, inks and many
more.
Detailed data informations obtained from a Raman spectrum
• Lines position give informs about compound nature, by comparition with databases. o Variations of force constant
Strains induce a frequency shift from the standard value. If the material or the molécule is compressed, the frequency shift is positive. The force constant and the frequency increase, and vice versa.

o Isotopic effects
The isotopic effects concern the nucleus of atoms that make up the compound. Two atoms are called isotopes they have the same number of protons. The number of protons in the nucleus of an atom is designated by the atomic number. Two isotopes have the same atomic number. What distinguishes them is that they have a different atomic mass. The atomic mass of an atom is the number of nucleons that contains the nucleus of the atom. The atomic mass difference is due to a different number of neutrons N.
One can cite the example of the widespread natural carbon-12 12C and carbon-13 13C.
Raman spectroscopy can reveal the relative proportion of isotopes using the mass of each of them as has been shown a section of the harmonic oscillator. For the same vibration mode, there are as many lines in the Raman spectrum of the compound as there are isotopic combinations (2 isotopes = 3 combinations).
• Ratio between the various peaks intensity informs about the realative composition of the compound sample. With organized structures (like crystals), the ratio informs about directionnal effects (polarised measurements).
• Wide at half-maximum informs in general about the desorder factor, composition homogeneity or crystalline quality of a structured material.
Mapping informations from Raman imaging
The new generation of confocal Raman microscopes offers a non-destructive and non-contact method of sample analysis at the sub-micron level.
More particularly, Raman imaging provides the spatial distribution of the various molecular species within the sample, making it possible to produce fast and accurate chemical images.
• Chemical component distribution • Phase mapping and polymorph identification • Micro-analysis of stress and molecular orientation • Identification of functional groups in organic and biological samples
According to the reported parameter : peak position, integrated intensities, width at half-maximum, Raman imaging informs about composition, stress, relative abundance or crystalline quality.

Raman image of a pharmaceutical tablet showing the spatial distribution of the different components and their corresponding Raman spectra.
Shift of the silicon Raman peak, ∆ω, from the stress free frequency as a function of the position on 3 µm wide active square Si region (left) and line (right) isolated by PBLOCOS.
Combination with multiple laser wavelengths
Depth profiles and surface isolation are best resolved using the true confocal Raman microscope and multiple laser wavelengths.

Spectra recorded at 325, 488, 633 and 785 nm on structure of Si/SiGe/ on Si wafer. The relative Ge content in the constant Si1-xGex layer is calculated from the visible Raman spectrum and the strain of the cap Si layer is derived from the UV Raman spectrum.

Carbon nanotube (SWCNT and MWCNT) characterisation by exciting at different wavelengths allows us sweep several resonance conditions to probe the range and distribution of SWCNT's diameters.
Illustrated here are Radial Breathing modes and G bands of a SWCNT.
MicroRaman and microphotoluminescence laser induced
By the nature of the process, laser excitation induces not only Raman effect, but also photoluminescence characterized by lines, bands or continuum.

It is verified experimentally and theoritically that laser excitation by IR or red light induces less photoluminescence than visible or UV light.
Visible photoluminescence measured with a confocal Raman microprobe have similar advantages for spatial and spectral resolution as for microRaman.
The result of all this is that Raman effect and photoluminescence can be recorded simultaneously during the same laser shoot.
Raman spectroscopy is commonly used in chemistry, since vibrational information is specific to the chemical bonds and symmetry of molecules. Therefore, it provides a fingerprint by which the molecule can be identified. For instance, the vibrational frequencies of SiO, Si2O2, and Si3O3 were identified and assigned on the basis of normal coordinate analyses using infrared and Raman spectra. The fingerprint region of organic molecules is in the (wavenumber) range 500–2000 cm−1. Another way that the technique is used is to study changes in chemical bonding, as when a substrate is added to an enzyme.
Raman gas analyzers have many practical applications. For instance, they are used in medicine for real-time monitoring of anaesthetic and respiratory gas mixtures during surgery.
In solid-state physics, spontaneous Raman spectroscopy is used to, among other things, characterize materials, measure temperature, and find the crystallographic orientation of a sample. As with single molecules, a given solid material has characteristic phonon modes that can help an experimenter identify it. In addition, Raman spectroscopy can be used to observe other low frequency excitations of the solid, such as plasmons, magnons, and superconducting gap excitations. The spontaneous Raman signal gives information on the population of a given phonon mode in the ratio between the Stokes (downshifted) intensity and anti-Stokes (upshifted) intensity.

Raman scattering by an anisotropic crystal gives information on the crystal orientation. The polarization of the Raman scattered light with respect to the crystal and the polarization of the laser light can be used to find the orientation of the crystal, if the crystal structure (to be specific, its point group) is known.
Raman active fibers, such as aramid and carbon, have vibrational modes that show a shift in Raman frequency with applied stress. Polypropylene fibers also exhibit similar shifts. The radial breathing mode is a commonly used technique to evaluate the diameter of carbon nanotubes. In nanotechnology, a Raman microscope can be used to analyze nanowires to better understand the composition of the structures.
Spatially offset Raman spectroscopy (SORS), which is less sensitive to surface layers than conventional Raman, can be used to discover counterfeit drugs without opening their packaging, and for non-invasive monitoring of biological tissue. Raman spectroscopy can be used to investigate the chemical composition of historical documents such as the Book of Kells and contribute to knowledge of the social and economic conditions at the time the documents were produced. This is especially helpful because Raman spectroscopy offers a non-invasive way to determine the best course of preservation or conservation treatment for such materials.
Raman spectroscopy is being investigated as a means to detect explosives for airport security.
Raman spectroscopy has also been used to confirm the prediction of existence of low-frequency phonons in proteins and DNA greatly stimulating the studies of low-frequency collective motion in proteins and DNA and their biological functions.
Raman reporter molecules with olefin or alkyne moieties are being developed to allow for tissue imaging with SERS-labeled antibodies.
References:
� www.wikipedia.org
� Introductory Raman Spectroscopy (Second edition)-Elsevier, 2003 Author: John R. Ferraro, Kazuo Nakamoto and Chris W. Brown
� Introductory Raman Spectroscopy - www.thermo.com