Embed Size (px)
Citation preview

Measuring Up to the
Measurement Problem
The role of statistics in evidence-based policy-making
Christopher Scott London School of Economics
January 2005
Contents 1. Executive summary......................................................................................... 1 2. Introduction .................................................................................................... 4 3. What does evidence-based policy-making mean ?......................................... 5 4. Why is evidence-based policy-making desirable ?......................................... 6 5. What are the alternatives to evidence-based policy-making ? ...................... 7 6. Why is it so urgent to improve the evidence base of policy-making in
developing countries now ?............................................................................. 8 7. Where and when has the use of good statistics made a difference to policy-
making ?.......................................................................................................... 9 i. Achieve issue recognition ......................................................................10 ii. Inform the design and choice of policy.................................................11 iii. Forecast the future ................................................................................13 iv. Monitor policy implementation ............................................................14 v. Evaluate policy impact ..........................................................................15
8. What should be done to promote evidence-based policy-making ? .............16
i. Acknowledge and measure differences in statistical capacity among low income countries.............................................................................17
ii. Develop a country typology to identify strategic priorities..................17 iii. Elaborate National Strategies for the Development of Statistics
(NSDSs)..................................................................................................20

Examples
1. Revision of the average earnings index in Great Britain 2. The sex ratio and gender inequality in India 3. Regional poverty in Ghana 4. Tracking primary education expenditures in Uganda 5. Mapping vulnerability and poverty in Malawi 6. PROGRESA/OPORTUNIDADES in Mexico 7. Re-allocating local health expenditures in Tanzania 8. Sustainable debt management in Highly Indebted Poor Countries
(HIPCs) 9. Monitoring progress towards the Millennium Development Goals
(MDGs) 10. Data availability and HIV/AIDS projections 11. Infant mortality rates and health policy in Uganda 12. Civic monitoring of public service delivery in Bangalore 13. Food crisis and famine in Malawi 14. Mexican peso crisis and the Special Data Dissemination Standard
(SDDS) 15. An evaluation of pre-HIPC measures of debt relief 16. The abolition of wheat-flour ration shops in Pakistan 17. Vouchers for private schooling in Colombia
Tables
1. Measures of statistical capacity among developing countries

Acknowledgements
I thank Antoine Simonpietri, Tony Williams, Eric Bensel and other members of the PARIS21 secretariat for their assistance with this work, which was partly funded by the United Kingdom Department for International Development (DFID). I am grateful to Richard Llewellyn-Davies (DFID), members of the IMF Statistics Department and the staff of the Development Data Group of the World Bank for detailed comments on earlier versions of this paper. Many other people responded generously to my requests for material, without which this report could not have been written. I have not been able to include here all the examples I received for reasons of space. However, it is the intention of the PARIS21 secretariat to establish an archive where all the material gathered for this paper will be lodged. I wish to express my gratitude to the following people listed alphabetically for contributing information: Helen Abadzi, Charles Bean, Eric Bettinger, Sudharshan Canagarajah, Kevin Carey, Gérard Chenais, Gaurav Datt, Lionel Demery, Shanta Devarajan, Graham Eele, Neil Fantom, Osvaldo Feinstein, James Gordon, Charles Goodhart, Brian Hammond, Jesko Hentschel, Larry Hinkle, John Hoddinott, Stephen Howes, Jody Kusek, Peter Lanjouw, Jonathan Leape, Denise Lievesley, Richard Llewellyn-Davies, Richard Macve, Tim Marchant, Keith McKay, Lars Christian Møller, Alexandra Ortiz, Garth Parry, Robert Pember, Giovanna Prennushi, Mary Strode and Hassan Zaman. If I have forgotten anyone, my apologies. Last, but not least, I thank Chase Thomas for his careful and thorough research assistance, and the Suntory-Toyota International Centres for Research in Economics and Related Disciplines (STICERD) at LSE for providing Chase with desk space.

Acronyms
AEI Average earnings index (UK) AIDS Acquired Immune Deficiency Syndrome CIS Commonwealth of Independent States CRC Citizen report card CSO Civil society organisation DFID Department for International Development (UK) DQAF Data Quality Assessment Framework EPP Estimation and Projection Package FMR Female-to-male ratio in the population GDDS General Data Dissemination System GDP Gross Domestic Product GLSS Ghana Living Standards Survey GTIS Ground Truth Investigation Study HIPC Highly indebted poor country HIV Human Immunodeficiency Virus IDA International Development Association IBRD International Bank for Reconstruction and Development (World Bank) IFPRI International Food Policy Research Institute IMF International Monetary Fund IMR Infant mortality rate MAPS Marrakesh Action Plan for Statistics MASAF Malawi Social Action Fund MDGs Millennium Development Goals MFPED Ministry of Finance, Planning and Economic Development (Uganda) MISP Multi-annual Integrated Statistical Programme MIT Massachusetts Institute of Technology MPC Monetary Policy Committee of the Bank of England MTEF Medium Term Expenditure Framework NAFTA North American Free Trade Area NESDB National Economic and Social Development Board (Thailand) NGO Non-Governmental Organisation NPV Net Present Value NSDS National Strategy for the Development of Statistics ONS Office for National Statistics (UK) PACES Programa de Ampliación de Cobertura de la Educación Secundaria
(Colombia) PARIS21 Partnership in Statistics for development in the 21st Century PETS Public expenditure tracking survey PIDE Pakistan Institute of Development Economics PMS Poverty monitoring system PMU Poverty monitoring unit PovStat Poverty Projection Toolkit PPA Participatory Poverty Assessment PRGF Poverty Reduction and Growth Facility PRS Poverty Reduction Strategy PRSP Poverty Reduction Strategy Paper SDDS Special Data Dissemination Standard SimSIP Simulations for Social Indicators and Poverty

SMP Statistical Master Plan SNA System of National Accounts (United Nations) STATCAP Statistical Capacity Building loan (World Bank) TEHIP Tanzania Essential Health Interventions Project UDHS Uganda Demographic and Health Survey U5MR Under-five mortality rate VAM Vulnerability Analysis and Mapping WFP World Food Programme

1
1. Executive summary i. Evidence-based policy-making means that, wherever possible, public
policy decisions should be informed by careful analysis using sound and transparent data. More specifically, it may be defined as the systematic and rigorous use of statistics to:
• Achieve issue recognition • Inform programme design and policy choice • Forecast the future • Monitor policy implementation • Evaluate policy impact
ii. The international development community currently emphasises
monitoring and evaluation as the key areas where statistics should support policy-making. This paper argues for a broader approach to the relationship between data and the policy process. Policy outcomes are crucially affected by the use of statistics and statistical procedures in several upstream stages of policy-making.
iii. Criteria other than those associated with evidence-based policy-making are often used to make public choices. These alternative criteria include
• Power and influence of sectional interests • Corruption • Political ideology • Arbitrariness • Anecdote
Evidence-based policy-making is the only way of taking public policy decisions which is fully consistent with a democratic political process characterised by transparency and accountability.
iv. Strengthening the evidence base of policy-making in developing countries has become particularly crucial in the current period because of the need to
• Track progress towards the Millennium Development Goals (MDGs) and monitor advances towards the targets of Poverty Reduction Strategies (PRSs).
• Supply reliable and timely information for more sophisticated and data-demanding methods of policy analysis.
• Provide a measure of protection against risks associated with the growing convergence of policy priorities among governments of donor and partner countries.
• Respond to the revolution in information and communications technology which has weakened the public sector’s control of information and increased pressure on governments to explain and justify their actions.

2
v. Many examples can be found to illustrate the value of statistics in enhancing policy analysis, policy design and policy outcomes across a wide range of sectors in many different countries. Twelve lessons can be drawn from the case-studies examined in this report:
• Survey and Census data prompt the recognition of new policy issues (Box 3) and indicate whether current issues remain relevant (Box 2).
• Collecting and using relevant statistics can be highly cost-effective (Boxes 7 and 12) and/or generate a high benefit:cost ratio (Boxes 4, 16 and 17). This is because good statistics allow existing public resources to be used more efficiently (Box 7).
• Some state-of-the-art policies would be infeasible without access to detailed statistics, eg. targeted programmes using disaggregated spatial poverty maps derived from a household survey and a Population Census (Boxes 5 and 6).
• Not having statistics on programme performance can be extremely costly. In emergencies, it can lead to unnecessary loss of human life (Box 13). In other cases, it can lead to policies being discontinued which turn out subsequently to have been highly socially profitable (Box 17).
• Absence of data on key indicators is an obstacle to tracking progress towards the Millennium Development Goals such as halving world poverty (Box 9) and slowing the spread of HIV/AIDS (Box 10).
• Having relevant statistics, but not publishing them in a timely fashion, may increase the adjustment costs of dealing with a crisis (Box 14).
• Compliance with international standards for reporting macroeconomic data lowers borrowing costs in the primary and secondary markets for sovereign debt (Box 14).
• Policy outcomes are crucially affected by the extent to which relevant research findings are used to shape policy design (Box 6), and by the speed with which the results of monitoring are fed back into policy implementation (Boxes 11 and 12).
• Rigorous assessments of policy impact, such as those based on a randomly selected control group, can only be undertaken if evaluation procedures are built in to the initial design and implementation of a programme (Box 6).
• In order to ensure that programmes are well designed, competently implemented, regularly monitored and carefully evaluated, statisticians should become involved and remain involved from the first to the last stages of the policy process. Such involvement makes it more likely that evidence will triumph over ideology in making policy (Box 6).
• Unannounced and inadequately explained revisions to a statistical series can unsettle policy-makers by creating uncertainty. Consequently, the process by which revised statistics are published and disseminated may be as important as the revised figures themselves (Box 1).
• Several improvements in the relations between producers and users of statistics have only come about as a result of crises of confidence in
3
particular data series (Boxes 1 and 14).
vi. Low-income countries vary greatly in the quantity and quality of information available to policy-makers, and in the extent to which this information is used. Four groups of countries can be distinguished:
• Vicious circle countries • Data supply-constrained countries • Data demand-constrained countries • Virtuous circle countries
The priorities for building statistical capacity and for promoting evidence-based policy-making will vary among these different groups.
vii. This report shows clearly that better use of better statistics leads to better
policy and better development outcomes. Making the transition to evidence-based policy-making can best be achieved through formulating a National Strategy for the Development of Statistics (NSDS), which is fully integrated into national policy processes. By building on what already exists, a NSDS converts statistical priorities into a detailed, but flexible work programme over a 5-10 year period. Support of the international community in the elaboration of National Strategies for the Development of Statistics is needed because those countries most in need of better statistics are often those least able to afford them.
4
2. Introduction
I collected my figures with a purpose in mind, with the idea that they could be used to argue for change. Of what use are statistics if we do not know what to make of them? What we wanted at that time was not so much an accumulation of facts, as to teach the men who are to govern the country the use of statistical facts (Florence Nightingale)1
These words of an English nurse are as relevant today for the international development community as they were 150 years ago when she uttered them in support of her campaign to improve the appalling sanitary conditions in British military hospitals. By carefully collecting and analysing mortality statistics of men admitted to the field hospital of Scutari during the Crimean War, she was able to show that injured soldiers were seven times more likely to die from diseases contracted in the hospital, such as cholera and typhus, than from wounds received on the battlefield. On returning to England, she found that 20-30 year old soldiers living in army barracks during peacetime were twice as likely to die as men in the same age group in the general population. She used these figures to launch a campaign which revolutionised sanitary conditions in military establishments, helped transform the career of nursing and secured her election as the first female Fellow of the Royal Statistical Society. The objective of Measuring Up to the Measurement Problem is to show that good policy requires good statistics at different stages of the policy-making process, and that investment in better statistics can generate high social returns. The paper begins by defining what evidence-based policy making means (section 3), before proceeding to a discussion of why this way of taking public policy decisions is preferable to any of the alternatives (sections 4 and 5). The reasons why it is particularly important at this time to improve the evidence-base of policy-making in developing countries are set out in section 6. This is followed by the presentation of a body of material, covering macroeconomics, poverty, social sectors (education and health) and agriculture, which supports the collection and use of a variety of data to inform policy decisions (section 7). This material draws on seventeen case-studies, presented in boxes at the end of the paper, which illustrate the links between statistics and different policy-making activities. The final section of the report explores what should be done to promote evidence-based policy-making. Low-income countries vary greatly in the quantity and quality of information available to policy-makers, and in the extent to which this information is used. Therefore, a simple typology is introduced to allow different sets of priorities to be identified for different groups of countries. A National Strategy for the Development of Statistics provides a mechanism for converting these country-specific priorities into a detailed work plan for improving the National Statistical System and promoting evidence-based policy-making (section 8).
1 Quoted in Cook, E.T. (1913), The Life of Florence Nightingale, (London: Macmillan), volume 2, p.396, and cited by J.Maindonald and A.M.Richardson, This Passionate Study: a Dialogue with Florence Nightingale, Journal of Statistics Education ,Volume 12, Number 1 (2004).

5
3. What does evidence-based policy-making mean ?
Evidence-based policy-making in a democratic context means that, wherever possible, public policy decisions should be reached after an open debate which is informed by careful and rigorous analysis using sound and transparent data. More specifically, it may be defined as the use of statistics to:
i. Achieve issue recognition ii. Inform programme design and policy choice iii. Forecast the future iv. Monitor policy implementation v. Evaluate policy impact
In recent years, the international community has focussed increasingly on monitoring and evaluation as the areas where statistics should be used in support of policy-making. While this view has much to commend it, since measurement of results is essential for ensuring public accountability, this paper argues for a broader approach to the relationship between data and the policy process. In particular, it is important to realise that policy outcomes are crucially affected by the use of statistics and statistical procedures in ‘upstream’ stages of policy-making, such as issue recognition, programme design, policy choice and accurate forecasting. Each of the five policy-making activities listed above is discussed in section 7 of this report and is illustrated by means of at least one example. In order to avoid misunderstanding, it should be stressed that there is rarely a simple link between one statistic (much less a set of statistics) and the adoption of a particular policy. Even a single figure may be open to a variety of interpretations and, therefore, to a variety of policy responses. Policy-makers often draw different policy conclusions from the same set of data, owing to differences in the type of analysis undertaken and/or to differences in value judgments about policy objectives. While evidence-based policy-making may be understood as a roughly chronological sequence of activities, the production of statistics can have a less direct, but not necessarily a less important impact on policy-makers. Thus, from time to time controversies arise at both international and national level over statistical series. These debates may focus on methodological issues, such as the coverage, consistency or accuracy of different sources of data, or they may be concerned with the appropriateness or inappropriateness of particular statistics to evaluate specific policy arguments. In either case, such controversies can have a powerful indirect effect on policy-making, and indeed on electoral outcomes, by focussing public attention on particular policy issues and raising questions about different types of data. The ongoing debate over global trends in poverty and inequality is one example at the international level, while the controversy over poverty figures in India provides a comparable illustration at the national level2.
2 Deaton, A 2003 Measuring Poverty in a Growing World (or Measuring Growth in a Poor World), Working Paper 9822, NBER, July; Reddy,S.G. and T.W.Pogge, 2003 How Not To Count The Poor, unpublished paper, Columbia University; Bhalla, S.S 2002 Imagine there is no country: poverty, inequality and growth in the era of globalization, Institute for International Economics, Washington, DC; See http://www.undp.org/povertycentre/newsletters/infocus4sep04eng.pdf. for a flavour of the

6
Another situation, which is of interest for assessing the importance of specific statistics to particular groups of policy-makers, arises when data are revised. In 1998-1999, the average earnings index (AEI) of Great Britain was revised three times by the Office for National Statistics. This process of revision affected policy-making by introducing a new and significant source of uncertainty into the minds of members of the Monetary Policy Committee (MPC) of the Bank of England. It could easily have led the MPC to take inappropriate decisions on interest rates in 1998 because the data underlying a key indicator were flawed. At one point, the AEI was suspended pending further investigation by a review committee which recommended several methodological and procedural changes to the construction of the index. The experience of revising the AEI was a severe shock to statisticians and policy-makers alike. This incident led to the establishment of closer links between the Bank of England and the Office for National Statistics, which were formalised in a Service Level Agreement signed in October 1999 (Box 1). 4. Why is evidence-based policy-making desirable ?
There are two reasons why evidence-based policy-making is desirable. The first is that it enhances the transparency of policy-making. Understanding how decisions are made requires information about the procedures followed and the criteria used by policy-makers to reach decisions. Understanding why decisions are made requires disclosure of the information drawn on by policy-makers and revelation of the arguments adduced in favour and against particular decisions3. Transparency is desirable on grounds of equity and efficiency. In a democracy, citizens have the right to know how and why decisions are taken which affect their lives. Such knowledge is an essential part of good governance. Transparency affords protection against decision-making processes being captured by sectional interests or becoming tainted by corruption (see next section). Furthermore, if the policy-making process is transparent, private firms and households can form reasonable expectations about how the government is likely to behave under given circumstances in the future. This provides some assurance for taking rational decisions on savings and investment, and thereby promotes the efficiency of capital markets which in turn contributes to faster economic growth. The use of evidence in each of the five policy-making activities identified in the previous section enhances transparency. Thus, if a household survey reveals that poverty is falling at the national level but rising in two regions, this makes clear why an anti-poverty programme may include an element of geographical targeting. If a forecasting model indicates that a country’s poverty reduction target is infeasible for all plausible growth and inequality scenarios in the future, it becomes evident why some policy-makers may recommend changing the target.
global debate; Deaton,A and V.Kozel 2004 Data and dogma: the great Indian poverty debate, unpublished paper, Princeton University/World Bank. 3 The Minutes of the monthly meetings of the Monetary Policy Committee (MPC) of the Bank of England provide a good illustration of transparency both with respect to the data and the arguments used to set the base rate of interest in the UK.

7
Evidence-based policy-making enhances the accountability of policy-makers, which is the second reason why it is desirable. A central tenet of democracy is that civil servants should be accountable to politicians, and that politicians should be accountable to the electorate. Both types of accountability require good data to be effective. Politicians use statistics to shape party manifestos which are the objects of choice presented to the electorate. The availability of information to citizens allows them to monitor the performance of the governing party during its period of office and to hold it to account at the next election. Between elections, members of the legislature, interest groups and the media use statistics either to support or criticise the government. For their part, members of the government hold senior civil servants to account by demanding empirical support for the design of particular policies, by requiring evidence that programmes are being implemented as planned and by requesting information on the impact of specific interventions.
5. What are the alternatives to evidence-based policy-making ?
To argue in favour of evidence-based policy-making as a way of taking decisions is to acknowledge that other criteria can be, and often are, used to make public choices. These alternative criteria include i. Power and influence of sectional interests: public policy decisions are
reached according to due legal and administrative process, but are made to satisfy particular lobbies, interest groups or elites.
ii. Corruption: policy-makers make decisions which favour particular individuals or groups in order to maximise their private gain. The policy-maker violates constitutional norms and receives illegal payments in cash or kind4.
iii. Political ideology: policy-makers are guided in their decisions by adherence to particular political beliefs or ideologies which are relatively impervious to empirical evidence. A common case of ideological policy-making occurs when an incoming administration terminates those programmes most closely associated with the previous government for no other reason than this political association. Box 17 illustrates this in Colombia, while Box 6 shows how in Mexico an evidence-based evaluation overcame this force of political ideology.
iv. Arbitrariness: in the absence of clear criteria by which to take decisions, or of any process of accountability, policy-making may be arbitrary. One case is treated one way, but a virtually identical case is treated differently, eg. one household which meets the eligibility criteria of a targeted programme is admitted as a beneficiary, while another eligible household is excluded. This violates the principle of horizontal equity according to which like individuals should be treated the same.
4 Research at the World Bank Institute (WBI) suggests that at least $1 trillion dollars is paid annually in bribes worldwide. See http://www.worldbank.org/wbi/governance/ and http://www1.worldbank.org/publicsector/anticorrupt/index.cfm.
8
v. Anecdote: on occasions, legislators use anecdotes recounted by colleagues, family members, friends or constituents as a basis for making policy. A common consequence of this, no doubt well-intentioned, mode of taking decisions is that relatively minor issues, affecting a small number of people, may achieve unwarranted prominence in the policy making process5.
The case for evidence-based policy-making rests on the argument that it is the only way of taking public policy decisions which is fully consistent with a democratic political process characterised by transparency and accountability. The key role of good statistics in evidence-based policy-making was acknowledged both at the International Conference on Financing for Development in Monterrey (2002) and at the Conference on Managing for Development Results in Marrakesh (2004). 6. Why is it so urgent to improve the evidence base of policy-making in
developing countries now ? Strengthening the evidence base of policy-making in developing countries has always been important, but it has become particularly crucial in the current period as a result of several factors. Firstly, there is an urgent need to track progress towards the Millennium Development Goals (MDGs) and, in the case of Highly Indebted Poor Countries (HIPCs) and IDA-eligible countries, to monitor advances towards the targets of their Poverty Reduction Strategies (PRSs). Ten years remain before the time horizon set for most of the MDGs in 2015, but data are still missing for many key indicators in many countries. No less than 55 countries lack information on the share of the population living in poverty, ie. subsisting on less than US$1 per day. Nearly double that number of countries (100) have no data on poverty trends, so that progress towards the first MDG cannot be tracked directly over time (Box 9). Secondly, in recent years there has been a rapid development and dissemination of more sophisticated and data-demanding methods of policy analysis. These include a wide range of microeconomic and macroeconomic models using quantitative data, as well as a variety of participatory techniques based on the collection of qualitative information6. As knowledge of these new methods spreads and the skills required to use them are more widely diffused, so the demand for many different types of data will grow very rapidly. At present, there is a serious danger that national statistical offices, line Ministries and other government agencies charged with producing official data will be unable to meet this growing demand. Indeed, there is a risk that in trying to satisfy new data needs arising from recent policy initiatives (such as the PRSP process) with insufficient resources, the quality of certain foundational statistics, such as Population Censuses and price data, may suffer. Thirdly, the costs of making faulty public policy decisions in the poorest countries has increased in recent years as a result of changes in the level and allocation of foreign aid. The real value of annual net disbursements of overseas development assistance
5 Something similar can often be observed in media coverage of a news item where the views of a single member of the public are allocated valuable column space or air time. The results of a non-random sample of one individual are closer to anecdote than evidence. 6 The World Bank’s ‘Toolkit for Evaluating the Poverty and Distributional Impact of Economic Policies’ provides a good overview of microeconomic and macroeconomic techniques available for the formulation, simulation, monitoring and evaluation of poverty reduction policies.

9
has risen each year since 1998 after declining by more than 20% between 1990 and 19977. There has also been a slow but steady increase in the share of bilateral aid flows directed to budget support rather than to specific projects. Consequently, more donors’ and recipients’ resources are vulnerable now to bad public policy decisions than at any time in the last ten years. The growing consensus on policy priorities among donors has also increased the level of risk. This has led to external funds becoming increasingly concentrated on the same (few) sectors, such as governance, health and education. Closer alignment among donors has several positive aspects, but this emerging policy convergence must be based on good data and serious analysis. Before committing funds to budget support, donors must be confident that partner governments have in place effective mechanisms to track public expenditures, monitor policy implementation and evaluate policy impact. Finally, recent advances in information and communications technology, such as the Internet, mobile telephony and FM radio stations, have made more urgent the need to improve evidence based policy-making in developing countries. These technological changes have weakened the control exercised by governments and international organisations over the production and dissemination of information. The private sector and civil society have taken full advantage of these new opportunities to raise new policy issues, debate current and proposed policy initiatives, disseminate information, mobilise public opinion and engage with governments. The greater reach of information and the increased speed with which it can be transmitted has generated new and varied demands for data. This increases the pressure for evidence-based policy making as governments are drawn into a broader and more intense dialogue with the private sector and civil society, and are increasingly challenged to explain and justify their actions. 7. Where and when has the use of good statistics made a difference to policy-
making ?
This section provides examples for each of the five types of policy-making activity listed in section 3. These illustrations include cases where the use of good statistics had a positive effect on the policy process, as well as situations in which either the absence of data, or a failure to use available information had a negative effect on policy-making. While some examples seek to demonstrate a causal link running from data to policy, others illustrate how causation may run in the opposite direction. The emergence of new policy priorities can and should create a demand for new data to monitor programme implementation and policy impact8. Detailed descriptions of each example are provided in boxes at the end of the paper where references to further reading are provided. Up to four examples are presented for each type of policy-making activity.
7 DAC-OECD, Table 1 8 Certain policy decisions may also distort some kinds of data. Thus, where domestic relative prices diverge from world relative prices as a result of deliberate policies such as rationing or import tariffs, the value of GDP at world prices may diverge substantially from the value of GDP at domestic prices.

10
i. Achieve issue recognition
The first stage in the process of policy formation occurs when the appearance of a statistic reveals some aspect of social or economic life which had until then remained hidden from the general public and from policy-makers. Once this information is revealed, a variety of groups such as civil servants, non-government organisations (NGOs), development agencies or the media lobby for a new policy issue to be recognised and addressed. In some instances, these revelatory statistics are thrown up in the course of routine data gathering exercises. Population Census figures on the ratio of females to males (FMR) in India have played, and continue to play, an important role in giving recognition to gender inequalities in that country (Box 2). Household surveys can reveal large regional differences in living standards at one point in time and demonstrate that trends in poverty can vary widely across regions over time. Such information was an important input into policy-making in Ghana between 2000 and 2003 (Box 3). On other occasions, revelatory figures emerge from a study motivated by a specific prior hypothesis. In the early 1990s, it was believed in Uganda that a prime cause of poor public service delivery was the government’s failure to ensure that budgeted funds reached frontline agencies, such as health clinics and schools. However, no management instruments or procedures were available to check whether such leakages occurred. So, the World Bank sponsored a public expenditure tracking survey (PETS) in 1996 to establish what proportion of budgeted funds for education and health actually reached their intended destination. The results of this pioneering study showed that only 13% of the non-wage funds allocated for such items as the purchase of textbooks reached the schools. The remaining 87% either disappeared or was spent by district officials for other purposes. These findings were widely disseminated and led to the public display of information, at local level, on the funds approved for, and received by each school. The effect of introducing these measures to promote transparency and accountability was revealed by two follow-up PETS. These surveys indicated that the proportion of non-wage funds reaching the schools rose from 13% between 1991 and 1995, to between 80% and 90% in 1999 and 2000 (Box 4). Unfortunately, there are occasions when despite the collection of data which indicate that a serious problem is emerging, this evidence is ignored by both policy-makers and donors. In the second half of 2001, the Malawi office of Save the Children (UK) accumulated a growing body of evidence that serious food shortages were emerging in several regions of the country. The organisation began an emergency preparedness programme and warned policy-makers in November that a food crisis was imminent. The government and donors were sceptical on the grounds that the official crop production statistics gave no cause for alarm. Only after a second survey in two districts by Save the Children in March 2002 showed a rapid increase in malnutrition since December 2001 were donors galvanised into action. However, by this date it was too late to avoid the onset of famine which may have led to several thousand deaths (Box 13).
11
ii. Inform the design and choice of policy Once a policy issue has been identified, the next step is to undertake some analysis, so that the extent and nature of the problem can be understood. This understanding provides the basis for any subsequent policy recommendations. Statistics and statistical procedures can make at least four contributions to this stage of evidence-based policy-making:
a. Map the physical and economic landscape
For many policy interventions, the most basic requirement is accurate spatial data. This arises in programmes which use geographic targeting to select the locations for public works projects aimed at reducing vulnerability and poverty. Various mapping methodologies exist for this purpose. The World Food Programme (WFP) uses Vulnerability Analysis and Mapping (VAM) which uses a variety of different types of information, such as food insecurity, poverty, malnutrition, school enrolment, HIV/AIDS prevalence and incidence of natural disasters to choose project sites. Other techniques combine Population Census data with survey information on household consumption expenditure to produce highly spatially disaggregated poverty maps which may be used to rank localities by need. These orderings provide criteria for policy-makers to determine expenditure priorities across space from a limited budget. Although poverty is not perfectly correlated with vulnerability, the WFP selected project sites in Malawi which appear to have been efficiently targeted to reduce poverty. However, this conclusion depends crucially on the accuracy of the 1998 Population Census figures, which have been disputed. When the results of a community-mapping study (GTIS) conducted in 1999-2000 were scaled up to the national level, it was estimated that there were 2.78 million households living in rural Malawi. These estimates contrast with those of the 1998 Population Census which indicated a rural population of 1.95 million households. If the GTIS figures are correct, and they are corroborated by at least one administrative source, the Census may have underestimated the size of the rural population by as much as 35% (Box 5).
Spatial data are also required to design and coordinate rapid and effective responses by relief agencies to natural disasters. In 2000, Mozambique suffered devastating floods which led to heavy loss of life and also destroyed crops, livestock and dwellings. Information from the country’s Population Census conducted in 1997 was used to design relief efforts, so as to ensure that international aid was allocated to best effect. Statistics played a similarly important role in Montserrat after the volcanic eruption in 1997. In this case, a survey was undertaken rapidly in the aftermath of the disaster to assess the distribution of needs on the island. Much spatial data of relevance to policy-makers is not obtained from surveys or censuses, but collected by satellites. In Nicaragua, environmental policy has been shaped by satellite observations on the extent of forest cover. Indeed, given the very limited transport and communications infrastructure in the north and east of the country, it is difficult to see how the forest area could be accurately measured by terrestrial methods alone. Satellite information also shapes agricultural policy, since these photographs reveal the location and frequency of forest fires, which are one of the few reliable indicators of where the country’s agricultural frontier is to be found at

12
a given point in time.
b. Draw on empirical research findings to shape policy
A recent example where applied research has affected policy design is the PROGRESA/OPORTUNIDADES programme in Mexico, which is aimed at reducing poverty by providing incentives to poor households to invest in their children’s health and education. In this case, cash transfers are paid to mothers rather than to fathers because studies showed that women tend to allocate a higher proportion of total consumption expenditure to food and child-related items than men. The programme also pays a higher level of grant to female pupils at secondary school than to male pupils. This provision reflects research findings that the drop-out rate among female secondary school pupils tended to be greater than that among boys (Box 6).
c. Collect and analyse data to (re-)design policy
Cost-effectiveness analysis and cost-benefit analysis have been undertaken by economists in the public sector for many years to assist policy-makers choose investment projects. In order for public health spending to have the greatest impact on reducing mortality and disability, information is required about which diseases have the largest effect on reducing the health status of a population (disease burden), and how health expenditure is allocated to combat different diseases (expenditure mapping). In the mid-1990s, rural districts in Tanzania lacked both kinds of information. An innovative pilot scheme in two areas of the country combined information on cost-effective health interventions with data on the local disease burden and the distribution of local health expenditures, in order to improve the efficiency of health spending. This evidence-based reallocation of existing public sector resources supplemented by minimal additional funds had a major impact on health outcomes in the short- and medium-term (Box 7).
d. Randomise the phase-in of policy implementation
Once a programme has been approved, financial or administrative constraints may prevent it from being implemented nation-wide in a single fiscal year. One criterion for determining when an area enters the programme is random selection. Thus, one half of the country may be chosen for coverage in the first year, and the other half is included two years later. Use of randomisation creates a control group (areas not covered by the programme) which may be compared with the treatment group (areas included in the programme) until the programme attains national coverage. This allows a rigorous evaluation of the programme’s impact to be conducted in its early years. In addition to its methodological attractions, randomisation has important political advantages as a phase-in criterion. Firstly, where it is not possible to rank individual members of the target group by clinical need or urgency of treatment, randomisation serves as an equitable rule for admission to a programme. Furthermore, when a new programme attains national coverage within a short period of time, as in the case of PROGRESA, randomisation does not raise the ethical problems which arise in other contexts. Secondly, randomisation has the virtue of transparency. So long as the selection process is truly random in practice, it is clear to all concerned how

13
admission to treatment is being decided. Randomisation was used to prioritise area coverage by PROGRESA in order to allow for rigorous evaluation of the programme, and to ensure equity and transparency. The programme was phased in over two years starting in early 1998 with coverage of 10,000 rural localities in Mexico. By early 2000, it had been implemented in 50,000 localities covering 31 states to include 2.6 million households. This was equivalent to 40% of the rural population or approximately 10% of the total population of the country (Box 5)10. During the 1990s, the Colombian government randomly selected entrants into its education voucher programme (PACES) from the pool of eligible applicants. This scheme aimed to increase secondary school enrolment among the poor by assigning vouchers to children from low-income households for use in private schools. In order to be eligible, applicants had to be entering 6th grade, be aged less than 15 years and provide evidence of living in a poor neighbourhood. Once awarded, the voucher was renewable until graduation, unless the recipient was retained in a grade. In this case, randomisation served as a transparent and equitable mechanism for eliminating excess demand for vouchers (Box 17).
iii. Forecast the future On occasions, policy-makers need to turn to more formal methods of analysis for assistance in reaching decisions. However, the value of these modelling exercises is crucially affected by the quantity and quality of available information. Central Banks use a range of sophisticated models to forecast inflation rates and output growth up to two years or more in the future. In this instance, forecasting is necessary because of the long lag between a policy intervention (a decision on interest rates) and a policy outcome (the inflation rate). Attempting to read the future is also required in order to know whether a policy measure taken to alleviate a problem in the short-run will be successful in the long-run as well. This is the motivation of the external debt sustainability analysis conducted by the IMF. In 1996, the external public debt in forty of the world’s poorest countries averaged more than four times their annual export earnings. Growing concern in the international development community over Third World debt led to the launch of the Highly Indebted Poor Countries (HIPC) initiative. This offered debt relief to the poorest countries in order to reduce their external indebtedness to sustainable levels, thereby hopefully ending the cycle of debt rescheduling. Once a given amount of relief was granted, the associated debt trajectory over time would indicate the likelihood that a country’s growth path was sustainable and that the HIPC initiative would achieve its main objective. While all forecasting is subject to uncertainty, the lack of timely, accurate and
10 Randomisation was also used by the Indian government to select one-third of village councils whose chiefs (Pradhans) were required by a 1992 law to be women. See Duflo,E and R.Chattopadhyay 2004 Women as Policy-Makers: Evidence from a Randomized Policy Experiment in India, Econometrica, 5, vol.72
14
consistent macroeconomic statistics makes such exercises more hazardous than would otherwise be the case. The overwhelming majority of HIPCs are located in Sub-Saharan Africa, but only eight countries in the region covering 11% of the regional population and 29% of regional GDP are considered to have implemented the UN System of National Accounts (SNA) methodology (1993). This is the lowest rate of compliance of any region in the world and suggests that improving the quality of macroeconomic statistics in Sub-Saharan Africa should be a high priority (Box 8). When a government is committed to attaining targets in the future, forecasting models allow an assessment of whether these targets are likely to be met. Programmes, such as PovStat and SimSIP developed by the World Bank, allow the feasibility of poverty reduction targets to be assessed against a range of reasonable assumptions concerning growth rates and changes in income inequality. However, a lack of baseline data or of information on trends is a serious impediment to implementing a target-driven development strategy. Many countries do not have the statistics which would allow them to track progress towards the Millennium Development Goals (MDGs), such as halving the prevalence of underweight children aged less than five years and ensuring that all pupils complete a full course of primary schooling (Box 9).
Forecasting is of paramount importance when a country is afflicted by the outbreak of a serious disease. The authorities need to know how quickly it is likely to spread among the population in order to design appropriate counter-measures. Having access to accurate data on disease prevalence in the early stages of an epidemic is crucial to obtaining reliable forecasts of future prevalence. In the case of HIV/AIDS, much of the debate has focussed on how the process of disease transmission is modelled. However, the paucity of data with which to calibrate the models is an equally serious problem. For most of the last decade, the information on current levels of HIV/AIDS prevalence in Southern Africa has been drawn from sentinel surveillance systems which monitor infection rates among pregnant women aged 15-24 attending pre-natal clinics. Most of these clinics are located in urban areas, while most of the population live in rural areas which are beyond the reach of many official statistics, particularly those on morbidity and mortality (Box 10).
iv. Monitor policy implementation Once policies are being executed, information is required by policy-makers to monitor inputs, outputs and outcomes associated with the policies. Some information is available at frequent intervals, such as administrative data which are often collected quarterly or even monthly. Other information appears only every 3-5 years in the case of surveys, or every 10 years for Population Censuses. Careful monitoring can reveal when key indicators are going off-track, which prompts further investigation leading to a change of policy. Just such a sequence occurred in Uganda after a Demographic and Health Survey revealed that the infant mortality rate had not changed between 1995 and 2000, despite the country’s experience of rapid economic growth and declining poverty. Further analysis disclosed a variety of explanatory factors, including a decline in vaccination coverage. Following discussions among policy-makers, the immunisation programme was revitalised (Box 11).
15
Civic monitoring of goods and services delivered by the state can also improve public sector performance. This can be achieved through the use of Citizen Report Cards (CRCs) which are a type of survey questionnaire administered to a random sample of households. Utilisation of CRCs by the Public Affairs Centre in Bangalore led to a marked increase in levels of user satisfaction with the provision of water, electricity, transport and hospital treatment over a period of five years during the 1990s. The results of the first survey indicated that a large proportion of respondents were dissatisfied with the services they received. In response, some agencies introduced new training programmes to enhance their staff’s skills and responsiveness to customers, while others changed their procedures to increase transparency and reduce corruption. While additional factors, such as new technology, may have contributed to improving public sector service delivery over this period, there exists strong evidence that the CRCs played a decisive role (Box 12). Unfortunately, policy-makers do not always receive a flow of timely and accurate information warning them of impending problems. In Malawi, a combination of erroneous food production estimates, a lack of transparency over management of the Strategic Grain Reserve, and official scepticism over statistics produced by civil society led policy-makers to be caught unprepared by the food crisis of early 2002. The resulting famine may have led to several thousand deaths (Box 13).
Even when policy-makers are in possession of key information, a failure to disclose it can make a bad situation worse. In the weeks before the devaluation of the Mexican peso in December 1994, the Bank of Mexico published figures on foreign currency reserves very irregularly. This prevented foreign investors from assessing accurately the problems facing the exchange rate regime. While disclosure of this information would not have prevented the currency crisis, it would have facilitated a smoother process of adjustment. The experience of the Mexican devaluation was an important factor leading the IMF to establish the Special Data Dissemination Standard (SDDS) in 1996 to improve the reporting of macroeconomic data. Adherence to this standard should allow the true extent and nature of macroeconomic problems to be detected earlier and may ultimately diminish the impact of future crises. In addition, there is now a cumulative body of evidence to show that the commitment to greater transparency implied by subscription to the SDDS lowers developing countries’ borrowing costs in both the primary and secondary markets for sovereign debt (Box 14).
v. Evaluate policy impact Measuring the impact of a policy intervention is more methodologically and informationally demanding than monitoring policy implementation. Evaluation involves attributing causation, which requires that the effects of a policy be isolated and quantified. This can only be done rigorously if an appropriate counterfactual is identified. The ideal experimental context for an evaluation is where subjects are randomly assigned to treatment and control groups. Only in this situation can problems of selectivity bias be avoided. Randomisation is rare in evaluations of public policy for a variety of reasons. This is what makes the few cases which do exist, such as the assessment of PROGRESA (Box 6) or PACES (Box 17), so valuable.
16
In the absence of a counterfactual, researchers are forced to use more naïve methods. Thus, a recent assessment of the impact of pre-HIPC measures of debt relief by 1997 compared the level of indebtedness and a range of policy indicators in a group of countries all of which were later classed as HIPCs with (i) debt levels in the same group of countries in 1989 before debt relief was granted, and (ii) policy indicators among other Less Developed Countries over the same period. This evaluation concluded that debt relief may result neither in a reduction of external indebtedness in the medium to long run, nor in improved economic performance by debtor countries. However, even naive evaluations require high quality macroeconomic data which are consistent over time and across countries for a wide range of different indicators (Box 15). Wheat-flour ration shops in Pakistan were finally abolished in 1987 after an evaluation undertaken by IFPRI in collaboration with the Pakistan Institute for Development Economics (PIDE). The study demonstrated that poor consumers obtained few benefits from the shops and that these benefits could be supplied at a lower resource cost. A follow-up study in 1997 established that this piece of evidence-based policy analysis was instrumental in getting the ration shops closed down (Box 16). A final example illustrates the dangers of closing down a programme before a rigorous impact evaluation has been conducted. In 1991, the government of Colombia launched the PACES programme which aimed to increase secondary school enrolment among the poor by assigning education vouchers to children from low-income households. Since demand for vouchers exceeded supply, many of the vouchers were allocated randomly among eligible applicants. When a new administration took office in 1998, the programme was discontinued in the light of what were seen at the time as disappointing results. However, subsequent research which exploits the randomised selection of applicants into the programme to create a control group, has shown that PACES had a positive impact in both the short-term and medium-term, and proved to be very cost–effective (Box 17). These examples demonstrate the importance of incorporating an explicit mechanism for evaluating policy impact into the design of a programme. Statisticians should be involved in the policy making process at an early stage to advise on how the impact of a new policy will be assessed. In some instances, this assessment may need to be undertaken at regular intervals over many years. 8. What should be done to promote evidence-based policy-making ? The starting point for any discussion of how to promote evidence-based policy-making must be to acknowledge that low-income countries vary greatly in the quantity and quality of information available to policy-makers, and in the extent to which this information is used. Measuring the quality of data is easier than measuring the use of data, so a supply side approach provides the simplest way to demonstrate the existence of statistical heterogeneity among poor countries.

17
i. Acknowledge and measure differences in statistical capacity among low income countries
The broadest and most readily available indicator of the quality of statistics in developing countries is subscription to the IMF’s General Data Dissemination System (GDDS) or to the Special Data Dissemination Standard (SDDS). The GDDS was introduced in 1996 and is open to, but not obligatory for, all Fund members. It provides a framework within which countries can plan to improve the quality of macroeconomic and financial data (including the real, fiscal, financial and external sectors), as well as selected socio-demographic indicators (including population, health, education and poverty). The GDDS has four dimensions: (i) data coverage, periodicity and timeliness; (ii) data quality; (iii) integrity of data, and (iv) access to data by the public. A valuable feature of the GDDS is that it promotes coordination among the various agencies responsible for the production and dissemination of official statistics. Inter-institutional rivalries and mutual ignorance of different aspects of data collection are damaging to evidence-based policy-making. This is a problem in several countries which are currently attempting to establish or consolidate systems of poverty monitoring. While the GDDS does not at present cover the full range of official statistics, its basic approach, which emphasises transparency of statistical practices and a commitment to improving these practices over time, could be extended to other data sets. Therefore, the GDDS provides a solid foundation on which to build a more ambitious and wide ranging national programme to develop statistics11. Table 1 shows the extent of participation in the GDDS and SDDS among three groups of countries: low income countries, IDA-eligible countries and PRGF-eligible countries. In each case, the pattern is similar. Around two-thirds of countries subscribe to the GDDS, a handful of countries have met the more exacting standards of the SDDS and over one quarter of countries remain outside both systems of standards. This evidence of wide variations in statistical capacity among countries with similar income levels is confirmed by research undertaken for IDA by the World Bank (bottom row of Table 1). The range of variation in the World Bank’s statistical capacity score among IDA-eligible countries is 76 percentage points, or three-quarters of the maximum amount of variation allowed by the index12.
ii. Develop a country typology to identify strategic priorities If low income countries vary so widely with respect to their statistical capacity, it is clear that specific priority actions for promoting evidence-based policy-making are also likely to vary across countries. However, it would be a mistake to believe that each country is so utterly different to every other that their problems are unique and that no guide-lines can be offered to support the collection, dissemination and use of
11 As of November 2004, 77 countries participated in the GDDS and 57 countries subscribed to the SDDS, which was developed for IMF member countries having or seeking access to international capital markets (see Box 14). The SDDS has the same dimensions as the GDDS and covers the same data sets, except for socio-demographic statistics which are excluded. The SDDS is more prescriptive and the compliance criteria are more exacting. 12 The World Bank’s measure of national statistical capacity has three dimensions: statistical practice, data collection and data availability.
18
statistics in public policy. International variation in statistical competencies can be addressed by introducing a simple typology of countries which incorporates differences in both the demand for as well as the supply of statistics. Different types of country will have different priorities for promoting evidence-based policy-making and these differences will be reflected in their respective National Strategies for the Development of Statistics (NSDS). It may be useful to distinguish four types of country:
a. Vicious circle countries: Statistics are weak and policy-makers make little use of them. Evidence-based policy-making is not practised which results in poor policy decisions and poor development outcomes.
In vicious circle countries, weak production and funding of statistics coexists with weak use of statistics. If statistics are weak, which means coverage is limited, accuracy is poor, and/or dissemination is slow, then policy-makers make little use of statistics for taking decisions. Conversely, if policy-makers make little use of such statistics as are available, statisticians have no incentives to improve the quantity and quality of their figures. This symmetry gives rise to a stable equilibrium. Given what statisticians are able and willing to do, policy-makers do not wish to change their course of action, and vice-versa. This is the situation in many of the poorest developing countries, particularly in Sub-Saharan Africa. In this case, it is necessary to adopt measures which will simultaneously increase both the demand and supply of statistics, as well as improve the dialogue between producers and users of data.
b. Data supply-constrained countries: although statistics are weak, they are increasingly used by policy-makers for a variety of purposes. However, data deficiencies reduce the quality of decision-making which results in poor development outcomes.
This situation implies an uncomfortable life for both statisticians and policy-makers, at least in the short-run. Statisticians feel aggrieved because greater use of weak statistics by policy-makers reveals the deficiencies of official data and exposes them to criticism as a result. For their part, policy-makers resent being held to account on the basis of inadequate data. For these reasons, this state of affairs is likely to be unstable. Either the quality of statistics is improved to meet the increased demand, or policy-makers reduce their demand for statistics and the country relapses into a vicious circle. While this scenario contains risks, it also provides opportunities because it is often more difficult to raise policy-makers’ demand for information than to increase the supply of statistics. The priority is to adopt measures to increase the quantity and quality of statistics, which will require additional funding, as well as to improve the dialogue between producers and users of data.
The challenge is to strike a balance between generating improvements to statistics in the short-run, such as quicker publication of a more disaggregated indicator, while laying the foundations for better performance of the National Statistical System in the long-run, say through reorganising the National Statistics Office. What should be avoided are actions which offer short-run benefits, but generate long-run costs. Such a trade-off is made when overseas consultants are hired to conduct a rapid once-off

19
survey, and as a result human capital fails to be accumulated in the National Statistics Office, so domestic capacity is not built.
c. Data demand-constrained countries: the quantity and quality of statistics are improving, but they are not used for decision-making because policy-makers lack the incentives and/or the capacity to utilize them. This results in poor policy design and poor development outcomes.
This case may arise after a supply-led strategy to improve statistics. Since producing better statistics requires more effort than producing worse statistics, statisticians become frustrated if these better statistics are not used. For their part, policy-makers are at the very least wary of (or may even actively dislike) having more and better figures pushed at them when these data may not support decisions they have taken or wish to take. So, this state of affairs is also likely to be unstable. Either policy-makers are induced to increase their use of sound statistics, or statisticians become demoralised and the country relapses into a vicious circle. In this case, priority should be given to the adoption of measures to increase the demand for statistics, as well as to improve the dialogue between producers and users of data. Various points of entry may exist for promoting greater use of statistics. Members of the Legislature can be advised of the full range of information available for closer Parliamentary scrutiny of the Executive. This includes figures used in the preparation of the budget and Medium Term Expenditure Framework (MTEF), as well as data referring to how public funds are spent (Box 4). The National Statistics Office might also consider organising workshops for the media and civil society to explain what key indicators actually measure and how they are compiled. This should raise public understanding of, and interest in statistics, while decreasing the misuse of figures by the Press.
d. Virtuous circle countries: statistics are improving and are being increasingly used for decision-making. This results in better policy design and better development outcomes.
In virtuous circle countries, the production of good (or at least improved) statistics is matched by their widespread (or at least increased) use in decision-making. These two processes mutually reinforce each other to provide the necessary and sufficient conditions for evidence-based policy-making.
This case serves more as a goal to be achieved, even in some developed nations, than as a description of events in a particular group of countries. Nevertheless, it provides a useful benchmark against which to compare the other three cases. Developing a culture of evidence-based policy-making is a slow process which will take years. Where this situation is approximated in practice, it is clear that good statistics is an integral part of good governance, including corporate governance. Strengthening the democratic process by requiring transparency and accountability in public sector decision-making, together with the establishment of clear accounting standards and an effective regulatory framework for the private sector are essential elements for sustaining a virtuous circle linking statisticians to policy-makers.

20
iii. Elaborate National Strategies for the Development of Statistics (NSDSs)
PARIS21 aims to assist countries in each of the four situations described above by supporting the preparation of National Strategies for the Development of Statistics (NSDS). A strategy is both a product and a process. The product is a document which provides an assessment of the current status of the National Statistical System (NSS), sets out the objectives for improving the NSS over a 5-10 year period and outlines the actions required in the short- and long-term to achieve these objectives. A NSDS will address relevant legal and institutional issues, identify technical assistance and training needs, estimate the costs of implementing the strategy and explain how these costs will be financed13. As a process, the elaboration of a NSDS will be consultative and participatory in order to mobilise support, build ownership and obtain political commitment from all stakeholders to reform and improve the statistical system. Those involved will include a variety of user groups, such as government agencies, the private sector, civil society, the media, donors and international organisations, as well as several producers of statistics, such as the National Statistical Office, the Central Bank and line Ministries. A NSDS should build on what already exists. On the supply side of the market for official data, this includes what countries have achieved through the GDDS, SDDS, the Data Quality Assessment Framework (DQAF)14, and other initiatives such as the Statistical Master Plans (SMP) promoted by the World Bank15, and the Multi-annual Integrated Statistical Programmes (MISP) developed by Eurostat16. On the demand side, several countries have prepared, or are in the process of preparing Poverty Monitoring Master Plans (PMMP) which outline the actions required in the short- and long-term to improve monitoring and evaluation of Poverty Reduction Strategies (PRS). Integrating the contents of a PMMP with a NSDS offers both opportunities and challenges. A PMMP articulates clearly the needs of a large number of users for a broad range of data. Since a NSDS should be demand-focussed, it may be helpful to build up a National Strategy from a PMMP when such a document exists. PMMPs focus on a limited set of official statistics, such as those relating to poverty, health, education, housing, employment, crime and governance17. In many cases, the existing
13 PARIS21 Secretariat, Making the Case: National Strategy for the Development of Statistics (NSDS), 12/10/04; PARIS21 Secretariat, National Strategy for the Development of Statistics (NSDS) Essentials, 21/10/04; PARIS21 Secretariat, A Guide to Designing a National Strategy for the Development of Statistics (NSDS), 21/10/04. 14 The DQAF is a methodology for assessing data quality that covers institutional environments, statistical processes and attributes of statistical products. It is used by IMF staff in the preparation of Reports on the Observance of Standards and Codes (ROSCs) which are appraisals of selected macroeconomic statistics. 15 A SMP covers the entire statistical system of a country and identifies interventions which provide the basis for a STATCAP loan from the World Bank. This loan programme aims to build statistical capacity in borrowing countries. 16 MISP has been developed by Eurostat in its work with East European countries and members of the Commonwealth of Independent States (CIS). 17 Note that some of these topic areas, such as poverty, health and education, are included in the GDDS, while others, such as crime and governance, are not. The GDDS for its part includes

21
(or first-generation) indicators of these different dimensions of human welfare are inadequate or incomplete, so a PMMP offers a time line according to which these indicators can be replaced or complemented by superior second-generation indicators18. Identifying second generation indicators provides an important mechanism whereby users of data, and policy-makers in particular, can articulate their demands for improving the quality of statistics over time. Integrating the contents of a PMMP with a NSDS would also highlight the importance of administrative data collected by the management information systems of line Ministries. In many HIPCs and IDA-eligible countries, these statistics provide the basis of many, if not most PRSP indicators, but these data are often acknowledged to be of lower quality than the figures derived from Censuses and surveys. Raising the profile of routine statistics by including this type of information within a NSDS would be a positive development. However, formulating a NSDS in such a way as to accommodate all the needs of stakeholders in the poverty monitoring system poses several challenges. Firstly, while it is unclear whether qualitative information would be covered by a NSDS, data produced by participatory methods, such as participatory poverty assessments (PPAs), are generally considered to be an integral part of the poverty monitoring system. This is a contentious area, but one where much innovatory work is currently being undertaken to integrate qualitative and quantitative methods of data collection19. If data produced by participatory methods are to be included within a NSDS, then staff with the appropriate skills must be recruited by the National Statistical System. Even if the collection of such data is outsourced to the private sector (consultancy firms or civil society organisations), some capacity in this area will be required by the public sector for quality control purposes.
Secondly, integrating plans for poverty monitoring into a NSDS is made more difficult by the fact that the National Statistics Office rarely, if ever, possesses the institutional mandate to manage the poverty monitoring system (PMS). Managerial responsibility for the PMS usually resides with a unit located in the Ministry of information, such as monetary indicators and financial statistics, which fall outside the scope of a PMMP. 18 First-generation (G1) indicators are those for which data currently exist so that they can be used now. However, G1 indicators may suffer from methodological weaknesses relating to relevance, definition, coverage, frequency of data collection, reliability and timeliness. Second generation (G2) indicators are not currently available, but could be produced within say two years and promise to be methodologically superior to some first generation indicators which they may replace and/or complement once they come on stream. Third-generation (G3) indicators are experimental indicators which lie outside the official poverty monitoring system and are often pioneered by civil society organisations. However, the government’s central poverty monitoring unit (PMU) should keep a list of such indicators as some of them may in time, and after a due process of appraisal, evolve to become second-generation indicators. Support indicators are indicators which will never be included in the official poverty monitoring system owing to their high degree of spatial or temporal disaggregation. However, PMU staff may well wish to have recourse to certain support indicators when attempting to explain the behaviour of first-generation indicators over time. 19 See Barahona, C and S.Levy 2003 How to generate statistics and influence policy using participatory methods in research: reflections on work in Malawi, 1999-2002, IDS Working Paper 212 (Institute of Development Studies) for one example by statisticians. Two economists, V.Rao and M.Woolcock make a case for ‘participatory econometrics’ in ‘Integrating Qualitative and Quantitative Approaches in Program Evaluation’, included in World Bank Toolkit for Evaluating the Poverty and Distributional Impact of Economic Policies (http://www1.worldbank.org/prem/poverty/psia/tools.htm ).

22
Finance (Uganda, Mongolia), the Vice-President’s Office (Tanzania) or the Secretariat of the Presidency (Honduras). Therefore, a high level of inter-agency trust and goodwill must exist to ensure the level of collaboration required for complete integration of poverty monitoring and national statistical strategies. NSDSs must take full account of these institutional factors in order to promote effective coordination between the producers and users of data. Establishing an effective institutional framework to deliver evidence-based policy-making will be a long and slow process for most countries. It is less important where and how this process begins than that it should start and be sustained over time. This report shows clearly that better use of better statistics leads to better policy and better development outcomes. Making the transition to evidence-based policy-making can best be achieved through formulating a national strategy for the development of statistics, which is fully integrated into the system of national policy making. The recently agreed Marrakech Action Plan for Statistics (MAPS) recommended ’mainstreaming strategic planning of statistical systems and preparing national strategies for the development of statistics for all low income countries by 2006’. This is an ambitious goal, but will be achievable so long as the international development community lends its support20. This support is crucial because those countries most in need of better statistics are those least able to afford them, while many key areas of statistics are not directly covered by the MDGS.
20 World Bank, Supporting Strategic Statistical Planning in Developing Countries: What can the International Statistical Community do ? (7/7/04)

23
Examples

24
Box 1 : Revision of the average earnings index (AEI) in Great Britain Two lessons can be drawn from this example: 1. Unannounced and inadequately explained revisions to a statistical series can unsettle policy-makers by creating uncertainty. This is particularly
serious if the revised data differ significantly from the previous figures. Consequently, the process by which revised statistics are published and disseminated may be as important as the revised figures themselves.
2. The revision of a statistical series can act as a shock which leads to improved communications between producers and users of statistics. The experience of revising the AEI in 1998-1999 led to the establishment of closer links between the Bank of England and the Office of National Statistics, which were formalised in a Service Level Agreement signed in October 1999.
The average earnings index for Great Britain measures annual growth in average weekly earnings per head in England, Wales and Scotland. It is calculated from monthly survey data on pay bills and employment from a sample of employers grouped by size and industrial sector. The AEI is one of several labour market indicators taken into account by members of the Monetary Policy Committee (MPC) of the Bank of England when deciding whether to change the base rate of interest. In the spring of 1998, the AEI showed that earnings growth was rising and this was a key factor leading the MPC to raise base rate from 7.25% to 7.5% in June. However, in April 1998 the Office of National Statistics (ONS) enlarged the sample on which the AEI was based and earnings growth figures for May and June from the larger sample were published in August and September. Then, two days before the MPC’s October meeting, the ONS unexpectedly revised upwards the figures for the May and June AEI. Despite the greater uncertainty created by these revisions to a key indicator, the Committee decided to cut interest rates. A week or so later, the ONS released an AEI series which incorporated additional methodological changes, such as a new set of sectoral employment weights. The effect of this second set of revisions on the AEI was dramatic. The revised index (shown as AEI [suspended] in the graph) not only showed lower earnings growth than the old index in each month from late 1997 to mid-1998, but also exhibited a declining rather than an increasing trend over this period. Since the behaviour of the revised AEI was difficult to reconcile with other earnings data and with the National Accounts, the Chancellor of the Exchequer announced an independent review of the index in October 1998. In November, the ONS suspended the revised AEI until the review was completed. This was the first time that publication of official statistics had been halted owing to concerns over accuracy. The review committee reported in March 1999 and made a large number of recommendations. These included a regular review of the index numbers used to construct the AEI, and the introduction of new procedures to identify and control for outliers in the sample of firms. The committee also recommended that the Bank of England and the ONS enter into a Service Level Agreement which covers the Bank’s data needs, including information on earnings. The average earnings index was re-instated in March 1999 (shown as AEI [new] in the graph).
Source: Ban k of England In fla tion Report, M ay 1999, p.23
If the MPC had been shown the ‘suspended’ AEI rather than the ‘old’ AEI in June 1998, it is less likely that base rate would have been increased. If the MPC had taken their June 1998 decision on the basis of the ‘new’ rather than the ‘old’ AEI, it is likely that base rate would still have been raised. So, with the benefit of hindsight, it seems as if the MPC took the correct decision because the ‘new’ AEI shows earnings growth peaking at 5.7% in May 1998. This is at least one percentage point above what the Committee considers to be the maximum growth rate of earnings consistent with the inflation target. References: Bank of England Inflation Reports (May/August/November 1998, May 1999) Bank of England, Minutes of the Monetary Policy Committee, 3-4 June 1998
HM Treasury, Press Release 1999-40 (2 March 1999)
25
Box 2 : The sex ratio and gender inequality in India This example shows how one of the simplest statistics to be calculated from a Population Census can play an important role in giving recognition to a policy issue. The ratio of females to males in the Indian population (FMR) is low relative to other regions of the globe, although it varies widely between different parts of the country. The value of the FMR tends to be lowest in northern states such as Haryana and the Punjab, and highest in southern states such as Tamil Nadu and Kerala. In seeking an explanation for this phenomenon, researchers have demonstrated the importance of female literacy and female labour force participation in reducing female disadvantage in child survival. However, even after controlling for such factors, regional location continues to exert a significant, albeit not wholly explained, effect on the FMR. It is clear that the sex ratio is both a cause and a consequence of policy-making. On the one hand, low values of the FMR are associated with high levels of gender inequality as measured by women’s lack of property rights and their disadvantaged access to health care, education and the labour market. Under such circumstances, women are in a weak position to influence the policy process in a system of majority rule, not least owing to the effect of a low FMR on the gender composition of the electorate. According to one estimate, if India had possessed the FMR of Sub-saharan Africa in 1986, an additional 37 million women would have been alive on the subcontinent. So, a low FMR may indirectly contribute to the persistence of policies which are discriminatory towards women. On the other hand, the FMR can be affected by, and so be considered the result of policy initiatives. It is no coincidence that the Indian state of Kerala exhibits a FMR greater than unity after many years of promoting policies of female empowerment, including measures to enhance literacy rates among women. Long-run demographic trends in India suggest that economic growth in and of itself does not eliminate gender inequalities and induce a rise in the sex ratio. The FMR declined steadily during the 20th century and may continue to fall in the future. Figures from the latest Census show that the FMR among children aged under 6 years fell from 945 girls (to 1,000 boys) in 1991 to 927 girls in 2001. The decline was greatest in the fastest growing and richest states, such as Gujarat and Punjab, while in poorer states such as Bihar and Uttar Pradesh, the FMR remained constant or rose slightly. References Dreze,J and A.Sen (1995) India: Economic Development and Social Opportunity (Delhi:Oxford University Press) Financial Times, 15 September 2004
Box 3 : Regional poverty in Ghana This example shows how survey results required policy makers to explain variations in poverty trends across regions and led to the inclusion of regional poverty reduction targets in a country’s Poverty Reduction Strategy. When formulating strategies of national economic development, policy makers need to know how living standards vary within a country and how welfare levels in different regions change over time. Population Censuses and household surveys provide vital information on how housing conditions, consumption levels and asset ownership vary across geographic areas, economic sectors and ethnic groups. The Ghana Living Standards Survey (GLSS 4) revealed that poverty incidence fell from 52% to 40% between 1991-1992 and 1998-1999. However, this national figure masked large variations in poverty trends between different parts of the country. While poverty declined in seven of the ten administrative regions, it rose in three: Northern, Upper East and Central. Much of the land area in two of these regions (Northern and Upper East) is characterised as rural savannah, which has the highest incidence of poverty in Ghana. Rising levels of impoverishment in the most deprived region of the country was clearly a matter of concern for policy-makers. A team of statisticians, officials and advisers held a series of workshops throughout the country, including in the northern town of Tamale, to discuss the results of the survey. Following these discussions and after further debate in Accra, poverty reduction targets were set for the three northern regions (Northern, Upper East and Upper West) and included in the country’s Poverty Reduction Strategy (GPRS) 2003-2005. The GPRS also included policies to promote agricultural and rural development which should improve conditions among the poor population in the north, most of whom are farm-households dependent on food crop production for survival. References Coulombe,H and A.McKay 2003 Changes in Poverty and Inequality in a Slow Growth Environment: Ghana over
the 1990s, unpublished paper for the World Bank Ghana Statistical Service 2000 Poverty Trends in Ghana in the 1990s (GSS, Accra, Ghana). Government of Ghana 2003 Ghana Poverty Reduction Strategy 2003-2005: an Agenda for Growth and Prosperity National Development Planning Commission 2004 Ghana Poverty Reduction Strategy 2003: Annual Progress
Report, (Accra, Ghana)

26
Box 4 : Tracking primary education expenditures in Uganda Do governments know how their money is actually spent ? If they do not know, they are condemned to remain ignorant of whether their desired allocation of public expenditure across different sectors and programmes has been implemented or not. This example demonstrates how the introduction of a cheap and effective system of public expenditure tracking can achieve very quickly a better match between desired and actual public spending. In the early 1990s, it was believed in Uganda that a prime cause of poor public service delivery was the government’s failure to ensure that budgeted funds reached frontline agencies, such as health clinics and schools. However, no management instruments or procedures were available to check whether such leakages occurred. So, the World Bank sponsored a public expenditure tracking survey (PETS) in 1996 to establish what proportion of budgeted funds for education and health actually reached their intended destination. In the case of primary education, 250 state schools in 19 districts were surveyed and panel data were collected annually between 1991 and 1995. The findings were a revelation. Over the study period, only 13% of the non-wage funds allocated for such items as the purchase of textbooks reached the schools. The remaining 87% either disappeared or was spent by district officials for other purposes. Around 20% of the resources designated for teachers’ salaries was paid to non-existent workers or to persons who were not working as teachers. The survey revealed that primary school enrolment had risen by 60% between 1991 and 1995, whereas administrative figures indicated that enrolment had remained virtually unchanged. A further surprise was that although all the schools in the survey were in the public sector, nearly three-quarters (73%) of all school spending in 1991 was directly funded by the parents themselves. The findings of the survey were widely disseminated and the government began publicising figures on the transfer of funds to local authorities in the newspapers and on the radio. Each primary school was obliged to post details of the funds which it had been designated in the budget and which it had subsequently received. This increased flow of public information was the key element in establishing a system of civic monitoring of local government expenditure to reduce corruption and mismanagement. The results of the new system were dramatic and quick in coming. Two follow-up PETS showed that the proportion of non-wage funds reaching the schools had risen from 13% between 1991 and 1995, to between 80% and 90% in 1999 and 2000. With such an impact, the original PETS proved to be highly cost-effective. It took 5-6 months to complete, cost US$60,000 and increased the flow of funds to primary schools by US$18.5 million. As a result of this experience, the Ugandan government has decided to conduct PETS annually in each basic service sector. Many other countries are now undertaking similar surveys to improve public service delivery. References World Bank 2004 Influential Evaluations: evaluations that improved performance and impacts of development programs
(Operations Evaluation Department) Reinikka,R and J.Svensson 2002 Assessing Frontline Service Delivery ,Development Economics Research Group, World
Bank.

27
ii. Box 5 : Mapping Vulnerability and Poverty in Malawi This example illustrates the use of statistics to create maps which display spatial variations in vulnerability and poverty within a country. Such maps provide a basis for geographically targeting a wide range of programmes designed to assist low income households. Malawi is one of the poorest countries in the world and is regularly afflicted by drought. Low rainfall reduces agricultural yields and thence the income of small farmers who depend on food crop production for survival. In an attempt to reduce food insecurity among the rural population, the World Food Programme (WFP) used Vulnerability Analysis and Mapping (VAM) to select project sites where food-for-assets public works projects would be located. VAM methods use a wide variety of primary and secondary data to rank different areas by their level of vulnerability, defined as a combination of exposure to risk and ability to cope with shocks. Geographic information systems (GIS) hold and integrate all these data which can be displayed in a vulnerability map. The results of applying VAM techniques in Malawi were subsequently compared by IFPRI to their own highly spatially disaggregated poverty map which is based exclusively on consumption data derived from the 1997-1998 Integrated Household Survey and the 1998 Population Census. This assessment showed that WFP’s use of VAM methods resulted in the selection of wards for projects which on average had levels of consumption-poverty higher than wards not included in the programme (see table). The same was true, but to a lesser degree, for wards benefiting from projects undertaken by the Malawi Social Action Fund (MASAF).
Source: IFPRI 2003 However, this conclusion that the WFP and MASAF programmes were efficiently targeted for reducing poverty depends crucially on the accuracy of the 1998 Population Census figures, which have been disputed. In 1999-2000, researchers undertook a full enumeration of a random sample of 54 villages using participatory methods (community mapping) to establish the number of households in each village. When the results of this Ground Truth Investigation Study (GTIS) were scaled up to the national level, it was estimated that there were 2.78 million households or 11.52 million people living in rural Malawi. These estimates contrast with those of the Population Census completed two years earlier which indicated a rural population of 1.95 million households or 8.5 million persons. If the GTIS figures are correct, and they are corroborated by at least one administrative source (registration for the Starter pack programme in 1999), the Census may have underestimated the size of the rural population by as much as 35%. References Benson,T 2003 Applications of Poverty Mapping to World Food Programme Activities in Malawi – Assessing the
Poverty Targeting Efficiency of a Public Works Programme and Vulnerability to Food Insecurity, IFPRI Benson,T 2002 The poverty targeting efficiency of public works programs: an application of poverty mapping in
Malawi, IFPRI http://www.wfp.org/operations/vam Barahona, C and S.Levy 2003 How to generate statistics and influence policy using participatory methods in research:
reflections on work in Malawi, 1999-2002, IDS Working Paper 212, Institute of Development Studies.

28
Box 6 : PROGRESA/OPORTUNIDADES in Mexico – a textbook case of evidence-based policy-making This example illustrates very well four out of the five activities which go to make up evidence-based policy-making. Statistics played a vital role in the design, implementation, monitoring and evaluation of PROGRESA which is a programme of the Mexican federal government launched in 1998. It aims to reduce poverty by offering financial incentives (cash transfers) to poor rural households to invest in their children’s human capital (health and education). By early 2000, PROGRESA had been implemented in 31 states and included 2.6 million households or 40% of the rural population (around 10% of the total population). In that year, the programme had an annual budget of US$777 million or 0.2% of Mexican GDP, so it is a very significant policy intervention: • Policy design: the programme was carefully designed after policy-makers had reviewed relevant research
findings and had consulted with specialists in nutrition and education. Design features which reflect this evidence-base include the delivery of cash transfers to mothers rather than fathers, and the payment of a higher stipend to female pupils at secondary school than to male pupils.
• Policy implementation: An evaluation exercise was built in to the design and implementation of the programme. For budgetary and administrative reasons, PROGRESA was phased in nationally over two years. In 1997, 50,000 target communities were identified and a sample of 506 communities was randomly selected for the evaluation. 320 communities were then randomly assigned to the treatment group which received PROGRESA benefits in 1998, while the remaining 186 communities were assigned to the control group which received PROGRESA benefits two years after the treatment group in 2000.
• Policy monitoring: once implemented, the programme was monitored through operations evaluations. These exercises obtained feedback from beneficiaries and local officials on the performance of the programme at grass roots level. Information was collected from focus group discussions and from individual beneficiary questionnaires. These data were passed on to regional and federal administrators of PROGRESA who used them to ‘fine tune’ the programme.
• Policy evaluation: owing to the design and implementation of the programme, it was possible to conduct a randomised evaluation of its impact. This evaluation was carried out by an external agency (IFPRI) to ensure that the results would be (and would be seen to be) objective and free of political bias. The results were generally favourable and indicated that PROGRESA had a positive impact on human capital formation by children in the target group. These results were disseminated in 2000 through workshops in Washington,DC and in Mexico City and were widely reported in the Mexican press.
As a result of the favourable evaluation of the programme, PROGRESA was not only maintained by the incoming administration of President Vicente Fox, but was extended to urban areas in 2001-2002. Such continuity in policy between successive governments was unprecedented in Mexico. PROGRESA’s survival, albeit under another name (OPORTUNIDADES), was even more remarkable given that President Fox’s electoral victory was the first time that the Institutional Party of the Revolution (PRI) had lost control of the Presidency in over 70 years. References Gertler,P.J. and S.Boyce (2001) An Experiment in Incentive-Based Welfare: The Impact of PROGRESA on Health in Mexico, UC-Berkeley. Behrman,J and J.Hoddinott (2001) An Evaluation of the Impact of PROGRESA on Preschool Child Height, Discussion Paper 104, IPFRI (Washington DC) Skoufias,E and B.McClafferty (2001) Is PROGRESA Working ? Summary of the Results of an Evaluation by IFPRI, Discussion Paper 118, IPFRI (Washington DC) Hoddinott,J and E.Skoufias (2003) The Impact of PROGRESA on Food Consumption, Discussion Paper 150, IPFRI (Washington DC)

29
Box 7 : Re-allocating local health expenditures in Tanzania This example demonstrates how an evidence-based reallocation of existing public sector resources, supplemented by minimal additional funds, had a major impact on health outcomes in the short- and medium-term. This project combined information on cost-effective health interventions with data on the local disease burden and the distribution of local health expenditures to improve the efficiency of public health spending. For public health expenditure to have the greatest impact on reducing mortality and disability, information is required about which diseases have the greatest impact on the health status of a population (disease burden), and how health spending is allocated to combat different diseases (expenditure mapping). In the mid-1990s, rural districts in Tanzania lacked both kinds of information. Most people died at home rather than in clinics or hospitals, so were excluded from the official morbidity data, while district health budgets might include more than 1,000 expenditure items which made it difficult to identify the pattern of spending across diseases. The result of such ignorance was often a huge mismatch between the burden of disease and the allocation of health expenditure. In one district, malaria accounted for 30% of years of life lost, but received only 5% of health spending in 1996. Conversely, tuberculosis which was responsible for less than 4% of years of life lost, attracted 22% of expenditure. As part of an innovative pilot scheme in two districts (Morogoro and Rufiji), the Tanzania Essential Health Interventions Project (TEHIP) undertook a sample survey which asked whether anyone had died or fallen sick recently in the household, and if so, with what symptoms. The results were used to construct a burden of disease profile for the local population. At the same time, the project developed a simple health expenditure mapping tool to construct a profile of local health spending. Comparison of the two profiles revealed the extent and nature of the misallocation of health resources. Using these data, together with information on a range of proven cost-effective health interventions, the pattern of health spending was altered to provide a closer match with the disease burden. The results of this change were remarkable. By re-allocating health expenditure, and spending an additional US$0.86 per head in the two districts between 1999 and 2000, infant mortality in Rufiji fell by 28% and mortality among children under-five declined by 14%. Similar results were obtained in Morogoro. No comparable improvement in child health was noted over this period in neighbouring districts or in the country as a whole. Furthermore, there were no other factors at work in either of the two districts during 1999-2000 which might have plausibly caused this striking decline in infant and child mortality. The most recent data indicate that the benefits of TEHIP extend beyond the short-term. In a four year period (1997/98-2001/02), the under five mortality rate in Morogoro fell by 43% , while in Rufiji it declined by 46% between 1999/2000 and 2002/03 (see graph).
References The Economist, 8/9/04. TEHIP ‘Interventions’ – An Overview (2002) http://web.idrc.ca/uploads/user-S/10831866301TEHIP_Mortality_Declines_to_mid_20033.doc
30
Box 8: Sustainable debt management in Highly Indebted Poor Countries (HIPCs) This example demonstrates the importance of transparent, accurate and consistent macroeconomic statistics for assessingthe likely effects of debt relief over time. Most HIPCs are located in Africa which has the lowest rate of compliance of anyregion in the world with the UN System of National Accounts (SNA) methodology. This suggests that improving thequality of macroeconomic statistics in Sub-Saharan Africa should be a high priority for policy makers. In 1996, the external public debt in forty of the world’s poorest countries averaged more than four times their annual exportearnings. Growing concern in the international development community over Third World debt led to the launch of the HIPC initiative. This offered debt relief to the poorest countries in order to reduce their external indebtedness to sustainablelevels, thereby hopefully ending the cycle of debt rescheduling. This policy proposal immediately raised two questions:
1. How much debt should be written off for a country’s debt position to be considered sustainable in the currentperiod ?
2. Given this amount of debt relief, would a country’s debt position remain sustainable in the future ? The first question was answered by applying a simple, but arbitrary rule. Any poor country having a ratio of the Net PresentValue (NPV) of external public debt to exports above 150% would receive debt relief to reduce this ratio to 150% , subjectto a track record of performance. The second question was addressed by estimating countries’ post-relief debt burdens over 10-20 years in order to establish whether a set of indicators would remain below their sustainability threshold. Thesesimulated debt trajectories were crucially important to policy makers who needed to assess what the likely effect of debtrelief would be over time. Once a given amount of relief was granted, the associated debt trajectory would indicate thelikelihood that a country’s growth path was sustainable and that the HIPC initiative would achieve its main objective. In making these forecasts, the IMF and World Bank used several debt sustainability indicators based on a wide-range of macroeconomic statistics which included:
• The existing debt stock, calculated as the aggregate of discounted debt service payments for all loans outstandingafter debt relief
• Commercial interest reference rates which are used for NPV calculations • Projections of the main macroeconomic indicators, including real GDP growth, inflation, growth in export
earnings, the fiscal accounts and the balance of payments. • The availability and concessionality of new external financing, including future loans and grants from donor
agencies.
While all forecasting is subject to uncertainty, the lack of timely, accurate and consistent macroeconomic statistics makessuch exercises more hazardous than would otherwise be the case. The overwhelming majority of HIPCs are located in Sub-Saharan Africa, but only eight countries in the region covering 11% of the regional population and 29% of regional GDP are considered to have implemented the UN System of National Accounts (SNA) methodology (1993). This is the lowestrate of compliance of any region in the world and suggests that improving the quality of macroeconomic statistics in Sub-Saharan Africa should be a high priority. However, simply having good data is not enough. The World Bank and IMF have been encouraged to make the assumptions underlying their forecasts of macroeconomic indicators more transparent. In particular, their projected growth rates for both GDP and exports have been considered overly optimistic. Partly in response to such comments, the two institutions are developing a new framework for assessing debt sustainability. While the framework will not affect the HIPC initiative, it offers several methodological improvements over current debt forecasting exercises. In particular, additional factors that affect countries’ sustainable debt thresholds, such as vulnerability to exogenous shocks and the quality of the policy environment, are now included in the assessment. Consequently, the new forecasts are derived from a more comprehensive analysis of a country’s economic position and are subjected to stress tests based on historical performance and volatility. For this richer analysis to produce the desired improvement in the quality of assessment, it needs to be based on reliable data. Thus, the new methodology serves to reinforce further the demand for high quality macroeconomic statistics. References: “Debt Relief for the Poorest: An OED Review of the HIPC Initiative” (see http://www.worldbank.org/oed/HIPC) “Updated Debt Sustainability Analysis and Assessment of Public External Debt Management Capacity” (IMF,
2002) http://www.imf.org/External/NP/hipc/2002/uga/ugadsa.PDF “The HIPC Initiative: Delivering Debt Relief to Poor Countries” (van Trotsenburg and MacArthur, February
1999) http://www.worldbank.org/hipc/related-papers/hipc-initiative-feb99.pdf “Debt Sustainability in Low-Income Countries: Further Considerations on an Operational Framework and Policy
Implications”, World Bank/IMF, September 2004 Report of the Intersecretariat Working Group on National Accounts, UN Economic and Social Council, Statistical
Commission (17/12/03)
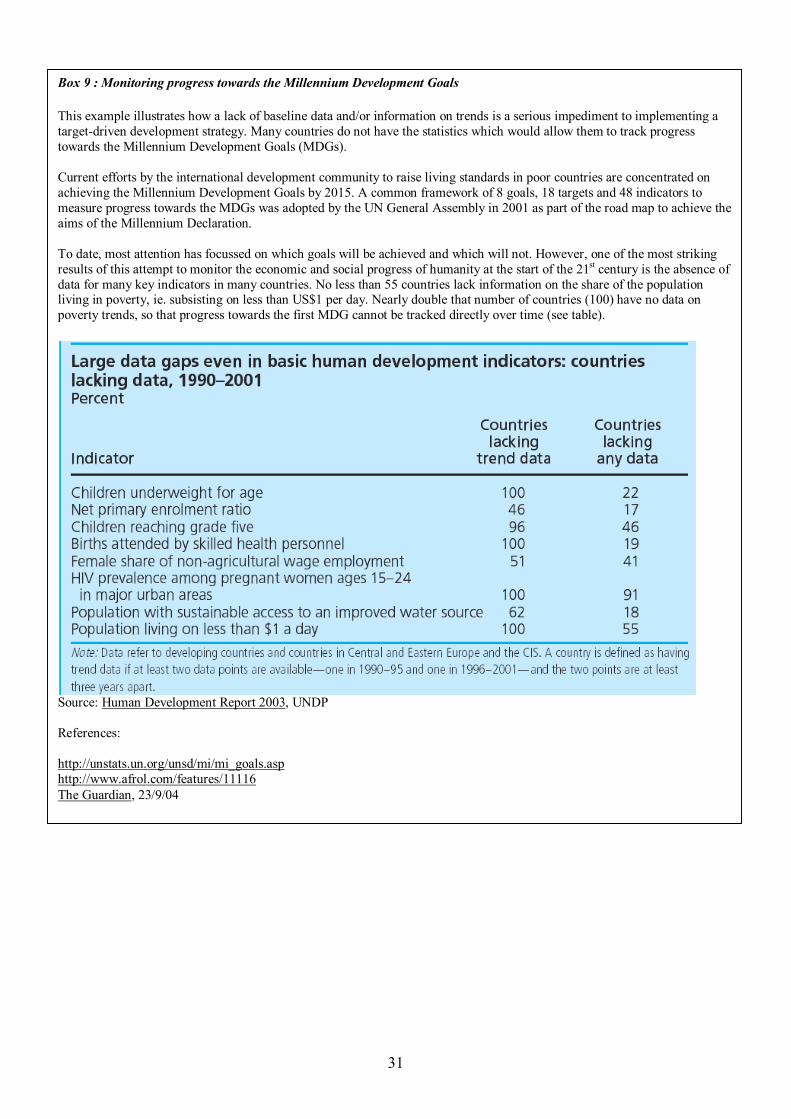
31
Box 9 : Monitoring progress towards the Millennium Development Goals This example illustrates how a lack of baseline data and/or information on trends is a serious impediment to implementing a target-driven development strategy. Many countries do not have the statistics which would allow them to track progress towards the Millennium Development Goals (MDGs). Current efforts by the international development community to raise living standards in poor countries are concentrated on achieving the Millennium Development Goals by 2015. A common framework of 8 goals, 18 targets and 48 indicators to measure progress towards the MDGs was adopted by the UN General Assembly in 2001 as part of the road map to achieve the aims of the Millennium Declaration. To date, most attention has focussed on which goals will be achieved and which will not. However, one of the most striking results of this attempt to monitor the economic and social progress of humanity at the start of the 21st century is the absence of data for many key indicators in many countries. No less than 55 countries lack information on the share of the population living in poverty, ie. subsisting on less than US$1 per day. Nearly double that number of countries (100) have no data on poverty trends, so that progress towards the first MDG cannot be tracked directly over time (see table).
Source: Human Development Report 2003, UNDP References: http://unstats.un.org/unsd/mi/mi_goals.asp http://www.afrol.com/features/11116 The Guardian, 23/9/04

32
Box 10 : Data availability and HIV/AIDS projections Much current debate over estimates of HIV/AIDS prevalence focusses on how the process of disease transmission is modelled. This example demonstrates that the paucity of data with which to calibrate these models is an equally serious problem. During the 1990s, at least six different simulation models were used to project HIV infections in Thailand. Forecasts from some of these models were extremely influential in shaping government policy. In 1991, the Thai Working Group on HIV/AIDS applied the iwgAIDS model to the country. It predicted a cumulative total of 2-4 million HIV infections by 2000, and these figures were adopted by the Thai Ministry of Public Health for planning purposes. These projections were subsequently updated using a model developed by a working group of the National Economic and Social Development Board (NESDB). The forecasts of the NESDB model became the official population projections for the country and were also used by the government in planning exercises. In Sub-Saharan Africa, the UNAIDS Epimodel has been widely used to project HIV infections and AIDS related deaths. Its forecasts have been instrumental in convincing policy makers to reallocate resources in favour of the fight against AIDS. Epimodel, which UNAIDS has now replaced by two linked models, Estimation and Projection Package (EPP) and Spectrum, has been criticised for exaggerating the scale of the HIV/AIDS pandemic in Southern Africa. However, the problem is less the model than the paucity of data with which to calibrate it. For most of the last decade, the information on current levels of HIV/AIDS prevalence in the region has been drawn from sentinel surveillance systems which monitor infection rates among pregnant women aged 15-24 attending pre-natal clinics. Most of these clinics are located in urban areas, while most of the population live in rural areas which are beyond the reach of many official statistics, particularly those on morbidity and mortality. In the words of one commentator, ‘..there are virtually no population-based survey data [on HIV/AIDS] in most of the high prevalence countries, including Botswana, Ethiopia, Malawi, Lesotho, Namibia and Swaziland’ (Bennell quoted in afrol News,7/2/04). Simulation models will continue to play a vital role in helping policy makers look ahead to see how the HIV/AIDS epidemic is likely to evolve over time. Nevertheless, the accuracy of their forecasts, and thence their usefulness to policy makers, will be determined by the nature of their assumptions together with the quantity and quality of data used in the analysis. References MAP Network Regional Report, October 1997 at http://www.hsph.harvard.edu/fxbcenter/map-oct97/monitoring.htm http://www.afrol.com/features/11116 UNAIDS 2003 Estimating and Projecting National HIV/AIDS Epidemics, January http://www.unaids.org/html/pub/topics/m-e/hiv-aids_estimation-projections_en_ppt.htm Nathan Geffen 2004 Why Rian Malan and Noseweek are wrong, 19 January, TAC News Service, listed on ChildrenFIRST website (http://childrenfirst.org.za)

33
Box 11 : Infant mortality rates and health policy in Uganda This example shows one sequence of activities to be expected from a system of evidence-based policy-making. Careful monitoring reveals a key indicator going off-track. This prompts a series of investigations which leads to a consensus on the causes of the problem. Informed by these findings, policy makers implement a change of policy. The results of Uganda’s Demographic and Health Survey (UDHS) 2000-2001 showed that the infant mortality rate (IMR) and under five mortality rate (U5MR) had not changed since 1995 despite the country’s experience of rapid economic growth and declining poverty. In fact, both rates rose slightly over this period, but the increases were not statistically significant. Concerned by this failure of the IMR and U5MR to fall in line with long-term trends, the Ministry of Finance, Planning and Economic Development (MFPED) commissioned a study into the causes of infant mortality in September 2001. The preliminary findings of this work were included in the PRSP Progress Report (March 2002) and they indicated that children living in areas where levels of immunisation were low experienced higher mortality, as did those born at home rather than at a clinic or hospital. The fall in immunisation coverage was closely linked to the decentralization of the health budget and the withdrawal of UNICEF's grant for the immunisation programme. The result was that local authorities were not allocating sufficient funds for vaccinations, and these declined as a result. The children of young mothers were exposed to greater mortality risk, as were those born to widows or to mothers who were unmarried, separated or divorced. The Progress Report made a series of detailed recommendations for increasing immunisation coverage for mothers and children, and for increasing the share of deliveries attended by skilled health workers. At the Health Sector Review in April 2002, additional determinants of the IMR at a regional level were discussed, such as the effect of malaria epidemics in the West and rising poverty in the North. This cumulative body of evidence was carefully and critically reviewed in a MFPED working paper which was published in August 2002. It concluded that the most important factors explaining why the IMR failed to decline between 1995 and 2000 were persistently high fertility rates, continued short birth intervals and a constantly high proportion of babies delivered at home. While other explanatory variables were also involved, they played a less decisive role. Following this period of policy analysis, which was partly driven by Presidential interest in the topic, the national immunisation programme was revitalised. Administrative records show that DPT3 immunisation coverage of children under one year old rose from 48% in 2000-01 to 65% in 2001-02. Changes in other determinants of infant mortality were less favourable, such as the share of deliveries attended by skilled health staff which continued to fall from 23% in 2000-01 to 19% in 2001-02. Although it will not be known until the next UDHS whether recent policy changes have been sufficient to reduce the IMR in Uganda, this example demonstrates how careful cumulative analysis can provide an evidence base for shaping public policy. References Ministry of Finance, Planning and Economic Development (MFPED) 2002 Uganda Poverty Reduction Strategy
Report 2002, Kampala MFPED 2002 Infant Mortality in Uganda, 1995-2000: why the non-improvement ? , Discussion Paper 6, Kampala MFPED 2003 Uganda Poverty Status Report 2003, Kampala
34
Box 12 : Civic monitoring of public service delivery in Bangalore This example demonstrates the role which civil society organisations (CSOs) can play in improving public sector performance by collecting data on users’ opinions of service delivery. CSOs can initiate a dialogue with government bureaucracies based on these statistics, and thereby promote evidence-based policy making. In 1993-1994, the Public Affairs Centre, an NGO in Bangalore, administered a survey using Citizen Report Cards to measure the degree of satisfaction with public services among city residents. A stratified random sample of 1130 households was selected together with a separate sample of slum dwellers. Respondents provided information on all the services they had used in the last six months and on their dealings with a variety of agencies. The survey covered telephones, electricity, water and sewerage, public hospitals, transport, public banks and public land regulation. The results of the survey indicated that only 10.5% of households were ‘satisfied’ (or very satisfied) with the services they received, while 37.5% were ‘dissatisfied’ (or very dissatisfied). These findings were presented to public service providers and PAC made specific recommendations for improving delivery to each agency. In response, some agencies introduced new training programmes to enhance their staff’s skills and customer responsiveness, while others changed their procedures to increase transparency and reduce corruption. The survey results were also widely disseminated through public meetings and the mass media. Five years later, a follow-up survey was conducted to establish whether public service delivery had improved in the city. The results of the 1999 survey showed that 40.1% of households were now ‘satisfied’ (or very satisfied) with the services they received, while only 17.9% were ‘dissatisfied’ (or very dissatisfied). Increases in measured satisfaction were similar for slum dwellers and other households. The largest improvements were noted for public hospitals and electricity, while the proportion of satisfied households increased by at least half for all services. However, there was no decline in the proportion of households paying bribes for the receipt of services. While other factors, such as new technology, may have contributed to this amelioration of public service delivery during the 1990s, stakeholder analysis suggested that the CRC findings played an important role in improving performance through increasing transparency and accountability. The two surveys cost around US$22,000 and additional resources were committed to dissemination and follow-up with government agencies. In return, user satisfaction rates increased by 50%, which suggests that CRCs are highly cost-effective as a monitoring tool. References Ravindra, A 2004 An Assessment of the Impact of Bangalore Citizen Report Cards on the
Performance of Public Agencies, ECD Working Paper Series, No 12, Operations Evaluation Department World Bank
World Bank 2004 Influential Evaluations: Evaluations that Improved Performance and Impacts of Development Programs, Operations Evaluation Department

35
Box 13 : Food crisis and famine in Malawi This example illustrates how a combination of inaccurate official data, lack of key information and government distrust of statistics collected by civil society led to delays in recognising and responding to the emergence of famine. Between January and April 2002, Malawi experienced hunger-related excess mortality estimated at between several hundred (300-500) and many thousand (10,000-15,000) persons. The causes of this famine which was the most severe to affect the country in over fifty years were complex. However, statistics (or their absence) adversely affected policy-making in the run-up to the official declaration of a ‘state of disaster’ (February 2002) in the following ways:
1. Erroneous food production data: official estimates of maize output by the Famine Early Warning System were revised downwards three times during the 2000-2001 season. The final post-harvest estimate of 1.7 million tons was 23% lower than the initial estimate of 2.2 million tons, and 32% below the record level of maize output the previous year of 2.5 million tons. By contrast, the production of roots and tubers in 2000-01 was persistently overestimated which led policy-makers to believe that any shortfall in maize supplies could be offset by larger supplies of cassava and sweet potato.
2. Lack of transparency over the management of the Strategic Grain Reserve (SGR): In 1999 and 2000, the SGR was stocked at near full capacity of 180,000 metric tons (MT). Such a high level of stocks was expensive to maintain, particularly since the National Food Reserve Agency had borrowed heavily to purchase maize in 1999. Donors argued, and the government of Malawi agreed, to reduce the SGR to a level of 60,000 MT which was considered adequate to address any localised disaster. An additional problem was that by early 2001, the maize in the SGR was nearly two years old and needed to be replenished. In the event, grain sales, which were not publicised, reduced the SGR from 175,000 MT in July-August 2000 to effectively zero one year later.
3. NGO statistics ignored: in the third quarter of 2001, Save the Children (UK) noted a near trebling of the maize price in two zones. As further evidence of food shortages accumulated in October, the organisation began an emergency preparedness programme and warned policy-makers in November that a food crisis was imminent. The government and donors were sceptical on the grounds that the crop production statistics gave no cause for alarm. Only after a second survey in two districts by Save the Children in March 2002 showed a rapid increase in malnutrition since December 2001 were donors galvanised into action.
References Devereux, S 2002 State of Disaster: Causes, Consequences and Policy Lessons from Malawi,
ActionAid Malawi IMF 2002 Malawi – The Food Crisis, the Strategic Grain Reserve, and the IMF: A Factsheet, July.

36
Box 14 : Mexican peso crisis and the Special Data Dissemination Standard (SDDS) This example shows how a failure to reveal key information possessed by policy-makers can make a bad situation worse. Nevertheless, by provoking a crisis of confidence between producers and users of statistics, this incident prompted the elaboration of improved international standards for the disclosure of macroeconomic data. Adherence to these standards lowers developing countries’ borrowing costs in both the primary and secondary markets for sovereign debt. By the early 1990s, it was felt that Mexico had finally recovered from the debt crisis of the previous decade. Foreign capital was flowing in, the stock market was booming, and in 1992 the country joined NAFTA. However, starting with the outbreak of the Chiapas rebellion in January 1994, a series of political events changed the investment climate. Pressure mounted on the country’s international reserves during the year as the Bank of Mexico was forced to defend the country’s crawling peg exchange rate regime. The worst shock came when the ruling party’s Presidential candidate, Luis Donaldo Colosio, was assassinated on 23 March. In the four weeks following the assassination, capital flight led to a decline of US$11 billion in foreign exchange reserves, or more than one third of the total. By issuing tesobonos (short-term dollar denominated debt), the Bank of Mexico was able to stabilise the reserve position temporarily. However, by October 1994, rising US interest rates, further political turmoil and evident fragility of the banking sector combined to fuel a further round of capital flight. Foreign exchange reserves declined by US$4.8 billion in November to a level of US$12.9 billion, but this information was not publicly announced until after the peso devaluation on 20 December. According to the IMF, it is likely that the reporting lag for Mexican reserves prevented investors from evaluating accurately the problems facing the exchange rate regime. Consequently, the 15% devaluation of the peso in December 1994 caught many investors by surprise and led to a full-scale re-assessment of the Mexican economy. Reactions to the devaluation were rapid, severe and widespread. Interest rates soared, the peso plummeted and financial markets around the world worried about possible contagion. Mexico’s access to external sources of private capital was cut off as investors feared that the government would default on the US$10 billion worth of tesobonos due to mature in the first quarter of 1995. Only through a combined US/IMF bail-out amounting to US$38 billion was the crisis contained. While greater openness and transparency with respect to macroeconomic data would not have prevented the crisis, it is likely that improved access by the private sector to accurate and timely information on foreign reserves and other key indicators would have promoted market discipline and allowed for a smoother adjustment. This episode prompted the IMF to advocate consistent data provision, particularly in countries with developed financial markets. To that end, the Fund established its Special Data Dissemination Standard (SDDS) in 1996 to facilitate monitoring of macroeconomic indicators in member countries having or seeking access to international capital markets. The SDDS sets minimum requirements of periodicity and timeliness for macroeconomic data covering the real sector, fiscal sector, financial sector and external sector. Adherence to these standards should allow the true extent and nature of macroeconomic problems to be detected earlier and may ultimately diminish the impact of future crises. In addition, there is now a cumulative body of evidence to show that the commitment to greater transparency implied by subscription to the SDDS lowers developing countries’ borrowing costs in both the primary and secondary markets for sovereign debt. References Shields, J 1997 The evolving role of IMF in the light of the 1994/5 Mexican crisis, Bank of England Quarterly
Bulletin , August. Summers on Mexico: Ten Lessons to Learn, The Economist, 23/12/95-5/1/96 Witt, J The Mexican Peso Crisis, Federal Bank of Atlanta at http://www.frbatlanta.org/filelegacydocs/J_whi811.pdf IMF 1995 International Capital Markets: Developments, Prospects and Policy Issues, August Cady, J 2004 Does SDDS Subscription Reduce Borrowing Costs for Emerging Market Economies ? , IMF
Working Paper, April.

37
Box 15 : An evaluation of pre-HIPC measures of debt relief This example illustrates the difficulties of identifying a counterfactual against which to evaluate the impact of a macroeconomic policy initiative, namely external public debt relief. This evaluation compared the level of indebtedness and a range of policy indicators in a group of countries all of which were later classed as HIPCs with (i) debt levels in the same group of countries in 1989 before debt relief was granted (control group 1), and (ii) policy indicators among other Less Developed Countries over the same period (control group 2). The study concluded that debt relief may result neither in a reduction of external indebtedness in the medium to long run, nor in improved economic performance by debtor countries. In September 2004, the British government announced that it would write off a further 10% of the outstanding external debt of poor countries, thereby contributing an additional £100 million a year to debt relief efforts. Gordon Brown, the UK’s Chancellor of the Exchequer, challenged other developed countries to follow suit. However, will the HIPC initiative deliver on its basic promise to reduce the debt burden of the world’s poorest countries in the short and long run ? While it may be too early to reach a definitive answer to this question, and it will never be known what would have happened in the absence of HIPC, it is instructive to assess the effects of similar debt relief efforts in the past. Such an assessment can provide insights into the likelihood of the present initiative’s success, and indicate ways in which it can be modified to achieve its goals more effectively. In a recent paper, William Easterly traced the evolution of a range of macroeconomic indicators between 1980 and 1997 for those countries later to be classed as HIPCs. This was a period during which several debt relief initiatives were undertaken. He found that while debt relief amounting to US$33 billion was granted to this group of countries between 1989 and 1997, their governments responded by borrowing an additional US$41 billion, so that the level of indebtedness increased. The ratios of debt to GDP and of debt to exports also rose. Over the same period, policy indicators in future HIPCs, such as the current account balance, the budget deficit, the extent of currency overvaluation and a quality measure of the policy environment, were worse than in other Less Developed Countries. While Easterly’s interpretation of some of his findings can be challenged, this ex post analysis has important implications for current efforts to reduce poor countries’ debt. Debt relief may result neither in a reduction of external indebtedness in the medium to long run, which has recently been acknowledged by the World Bank and the IMF, nor in improved economic performance by debtor countries. Past debt relief in HIPCs failed largely because these countries’ governments were unwilling to change their policies, even in the face of donor-imposed conditionality. Notwithstanding this sombre conclusion, Easterly acknowledges that the HIPC initiative could prove more successful than past efforts at debt relief. Lenders are now more aware of the limitations of certain types of conditionality. This has led to strenuous attempts by donors to build domestic ownership of economic policies by encouraging participatory processes as an integral part of debtor countries’ Poverty Reduction Strategies. Whatever history’s verdict on HIPC turns out to be, it is essential that any judgment be reached on the basis of high quality macroeconomic data which are consistent over time and across countries for a wide range of different indicators. References: “Brown to bail out world's poorest”, The Guardian, 20 September 2004. “Poor countries debt relief failing’, Financial Times, 13 September 2004 http://www.guardian.co.uk/business/story/0,,1312412,00.html Call for Change: How the UK Can Afford to Cancel its Share of Third World Debt (Jubilee Debt Campaign, March 2004) http://www.jubileedebtcampaign.org.uk/media/reports/callforchangefinalapr2004.doc Easterly, W 2002 How Did Heavily Indebted Poor Countries Become Heavily Indebted? Reviewing Two Decades of Debt Relief, World Development, vol 30, 10. IMF & IDA 2004 Debt Sustainability in Low-Income Countries—Proposal for an Operational Framework and Policy Implications http://www.eurodad.org/articles/default.aspx?id=553 World Bank/IMF 2004 Debt Sustainability in Low-Income Countries: Further Considerations on an Operational Framework and Policy Implications, (SM/04/318, 9/10/04),. World Bank/IMF 2004 Enhanced HIPC Initiative—Status of Implementation (SM/04/300, 8/23/04)
38
Box 16 : The abolition of wheat-flour ration shops in Pakistan This is the only example in this report of an evaluation which was subsequently assessed to measure its impact on policy-making. The assessment concluded that the recommendations of the evaluation were decisive in closing down the ration shops. By the mid-1980s, wheat-flour ration shops in Pakistan which had been established under colonial rule to provide subsidised wheat-flour to low income groups were viewed as inefficient and corrupt. However, since it would be politically delicate to close them down, the government contracted IFPRI to undertake an independent assessment of their role. Working in collaboration with staff from the Pakistan Institute for Development Economics (PIDE), IFPRI researchers collected a large amount of information on the availability and use of the ration shops through opinion polls and household surveys. The key finding of the research was that over 70% of the subsidised wheat-flour never arrived at the subsidised bakeries or ration shops. So, very few poor consumers benefited from the subsidies. Furthermore, the total cost of compensating low income consumers for the loss of the subsidy, and ration shop owners and distributors for the loss of income, would be much less than the total cost of the subsidy. Consequently, IFPRI recommended that the ration shops be abolished and this recommendation was accepted by the government in 1987. Ten years after this decision was taken, IFPRI undertook a follow-up study to assess the impact of its original research. After an exhaustive review of relevant documents and after extensive interviews with the policy-makers involved, Pakistani researchers acknowledged that the empirical findings of IFPRI’s 1985 study were a critical factor in the decision to close down the shops. This study cost approximately US$500,000 and it was estimated that abolishing the ration shops generated net annual savings to the government of at least US$40 million. So, even if the IFPRI’s work led to the shops being closed only one year earlier than they would have been without the study, the evaluation was highly cost-effective. References: World Bank 2004 Influential Evaluations: evaluations that improved performance and impacts of development programs, (Operations Evaluation Department) Islam,Y and J.L.Garrett 1997 IFPRI and the Abolition of the Wheat Flour Ration Shops in Pakistan: a Case-Study on Policymaking and the Use and Impact of Research, Impact Assessment Discussion Paper No 1, Outreach Division, IFPRI.
iii. Box 17 : Vouchers for private schooling in Colombia A final example illustrates the dangers of closing down a programme before a rigorous impact evaluation has been conducted. In 1991, the government of Colombia launched the Programa de Ampliación de Cobertura de la Educación Secundaria (PACES) which aimed to increase secondary school enrolment among the poor by assigning education vouchers to children from low-income households for use in private schools. In order to be eligible, applicants had to be entering 6th grade and be less than 15 years old. They also had to provide evidence of living in a poor neighbourhood. Since demand for vouchers regularly exceeded supply, many of the vouchers were allocated randomly among eligible applicants. Once awarded, the voucher was renewable until graduation, unless the recipient was retained in a grade. Research begun by Angrist et al in 1998, which exploits the randomised selection of applicants into the programme to create a control group, shows that PACES had a positive impact in both the short-term and medium-term, and proved to be cost–effective. More specifically, they show that over a 3 year period, voucher students were more likely to complete 8th grade because of lower grade repetition rates, while they also scored higher on achievement tests. Over a 6 year period, voucher students were more likely to take the college entrance (ICFES) exam and obtained higher scores on average than non-voucher students in the control group. These results suggest that PACES was extremely cost effective. Additional societal expenditure per voucher student over three years was estimated at US$195, while voucher recipients were judged to receive increased wages of US$300 per year over their working life. Unfortunately, this type of careful longitudinal research takes several years to complete and the government of Colombia discontinued PACES in 1998 before the results of the MIT evaluation were available. The reasons for terminating the programme were political and technical. President Andres Pastrana, who was elected in June 1998, appeared less committed to PACES than his predecessor, while the only assessment of the programme available at the time (which had several methodological weaknesses) indicated that there was little difference in test scores between voucher-accepting schools and state schools. References Angrist,J et al 2002 Vouchers for Private Schooling in Colombia: Evidence from a Randomized Natural
Experiment, American Economic Review, December. Bettinger,E 2004 Private School Vouchers in Colombia: Long & Short Run Impacts, presentation to World Bank
conference on evaluation, September. Angrist,J et al 2004 Long-Term Consequences of Secondary School Vouchers: Evidence from Administrative Records in
Colombia, unpublished paper, July.
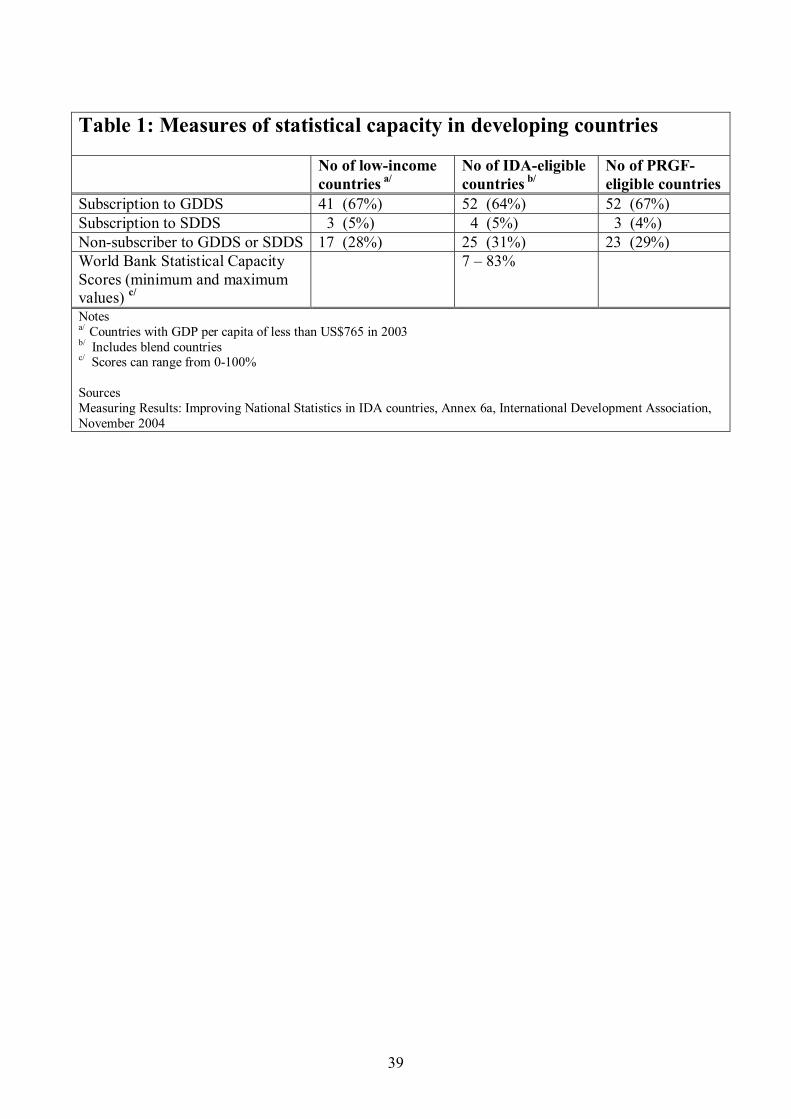
39
Table 1: Measures of statistical capacity in developing countries No of low-income
countries a/ No of IDA-eligible countries b/
No of PRGF-eligible countries
Subscription to GDDS 41 (67%) 52 (64%) 52 (67%) Subscription to SDDS 3 (5%) 4 (5%) 3 (4%) Non-subscriber to GDDS or SDDS 17 (28%) 25 (31%) 23 (29%) World Bank Statistical Capacity Scores (minimum and maximum values) c/
7 – 83%
Notes a/ Countries with GDP per capita of less than US$765 in 2003 b/ Includes blend countries c/ Scores can range from 0-100% Sources Measuring Results: Improving National Statistics in IDA countries, Annex 6a, International Development Association, November 2004