Embed Size (px)
Citation preview
University of South FloridaScholar Commons
Graduate Theses and Dissertations Graduate School
6-5-2008
Measuring Undergraduate Student Perceptions ofService Quality in Higher EducationRichard Scott KelsoUniversity of South Florida
Follow this and additional works at: https://scholarcommons.usf.edu/etd
Part of the American Studies Commons
This Dissertation is brought to you for free and open access by the Graduate School at Scholar Commons. It has been accepted for inclusion inGraduate Theses and Dissertations by an authorized administrator of Scholar Commons. For more information, please [email protected].
Scholar Commons CitationKelso, Richard Scott, "Measuring Undergraduate Student Perceptions of Service Quality in Higher Education" (2008). Graduate Thesesand Dissertations.https://scholarcommons.usf.edu/etd/328
Measuring Undergraduate Student Perceptions of Service Quality in Higher Education
by
Richard Scott Kelso
A dissertation submitted in partial fulfillment of the requirements for the degree of
Doctor of Education Department of Adult, Career, and Higher Education
College of Education University of South Florida
Major Professor: Donald A. Dellow, Ed.D. Deirdre L. Cobb-Roberts, Ph.D.
Jerry W. Koehler, Ph.D. W. Robert Sullins, Ed.D.
William H. Young III, Ed.D.
Date of Approval: June 5, 2008
Keywords: Customer Service, Measurement, Quality Service, Student Opinions, Institutional Effectiveness
© Copyright 2008, Richard Scott Kelso
Dedication
To my beautiful daughter, Jessica, who is the joy of my life. In loving memory of
my best friend and father, William Kelso (1929-2001), and to my mother, Dorothy Kelso,
for her loving support throughout my life.
Acknowledgements
My heartfelt thanks to my dissertation committee, Dr. Donald A. Dellow,
Dr. Deidre L. Cobb-Roberts, Dr. Jerry W. Koehler, Dr. W. Robert Sullins, and Dr.
William H. Young, for their extraordinary support.
My deepest gratitude and appreciation to my dissertation chairman, Dr. Donald A.
Dellow, who was my wellspring of inspiration, encouragement, and guidance. His
unwavering support, invaluable mentorship, and insightful ideas shaped both my
dissertation and my character.
My genuine thanks to the doctoral cohort faculty, Dr. James A. Eison, Dr. Jan M.
Ignash, and Dr. Michael R. Mills, all of whom were instrumental in influencing my
thinking about higher education.
Special thanks to my doctoral friends (you know who you are) for loaning me
your books and exam answers, but more importantly, for believing in me every step of
the way.
Finally, thank you to all the students that generously provided their thoughts and
opinions on the satisfaction survey.
i
Table of Contents
Table of Contents ................................................................................................................. i
List of Tables ..................................................................................................................... iii
List of Figures ................................................................................................................... vii
Abstract ........................................................................................................................... viiii
Chapter One: Introduction .................................................................................................. 1 Background of the Problem ............................................................................................ 2 Significance of the Problem ............................................................................................ 4 Purpose of the Study ....................................................................................................... 5 Research Questions ......................................................................................................... 5 Methodology ................................................................................................................... 6 Assumptions .................................................................................................................... 6 Delimitations ................................................................................................................... 7 Limitations ...................................................................................................................... 7 Definitions of Concepts and Constructs ......................................................................... 8 Organization of the Study ............................................................................................. 10
Chapter Two: Literature Review ...................................................................................... 11
Introduction ................................................................................................................... 11 Overview of the Quality Movement ............................................................................. 11 Theoretical Foundations of Service Quality ................................................................. 17 Dimensions of Quality in Higher Education ................................................................. 18 Service Quality in Higher Education ............................................................................ 21 Service Quality and Institutional Effectiveness Efforts ................................................ 25 The Relationship Between Service Quality and Satisfaction ....................................... 32 Service Quality Outcomes ............................................................................................ 33 Service Quality Measurement ....................................................................................... 34 Contribution to the Literature ....................................................................................... 40 Summary ....................................................................................................................... 40
Chapter Three: Methods ................................................................................................... 42
ii
Introduction ................................................................................................................... 42 Research Design ............................................................................................................ 43 Population and Sample ................................................................................................. 43 Instrument ..................................................................................................................... 44 Reliability and Validity of the Survey Instrument ........................................................ 46 Data Collection Procedures ........................................................................................... 48 Data Organization ......................................................................................................... 49 Data Analysis Methods ................................................................................................. 49 Summary ....................................................................................................................... 51
Chapter Four: Presentation and Analysis of the Data ....................................................... 53
Introduction ................................................................................................................... 53 Survey Participants Demographic Information ............................................................ 55 Discussion of Research Questions ................................................................................ 60 Research Question One ................................................................................................. 60 Research Question Two ................................................................................................ 67 Research Question Three .............................................................................................. 71 Tailored Survey Questions ............................................................................................ 88 Discussion of Survey Respondent Comments and Suggestions ................................... 89
Chapter Five: Discussion, Conclusions and Recommendations ..................................... 100
Introduction ................................................................................................................. 100 Discussion of Research Findings ................................................................................ 100 Research Question One ............................................................................................... 100 Research Question Two .............................................................................................. 101 Research Question Three ............................................................................................ 102 Recommendations and Implications ........................................................................... 108 Limitations .................................................................................................................. 110 Recommendations for Further Study .......................................................................... 111 Conclusions ................................................................................................................. 112
References ....................................................................................................................... 114
Appendices ...................................................................................................................... 120
Appendix A: Instrument--Student Opinion Survey .................................................... 121 Appendix B: Student Opinion Survey Record Layout ............................................... 123 Appendix C: Letter of Instruction ............................................................................... 127 Appendix D: List of College Majors and Occupational Choices ............................... 130
About the Author ................................................................................................... End Page
iii
List of Tables
Table 1. The Critical Factors of Customer-Perceived Service Quality ............................ 22 Table 2. Analysis Plan of Hypothesis Testing .................................................................. 52 Table 3. Personal Demographic Characteristics for Age, Race, Class Level, Gender, and Material Status of Survey Respondents ........................................................ 56 Table 4. Personal Demographic Characteristics for Employment and Residence of Survey Respondents ..................................................................................................... 57 Table 5. Personal Demographic Characteristics for College Major of Survey Respondents ...................................................................................................................... 58 Table 6. Personal Demographic Characteristics for Occupational Choice of Survey Respondents ...................................................................................................................... 59 Table 7. ACT Student Opinion Survey Likert Scores ...................................................... 60 Table 8. Section II: Usage of College Services and Programs ......................................... 61 Table 9. Section II: Mean Level of Satisfaction Score for Each College Service or Program ............................................................................................................................. 63 Table 10. Section III: Mean Level of Satisfaction Score for Each College Environment Variable ....................................................................................................... 65 Table 11. Section III: Mean Level of Satisfaction Score for Each College Environment Category ...................................................................................................... 67 Table 12. Section II: Comparison of Mean Level of Satisfaction Scores for College Services and Programs at Target University and National ACT Norms for Public Colleges ............................................................................................................ 69 Table 13. Section III: Comparison of Mean Level of Satisfaction for College Environment Scores at Target University and National ACT Norms for Public Colleges............................................................................................................................. 70
iv
Table 14. Descriptive Statistics of Satisfaction Levels of Academic Advising Services for Traditional and Non-Traditional Students .................................................... 72 Table 15. One-Way Analysis of Variance of Academic Advising Services for Traditional and Non-Traditional Students ........................................................................ 72 Table 16. Descriptive Statistics of Satisfaction Levels of Library Facilities and Services for Caucasian and Ethnic Minority Students ...................................................... 74 Table 17. One-Way Analysis of Variance of Satisfaction Levels of Library Facilities and Services for Caucasian and Ethnic Minority Students ............................... 74 Table 18. Descriptive Statistics of Satisfaction Levels of Student Health Services for Caucasian and Ethnic Minority Students ...................................................... 75 Table 19. One-Way Analysis of Variance of Satisfaction Levels of Student Health Services for Caucasian and Ethnic Minority Students .......................................... 75 Table 20. Descriptive Statistics of Satisfaction Levels of College Orientation Program for Caucasian and Ethnic Minority Students ..................................................... 75 Table 21. One-Way Analysis of Variance of Satisfaction Levels of College Orientation Program for Caucasian and Ethnic Minority Students .................................. 75 Table 22. Descriptive Statistics of Satisfaction Levels of Student Health Services for Male and Female Students ............................................................................ 77 Table 23. One-Way Analysis of Variance of Satisfaction Levels of Student Health Services for Male and Female Students ................................................................ 77 Table 24. Descriptive Statistics of Satisfaction Levels of Food Services for Male and Female Students ................................................................................................ 77 Table 25. One-Way Analysis of Variance of Satisfaction Levels of Food Services for Male and Female Students ............................................................................ 77 Table 26. Descriptive Statistics of Satisfaction Levels with the Out-of-Class Availability of Your Instructors for Traditional and Non-traditional Students ................ 79 Table 27. One-Way Analysis of Variance of Satisfaction Levels with the Out-of-Class Availability of Your Instructors for Traditional and Non- traditional Students ........................................................................................................... 79
v
Table 28. Descriptive Statistics of Satisfaction Levels with the Availability of Your Instructors for Traditional and Non-traditional Students .................................... 79 Table 29. One-Way Analysis of Variance of Satisfaction Levels with the Availability of Your Instructors for Traditional and Non-traditional Students ................ 79 Table 30. Descriptive Statistics of Satisfaction Levels with the Value of the Information Provided by Your Advisor for Traditional and Non-traditional Students ............................................................................................................................. 80 Table 31. One-Way Analysis of Variance of Satisfaction Levels with the Value of the Information Provided by Your Advisor for Traditional and Non-traditional Students ................................................................................................... 80 Table 32. Descriptive Statistics of Satisfaction Levels with the Availability of Student Housing for Traditional and Non-traditional Students .................................... 80 Table 33. One-Way Analysis of Variance of Satisfaction Levels with the Availability of Student Housing for Traditional and Non-traditional Students ................ 80 Table 34. Descriptive Statistics of Satisfaction Levels with the Availability of Your Advisor for Caucasian and Ethnic Minority Students ......................................... 82 Table 35. One-Way Analysis of Variance of Satisfaction Levels with the Availability of Your Advisor for Caucasian and Ethnic Minority Students ..................... 82 Table 36. Descriptive Statistics of Satisfaction Levels with the Value of the Information Provided by Your Advisor for Caucasian and Ethnic Minority Students ............................................................................................................................. 82 Table 37. One-Way Analysis of Variance of Satisfaction Levels with the Value of the Information Provided by Your Advisor for Caucasian and Ethnic Minority Students ............................................................................................................................. 82 Table 38. Descriptive Statistics of Satisfaction Levels with the General Admissions Procedures for Caucasian and Ethnic Minority Students .............................. 83 Table 39. One-Way Analysis of Variance of Satisfaction Levels with the General Admissions Procedures for Caucasian and Ethnic Minority Students ................ 83 Table 40. Descriptive Statistics of Satisfaction Levels with the Availability of Financial Aid Information Prior to Enrolling for Caucasian and Ethnic Minority Students.............................................................................................................. 83
vi
Table 41. One-Way Analysis of Variance of Satisfaction Levels with the Availability of Financial Aid Information Prior to Enrolling for Caucasian and Ethnic Minority Students ........................................................................................... 83 Table 42. Descriptive Statistics of Satisfaction Levels with the Opportunities for Personal Involvement in Campus Activities for Caucasian and Ethnic Minority Students.............................................................................................................. 84 Table 43. One-Way Analysis of Variance of Satisfaction Levels with the Opportunities for Personal Involvement in Campus Activities for Caucasian and Ethnic Minority Students ........................................................................................... 84 Table 44. Descriptive Statistics of Satisfaction Levels with the Religious Activities and Programs for Caucasian and Ethnic Minority Students ............................. 84 Table 45. One-Way Analysis of Variance of Satisfaction Levels with the Religious Activities and Programs for Caucasian and Ethnic Minority Students ............ 84 Table 46. Descriptive Statistics of Satisfaction Levels with the Availability of Courses You Want at Times You Can Take Them for Males and Female Students ................................................................................................................ 86 Table 47. One-Way Analysis of Variance of Satisfaction Levels with the Availability of Courses You Want at Times You Can Take Them for Males and Female Students ......................................................................................................... 86 Table 48. Summary of Hypothesis Tests .......................................................................... 87
vii
List of Figures
Figure 1. Measurement of service quality ......................................................................... 35 Figure 2. SERVQUAL model ........................................................................................... 38
viii
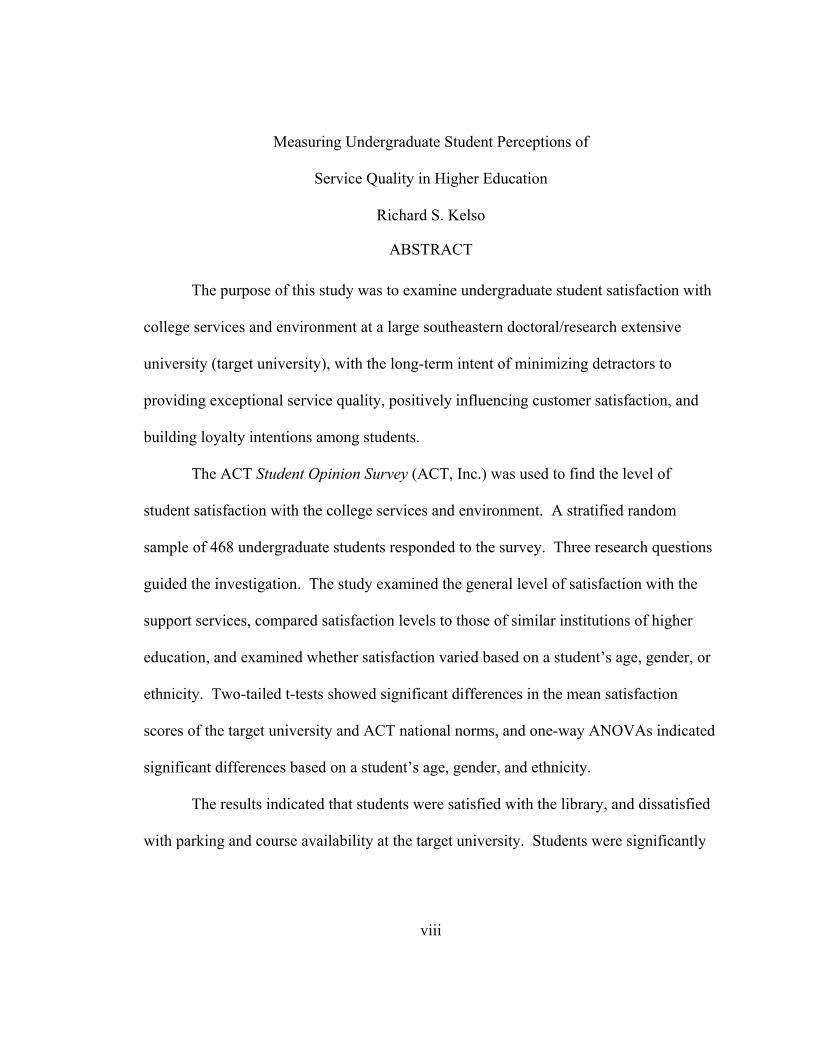
Measuring Undergraduate Student Perceptions of
Service Quality in Higher Education
Richard S. Kelso
ABSTRACT
The purpose of this study was to examine undergraduate student satisfaction with
college services and environment at a large southeastern doctoral/research extensive
university (target university), with the long-term intent of minimizing detractors to
providing exceptional service quality, positively influencing customer satisfaction, and
building loyalty intentions among students.
The ACT Student Opinion Survey (ACT, Inc.) was used to find the level of
student satisfaction with the college services and environment. A stratified random
sample of 468 undergraduate students responded to the survey. Three research questions
guided the investigation. The study examined the general level of satisfaction with the
support services, compared satisfaction levels to those of similar institutions of higher
education, and examined whether satisfaction varied based on a student’s age, gender, or
ethnicity. Two-tailed t-tests showed significant differences in the mean satisfaction
scores of the target university and ACT national norms, and one-way ANOVAs indicated
significant differences based on a student’s age, gender, and ethnicity.
The results indicated that students were satisfied with the library, and dissatisfied
with parking and course availability at the target university. Students were significantly
ix
less satisfied with one-fifth of all support services and all the environmental categories,
but significantly more satisfied with their library than those in the ACT national norm.
A relatively small number of significant differences existed in student satisfaction
with the college services and environment based on a student’s age, gender, or ethnicity.
Of the nearly 200 ANOVA analysis conducted to explore this research question, only 11
showed significant differences, and in almost every case, the differences were small.
Specific student comments regarding campus parking, advising, class availability,
facilities, and staff deportment are provided.
The results of the study create an awareness of student needs and offer useful
feedback to college administrators and institutional planners in their efforts to improve
service quality in higher education.
1
Chapter One
Introduction
It is likely that students base their continued enrollment at higher education
institutions, in part, on how well an institution’s programs and services meet their
expectations (Plank & Chiagouris, 1997). When students are dissatisfied with an
institution’s services, they are more likely to defect to competitive institutions (Plank &
Chiagouris, 1997). Some academicians have suggested that institutional efforts to
measure service quality and student satisfaction have fallen short (Lewis & Smith, 1989).
In an effort to stem possible student defections, it is imperative that universities measure
the quality of the services they provide in an effort to improve on them. Oftentimes,
institutions measure things that may not be important to their primary customers, the
students.
Students’ perceptions of the quality of their service experiences should be
assessed. Each time a student experiences some occurrence of an institution’s service,
that service is judged against their expectations (Parasuraman, Zeithaml & Berry 1985,
1988, 1991). In an increasingly competitive higher education arena, research indicates
that service quality is an important determinant of student satisfaction (Young &Varbel,
1997). Institutions should be held accountable for effectively meeting or exceeding
students’ expectations of the quality of services it provides.
2
Background of the Problem
The genesis of service quality analysis is rooted in the business community in the
early 1990s, when increased foreign competition and deregulation forced a greater
emphasis on providing quality customer service. Many businesses recognized that their
continued profitability depended on customer satisfaction and loyalty, which, in turn,
resulted from the customer’s perception of value received. In an effort to increase market
share, businesses focused on meeting or exceeding their customer’s expectations (Berry,
1995). Many higher education institutions, faced with a similarly growing competitive
environment, took notice of the success in the for-profit arena, and began to replicate
business models measuring service quality (Milakovich, 1995).
Higher education institutions share the same characteristics as those of other
service businesses. From the student’s vantage point, the perception of institutional
services is inseparable from the people who deliver those services—the service providers.
Their services are intangible, heterogeneous, variable, and perishable and the students
themselves participate in the service delivery process because they must interact with the
service providers (Gronroos, 1992). Unlike other service businesses, however, many
higher education institutions erroneously view students as a captive audience and
consider the demand for their educational services as inelastic. As competition
intensifies between private, public, and online education providers, the business methods
for measuring customer satisfaction will prove valuable to higher education institutions
(Shank, Walker, & Hayes, 1995).
In a competitive higher education marketplace, the quality of services delivered
separates an institution from its competitors (Weideman, 1989). Providing an
3
institutional service that exceeds students’ expectations does not happen automatically;
rather, it must be deliberately managed. In order to effectively manage the quality of
services, management must first ascertain a comprehensive understanding of students’
needs and expectations. Then they must formulate a distinctive service proposition—a
proposal regarding how they will choose to serve students, and finally implement it
through a strategy of “student-friendly” policies, practices, and procedures (Kotler &
Fox, 1995).
Measuring service quality in higher education institutions continues to be a
challenging and incommodious endeavor. Although there have been numerous studies
and continuous efforts on the part of many institutions to improve the quality of their
services, much of this improvement has been driven by regional and national accrediting
agencies using tangible quality measures. As a result, much of the focus on service
quality measurement has been on technical quality inputs and occasionally on student
outputs, rather than on student satisfaction (Darlene & Bunda, 1991).
Measuring the quality of teaching in higher education has been a contentious
issue, with little agreement on what it is or how to measure it (Gage, 2001; Huber, 2000;
Ramsden, 1991). Undoubtedly, despite the challenges of measuring teaching quality, the
primary mission of higher education institutions remains focused on student learning.
The institutional services that support student learning are changing based on
growing student demands in service areas such as admissions and registration, academic
advising, food services, and financial aid, among others. Higher education leaders must
be attuned to these changing demands to maintain student loyalty and ensure that their
institutions are meeting or exceeding student expectations (Hanna & Wagle, 1989). The
4
importance of effectively responding to student needs cannot be overstated, because
students’ perceptions of services are likely to impact their choice of continued enrollment
or defection to another institution (Plank & Chiagouris, 1997).
Significance of the Problem
The importance of measuring student satisfaction with university services has
evolved beyond theoretical discussion. The consequences of increased competition
among higher education institutions, diminished state funding, mounting attention by
governing bodies on institutional accountability, and changes in student body
demographics have all contributed to an atmosphere of growing public scrutiny of
institutions of higher education (Athiyaman, 1997; Cooil et al., 2007; Seymour, 1993;
Watty, 2006).
To respond to this heightened interest, institutional research departments at many
universities are considering a multitude of measures designed to satisfy their diverse
constituents. State legislatures, regional boards, university administration, faculty, staff,
students, parents and employers may all have distinctively different expectations.
Commonly, the measurement of institutional quality in higher education is defined
predominantly by the institutions rather than by the students. Consequently, measures of
quality in higher education often focus on areas that contribute to institutional prestige
and national stature like test scores of incoming first year students, the level of research
expenditures, and the number of national academy faculty and national student scholars.
Many of these institutional measures of quality may be of limited importance to students.
Students come in contact with the institution in a variety of ways, each time
forming impressions about the service encountered. These encounters are what should be
5
measured to gauge student perceptions. Since the delivery of a higher education occurs
through many different service providers over many years, there are a number of decision
points at which the student has the opportunity to remain with the current institution or
defect to another.
Despite the importance of measuring student satisfaction in institutions of higher
education, many institutions are measuring quality indicators other than student
perceptions of institutional services. There is limited literature related to the impact of
service quality measures on specific student demographic variables. The research on
student satisfaction measures with university services in higher education is lacking, and
thus warrants further study.
Purpose of the Study
This study examined undergraduate student satisfaction with college services and
environment at a large southeastern doctoral/research extensive university (Carnegie
Classification of Institutions of Higher Education, 2000), with the long-term intent of
minimizing detractors to providing exceptional service quality, positively influencing
customer satisfaction, and building loyalty intentions among students.
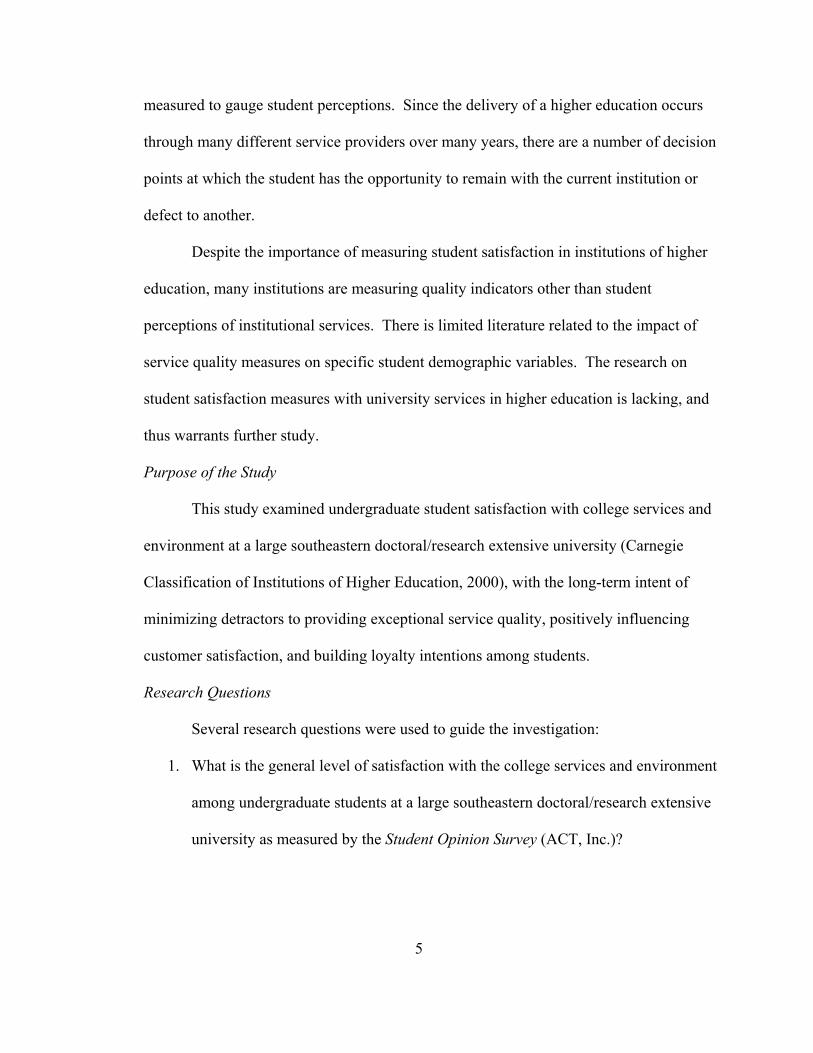
Research Questions
Several research questions were used to guide the investigation:
1. What is the general level of satisfaction with the college services and environment
among undergraduate students at a large southeastern doctoral/research extensive
university as measured by the Student Opinion Survey (ACT, Inc.)?
6
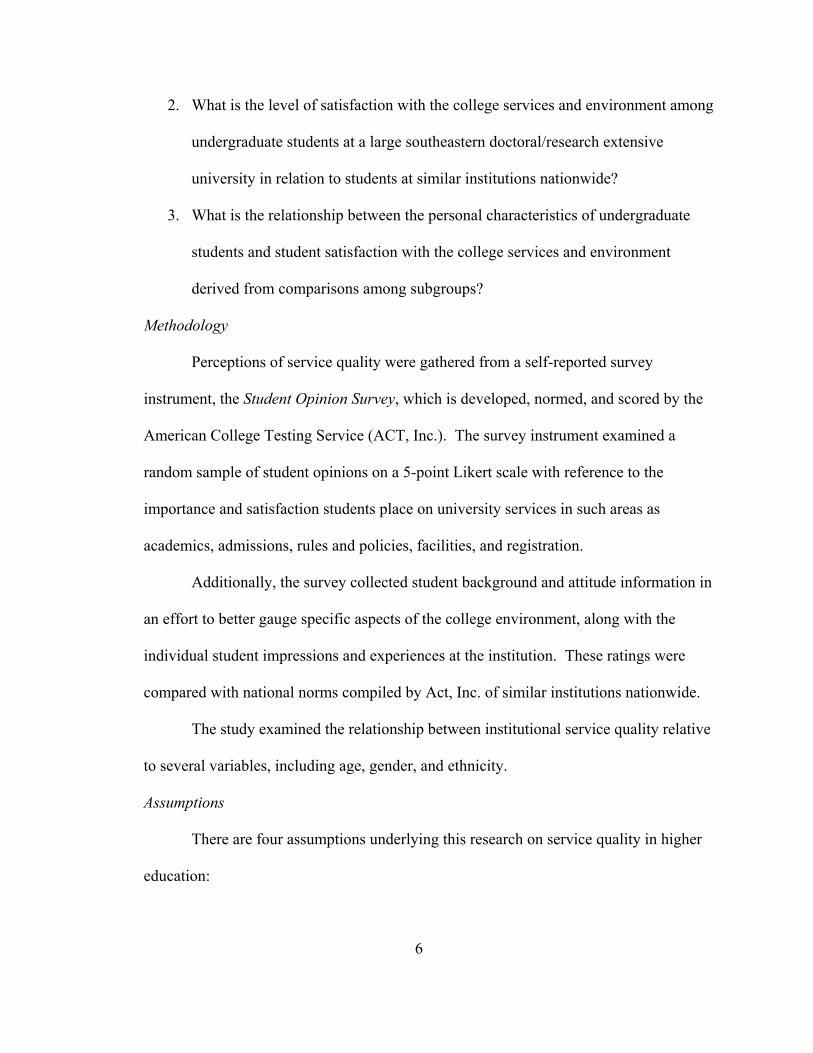
2. What is the level of satisfaction with the college services and environment among
undergraduate students at a large southeastern doctoral/research extensive
university in relation to students at similar institutions nationwide?
3. What is the relationship between the personal characteristics of undergraduate
students and student satisfaction with the college services and environment
derived from comparisons among subgroups?
Methodology
Perceptions of service quality were gathered from a self-reported survey
instrument, the Student Opinion Survey, which is developed, normed, and scored by the
American College Testing Service (ACT, Inc.). The survey instrument examined a
random sample of student opinions on a 5-point Likert scale with reference to the
importance and satisfaction students place on university services in such areas as
academics, admissions, rules and policies, facilities, and registration.
Additionally, the survey collected student background and attitude information in
an effort to better gauge specific aspects of the college environment, along with the
individual student impressions and experiences at the institution. These ratings were
compared with national norms compiled by Act, Inc. of similar institutions nationwide.
The study examined the relationship between institutional service quality relative
to several variables, including age, gender, and ethnicity.
Assumptions
There are four assumptions underlying this research on service quality in higher
education:
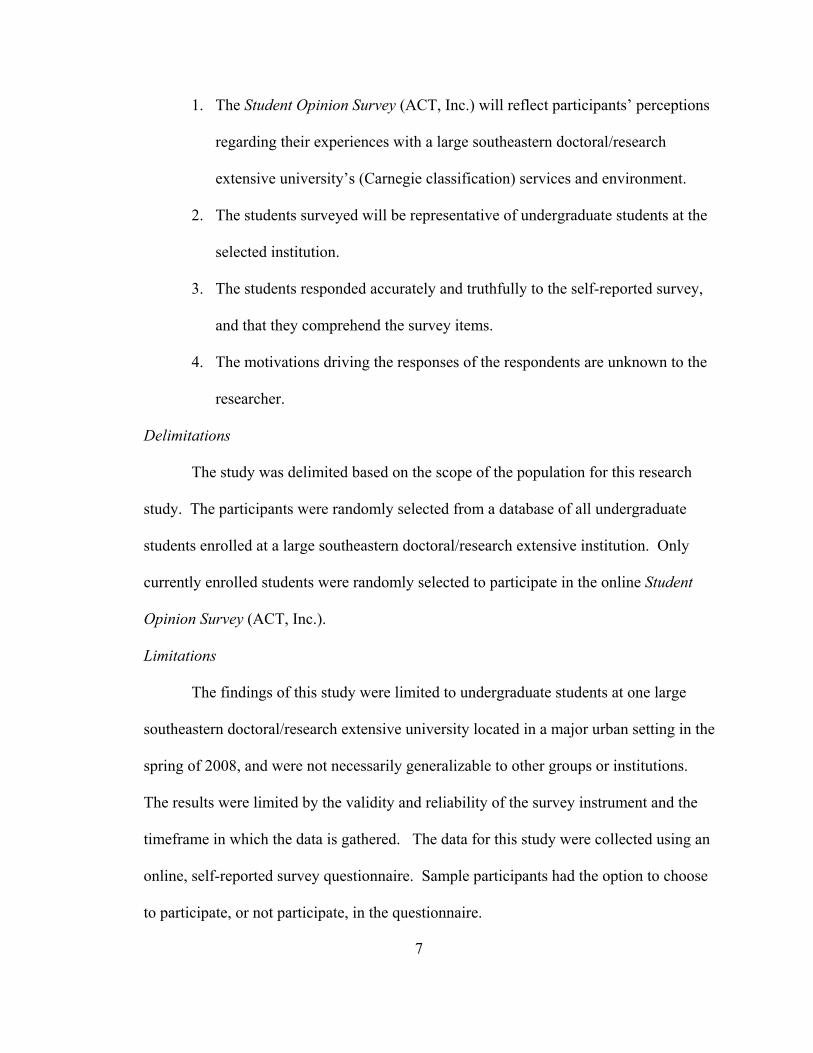
7
1. The Student Opinion Survey (ACT, Inc.) will reflect participants’ perceptions
regarding their experiences with a large southeastern doctoral/research
extensive university’s (Carnegie classification) services and environment.
2. The students surveyed will be representative of undergraduate students at the
selected institution.
3. The students responded accurately and truthfully to the self-reported survey,
and that they comprehend the survey items.
4. The motivations driving the responses of the respondents are unknown to the
researcher.
Delimitations
The study was delimited based on the scope of the population for this research
study. The participants were randomly selected from a database of all undergraduate
students enrolled at a large southeastern doctoral/research extensive institution. Only
currently enrolled students were randomly selected to participate in the online Student
Opinion Survey (ACT, Inc.).
Limitations
The findings of this study were limited to undergraduate students at one large
southeastern doctoral/research extensive university located in a major urban setting in the
spring of 2008, and were not necessarily generalizable to other groups or institutions.
The results were limited by the validity and reliability of the survey instrument and the
timeframe in which the data is gathered. The data for this study were collected using an
online, self-reported survey questionnaire. Sample participants had the option to choose
to participate, or not participate, in the questionnaire.
8
Definitions of Concepts and Constructs
To examine the nature of service quality, it is helpful to have a common
understanding of terminology and usage. For purposes of this study, key terms based on
definitions and usage within the literature and within this dissertation are stated:
Behavioral intentions are what the customer intends to do after a service
encounter, including return, exit, switch, and engage in positive or negative word-of-
mouth communications about the organization (Zeithaml, Berry & Parasuraman, 1996).
Commitment is the customer and service provider’s desire to continue their
relationship (Morgan & Hunt, 1994).
Customer satisfaction is a value judgment based on the gap between actual
experiences and expectations of the consumer. (Zeithaml et al., 1990).
Customer service is an understanding of the needs and expectations of the
customer and the response to meet those needs and expectations (Johnston, 1993).
Customer satisfaction and dissatisfaction are the consumer’s judgments regarding
a firm’s success or failure in meeting expectations. Met expectations result in customer
satisfaction; unmet expectations result in customer dissatisfaction (Oliver, 1980).
Defection is falling away from loyalty or habit in buying practice (Heskett, Sasser
& Schesinger, 1997). It is used interchangeably with the term “switching.”
Disconfirmation paradigm is the model that describes the consumer’s comparison
of expected performance to actual performance to determine met expectations
(satisfaction) or unmet expectations (dissatisfaction) (Oliver, 1980).
Expectations are the performance anticipated or expected by the consumer. They
are formed by word-of-mouth, advertisements, and past experiences (Zeithaml et al.,
9
1990). They form the baseline against which product or service performance is compared
(Nolan & Swan, 1985).
Loyalty is the degree to which a customer exhibits repeat purchasing behavior
from a service provider, possesses a positive attitudinal disposition toward the provider,
and considers using only this provider when a need for this service arises (Gremler, et al.,
1996).
Perception is the customer’s judgment about the service encounter (Zeithaml et
al., 1990).
Service is any activity offered to a customer that is consumed simultaneously as it
is produced. It encompasses the process, delivery, and outcome of the activity (Zeithaml
et al., 1990).
Service quality is the customer’s perception of the level of success or failure in
meeting expectations (Lewis & Booms 1983; Zeithaml et al., 1990). It is a measure of
how well service level delivered matches customer expectations on a consistent basis
(Webster 1989, 1991).
Switching is changing to a new service provider for the same service (Keaveney,
1995). This term is used interchangeably with defection.
Tangibles are the customer’s perception of the appearance of physical facilities,
equipment, personnel, and communications materials (Zeithaml et al., 1990).
Trust is the confidence the customer has in the service provider’s reliability and
integrity (Wilson, 1995).
10
Organization of the Study
Chapter 1 contains an introduction to the study, the purpose of the study, a
statement of the problem, research questions, limitations, definition of terms, hypotheses,
and an overview of the study. Chapter 2 will provide a review of the literature. Chapter
3 will describe the methods used in the study, the survey instrument, the research design,
and the procedures used to obtain the research data. Chapter 4 will present an analysis of
the data. Chapter 5 will contain a summary of the findings, conclusions, and
recommendations from the study.
11
Chapter Two
Literature Review
Introduction
This chapter provides the theoretical basis for the study, supported by relevant
literature, concepts, and instruments of service quality. The overall purpose of this study
is to expand on the concept of “service quality” in higher education, along with its
associated implementation strategies and their influence on customer satisfaction. This
chapter presents a review of the pertinent literature as related to the current study,
beginning with the early product-focused quality literature in the United States, followed
by a discussion of the theoretical and empirical evolution of service quality measurement.
The evolution of service quality in higher education is explored, along with a discussion
of methods to measure service quality.
Overview of the Quality Movement
Prior to the Second World War, the idea of quality was based on the physical
characteristics of a product. At that time, quality was measured as the variation in the
product or service characteristics from a set of standard specifications. Any defects or
variations to the quality standards resulted in changes to the product to bring it up to
standard specifications (Tenner & DeToro, 1992).
The genesis of the U.S. quality movement can be traced back to the early 1920’s
to the father of the total quality movement, Walter Shewhart of Bell Laboratories, who
12
invented the statistical process control (SPC) chart to measure product variation and its
associated causes. Two students of Shewhart, W. Edwards Deming and Joseph Juran,
further refined quality measurement by applying their quality insights within the U.S.
manufacturing industry in the early 1940s. Shewhart believed that manufacturing would
be improved through a focus on identifying and correcting problems during the
manufacturing process. Most business leaders did not readily accept these early efforts at
improving product quality, choosing to simply fix product defects and incorporate the
rework costs back into the original product (Schneider & White, 2004). This was
especially prevalent in the automotive industry at that time.
Nearly two decades later, the idea of total quality control entered the
manufacturing lexicon. This concept was originally attributed to A.V. Feigenbaum in
1951 (Tsutsui, 1996), and fully embraced and adopted in the work of W. Edward
Deming. Deming’s ideas of statistical control were enthusiastically received by Japanese
engineers and inspectors after the war, but were essentially shunned in the United States.
The early quality efforts evolved from mostly product focused to mostly customer
focused in the 1980s as U.S. service businesses grew to dominate the economy. Pundits
of product quality initially held to the notion that product-based theories of quality would
be generalizable to the services business, however, quickly discovered service quality to
be vague, nebulous, and somewhat indefinable.
Joseph M. Juran, considered the father of quality, was the first to incorporate the
service quality component into quality management, which he coined total quality
management (TQM). Juran defined quality as “those product features which meet the
needs of customers and thereby provide satisfaction” (Juran & Godfrey, 1999). His
13
concepts of the internal customer service, the Pareto principle, and producing products or
services that meet the customer’s requirements were well received by Japanese industry.
Juran’s principles of quality effectively infused the “voice of the customer” into all facets
of production—through the research and development, engineering, and product
development stages of production.
Juran is credited by many quality practitioners with inspiring the modern day Six
Sigma quality process, a process developed by Bill Smith at Motorola to systematically
improve processes while eliminating defects. Defects in this case being the
nonconformity of a product or service to meet its specifications. Six Sigma focuses
primarily on continuous efforts to reduce variation in process outputs, measuring,
analyzing, and controlling those process outputs, and involving the entire organization in
the quality improvement efforts, particularly the top-level management.
Deming traveled to Japan to join Juran just after World War II to support the
reconstruction efforts. The Japanese embraced Deming’s statistical quality control
approach to measuring product and service quality by naming a national quality award,
the Deming Prize, to those manufacturers that provided world-class quality products. He
criticized the TQM efforts being implemented in the U.S. as too focused on the methods,
rather than the customers. The era of customer-defined quality was born.
In the 1980s, Deming introduced his revolutionary principles for statistical quality
control that he had earlier implemented in Japan to U.S. industries. Amid multi-billion
dollar losses, Ford Motor Company recruited Deming to oversee its quality movement.
Deming talked mostly about improving management, rather than improving quality citing
that, “The problem is at the top; management is the problem.” Just before his death in
14
1993, Deming published The New Economics for Industry, Government, and Education,
which outlined his pioneering work in the fourteen key principles for management for
transforming business effectiveness. These principles transformed American business,
and can be grouped into six fundamental themes (Dill, 1992):
1. It is imperative to practice continuous quality improvement if an
enterprise is to hold its place in the market.
2. The emphasis should be on obtaining consistent quality in incoming
resources through careful management of suppliers.
3. There should be active participation of all members of an organizations
productive workforce in the improvement of quality.
4. Meeting customer needs should be the fundamental basis for improving
goods and services.
5. Cooperation and coordination should be the basic way in which an
enterprise can improve its quality.
6. Quality improvement comes not from inspection, but from design.
That is, the establishment of procedures which make it impossible for
bad quality to be undetected and encourage the primary aim of
continuous quality improvement.
Phillip Crosby published his enduring work, Quality is Free, at the height of the
American quality crisis in the 1980s when American manufacturers were losing market
share to the Japanese products largely due to the superiority of the quality of the Japanese
products. Crosby’s response to the quality crisis was “doing it right the first time”
(Crosby, 1979). His four major principles of quality management were:
15
1. Quality is defined as conformance to requirements.
2. The system of quality is prevention, not appraisal.
3. The performance standard must be zero defects.
4. The measurement of quality is the price of nonperformance.
Crosby asserted that a company that established a quality program would see savings
from improved product and service quality exceed the cost of implementing the quality
program, thereby supporting his declaration that “quality is free.”
During the time that Deming was introducing his statistical quality control
process to the Japanese following World War II, Armand Feigenbaum was already
implementing a similar process in the U.S. at General Electric called total quality control
(TQC). “Total quality control is an effective system for integrating the quality
development, quality maintenance, and quality improvement efforts of the various groups
in an organization so as to enable production and service at the most economical levels
which allow full customer satisfaction” (Feigenbaum, 2004). He introduced the idea that
so much extra work is performed in correcting mistakes that there is effectively a
“hidden plant” within any factory. He recognized the importance of executive support in
any quality initiative, “Because quality is everybody’s job, it may become nobody’s
job—the idea is that quality must be actively managed and have high visibility at the
highest levels of management” (Feigenbaum, 2004). He was instrumental in supporting
the link between executive involvement in quality improvement initiatives and customer
satisfaction and retention.
After World War II, Japan looked to transform its industrial sector, which in
North America was still perceived as a producer of cheap wind-up toys and poor quality
16
cameras. Kaoru Ishikawa joined the Union of Japanese Scientist and Engineers (JUSE),
and focused his efforts on quality control research. He developed the cause and effect
diagram (also known as the fishbone diagram) and introduced quality circles. Quality
circles began as an experiment to see what effect the “leading hand” (Gemba-cho) could
have on quality. Ishikawa stressed executive involvement and a corporate-wide shared
vision to mobilize people to reach an organization’s strategic quality objectives (Hamel &
Prahalad, 1989). He deemphasized conformity to standards, stressing that standards
should be altered based on the environment and needs of the customer. Ishikawa was
adamant about infusing the customer’s views and needs into the product development,
holding that customer satisfaction was all-important in the quality process. Many quality
practitioners believe that Ishikawa’s views were simply an extension of his Japanese
cultural roots, which emphasized group consensus based on the collective interests and a
long-term vision within workgroups (Hamel & Prahalad, 1989).
Genichi Taguchi (1950) developed a methodology for applying statistics to
improve the quality of manufactured goods. Simply put, Taguchi argued that the cost of
poor quality is the number of items outside specifications multiplied by the cost of
rework or scrap. He also proposed that there is a cost to society as a result of poor
quality. He focused on implementing quality earlier in the product lifecycle, in the
design phase rather than in the later manufacturing stage. He created an equation that
quantified perceived quality and costs. The technical details and benefits of Taguchi’s
statistical methods are only now being studied in the West.
The quality movement evolved over time using a myriad of tools and processes,
focused initially on product reliability and product inspection, and grew to include an
17
organization-wide process of total quality management focused on customer satisfaction.
This same quality movement has impacted higher education in the United States
necessitating the examination of quality from the student’s perspective. Important
theoretical models evolved as part of the service quality movement to explain customer
perceptions and expectations and contributed to a growing body of literature on service
quality.
Theoretical Foundations of Service Quality
Empirical research-based service quality models assess the differences between
perceptions and expectations utilizing disconfirmation theory which is grounded in the
satisfaction literature. Webster and Hung (1994) contend that these models highlight the
importance of customer perceptions:
Quality is what the customer says it is, thus total quality companies strive for the most accurate and up-to-date picture of customer perceptions. Whether you measure product quality or service quality, you must deal with how customers think, feel, and behave (p. 50).
Service quality is the customer’s perception of the level of success or failure in
meeting expectations (Zeithaml, et. al., 1990). According to the expectation-
disconfirmation paradigm (Oliver, 1980), customers compare their satisfaction with a
product or service with their expectations of performance. If perceived performance is
greater than what was expected, positive disconfirmation results and customer
satisfaction is expected to increase. Conversely, if the product or service performance is
less than what was expected, negative disconfirmation occurs, with a corresponding
decrease in customer satisfaction (Yi, 1990). Empirical studies confirm that
disconfirmation and expectations are significant predictors of customer satisfaction.
18
In contrast, some scholars consider service quality to be a state of outcome of the
service encounter and customer satisfaction to be a response to service quality. These
researchers typically measure service quality using customer evaluations of tangibles,
reliability, empathy, assurance, and responsiveness (Zeithaml, et. al., 1990). This is the
basis of the service delivery gap model, whereby customer expectations and perceptions
of service quality are gathered before and after a service experience. Consistent with the
disconfirmation model, perceptions greater than expectations signal satisfactory service
quality, and perceptions less than expectations indicate unsatisfactory service quality
(Parasuraman, Berry & Zeithaml, 1985, 1988; Zeithaml et. al., 1993). The prevailing
measurement technique adopted by the majority of researchers today analyzes customer
perceptions using only post-service measurements, relying on this singular measure to
explain the service delivery gap. This study will adopt the methodology of post-service
measures of service quality perceptions in a higher education environment.
Dimensions of Quality in Higher Education
As the exodus of manufacturing and production of commodities and goods
continues to move offshore from the United States, the U.S. economy has become
inescapably defined by its service sector. In today’s environment of ever increasing
global competition, providing quality service is a key to the survival and success of many
organizations, and many experts speculate that delivering superior service quality is the
most powerful competitive trend shaping present-day strategy.
The definition of service quality in the tertiary education sector is no less elusive
than that in the business world. “Service quality is like beauty—it lies in the eyes of the
beholder; in other words, it is person-dependent and has different meanings for different
19
people” (Galloway & Wearn, 1998). Most definitions of quality when applied to services
are customer-centric; however the ambiguous nature of services indicates that “the search
for a universal definition of quality and a statement of law-like relationships has been
unsuccessful. Despite the lack of a specific definition, according to Sahney, “quality in
higher education” follows the definitions of quality in general. (Sahney et al., 2004).
(Quality) has been defined as “excellence in education (Peters & Waterman, 1982); “value addition in education” (Feigenbaum, 1951); “fitness of educational outcome and experience for use” (Juran & Gryna, 1988); “conformance of education output to planned goals, specifications and requirements” (Gilmore, 1974; Crosby, 1979); “defect avoidance in the education process” (Crosby, 1979)’ and “meeting or exceeding customer expectations of education” (Parasuraman et al., 1985).
Zemsky (2005), in his vital contribution to educational quality entitled,
“Remaking the American University: Market Smart and Mission Centered,” describes
higher education quality as “calibrated in terms of endowments and expenditures per
student, class sizes, faculty-student ratios, and the quality of the freshman class as
measured by test scores, high-school ranks, and grade-point average” (p.140). He
indicates that the faculty response to the definition of quality might likely be the same,
with the additional caveat that “what really counts is research and scholarship—the hiring
and retaining of a research-productive faculty (which) drives both prestige and
educational quality” (p. 10).
Zemsky elaborates on the dimensions of service quality in higher education—
inputs, market power, and the central role of research and scholarship thus, “Quality is
about money and the resources money can buy, like libraries, recreational facilities, and
lower faculty-to-student ratios. Quality is about credentials, those of the students as well
as the faculty. And quality is about the primacy of research and scholarship” (Zemsky,

20
2005). He suggests that higher education quality, as seen from the vantage point of an
“outside observer” is bewildering, “Upbeat images of record numbers of students
crowding college campuses and America’s continued leadership in higher education and
science reinforce the view that U.S. institutions are the best in the world. And in some
sense they are. However, the traditional university’s core competency lies in knowledge
creation, not in educating large numbers of students at the highest quality possible given
available resources. Most faculty care about educational quality less passionately than
they care about knowledge creation” (p. 142). The definition of quality in colleges and
universities, therefore, is multifaceted and diverse.
Regardless of quality’s definition in the higher education arena, it most certainly
encompasses more than solely a service component. “It includes within its ambit the
quality of inputs in the form of students, faculty, support staff and infrastructure; the
quality of processes in the form of learning and teaching activity; and the quality of
outputs in the form of the enlightened students that move out of the system” (Sahney,
2004). The array of potential services and service characteristics can include a wide
range of measures, including the institution’s emphasis on teaching students well, faculty
availability for student consultations, library services, class sizes, information systems,
and recreational and classroom facilities. Higher education has a number of
complementary and contradictory “customers.” Being mindful of the large number of
stakeholders the education system serves, this study defines the service quality
dimensions exclusively from the student perspective—with the student deemed the
primary external customer of the educational system.

21
Service Quality in Higher Education
Institutions of higher education serve students, and may well be considered
service organizations similar in characteristic to other service industries. As such,
Seymour (1993) proposes that higher education institutions govern themselves by the
same general principles as other service industries:
In any college or university we (administrators, staff, and professors) provide service to other groups (students, employers, society) as well as to each other. This is still difficult for many within the campus walls to accept. And even if we accept the notion that we provide service, that service is often perceived to be unique, so special that none of the standard rules and practices of the service industry apply. We believe ourselves to be apart from other institutions in our society. We need an attitude change (p. 31).
The change Seymour is suggesting has previously been experienced by financial
institutions, telecommunications companies, electric utilities, airlines, and a myriad of
other service-based industries. Over the past two decades, many universities have
experienced this change as part of their evolution from traditionally strict academic
institutions to organizations that more closely pattern service sector businesses. These
changes are driven by external market demands such as increasing capital fund
requirements, escalating human resources investments, soaring tuition costs, and higher
energy expenses which, in effect, have caused higher education administrators to more
closely pattern corporate practices involving customers.
Societal trends have also influenced the acceptance of service quality principles
in higher education. Kuh (1995) posited that societal trends have influenced the tendency
for colleges and universities to operate in a more business-like fashion. These influences
include the public’s growing dissatisfaction with the performance of higher education
22
systems, declining enrollments, changing student demographics, increasing market forces
and competition, and limitations imposed on the national economy from technological
developments and long-distance education. These forces have converged to compel
institutions to become more competitive vis-à-vis other service providers.
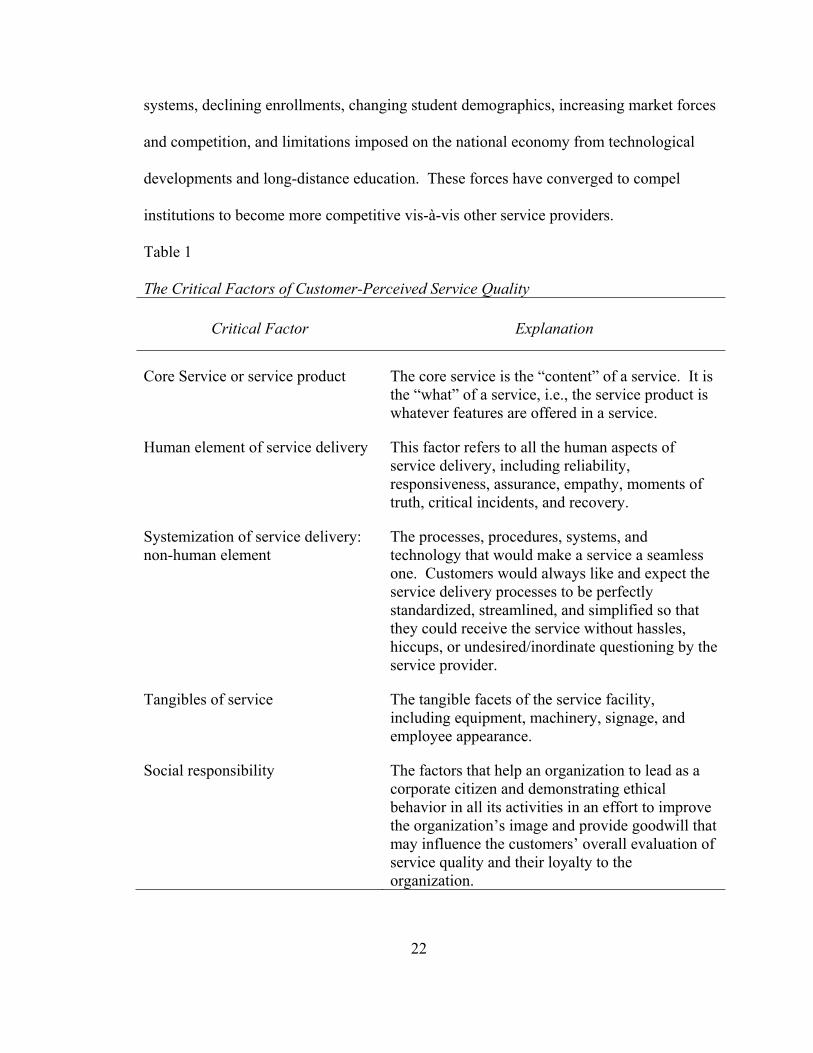
Table 1 The Critical Factors of Customer-Perceived Service Quality
Critical Factor Explanation
Core Service or service product The core service is the “content” of a service. It is the “what” of a service, i.e., the service product is whatever features are offered in a service.
Human element of service delivery This factor refers to all the human aspects of service delivery, including reliability, responsiveness, assurance, empathy, moments of truth, critical incidents, and recovery.
Systemization of service delivery: non-human element
The processes, procedures, systems, and technology that would make a service a seamless one. Customers would always like and expect the service delivery processes to be perfectly standardized, streamlined, and simplified so that they could receive the service without hassles, hiccups, or undesired/inordinate questioning by the service provider.
Tangibles of service The tangible facets of the service facility, including equipment, machinery, signage, and employee appearance.
Social responsibility The factors that help an organization to lead as a corporate citizen and demonstrating ethical behavior in all its activities in an effort to improve the organization’s image and provide goodwill that may influence the customers’ overall evaluation of service quality and their loyalty to the organization.
23
Sureshchandar et al. (2002) expands the factors impacting service quality in
higher education beyond those of external market and societal demands, and suggests that
“in today’s highly competitive world, the key to sustainable competitive advantage lies in
delivering high quality service that will, in turn, lead to satisfied customers” (p.15).
Sureshchandar describes the five factors of service quality which are deemed critical
from the customers’ point of view are summarized in Table 1.
Analogous to their business contemporaries, many higher education institutions
are becoming more attuned to the critical factors impacting service quality and customer
satisfaction. Like their business cousins’ long-standing emphasis on service quality and
customer satisfaction, a growing number of universities have adopted many of the same
measures in an effort to exceed their students’ expectations. One key driver influencing
university administrators to adopt business practices focused on service quality is the
pressure from governing boards of higher education, many of which are composed of
businesspeople attuned to the paramount importance of championing service quality
initiatives in their own workplaces.
On the other hand, “many institutions are very hesitant to consider themselves as
customer-driven entities” (p.11). Lewis and Smith (1994) observed that “every college
and university has a mission, but very few fully identify who they serve” (p.12).
Academia is inundated with academicians and administrators that do not acknowledge
that they serve customers (Lewis & Smith, 1994). In fact, some are offended at the
comparison with competitive business enterprises, as Keller (1983) noted:
American colleges and universities occupy a special, hazardous zone in society, between the competitive profit-making business sector and the government owned and run state agencies. They are dependent yet free,
24
market oriented yet outside cultural and intellectual fashions… They constitute one of the largest industries in the nation but are among the least businesslike and well managed of all organization (p. 5). In institutions that do admit that they have customers, there is general agreement
that businesses, government agencies, and the society at large are their customers. More
specifically, according to Lewis and Smith (2001), institutions typically serve a
consortium of internal customers (e.g. students, faculty and administrators) and external
customers (e.g. government, community, donors, alumni, and accrediting agencies). It is
important that institutions clearly identify who their customers are.
Lewis and Smith (2001) suggest that students can be identified as customers of
higher education, however, they have several important differences from the archetypal
business customer, for example:
Colleges and universities often admit students selectively based on certain academic standards and requirements. Businesses usually don’t do that. In fact, they do not ordinarily prevent perspective customers from purchasing their products and services. Also, in higher education, students do not totally pay for the full cost of their tuition and fees. These expenses are sometimes covered by payments from parents, state subsidies, scholarships, and student loans. In business, customers generally pay for their purchases with their own funds. Another difference is that once students are admitted they are continually tested and graded to determine how well they have learned their lessons. They must maintain their good academic standing in order to be able to take more advanced courses and complete their programs of study. Businesses do not do that to their customers (p. 23). Despite these differences, students are generally acknowledged to be the
primary customers of higher education (Hill, 1995; Meirovich & Romar, 2006).
Martensen, et al. (1999) stated that “without students to teach... there is no
business for higher education institutions, no research to conduct or service to
provide” (p. 372).
25
Educational institutions that are committed to serving students are often
focused on the continuous improvement of the students’ experience. They strive
to understand students’ expectations and anticipate their future requirements. To
accomplish these tasks, these educational institutions strive to listen to their
students and gather their feedback regarding items such as academics, admissions,
rules and policies, facilities, and registration, to name a few. It is essential to
measure students’ perceived satisfaction with higher education services in order to
continuously improve the institution’s study programs, teaching, staff, and
facilities. Over time, this continuous measurement provides vital information
necessary for effective decision making, monitoring performance, and effectively
allocating resources.
Service Quality and Institutional Effectiveness Efforts
Commonplace among institutions of higher education is an office of institutional
effectiveness, or similarly named department, that is chartered with researching and
providing relevant facts and figures primarily to institutional leadership, legislative
entities, and the public. Many institutions have instituted programs to measure the
quality of the services they provide to students. As part of these measurement efforts,
student characteristics and demographics are often collected for analysis and comparison.
The objective of this service quality measurement is to measure student satisfaction with
instructional programs, student services, and other aspects of the college experience in an
effort to diagnose opportunities to improve or enhance that experience. The ultimate sine
qua non is removing barriers in an effort to create satisfied and engaged students that are
more likely to learn and persist toward achieving their academic goals.
26
A key element of institutional service quality improvement efforts spearheaded by
institutional effectiveness departments is to disaggregate the measurement data to provide
a break down by race and ethnicity, gender, age, etc… to develop a genuine
understanding of how different student subgroups are faring at the institution.
Unfortunately, it appears that the published results of this research are very limited and
typically not available for public consumption, but rather held closely by the institution
for purposes of their own internal planning and service quality improvement efforts.
Such raw demographic data was available for certain institutions, however the data were
not definitively analyzed and no conclusions had been drawn from the data to indicate
satisfaction differences among subgroups.
In higher education, institutional research departments nationwide have been
collecting and analyzing student opinions relating to the institutional services provided.
As service quality has spread from business to education, many institutions of higher
education have been “stimulated and influenced by a total quality framework for both
teaching and administrative support functions” (Martensen, et al., 2000). A wide variety
of institutions have been measuring service quality as a centerpiece of their institutional
effectiveness efforts over a considerable amount of time.
The State University of New York (SUNY) is one of the largest comprehensive
systems of public institutions of higher education in the world. It is comprised of
approximately 413,000 students attending universities, colleges, and community colleges
in New York. SUNY has four University Centers in Albany, Binghamton, Buffalo, and
Stony Brook, each with their respective institutional effectiveness offices.

27
SUNY has implemented a customized version of the Student Opinion Survey
(ACT, Inc.) for a number of years, typically surveying students every three years to
collect longitudinal background and attitude information to access college impressions
and plans, satisfaction with college services and facilities, classroom experiences,
financial aid debt, and other aspects of the quality of campus services, programs, and
environments. Since there are a wide range of higher education institutions within the
SUNY system, the results typically cover the gamut. Nevertheless, it appears that several
factors show overriding importance in the SUNY system, including intellectually
stimulating class material; having a sense of belonging, and satisfaction with academic
advising services. SUNY’s customized surveys also evaluate sources of funds for
college, contact with faculty outside of class, and other “predictors” of student success.
When Thomas and Galambos (2004) mined the student opinion data at SUNY-
Stony Brook Office of Institutional Research using regression and decision-tree analysis
to analyze student-opinion data, they investigated how students' characteristics and
experiences affect satisfaction. A data mining approach identifies the specific aspects of
students' university experience that most influence the measures of general satisfaction.
“These measures have different predictors and cannot be used interchangeably.
Academic experiences are influential. In particular, faculty preparedness, which has a
well-known relationship to student achievement, emerges as a principal determinant of
satisfaction” (p. 252). The researchers found that “social integration and pre-enrollment
opinions are also important. Campus services and facilities have limited effects, and
students' demographic characteristics are not significant predictors” (p.252). They
concluded that decision tree analysis of the modified Student Opinion Survey (ACT, Inc.)
28
data revealed that social integration has more effect on the satisfaction of students who
are less academically engaged.
Northwestern State University (NSU) is a public four-year university primarily
situated in Natchitoches, Louisiana, with a nursing campus in Shreveport and general
campuses in Leesville/Fort Polk and Alexandria Louisiana. As part of their quality
enhancement plan studying academic and career engagement at NSU, the institutional
effectiveness department’s focused primarily on the academic component of the Student
Opinion Survey (ACT, Inc.). As a result, the grading system, instructor availability
outside of class, and class size relative to type of course were targeted for improvement
based on significant disparities compared to national norms.
The University of Wisconsin-Stout (UW-Stout) conducted an examination of
deep-learning and critical learning skills utilizing the Student Opinion Survey (ACT, Inc.)
and other student opinion instruments. UW-Stout, part of the University of Wisconsin
System, was founded 1891 in Menomonie, Wisconsin and enrolls more than 8,400
students. It provides programs related to professional careers in industry, technology,
home economics, applied art and the helping professions.
For three consecutive years from 2004-06, UW-Stout sophomore and junior level
students participated in-class on the Student Opinion Survey (ACT, Inc.), and those
scores were compared to peer group and national averages in an effort to determine the
level of satisfaction with certain services or programs, as well as how satisfied the
students were with the overall learning environment. Faculty relationships were assessed
via student ratings of out-of-class availability of your instructor and attitude of faculty
toward students. Students were generally very satisfied with this element of the survey,
29
however when students were asked additional questions about their learning
environment, over half indicated that they would have benefited by a freshman seminar
course that included information on study skills, career advisement, software training and
campus resources. The idea of implementing e-portfolios to document their learning was
also highlighted by nearly one-half of the respondents (Greene, 2007).
The Southeast Louisiana University’s Office of Institutional Research and
Assessment has received a directive from the State Board of Regents to “raise the level of
(student) satisfaction toward their university as reported by currently enrolled students in
Louisiana’s degree-granting, four-year institutions to the national average for each
institution’s Carnegie classification.” The Student Opinion Survey (ACT, Inc.) was
mandated by the Board of Regents to all public universities in Louisiana to measure
student satisfaction. Southeast Louisiana University is a 17,000-student state-funded
institution located in Hammond, Louisiana. Students ranked their satisfaction with
library services and facilities, class size relative to the type of course, recreational and
intramural programs and services, and computer services high, however the survey also
highlighted several important areas that students perceived negatively, including parking
facilities and services, purpose for which student activity fees are used, availability of
courses at the times you can take them, and student voice in college policies. In order to
establish the mandated rise in student satisfaction levels in these areas, these results have
been established as the benchmark against which future improvements will be measured.
The Student Outcomes Research Department at the University of Southern
California (USC) has offered the Student Opinion Survey (ACT, Inc.) to their students for
over two decades. Established in 1880, USC is California’s oldest private research
30
university and a leader in student opinion research in higher education, having used the
Student Opinion Survey (ACT, Inc.) instruments since 1984. USC examined factors
including student satisfaction with university services and programs, extracurricular
participation, and college financing. Interestingly, the differences from year-to-year are
rather minor, with the results typically overall better than their counterparts at other
institutions. The employment and demographic factors had changed over time. Nearly
one-half of students were employed, with one-third of those employed on campus. The
number of student work hours continues to increase, as do students concerns about
financial aid and support. The age of undergraduates is increasing, but slower than at
other comparable peer institutions. USC has targeted specific influencers of student
satisfaction and dissatisfaction to better understand the reasons students choose to attend
the University, and ways in which to retain them and keep them engaged in the learning
experience.
The North Central Association of Colleges and Schools (NCA) is one of six
regional accreditation organizations recognized by the United States Department of
Education and Council for Higher Education Accreditation. Founded in 1895, the NCA
accredits over 10,000 public and private educational institutions serving nineteen
Midwestern, South-Central and a few Western states, including: Arkansas, Arizona,
Colorado, Iowa, Illinois, Indiana, Kansas, Michigan, Minnesota, Missouri, North Dakota,
Nebraska, New Mexico, Ohio, Oklahoma, South Dakota, West Virginia, Wisconsin, and
Wyoming.
As part of their Commissions’ institutional effectiveness efforts to assess the
challenges and strategies associated with student learning, the Higher Learning

31
Commission of the North Central Association of Schools has highlighted some of the
problems associated with probing student attitudes about their experience with teaching
and curriculum in both general education and the students’ major. Aside from the
benefits of employing longitudinal studies of student opinions and comparing the
institutional results with peer institutions using the Student Opinion Survey (ACT, Inc.),
López (2002) indicates that:
The principal problem with over-reliance on survey instruments (e.g., student, alumni, and employer surveys) is that they yield self-reported data; that is, they provide only participants’ opinions on how much they have learned as well as opinions on other subjects that may not directly relate to their learning. In other words, surveys typically do not focus on what we know from several decades of research is likely to make a difference in student persistence and academic achievement as well as those educational practices and strategies that promote learning or affect what the student can do as a result of that learning. While a well-constructed survey does have value as an indirect source of information about factors that contribute to or detract from student learning, it is not a direct measure and cannot provide results that substitute for data obtained from the use of direct measures of student learning. Clearly then, survey data are useful when triangulated with data from direct measures of student learning (p. 356).
As a result of the institutional research on student opinions, López (2002) posits
that “the five benchmarks of effective educational practice are: level of academic
challenge; student interaction with faculty members; active and collaborative learning;
enriching educational experiences; and supportive campus environments” (p. 361). The
benchmarks contribute to institutional understanding of survey results, however “as
valuable as surveys may be when used in combination with direct measures, accreditation
teams are consistently critical of heavy or exclusive use of indirect measures such as
surveys” (p. 361). Nevertheless, the surveys conducted by myriad higher education
institutions have directly impacted the quality of services provided and the students’
satisfaction with those institutional services.
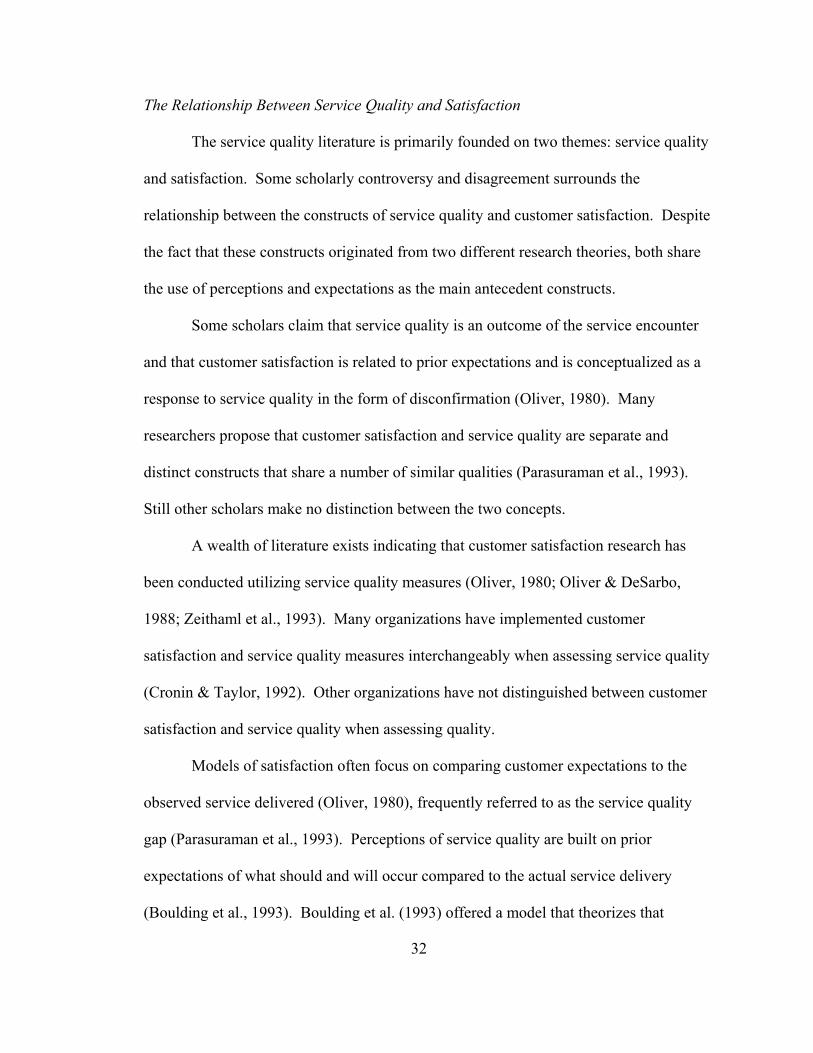
32
The Relationship Between Service Quality and Satisfaction
The service quality literature is primarily founded on two themes: service quality
and satisfaction. Some scholarly controversy and disagreement surrounds the
relationship between the constructs of service quality and customer satisfaction. Despite
the fact that these constructs originated from two different research theories, both share
the use of perceptions and expectations as the main antecedent constructs.
Some scholars claim that service quality is an outcome of the service encounter
and that customer satisfaction is related to prior expectations and is conceptualized as a
response to service quality in the form of disconfirmation (Oliver, 1980). Many
researchers propose that customer satisfaction and service quality are separate and
distinct constructs that share a number of similar qualities (Parasuraman et al., 1993).
Still other scholars make no distinction between the two concepts.
A wealth of literature exists indicating that customer satisfaction research has
been conducted utilizing service quality measures (Oliver, 1980; Oliver & DeSarbo,
1988; Zeithaml et al., 1993). Many organizations have implemented customer
satisfaction and service quality measures interchangeably when assessing service quality
(Cronin & Taylor, 1992). Other organizations have not distinguished between customer
satisfaction and service quality when assessing quality.
Models of satisfaction often focus on comparing customer expectations to the
observed service delivered (Oliver, 1980), frequently referred to as the service quality
gap (Parasuraman et al., 1993). Perceptions of service quality are built on prior
expectations of what should and will occur compared to the actual service delivery
(Boulding et al., 1993). Boulding et al. (1993) offered a model that theorizes that

33
customer satisfaction demonstrates a cumulative effect that may occur each unique time a
customer is exposed to the service. This model assumed that customers make
comparative judgments during each of these individual service encounters.
Empirical evidence has confirmed that the customers’ perceptions of service
quality and customer satisfaction directly affect their intention to positively favor an
organization. Zeithaml and Bitnet (2000) expanded on this research to show that
customers’ positive behavior toward an organization is evidenced in positive word-of-
mouth, intention to return, additional volume purchases, and willingness to pay a
premium for the organization’s products and services (Zeithaml & Bitnet, 2000). These
outcomes may lead to increased customer loyalty and profitability.
Service Quality Outcomes
Many organizations view the delivery of service quality as a strategic intervention
for increasing organizational effectiveness and gaining competitive advantage in today’s
competitive environment (Parasuraman, Zeithaml, & Berry, 1985; Reichheld & Sasser,
1990). Research has traditionally focused on the probable outcomes of service quality,
including increased profitability and market share, strength of preference for a service
provider, and customer satisfaction. Initially, service quality practitioners, both business
and academic, focused on defining what service quality was from the vantage point of
their customers, and then developing strategies to meet their customers’ needs
(Parasuraman, Zeithaml, & Berry, 1985). More recently, research has focused on the
practical influence of service quality on the bottom-line profitability of the organization.
The link between service quality and profitability is often difficult to quantify.
Along with service quality, profitability is impacted by a number of variables including

34
advertising, pricing, image, and efficiency (Parasuraman, Zeithaml, & Berry, 1985).
Investing human and capital resources into service quality improvement efforts does not
necessarily assure profitability, as those efforts can be directly influenced by the
organization’s strategy and execution as well (Parasuraman, Zeithaml, & Berry, 1985).
In an effort to gauge the effectiveness of an organization’s service quality
initiatives, customers’ perceptions are gathered and measured. This measurement
provides the information necessary for effective decision making, monitoring
performance, and effectively allocating resources to enhance profitability.
Service Quality Measurement
Delivering quality service is considered an essential strategy for success and
survival in today’s competitive environment (Zeithaml, Parasuraman, & Berry, 1990).
Several research approaches are available to capture the quality of the service delivered,
including traditional satisfaction surveys, tracking customer complaints, and market and
employee surveys (Grapentine, 1998). These methods are supplemented with other
approaches such as mystery shoppers, focus groups, and customer advisory panels.
Early efforts at measuring and quantifying the results of improved quality came
from the private sector. Crosby (1979) defined quality as “conformance to requirements”
and “doing it right the first time,” while Juran defined quality as “those product features
which meet the needs of customers and thereby provide satisfaction” (Juran, 1999).
Service quality has been more challenging and elusive to measure than product
quality. In their groundbreaking research on service quality, Parasuraman, Zeithmal, and
Berry (1985) employed “gap analysis” to the provisioning of services. They offered a
framework for measuring service quality whereby it is defined as the gap between
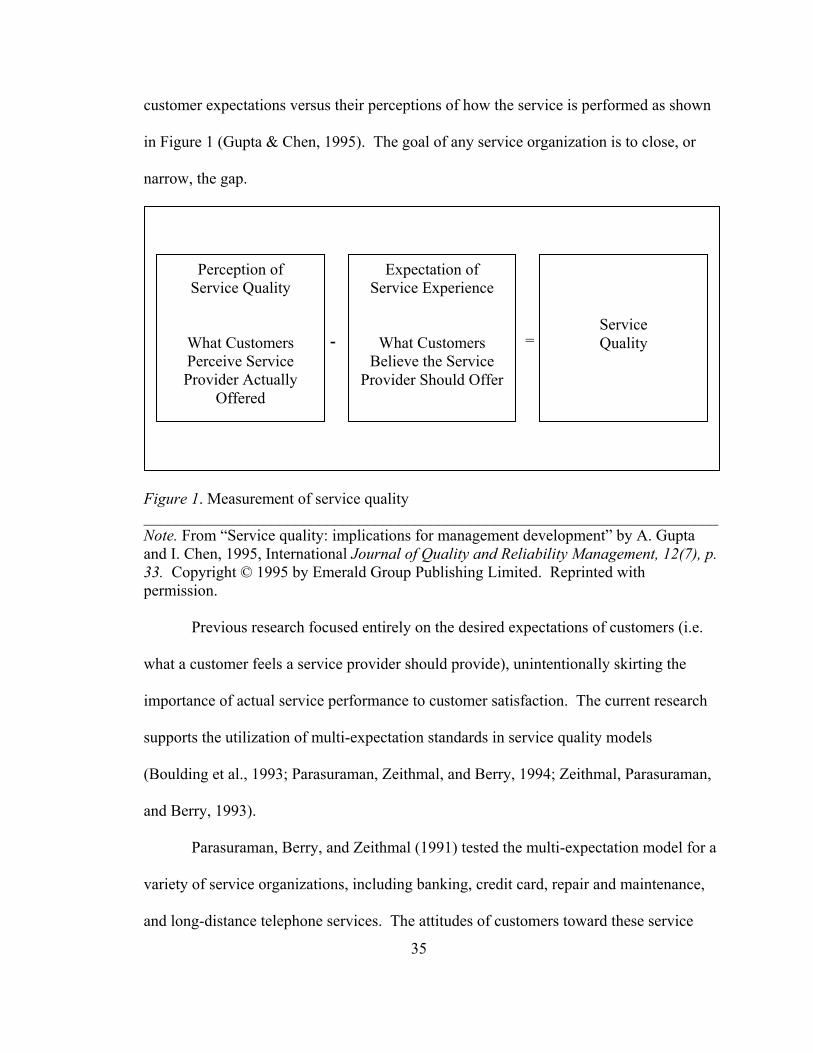
customer expectations versus their perceptions of how the service is performed as shown
in Figure 1 (Gupta & Chen, 1995). The goal of any service organization is to close, or
narrow, the gap.
Service Quality
Expectation of Service Experience
What Customers Believe the Service
Provider Should Offer
Perception of Service Quality
What Customers Perceive Service Provider Actually
Offered
- =
Figure 1. Measurement of service quality ________________________________________________________________________ Note. From “Service quality: implications for management development” by A. Gupta and I. Chen, 1995, International Journal of Quality and Reliability Management, 12(7), p. 33. Copyright © 1995 by Emerald Group Publishing Limited. Reprinted with permission.
Previous research focused entirely on the desired expectations of customers (i.e.
what a customer feels a service provider should provide), unintentionally skirting the
importance of actual service performance to customer satisfaction. The current research
supports the utilization of multi-expectation standards in service quality models
(Boulding et al., 1993; Parasuraman, Zeithmal, and Berry, 1994; Zeithmal, Parasuraman,
and Berry, 1993).
Parasuraman, Berry, and Zeithmal (1991) tested the multi-expectation model for a
variety of service organizations, including banking, credit card, repair and maintenance,
and long-distance telephone services. The attitudes of customers toward these service
35
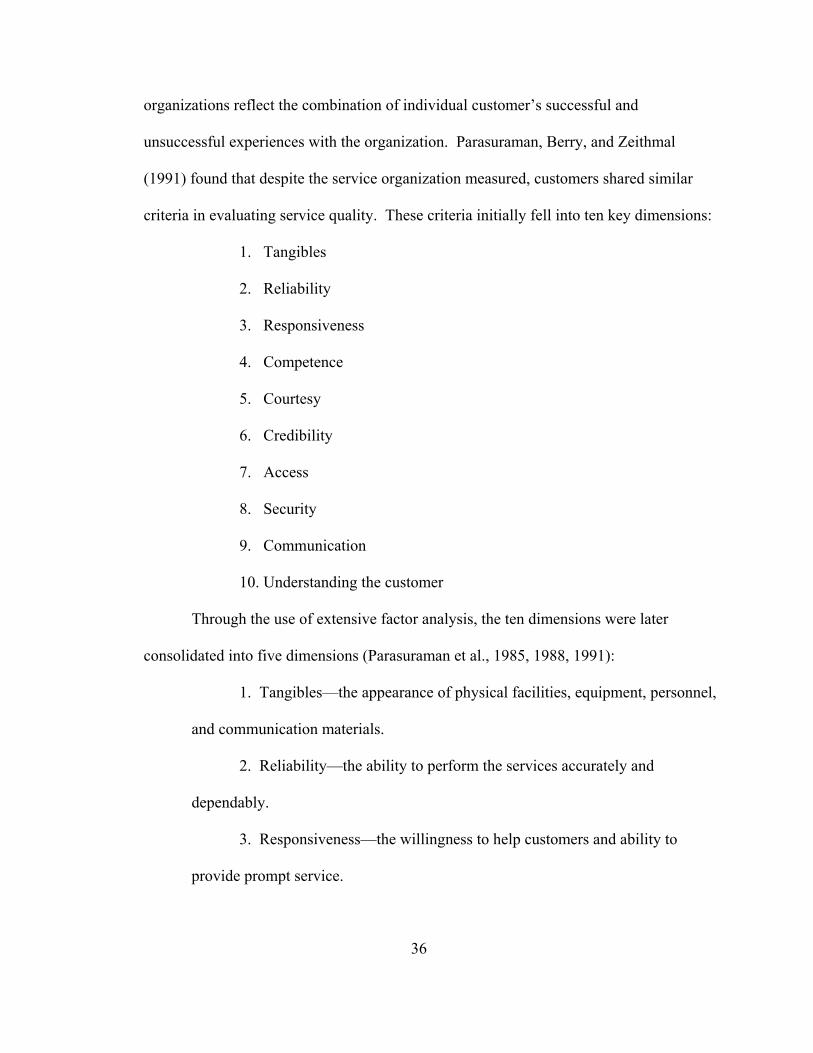
36
organizations reflect the combination of individual customer’s successful and
unsuccessful experiences with the organization. Parasuraman, Berry, and Zeithmal
(1991) found that despite the service organization measured, customers shared similar
criteria in evaluating service quality. These criteria initially fell into ten key dimensions:
1. Tangibles
2. Reliability
3. Responsiveness
4. Competence
5. Courtesy
6. Credibility
7. Access
8. Security
9. Communication
10. Understanding the customer
Through the use of extensive factor analysis, the ten dimensions were later
consolidated into five dimensions (Parasuraman et al., 1985, 1988, 1991):
1. Tangibles—the appearance of physical facilities, equipment, personnel,
and communication materials.
2. Reliability—the ability to perform the services accurately and
dependably.
3. Responsiveness—the willingness to help customers and ability to
provide prompt service.
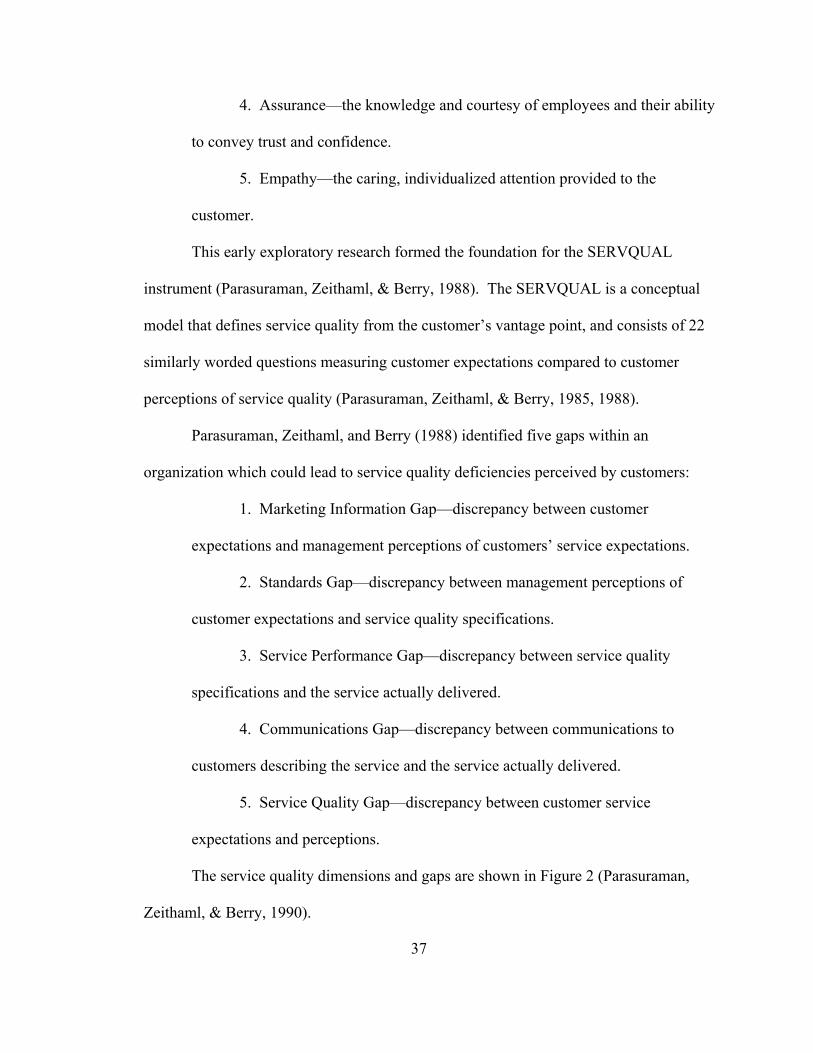
37
4. Assurance—the knowledge and courtesy of employees and their ability
to convey trust and confidence.
5. Empathy—the caring, individualized attention provided to the
customer.
This early exploratory research formed the foundation for the SERVQUAL
instrument (Parasuraman, Zeithaml, & Berry, 1988). The SERVQUAL is a conceptual
model that defines service quality from the customer’s vantage point, and consists of 22
similarly worded questions measuring customer expectations compared to customer
perceptions of service quality (Parasuraman, Zeithaml, & Berry, 1985, 1988).
Parasuraman, Zeithaml, and Berry (1988) identified five gaps within an
organization which could lead to service quality deficiencies perceived by customers:
1. Marketing Information Gap—discrepancy between customer
expectations and management perceptions of customers’ service expectations.
2. Standards Gap—discrepancy between management perceptions of
customer expectations and service quality specifications.
3. Service Performance Gap—discrepancy between service quality
specifications and the service actually delivered.
4. Communications Gap—discrepancy between communications to
customers describing the service and the service actually delivered.
5. Service Quality Gap—discrepancy between customer service
expectations and perceptions.
The service quality dimensions and gaps are shown in Figure 2 (Parasuraman,
Zeithaml, & Berry, 1990).
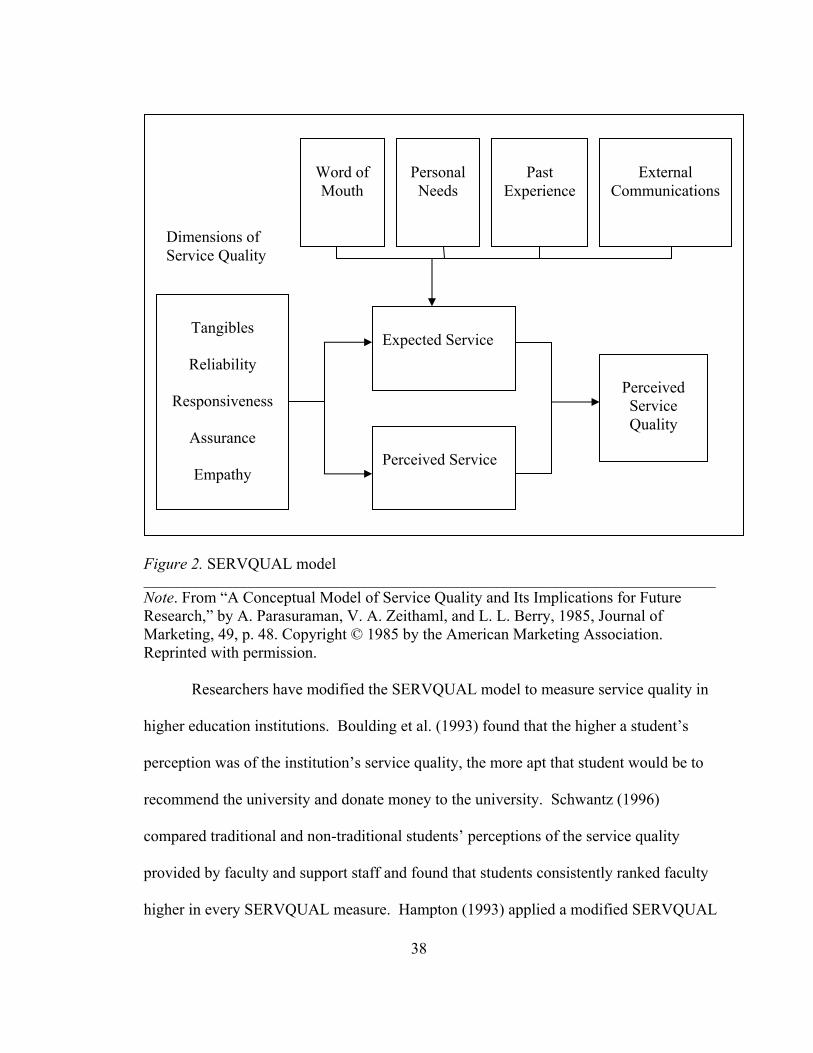
Tangibles
Reliability
Responsiveness
Assurance
Empathy
Word of Mouth
Personal Needs
Past
Experience
Expected Service
Perceived Service Quality
Perceived Service
Dimensions of Service Quality
External
Communications
Figure 2. SERVQUAL model ______________________________________________________________________________________ Note. From “A Conceptual Model of Service Quality and Its Implications for Future Research,” by A. Parasuraman, V. A. Zeithaml, and L. L. Berry, 1985, Journal of Marketing, 49, p. 48. Copyright © 1985 by the American Marketing Association. Reprinted with permission.
Researchers have modified the SERVQUAL model to measure service quality in
higher education institutions. Boulding et al. (1993) found that the higher a student’s
perception was of the institution’s service quality, the more apt that student would be to
recommend the university and donate money to the university. Schwantz (1996)
compared traditional and non-traditional students’ perceptions of the service quality
provided by faculty and support staff and found that students consistently ranked faculty
higher in every SERVQUAL measure. Hampton (1993) applied a modified SERVQUAL
38
39
to determine if student satisfaction with professional services encompassing the quality of
education, teaching, social life, campus facilities, effort to pass courses, and student
advising were linked to students’ evaluation of service quality. He found that student
satisfaction was directly dependent on the quality of service provided and therefore
concluded that gap analysis was an effective measure of service quality for the
professional services in higher education.
Common assessments of quality within higher education institutions include
measures of how students rate the quality of instruction, students’ overall satisfaction
with the education they are getting, achievement of learning outcomes, whether the
students would recommend their university to others, graduates’ pass rate on licensing
and professional exams, admissions to graduate and professional schools, and findings of
alumni surveys.
Frequently, these measures of institutional quality are defined predominantly by
the institutions and are of limited importance to students. Institutional quality measures
often focus on areas that contribute to institutional prestige; for example, test scores of
incoming freshman, the level of research expenditures, and the number of national
academy faculty and national student scholars.
The Student Opinion Survey (ACT, Inc.) is tailored for higher education
institutions (Educational Testing Service, 1977). This instrument examines student
satisfaction with university services in such areas as academics, admissions, rules and
policies, facilities, and registration while gathering students’ perceptions and experiences
with the institutional environment. These ratings are compared to national norms
compiled by the American College Testing Service.

40
Contribution to the Literature
This study is intended to contribute to the development and understanding of
service quality and customer satisfaction measurement in higher education, as well as
provide a guide to higher education leaders tasked with evaluating service quality and
customer satisfaction improvement efforts. The model is designed to support higher
education management in their quest to expose service quality problems. This research
will evaluate a framework for assessing the impact of student perceptions of college
services and college environment on customer satisfaction, with the long-term intent of
minimizing detractors to providing exceptional service quality, positively influencing
customer satisfaction, and building loyalty intentions among students.
Summary
This chapter began with a literary overview of the quality movement from its
early product-focused theories and models through to its current focus on service quality
in United States and Japan. This section reviewed the theoretical foundations of service
quality, followed by a chronological evaluation of the historical context of key authors’
contributions to the theories and conceptual frameworks that have defined service quality
in higher education. The relationship between service quality and customer satisfaction
was examined, along with their impact on service quality outcomes.
A viable measure of service quality was proposed in a landmark study by
Parasuraman, Zeithaml, and Berry (1988) that conceptualized service quality gaps
between customer expectations and perceptions. The resulting measurement instrument,
SERVQUAL, provides the theoretical framework for measuring service areas in need of
improvement. An extension and adaptation of the SERVQUAL model tailored to the
41
higher education environment was introduced, namely the ACT Service Opinion Survey.
Based on the research and studies cited in this chapter, the researcher determined that the
method employed by the Student Opinion Survey (ACT, Inc.) is an appropriate method
for assessing service quality in higher education.
42
Chapter Three
Methods
Introduction
This quantitative study was designed to use a service quality model to investigate
undergraduate student perceptions of service quality in a large southeastern
doctoral/research extensive university. Additionally, this study examined whether
undergraduate student satisfaction varies based on selected demographic characteristics,
and compared student satisfaction with college services and environment to that of
similar institutions of higher education. This chapter provides descriptions of the
research design, population and sample, instrument, data collection procedures, data
organization and the data analysis methods used in the study.
Several research questions were used to guide the investigation:
1. What is the general level of satisfaction with the college services and environment
among undergraduate students at a large southeastern doctoral/research extensive
university as measured by the Student Opinion Survey (ACT, Inc.)?
2. What is the level of satisfaction with the college services and environment among
undergraduate students at a large southeastern doctoral/research extensive
university in relation to students at similar institutions nationwide?
43
3. What is the relationship between the personal characteristics of undergraduate
students and student satisfaction with the college services and environment
derived from comparisons among subgroups?
Research Design
Statistical surveys are used to collect quantitative information about items in a
population (Weisberg & Krosnick, 1989). Descriptive research describes data and
characteristics about the population being studied, and is often collected using statistical
surveys. Descriptive research answers the questions of who, what, where, when, and
how; however, it is not helpful in explaining causal relationships, where one variable
affects another (Gay, 1992). This study utilizes a descriptive research design which is
useful for collecting data about a respondent’s interests, beliefs, attitudes, and opinions
and behaviors (Gay, 1992).
Population and Sample
The sample size is influenced by a number of factors including the purpose of the
study, population size, the risk of selecting an unsuitable sample, and the allowable
sampling error. The sample size is determined based on the size of the target population
and the desired accuracy of the study. The target population consisted of a random
sample of undergraduate students, 18 years of age and over, attending the main campus
of a large southeastern doctoral/research extensive university in the spring semester of
2008. The target population is 26,828. In this study, a random sample was selected from
the target population using the “Random Numbers Generator” feature of the SPSS
statistical package.
44
Sampling accuracy is determined by the level of precision, the level of confidence
or risk, and the degree of variability in the attributes being measured. The level of
precision is sometimes called the sampling error, and is the range in which the true value
of the population is estimated to be. The level of confidence is based on the Central
Limit Theorem, which states that when a population is repeatedly sampled, the average of
the attribute obtained by those samples is equal to the true population value. Finally, the
degree of variability in the attributes being measured refers to the distribution of
attributes in the population.
This study relied on the published tables which provide a sample size for a given
set of criteria. The sample size for categorical variables was determined using Cochran’s
(1977) formulas, which were calculated and supplied in a table based on different levels
of precision, confidence levels, and variability. Barlett, et al. (2001) provided a table for
determining the minimum returned sample size for a given sample population size (i.e.
6,000 students) for categorical data, which is 362 student responses with a 95% level of
confidence (p. 48).
Sample participants had the option of choosing to participate or not participate in
the questionnaire. The students responding to the study constituted a purposeful sample
of informants (Fraenkel & Wallen, 2000), which is an appropriate design approach when
understanding of a particular phenomenon is desired (Denzin & Lincoln, 2005; Seidman,
1998; Kvale, 1996).
Instrument
Perceptions of service quality were gathered from a self-reported survey
instrument, the Student Opinion Survey (ACT, Inc.), which is developed, normed, and
45
scored by ACT, Inc. (See Appendix A: Instrument - Student Opinion Survey). The
survey instrument examined a random sample of student opinions on a 5-point Likert
scale which indicates the relative importance that students place on university services in
such areas as academics, admissions, rules and policies, facilities, and registration.
Additionally, the survey collected student background and attitude information in an
effort to better gauge specific aspects of the institutional environment, along with the
individual student impressions and experiences at the institution. These ratings were
compared with national norms compiled by American College Testing Service of similar
public universities nationwide.
The normative report is based on 92,251 student records obtained from 102
colleges that administered the Student Opinion Survey (ACT, Inc.) between January 1,
2003 and July 31, 2006. Normative data of this type is often referred to as “user norms”
since they represent a composite of the data obtained by a number of institutions that
administered the instrument during a particular period of time rather than a representative
sample. A total of 25,236 records were eliminated from the normative report to ensure
that no institution or state would be over-represented. Public and private institutions of
higher education from 31 states are represented in the normative report (ACT Educational
and Social Research, 2007). The survey instrument provided information on institutional
service quality relative to several subgroups, including age, gender, ethnicity, degree
area, cumulative GPA, class level, type of prior school attended, location of college
residence, full- or part-time status, and type of degree.

46
Reliability and Validity of the Survey Instrument
ACT, Inc. has refined and revised the Student Opinion Survey following generally
accepted psychometric procedures. This instrument has been used by a wide variety of
institutional research departments at colleges and universities throughout the United
States. Validity issues for the Student Opinion Survey (ACT, Inc.) have been investigated
by researchers to gauge the appropriateness, meaningfulness, and usefulness of the
instrument for collecting student opinion data.
Reliability in this context is the extent to which a measurement procedure is free
from error. All measurement procedures contain some degree of error that causes
inconsistencies when attempting to replicate a survey. Several methods exist to estimate
the consistency of the measurement procedure, such as internal-consistency reliability
indices (e.g. coefficient alpha), equivalence indices, and stability indices.
The internal consistency reliability indices are not appropriate for (the Student Opinion Survey) instrument because (1) many instruments have no logical scales on which to base a total score, (2) items on (the Student Opinion Survey) instrument usually represent the objects of measurement, not the conditions of measurement procedure, and (3) those investigating (the Student Opinion Survey) are usually concerned with those measurement errors associated with replications of measurement procedure across samples of responses, measurement locations, or points of time, more than with internal consistencies among the items. For these reasons, the reliability of (the Student Opinion Survey) instrument is assessed using the generalizability and stability indices” (p.11). The Student Opinion Survey (ACT, Inc.) instrument is seldom used to evaluate
institutional plans, goals, and impressions of individual students. The data are typically
analyzed as generalized estimates of groups of students to form summary information for
institutional planning and evaluation. Institutions gather this information to identify the
relative importance of student satisfaction with their myriad programs and services by
47
comparing these group means. The major source of measurement error occurs when
comparing individual survey items and the rank order of items. Therefore the reliability
estimates for the Service Quality Survey are based mostly upon the generalizability
coefficients grounded in the framework of generalizability theory.
The ACT Educational and Social Research reported reliability estimates showing
the magnitude of the generalizability coefficient based on item and institution
measurement, the projected number of students to be surveyed, and the survey results for
satisfaction with college services and college environment. The generalizability
coefficient is similar to the typical reliability coefficient, as it indicates the degree of
consistency of the measurement procedure over many replications. Based on these
estimates, this researcher was able to determine a sufficient sample size and design a
study capable of achieving an acceptable level of reliability. Based on this research, to
achieve a reliability coefficient above .95 for evaluating programs and services using the
College Environment scales on the Student Opinion Survey (ACT, Inc.), this researcher
randomly selected 5,000 students from the institution (ACT Educational and Social
Research, 2007).
Accordingly, this research indicates that in situations where rank-ordering of the
individual items is of interest, the measurement errors made from the sampling process
are relatively small when more than 5,000 students are randomly selected from the
sample. Consistent ratings were achieved even when different samples of students were
selected to respond to the survey, providing no changes had been made to the survey
items.
48
The reliability of the Student Opinion Survey (ACT, Inc.) can also be accessed
through stability estimates by administering the survey to the same group of students on
two different occasions, and then comparing the results. A large, Midwestern university
administered the Student Opinion Survey (ACT, Inc.) to three separate classes. The
classes were composed of both graduate and undergraduate students enrolled during the
summer of 1981. The two administrations of the survey occurred two weeks apart. The
average percentages of identical item responses on the two administrations were very
high: 98 percent for the Demographic Background items, 90 percent for Other
Background items, and 93 percent for College Services items. The magnitude of these
reliability statistics indicates that the Student Opinion Survey (ACT, Inc.) exhibits a high
degree of consistency and stability (ACT Educational and Social Research, 2007).
Data Collection Procedures
This researcher submitted the appropriate materials (Student Opinion Survey
instrument, procedures used in data collection, and reporting procedures) to the (target
university) Institutional Review Board (IRB) on April 3, 2008 seeking approval to
conduct the survey before any data was collected. IRB approval was received on April 8,
2008. The data collection process consisted of (1) receiving IRB approval; (2) e-mailing
the initial survey instrument; (3) collecting and organizing survey responses; and (4)
reviewing the survey responses for completeness.
This is a descriptive, non-experimental, exploratory study using survey methods
for data collection and quantitative analysis as it relates to service quality in higher
education. A link to the survey was emailed to all participants of this study. A letter
explaining the study was provided to all of the participants. Each participant was
49
assigned a unique sign-in identifier. Instructions were provided in the letter on how to
complete the online survey. Each student was asked to complete the survey.
The researcher developed the following procedures to manage and control the
quality of data collected and the subjects’ privacy: (1) E-mail addresses of 6,000
randomly selected (target university) students was secured from the (target university)
Graduate School Office and kept on a personal computer in an encrypted file using AES-
256 encryption algorithms; (2) A link to the survey was e-mailed to participants; (3) The
survey instruments was reviewed for completeness. Complete and incomplete responses
to the survey instrument were entered into the SPSS program database; (4) Results of the
recruitment process were not identifiable to an individual student.
Data Organization
A codebook was built by this researcher describing each independent and
dependent variable in the analysis. The responses to the variables were entered into the
statistical application software package SPSS for analysis.
Data Analysis Methods
Marshall and Rossman (1995) argue that “Data analysis is the process of bringing
order, structure, and meaning to the mass of collected data. It is a messy, ambiguous,
time-consuming, creative, and fascinating process” (p.111). The survey responses were
analyzed using a mixture of statistical approaches in an effort to provide order, structure,
and meaning to the survey data collected.
The statistical data were analyzed using descriptive statistics (mean, median,
mode, standard deviation, range and correlation) and inferential statistics (independent t-
tests). Descriptive research answers the questions of who, what, where, when, and how;
50
however, it is not used to create a causal relationship, where one variable affects another
(Gay, 1992). One frequently used form of descriptive research involves assessing
attitudes or opinions toward individuals, organizations, events, or procedures (Gay,
1992). Inferential statistics is used to make inferences concerning some unknown aspect
of a population from a small random sample drawn from it.
The analysis of the data was reported using the research questions as a foundation.
The analysis plan of hypothesis testing is shown in table 2. The researcher analyzed the
data in relation to each research question as follows:
1. What is the general level of satisfaction with the college services and environment
among undergraduate students at a large southeastern doctoral/research extensive
university as measured by the Student Opinion Survey (ACT, Inc.)? This research
question was analyzed using descriptive statistics (mean, median, mode, standard
deviation, range and correlation).
2. What is the level of satisfaction with the college services and environment among
undergraduate students at a large southeastern doctoral/research extensive
university in relation to students at similar institutions nationwide? This research
question was analyzed using descriptive statistics (mean, median, mode, standard
deviation, range and correlation) and inferential statistics (independent t-tests) to
investigate the responses in comparison to other higher education institutions.
3. What is the relationship between the personal characteristics of undergraduate
students and student satisfaction with the college services and environment
derived from comparisons among subgroups? This research question analyzed
the significant differences among student responses based on a variety of
51
demographic variables using descriptive (mean, median, mode, standard
deviation, range and correlation) and inferential statistics (independent t-tests and
one-way ANOVA) to make inferences about the population based on the sample.
Summary
This chapter provided descriptions of the research design, population and sample,
instrument, data collection procedures, data organization and the data analysis methods to
be used in the study to answer the research questions. The next section of the study will
offer a presentation and analysis of the data.
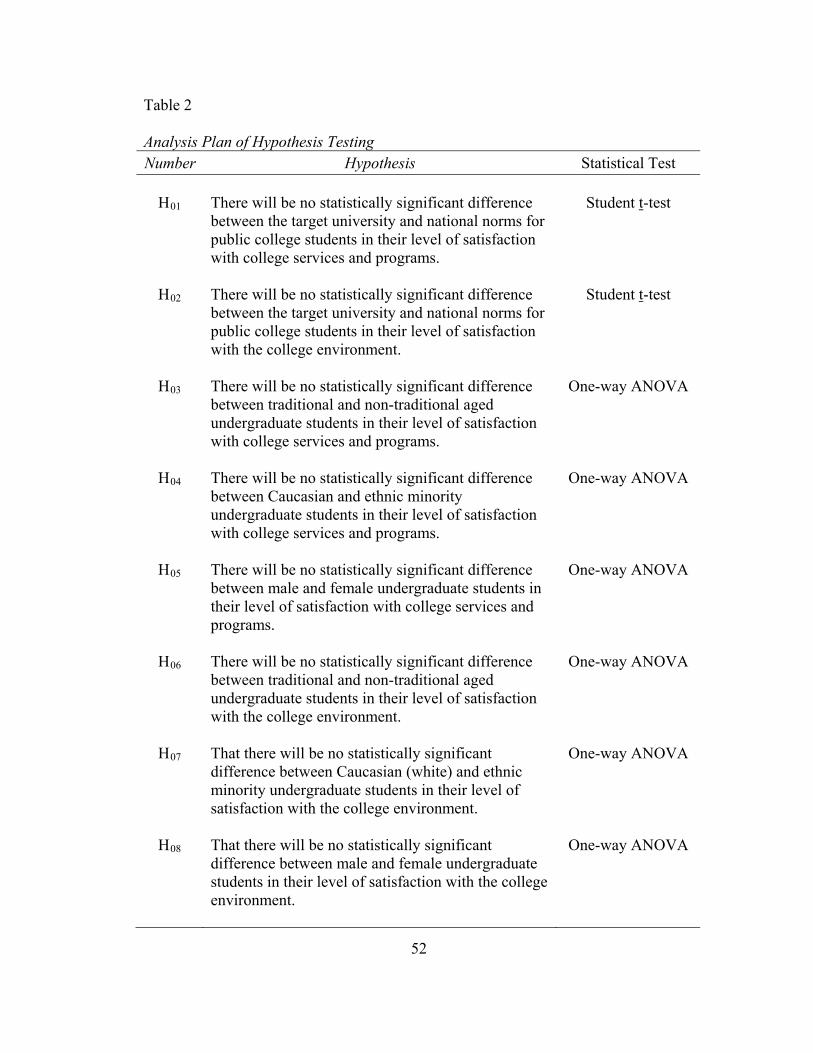
52
Table 2 Analysis Plan of Hypothesis Testing Number Hypothesis Statistical Test
H01
There will be no statistically significant difference between the target university and national norms for public college students in their level of satisfaction with college services and programs.
Student t-test
H02 There will be no statistically significant difference between the target university and national norms for public college students in their level of satisfaction with the college environment.
Student t-test
H03 There will be no statistically significant difference between traditional and non-traditional aged undergraduate students in their level of satisfaction with college services and programs.
One-way ANOVA
H04 There will be no statistically significant difference between Caucasian and ethnic minority undergraduate students in their level of satisfaction with college services and programs.
One-way ANOVA
H05 There will be no statistically significant difference between male and female undergraduate students in their level of satisfaction with college services and programs.
One-way ANOVA
H06 There will be no statistically significant difference between traditional and non-traditional aged undergraduate students in their level of satisfaction with the college environment.
One-way ANOVA
H07 That there will be no statistically significant difference between Caucasian (white) and ethnic minority undergraduate students in their level of satisfaction with the college environment.
One-way ANOVA
H08 That there will be no statistically significant difference between male and female undergraduate students in their level of satisfaction with the college environment.
One-way ANOVA
53
Chapter Four
Presentation and Analysis of the Data
Introduction
The purpose of this study was to examine undergraduate student satisfaction with
college services and environment at a large southeastern doctoral/research extensive
university (Carnegie Classification of Institutions of Higher Education, 2000), with the
long-term intent of minimizing detractors to providing exceptional service quality,
positively influencing customer satisfaction, and building loyalty intentions among
students. This chapter contains the data collected from the survey of undergraduate
students, the statistical treatment, and analysis of the data. The findings of the research
questions are presented in sequence.
The data were collected from a stratified random sample of undergraduate
students from a large southeastern doctoral/research extensive university (i.e. target
university) over a two-week period from April 10-24, 2008. The initial email (see
Appendix C), along with two reminder emails were sent to students during that period.
Of the 4,000 undergraduate students randomly selected to receive the survey, 548
students voluntarily participated in the survey, for a response rate of nearly 14%. Fifteen
percent of those responses were incomplete or unusable, for a total of 467 usable survey
responses.
54
Response rates for email and web-based surveys are often lower than those of
other methods, however internet-based surveys offer several benefits according to Kwak,
et al. (2002), including “reduction in research costs and efficient survey administration in
terms of time and resource management” (p. 257). This researcher posits that the
response rate might likely have been slightly higher had the survey not been distributed
several weeks before the administration of finals week at the target university. Dillman
and Bowker (2000) suggest that:
We are witnessing an explosion in the use of web surveys to collect sample survey information that was previously collected by other means of surveying. Only a few years ago the use of web questionnaires as a data collection device was not a matter that received research attention from specialists in survey research. Rather than being at the forefront of this latest innovation in the conduct of social surveys, survey methodologists are playing catch-up as they learn to master these new survey development tools (p. 1). The frequencies and percentages of the various support services used by
undergraduate student respondents were calculated. Students indicated whether or not
they had used the college services and programs, and further rated their perceived level of
satisfaction with these services and programs on a five point Likert scale from very
satisfied to very dissatisfied. The mean and standard deviations for the measured levels
of satisfaction with the support services in Section II and Section III of survey instrument
were calculated for each of the support services (dependent variables).
The mean and standard deviations of the dependent variables were also compared
with the norms of ACT, Inc.’s “Normative Data Report” in an effort to determine how
the level of satisfaction with support services at a large southeastern doctoral/research
extensive university compared to the national norms. Two-tailed t-tests were calculated
55
to determine the statistical significance for mean differences in these levels of
satisfaction. The normative report is based on 92,251 student records obtained from 102
colleges that administered the Student Opinion Survey (ACT, Inc.) between January 1,
2003 and July 31, 2006.
To make inferences vis-à-vis the level of satisfaction of students with different
demographic attributes, one-way ANOVA calculations were employed to test the
hypotheses based on the survey responses using SPSS statistical software.
Several research questions were used to guide the investigation:
1. What is the general level of satisfaction with the college services and environment
among undergraduate students at a large southeastern doctoral/research extensive
university as measured by the Student Opinion Survey (ACT, Inc.)?
2. What is the level of satisfaction with the college services and environment among
undergraduate students at a large southeastern doctoral/research extensive
university in relation to students at similar institutions nationwide?
3. What is the relationship between the personal characteristics of undergraduate
students and student satisfaction with the college services and environment
derived from comparisons among subgroups?
Survey Participants Demographic Information
An estimate of the nature of the population in this study is provided in this
section. Table 3 provides personal demographic information regarding the age, race,
class level, gender, and material status of the 467 respondents to the Student Opinion
Survey (ACT, Inc.). The majority of respondents can be characterized as white,
unmarried, traditional-aged students. Twelve students indicated their class level as
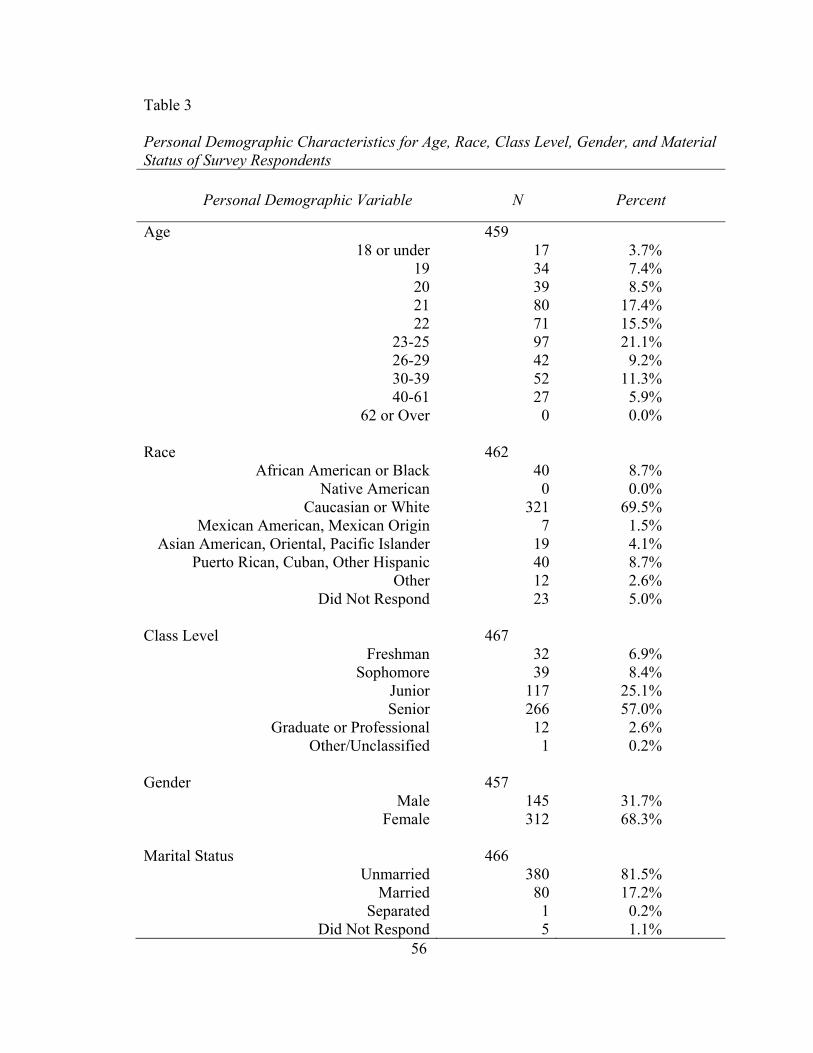
56
Table 3 Personal Demographic Characteristics for Age, Race, Class Level, Gender, and Material Status of Survey Respondents
Personal Demographic Variable N Percent
Age 18 or under
19202122
23-2526-2930-3940-61
62 or Over
459 1734398071974252270
3.7% 7.4% 8.5%
17.4% 15.5% 21.1% 9.2%
11.3% 5.9% 0.0%
Race
African American or BlackNative American
Caucasian or WhiteMexican American, Mexican Origin
Asian American, Oriental, Pacific IslanderPuerto Rican, Cuban, Other Hispanic
OtherDid Not Respond
462 400
3217
19401223
8.7% 0.0%
69.5% 1.5% 4.1% 8.7% 2.6% 5.0%
Class Level
FreshmanSophomore
JuniorSenior
Graduate or ProfessionalOther/Unclassified
467 3239
117266121
6.9% 8.4%
25.1% 57.0% 2.6% 0.2%
Gender
MaleFemale
457 145312
31.7% 68.3%
Marital Status
UnmarriedMarried
SeparatedDid Not Respond
466 3808015
81.5% 17.2% 0.2% 1.1%
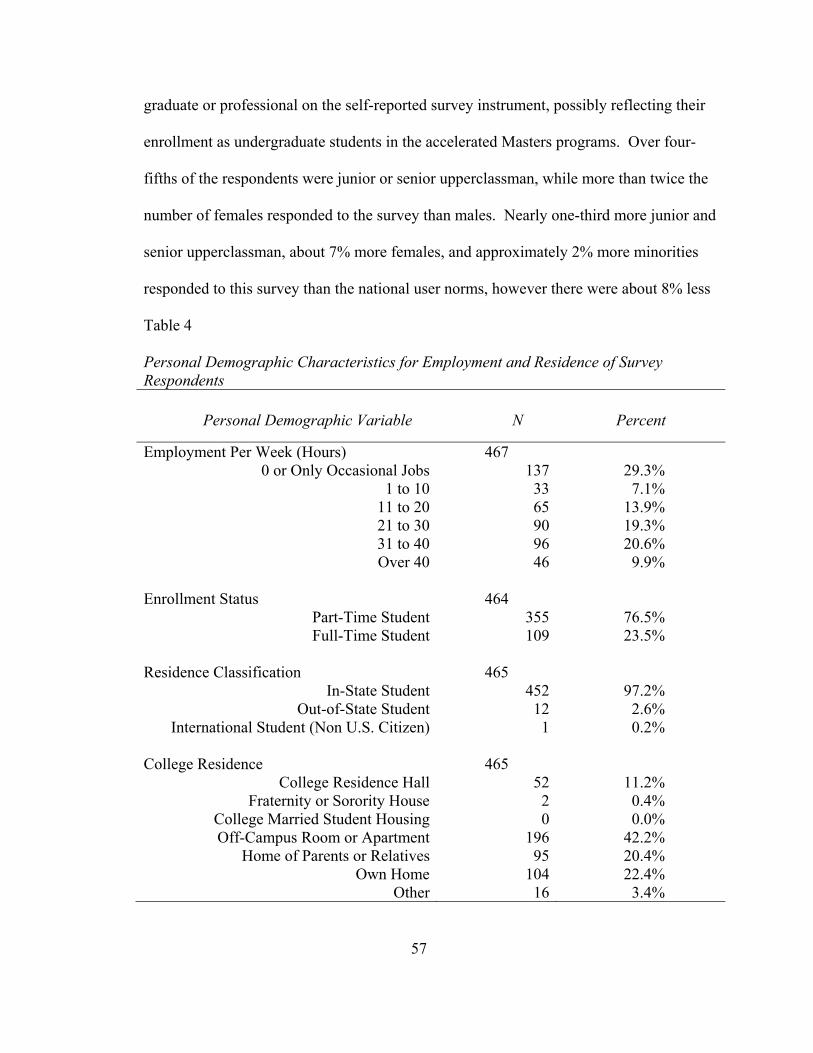
57
graduate or professional on the self-reported survey instrument, possibly reflecting their
enrollment as undergraduate students in the accelerated Masters programs. Over four-
fifths of the respondents were junior or senior upperclassman, while more than twice the
number of females responded to the survey than males. Nearly one-third more junior and
senior upperclassman, about 7% more females, and approximately 2% more minorities
responded to this survey than the national user norms, however there were about 8% less
Table 4 Personal Demographic Characteristics for Employment and Residence of Survey Respondents
Personal Demographic Variable N Percent
Employment Per Week (Hours) 0 or Only Occasional Jobs
1 to 1011 to 2021 to 3031 to 40Over 40
467 1373365909646
29.3% 7.1%
13.9% 19.3% 20.6% 9.9%
Enrollment Status
Part-Time StudentFull-Time Student
464 355109
76.5% 23.5%
Residence Classification
In-State StudentOut-of-State Student
International Student (Non U.S. Citizen)
465 452121
97.2% 2.6% 0.2%
College Residence
College Residence HallFraternity or Sorority House
College Married Student HousingOff-Campus Room or Apartment
Home of Parents or RelativesOwn Home
Other
465 5220
19695
10416
11.2% 0.4% 0.0%
42.2% 20.4% 22.4% 3.4%
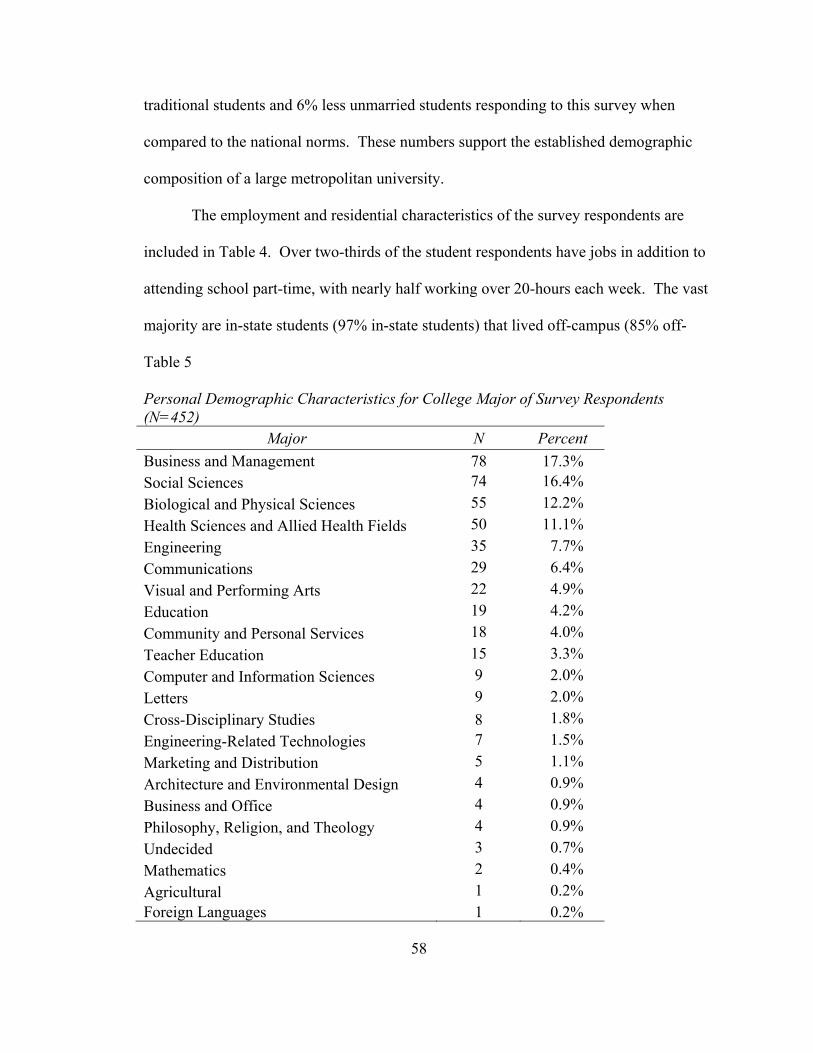
58
traditional students and 6% less unmarried students responding to this survey when
compared to the national norms. These numbers support the established demographic
composition of a large metropolitan university.
The employment and residential characteristics of the survey respondents are
included in Table 4. Over two-thirds of the student respondents have jobs in addition to
attending school part-time, with nearly half working over 20-hours each week. The vast
majority are in-state students (97% in-state students) that lived off-campus (85% off-
Table 5 Personal Demographic Characteristics for College Major of Survey Respondents (N=452)
Major N Percent Business and Management 78 17.3% Social Sciences 74 16.4% Biological and Physical Sciences 55 12.2% Health Sciences and Allied Health Fields 50 11.1% Engineering 35 7.7% Communications 29 6.4% Visual and Performing Arts 22 4.9% Education 19 4.2% Community and Personal Services 18 4.0% Teacher Education 15 3.3% Computer and Information Sciences 9 2.0% Letters 9 2.0% Cross-Disciplinary Studies 8 1.8% Engineering-Related Technologies 7 1.5% Marketing and Distribution 5 1.1% Architecture and Environmental Design 4 0.9% Business and Office 4 0.9% Philosophy, Religion, and Theology 4 0.9% Undecided 3 0.7% Mathematics 2 0.4% Agricultural 1 0.2% Foreign Languages 1 0.2%
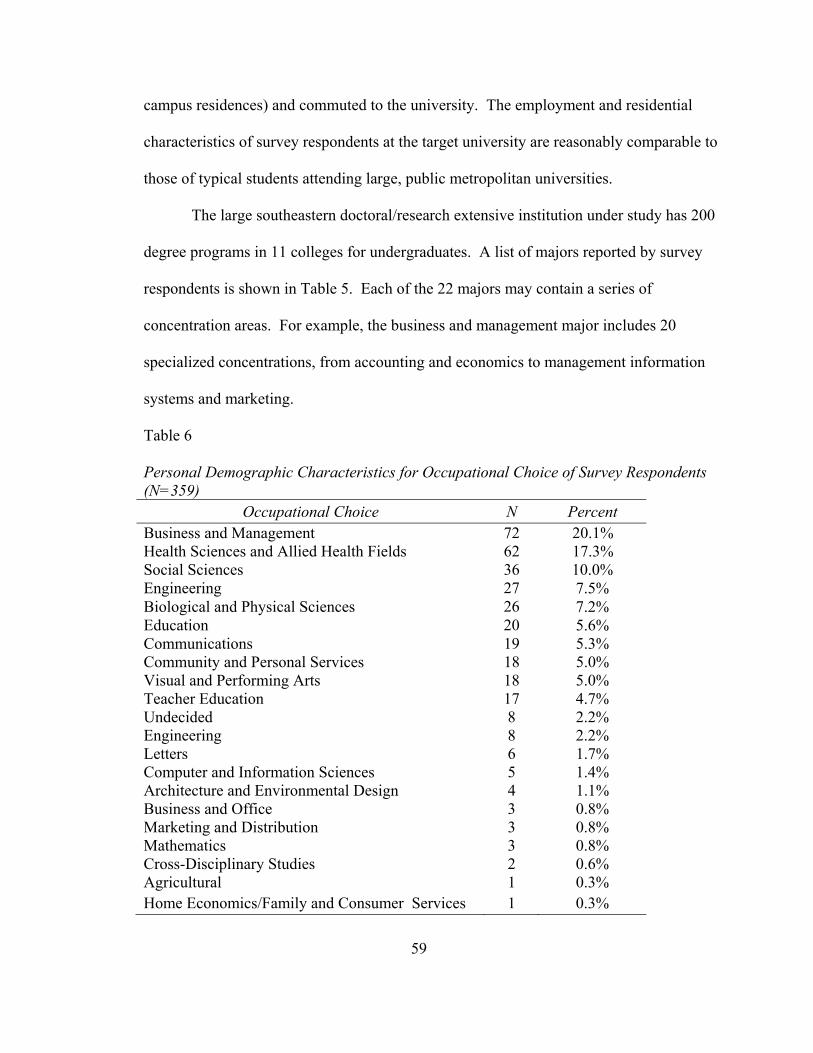
59
campus residences) and commuted to the university. The employment and residential
characteristics of survey respondents at the target university are reasonably comparable to
those of typical students attending large, public metropolitan universities.
The large southeastern doctoral/research extensive institution under study has 200
degree programs in 11 colleges for undergraduates. A list of majors reported by survey
respondents is shown in Table 5. Each of the 22 majors may contain a series of
concentration areas. For example, the business and management major includes 20
specialized concentrations, from accounting and economics to management information
systems and marketing.
Table 6 Personal Demographic Characteristics for Occupational Choice of Survey Respondents (N=359)
Occupational Choice N Percent Business and Management 72 20.1% Health Sciences and Allied Health Fields 62 17.3% Social Sciences 36 10.0% Engineering 27 7.5% Biological and Physical Sciences 26 7.2% Education 20 5.6% Communications 19 5.3% Community and Personal Services 18 5.0% Visual and Performing Arts 18 5.0% Teacher Education 17 4.7% Undecided 8 2.2% Engineering 8 2.2% Letters 6 1.7% Computer and Information Sciences 5 1.4% Architecture and Environmental Design 4 1.1% Business and Office 3 0.8% Marketing and Distribution 3 0.8% Mathematics 3 0.8% Cross-Disciplinary Studies 2 0.6% Agricultural 1 0.3% Home Economics/Family and Consumer Services 1 0.3%
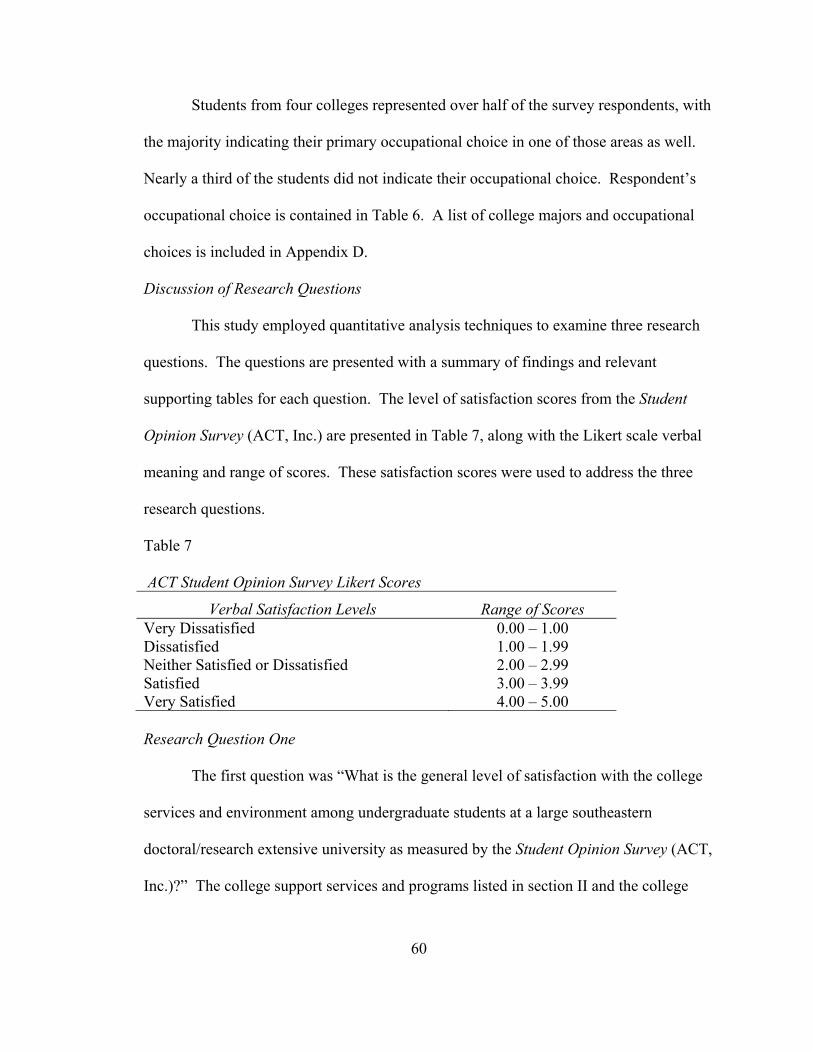
60
Students from four colleges represented over half of the survey respondents, with
the majority indicating their primary occupational choice in one of those areas as well.
Nearly a third of the students did not indicate their occupational choice. Respondent’s
occupational choice is contained in Table 6. A list of college majors and occupational
choices is included in Appendix D.
Discussion of Research Questions
This study employed quantitative analysis techniques to examine three research
questions. The questions are presented with a summary of findings and relevant
supporting tables for each question. The level of satisfaction scores from the Student
Opinion Survey (ACT, Inc.) are presented in Table 7, along with the Likert scale verbal
meaning and range of scores. These satisfaction scores were used to address the three
research questions.
Table 7 ACT Student Opinion Survey Likert Scores
Verbal Satisfaction Levels Range of Scores Very Dissatisfied Dissatisfied Neither Satisfied or Dissatisfied Satisfied Very Satisfied
0.00 – 1.00 1.00 – 1.99 2.00 – 2.99 3.00 – 3.99 4.00 – 5.00
Research Question One
The first question was “What is the general level of satisfaction with the college
services and environment among undergraduate students at a large southeastern
doctoral/research extensive university as measured by the Student Opinion Survey (ACT,
Inc.)?” The college support services and programs listed in section II and the college
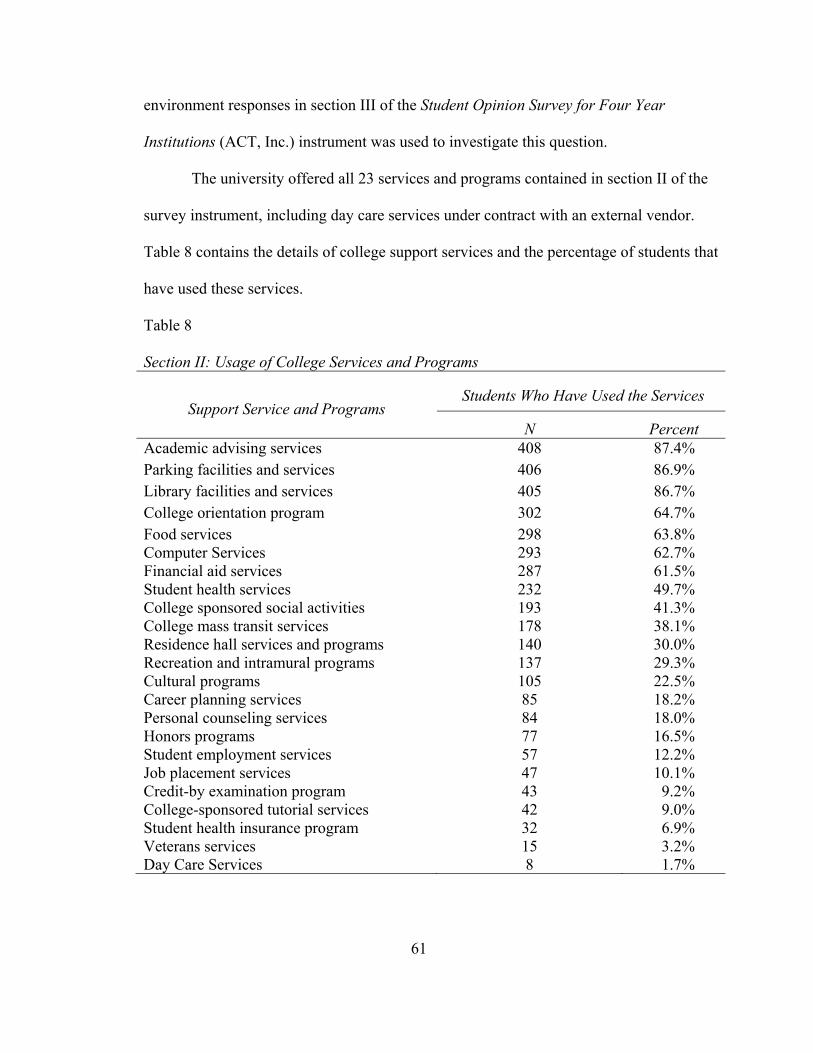
61
environment responses in section III of the Student Opinion Survey for Four Year
Institutions (ACT, Inc.) instrument was used to investigate this question.
The university offered all 23 services and programs contained in section II of the
survey instrument, including day care services under contract with an external vendor.
Table 8 contains the details of college support services and the percentage of students that
have used these services.
Table 8 Section II: Usage of College Services and Programs
Support Service and Programs Students Who Have Used the Services
N Percent Academic advising services 408 87.4% Parking facilities and services 406 86.9% Library facilities and services 405 86.7% College orientation program 302 64.7% Food services 298 63.8% Computer Services 293 62.7% Financial aid services 287 61.5% Student health services 232 49.7% College sponsored social activities 193 41.3% College mass transit services 178 38.1% Residence hall services and programs 140 30.0% Recreation and intramural programs 137 29.3% Cultural programs 105 22.5% Career planning services 85 18.2% Personal counseling services 84 18.0% Honors programs 77 16.5% Student employment services 57 12.2% Job placement services 47 10.1% Credit-by examination program 43 9.2% College-sponsored tutorial services 42 9.0% Student health insurance program 32 6.9% Veterans services 15 3.2% Day Care Services 8 1.7%
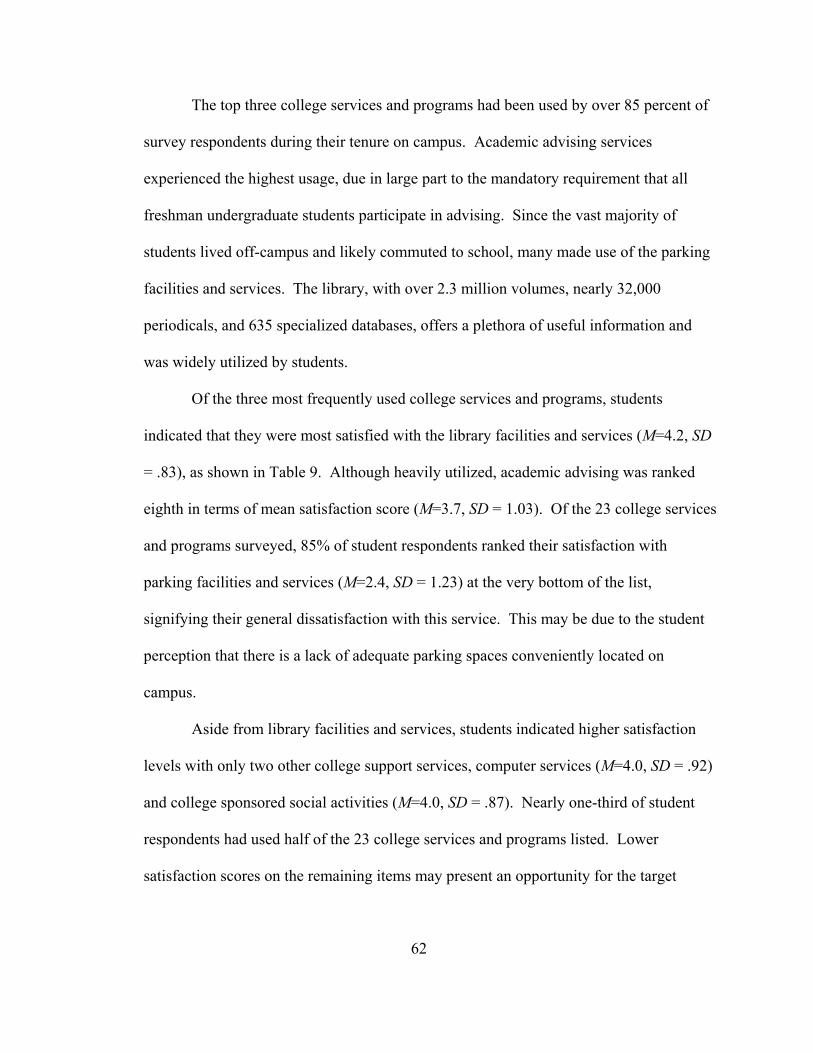
62
The top three college services and programs had been used by over 85 percent of
survey respondents during their tenure on campus. Academic advising services
experienced the highest usage, due in large part to the mandatory requirement that all
freshman undergraduate students participate in advising. Since the vast majority of
students lived off-campus and likely commuted to school, many made use of the parking
facilities and services. The library, with over 2.3 million volumes, nearly 32,000
periodicals, and 635 specialized databases, offers a plethora of useful information and
was widely utilized by students.
Of the three most frequently used college services and programs, students
indicated that they were most satisfied with the library facilities and services (M=4.2, SD
= .83), as shown in Table 9. Although heavily utilized, academic advising was ranked
eighth in terms of mean satisfaction score (M=3.7, SD = 1.03). Of the 23 college services
and programs surveyed, 85% of student respondents ranked their satisfaction with
parking facilities and services (M=2.4, SD = 1.23) at the very bottom of the list,
signifying their general dissatisfaction with this service. This may be due to the student
perception that there is a lack of adequate parking spaces conveniently located on
campus.
Aside from library facilities and services, students indicated higher satisfaction
levels with only two other college support services, computer services (M=4.0, SD = .92)
and college sponsored social activities (M=4.0, SD = .87). Nearly one-third of student
respondents had used half of the 23 college services and programs listed. Lower
satisfaction scores on the remaining items may present an opportunity for the target
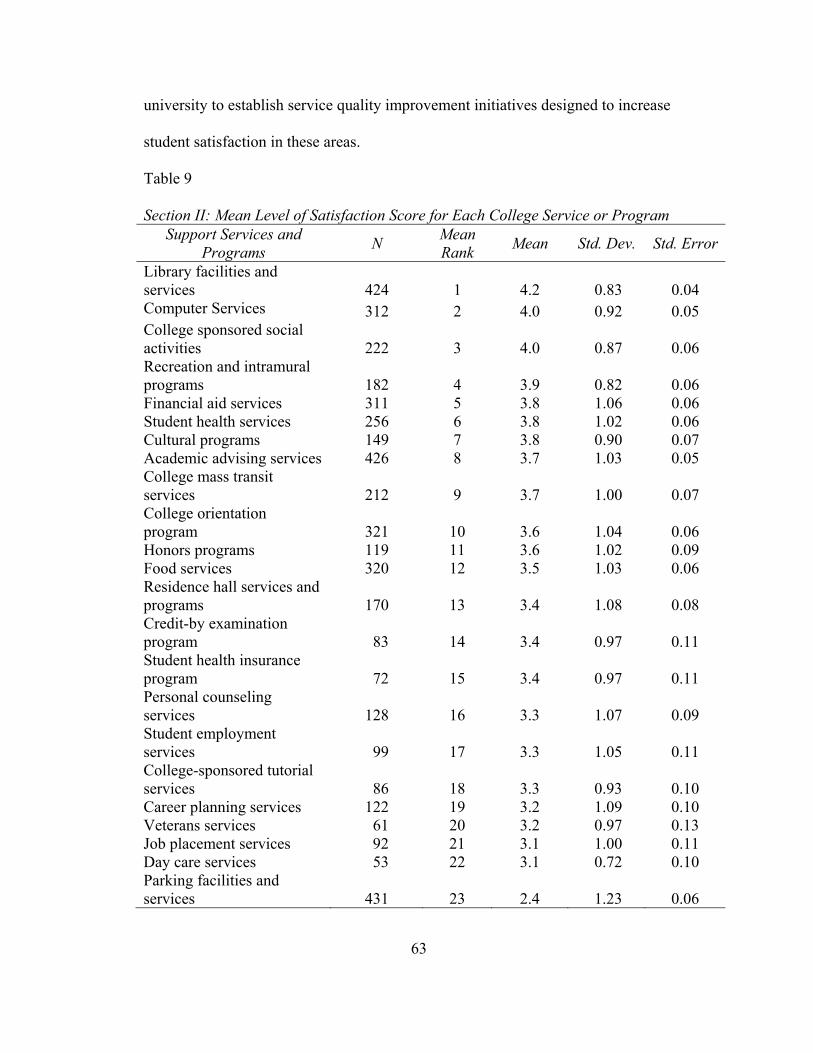
63
university to establish service quality improvement initiatives designed to increase
student satisfaction in these areas.
Table 9 Section II: Mean Level of Satisfaction Score for Each College Service or Program
Support Services and Programs N Mean
Rank Mean Std. Dev. Std. Error
Library facilities and services 424 1 4.2 0.83 0.04 Computer Services 312 2 4.0 0.92 0.05 College sponsored social activities 222 3 4.0 0.87 0.06 Recreation and intramural programs 182 4 3.9 0.82 0.06 Financial aid services 311 5 3.8 1.06 0.06 Student health services 256 6 3.8 1.02 0.06 Cultural programs 149 7 3.8 0.90 0.07 Academic advising services 426 8 3.7 1.03 0.05 College mass transit services 212 9 3.7 1.00 0.07 College orientation program 321 10 3.6 1.04 0.06 Honors programs 119 11 3.6 1.02 0.09 Food services 320 12 3.5 1.03 0.06 Residence hall services and programs 170 13 3.4 1.08 0.08 Credit-by examination program 83 14 3.4 0.97 0.11 Student health insurance program 72 15 3.4 0.97 0.11 Personal counseling services 128 16 3.3 1.07 0.09 Student employment services 99 17 3.3 1.05 0.11 College-sponsored tutorial services 86 18 3.3 0.93 0.10 Career planning services 122 19 3.2 1.09 0.10 Veterans services 61 20 3.2 0.97 0.13 Job placement services 92 21 3.1 1.00 0.11 Day care services 53 22 3.1 0.72 0.10 Parking facilities and services 431 23 2.4 1.23 0.06
64
The first research question also explored survey respondents’ general level of
satisfaction with the college environment. Section III of the survey instrument is
composed of 42 aspects of the college environment. These aspects of the college
environment were grouped by ACT, Inc. into six categories, and descriptive statistics
were computed for each variable as shown in Table 10.
Students responded favorably to the campus bookstore (M=3.9, SD = .92),
campus media such as the student newspaper and campus radio (M=3.9, SD = .79), and
the attitude of faculty towards students (M=3.9, SD = .90). In addition, the instruction
(M=3.9, SD = .90) and course content in the student’s major field (M=3.9, SD = .90),
along with the out-of-class availability of instructors (M=3.9, SD = .90) all were rated
satisfied with student respondents.
Student respondents were dissatisfied with only one environmental variable—the
availability of the courses students want at the times they can take them (M=2.8, SD =
1.27). An unremitting challenge for many universities is balancing the proper mix of
course offerings, departmental scheduling, and suitable facilities so that students are able
to complete required courses and electives in their degree programs in a timely manner,
however the level of satisfaction for this variable at the target university was below the
national norm for other public universities (M=3.1, SD = 1.16).
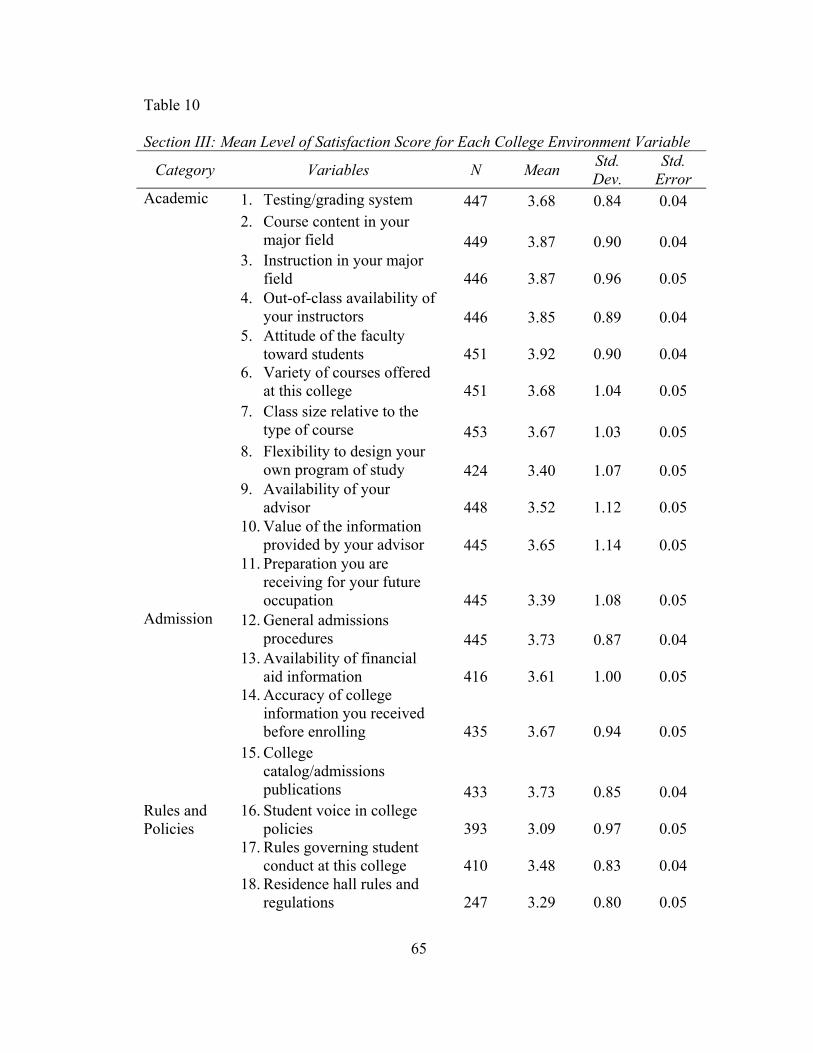
65
Table 10 Section III: Mean Level of Satisfaction Score for Each College Environment Variable
Category Variables N Mean Std. Dev.
Std. Error
Academic 1. Testing/grading system 447 3.68 0.84 0.04 2. Course content in your
major field 449 3.87 0.90 0.04 3. Instruction in your major
field 446 3.87 0.96 0.05 4. Out-of-class availability of
your instructors 446 3.85 0.89 0.04 5. Attitude of the faculty
toward students 451 3.92 0.90 0.04 6. Variety of courses offered
at this college 451 3.68 1.04 0.05 7. Class size relative to the
type of course 453 3.67 1.03 0.05 8. Flexibility to design your
own program of study 424 3.40 1.07 0.05 9. Availability of your
advisor 448 3.52 1.12 0.05 10. Value of the information
provided by your advisor 445 3.65 1.14 0.05 11. Preparation you are
receiving for your future occupation 445 3.39 1.08 0.05
Admission 12. General admissions procedures 445 3.73 0.87 0.04
13. Availability of financial aid information 416 3.61 1.00 0.05
14. Accuracy of college information you received before enrolling 435 3.67 0.94 0.05
15. College catalog/admissions publications 433 3.73 0.85 0.04
Rules and Policies
16. Student voice in college policies 393 3.09 0.97 0.05
17. Rules governing student conduct at this college 410 3.48 0.83 0.04
18. Residence hall rules and regulations 247 3.29 0.80 0.05
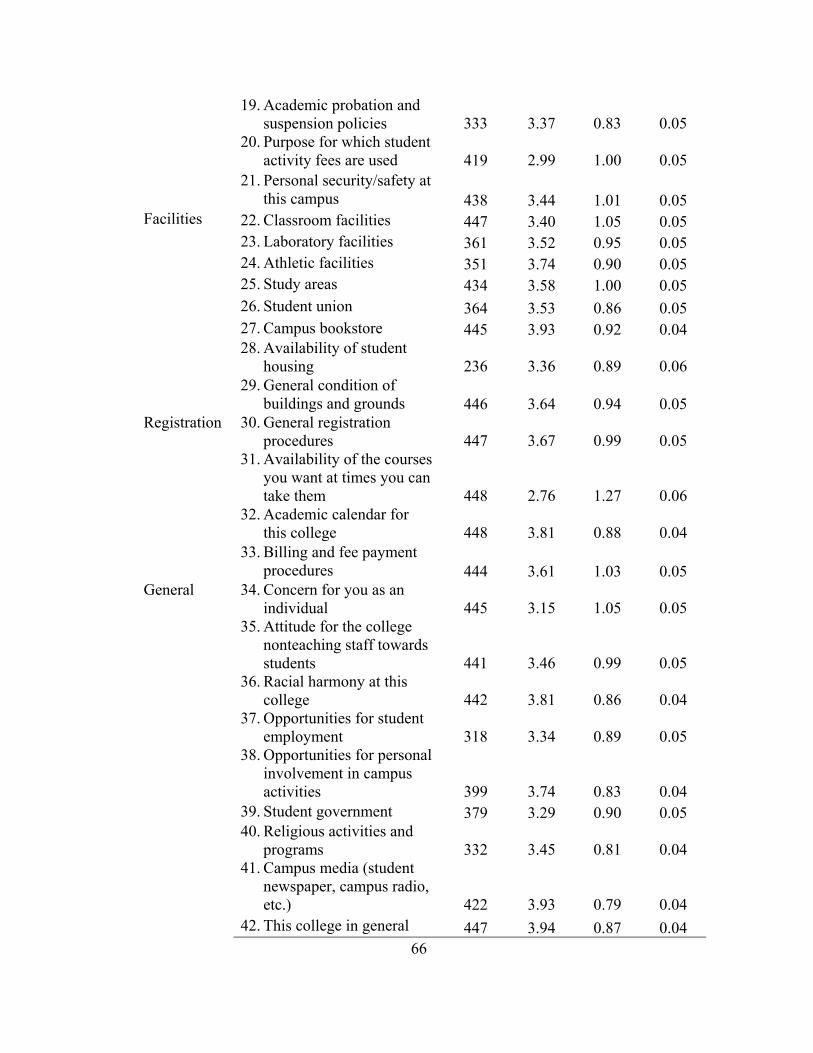
66
19. Academic probation and suspension policies 333 3.37 0.83 0.05
20. Purpose for which student activity fees are used 419 2.99 1.00 0.05
21. Personal security/safety at this campus 438 3.44 1.01 0.05
Facilities 22. Classroom facilities 447 3.40 1.05 0.05 23. Laboratory facilities 361 3.52 0.95 0.05 24. Athletic facilities 351 3.74 0.90 0.05 25. Study areas 434 3.58 1.00 0.05 26. Student union 364 3.53 0.86 0.05 27. Campus bookstore 445 3.93 0.92 0.04 28. Availability of student
housing 236 3.36 0.89 0.06 29. General condition of
buildings and grounds 446 3.64 0.94 0.05 Registration 30. General registration
procedures 447 3.67 0.99 0.05 31. Availability of the courses
you want at times you can take them 448 2.76 1.27 0.06
32. Academic calendar for this college 448 3.81 0.88 0.04
33. Billing and fee payment procedures 444 3.61 1.03 0.05
General 34. Concern for you as an individual 445 3.15 1.05 0.05
35. Attitude for the college nonteaching staff towards students 441 3.46 0.99 0.05
36. Racial harmony at this college 442 3.81 0.86 0.04
37. Opportunities for student employment 318 3.34 0.89 0.05
38. Opportunities for personal involvement in campus activities 399 3.74 0.83 0.04
39. Student government 379 3.29 0.90 0.05 40. Religious activities and
programs 332 3.45 0.81 0.04 41. Campus media (student
newspaper, campus radio, etc.) 422 3.93 0.79 0.04
42. This college in general 447 3.94 0.87 0.04
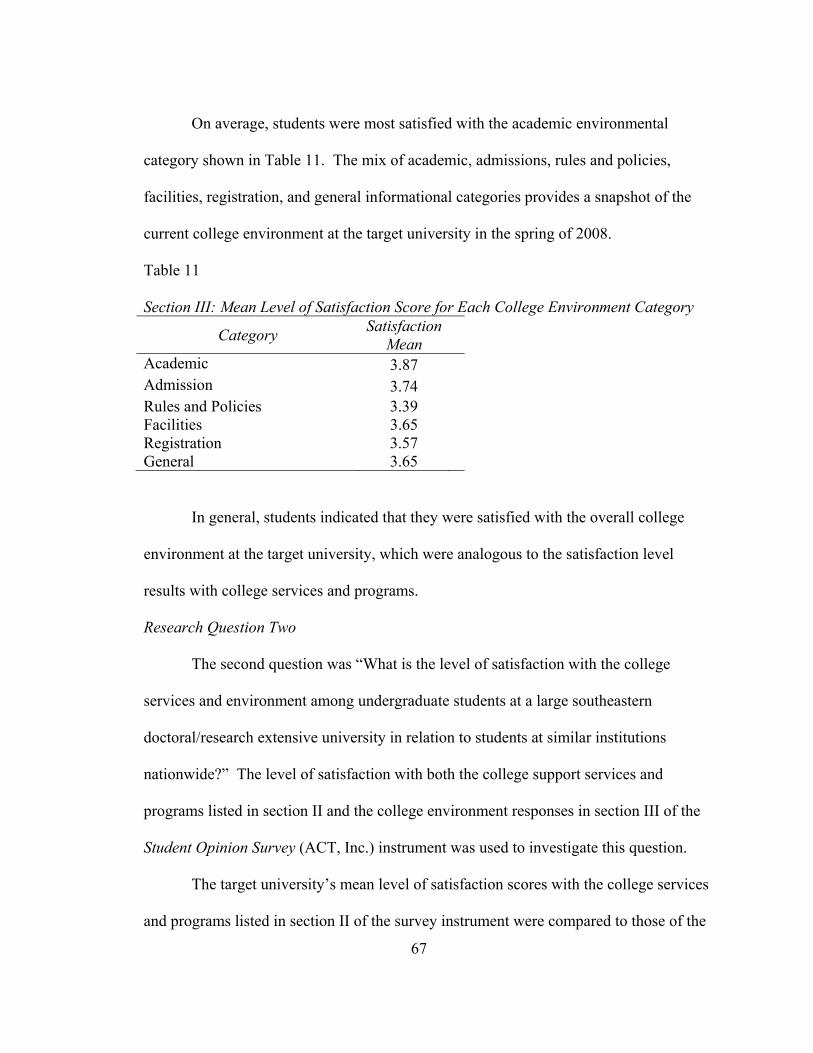
67
On average, students were most satisfied with the academic environmental
category shown in Table 11. The mix of academic, admissions, rules and policies,
facilities, registration, and general informational categories provides a snapshot of the
current college environment at the target university in the spring of 2008.
Table 11 Section III: Mean Level of Satisfaction Score for Each College Environment Category
Category Satisfaction Mean
Academic 3.87 Admission 3.74 Rules and Policies 3.39 Facilities 3.65 Registration 3.57 General 3.65
In general, students indicated that they were satisfied with the overall college
environment at the target university, which were analogous to the satisfaction level
results with college services and programs.
Research Question Two
The second question was “What is the level of satisfaction with the college
services and environment among undergraduate students at a large southeastern
doctoral/research extensive university in relation to students at similar institutions
nationwide?” The level of satisfaction with both the college support services and
programs listed in section II and the college environment responses in section III of the
Student Opinion Survey (ACT, Inc.) instrument was used to investigate this question.
The target university’s mean level of satisfaction scores with the college services
and programs listed in section II of the survey instrument were compared to those of the
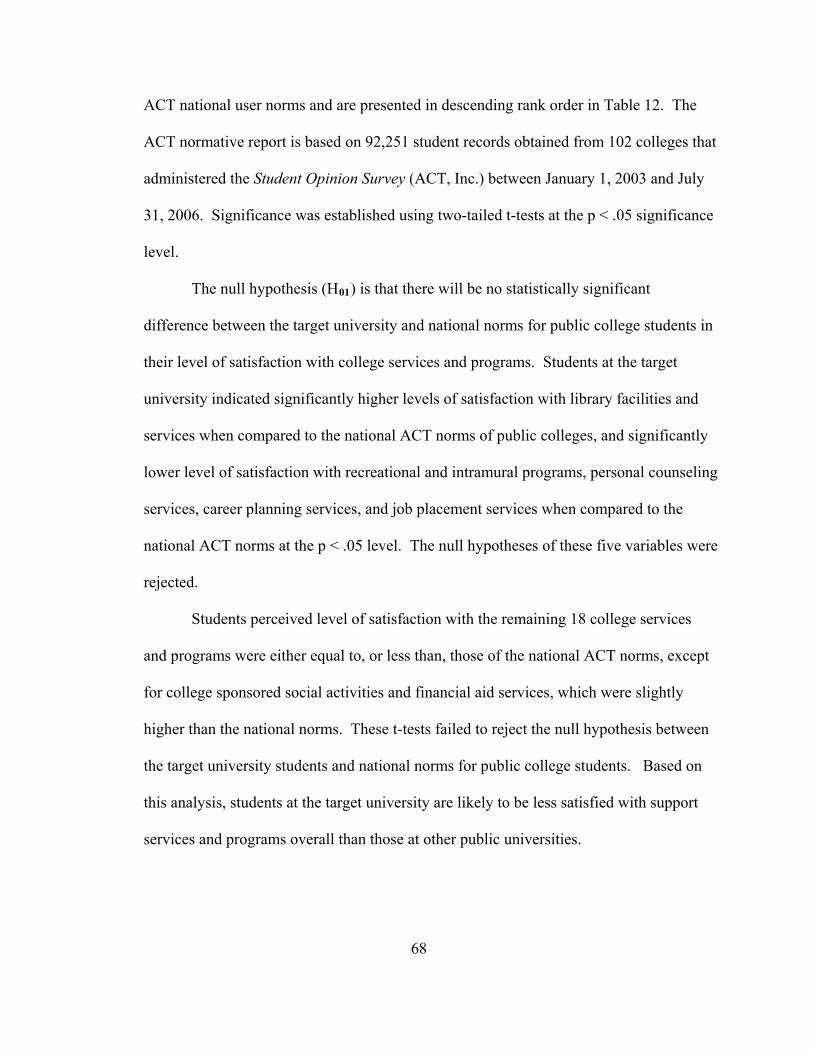
68
y
eling
ACT national user norms and are presented in descending rank order in Table 12. The
ACT normative report is based on 92,251 student records obtained from 102 colleges that
administered the Student Opinion Survey (ACT, Inc.) between January 1, 2003 and July
31, 2006. Significance was established using two-tailed t-tests at the p < .05 significance
level.
The null hypothesis (H01) is that there will be no statistically significant
difference between the target university and national norms for public college students in
their level of satisfaction with college services and programs. Students at the target
university indicated significantly higher levels of satisfaction with library facilities and
services when compared to the national ACT norms of public colleges, and significantl
lower level of satisfaction with recreational and intramural programs, personal couns
services, career planning services, and job placement services when compared to the
national ACT norms at the p < .05 level. The null hypotheses of these five variables were
rejected.
Students perceived level of satisfaction with the remaining 18 college services
and programs were either equal to, or less than, those of the national ACT norms, except
for college sponsored social activities and financial aid services, which were slightly
higher than the national norms. These t-tests failed to reject the null hypothesis between
the target university students and national norms for public college students. Based on
this analysis, students at the target university are likely to be less satisfied with support
services and programs overall than those at other public universities.
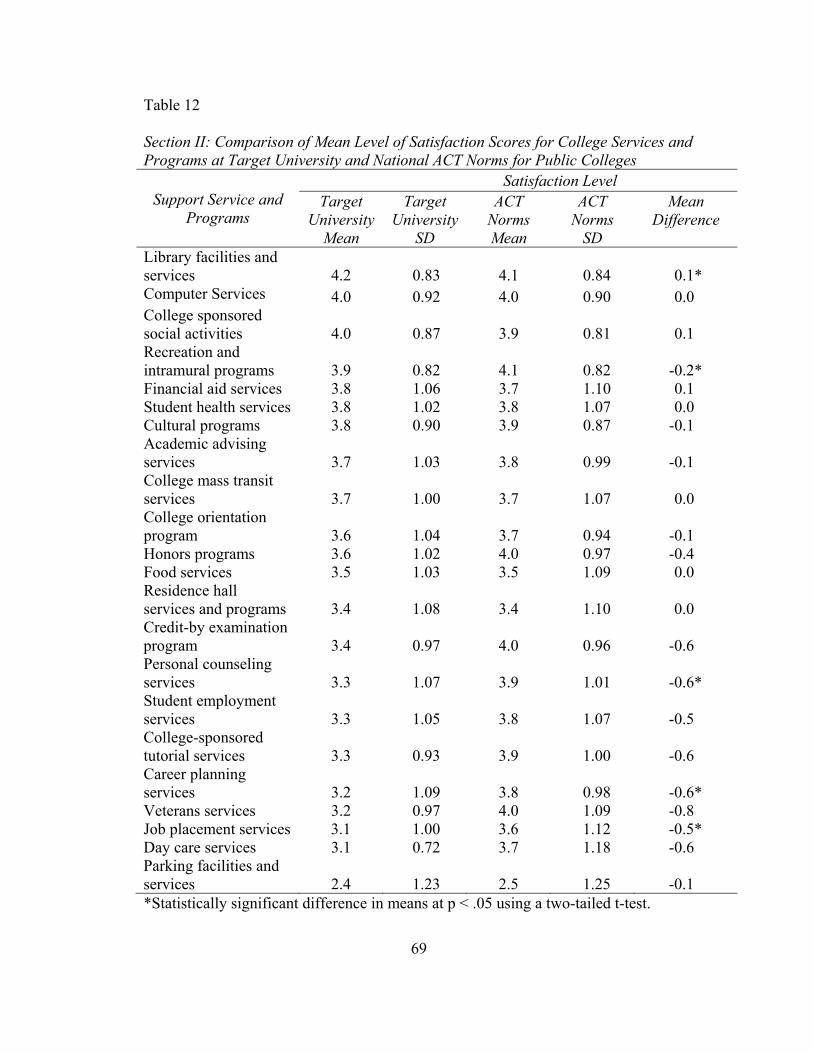
69
Table 12 Section II: Comparison of Mean Level of Satisfaction Scores for College Services and Programs at Target University and National ACT Norms for Public Colleges
Support Service and Programs
Satisfaction Level Target
University Mean
Target University
SD
ACT Norms Mean
ACT Norms
SD
Mean Difference
Library facilities and services 4.2 0.83 4.1 0.84 0.1* Computer Services 4.0 0.92 4.0 0.90 0.0 College sponsored social activities 4.0 0.87 3.9 0.81 0.1 Recreation and intramural programs 3.9 0.82 4.1 0.82 -0.2* Financial aid services 3.8 1.06 3.7 1.10 0.1 Student health services 3.8 1.02 3.8 1.07 0.0 Cultural programs 3.8 0.90 3.9 0.87 -0.1 Academic advising services 3.7 1.03 3.8 0.99 -0.1 College mass transit services 3.7 1.00 3.7 1.07 0.0 College orientation program 3.6 1.04 3.7 0.94 -0.1 Honors programs 3.6 1.02 4.0 0.97 -0.4 Food services 3.5 1.03 3.5 1.09 0.0 Residence hall services and programs 3.4 1.08 3.4 1.10 0.0 Credit-by examination program 3.4 0.97 4.0 0.96 -0.6 Personal counseling services 3.3 1.07 3.9 1.01 -0.6* Student employment services 3.3 1.05 3.8 1.07 -0.5 College-sponsored tutorial services 3.3 0.93 3.9 1.00 -0.6 Career planning services 3.2 1.09 3.8 0.98 -0.6* Veterans services 3.2 0.97 4.0 1.09 -0.8 Job placement services 3.1 1.00 3.6 1.12 -0.5* Day care services 3.1 0.72 3.7 1.18 -0.6 Parking facilities and services 2.4 1.23 2.5 1.25 -0.1 *Statistically significant difference in means at p < .05 using a two-tailed t-test.
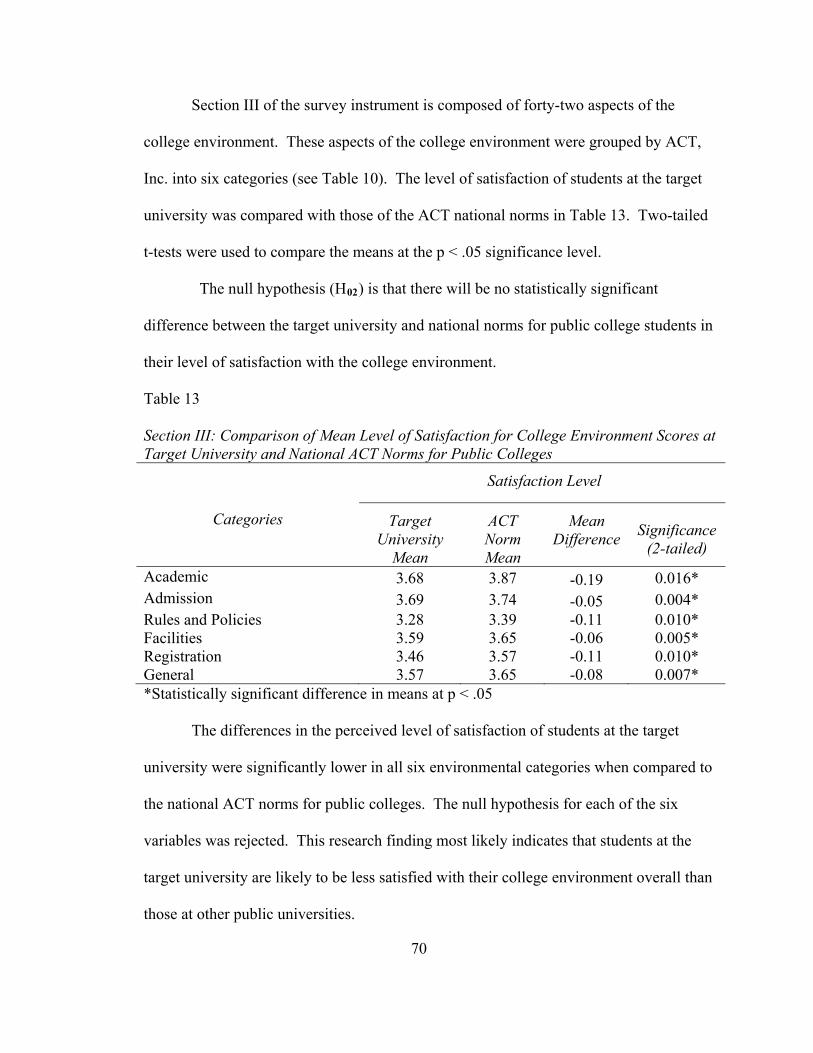
70
Section III of the survey instrument is composed of forty-two aspects of the
college environment. These aspects of the college environment were grouped by ACT,
Inc. into six categories (see Table 10). The level of satisfaction of students at the target
university was compared with those of the ACT national norms in Table 13. Two-tailed
t-tests were used to compare the means at the p < .05 significance level.
The null hypothesis (H02) is that there will be no statistically significant
difference between the target university and national norms for public college students in
their level of satisfaction with the college environment.
Table 13 Section III: Comparison of Mean Level of Satisfaction for College Environment Scores at Target University and National ACT Norms for Public Colleges
Categories
Satisfaction Level
Target University
Mean
ACT Norm Mean
Mean Difference Significance
(2-tailed)
Academic 3.68 3.87 -0.19 0.016* Admission 3.69 3.74 -0.05 0.004* Rules and Policies 3.28 3.39 -0.11 0.010* Facilities 3.59 3.65 -0.06 0.005* Registration 3.46 3.57 -0.11 0.010* General 3.57 3.65 -0.08 0.007* *Statistically significant difference in means at p < .05
The differences in the perceived level of satisfaction of students at the target
university were significantly lower in all six environmental categories when compared to
the national ACT norms for public colleges. The null hypothesis for each of the six
variables was rejected. This research finding most likely indicates that students at the
target university are likely to be less satisfied with their college environment overall than
those at other public universities.
71
ir
e
is.
Research Question Three
The third question was “What is the relationship between the personal
characteristics of undergraduate students and student satisfaction with the college
services and environment derived from comparisons among subgroups?” The student
age, ethnicity, and gender subgroups were explored. The student demographics listed in
section I, the level of satisfaction with college support services and programs listed in
section II, and the college environment responses in section III of the Student Opinion
Survey (ACT, Inc.) instrument were used to investigate this question.
Section II of the Student Opinion Survey (ACT, Inc.) is composed of twenty-three
college services or programs. Students indicated if they have used the services or
programs (see Table 8), and if so, ranked their level of satisfaction with those services
and programs on a five point Likert scale from “Very satisfied” with 5 points, to “Very
dissatisfied” with 1 point (see Table 12). If a service is not available or if the student had
not used the service, they did not mark their level of satisfaction. Students indicated that
they had used all 23 support services and programs in section II of the instrument.
The null hypothesis (H03) is that there will be no statistically significant
difference between traditional and non-traditional aged undergraduate students in the
level of satisfaction with college services and programs. The satisfaction levels of the
college services and programs were treated as the dependent variables, whereas the ag
(i.e. traditional and non-traditional aged students) was treated as an independent variable
for purposes of testing the null hypothes
In an effort to accurately characterize traditional and non-traditional students, a
traditional student was defined as less than 26 years old, whereas a non-traditional
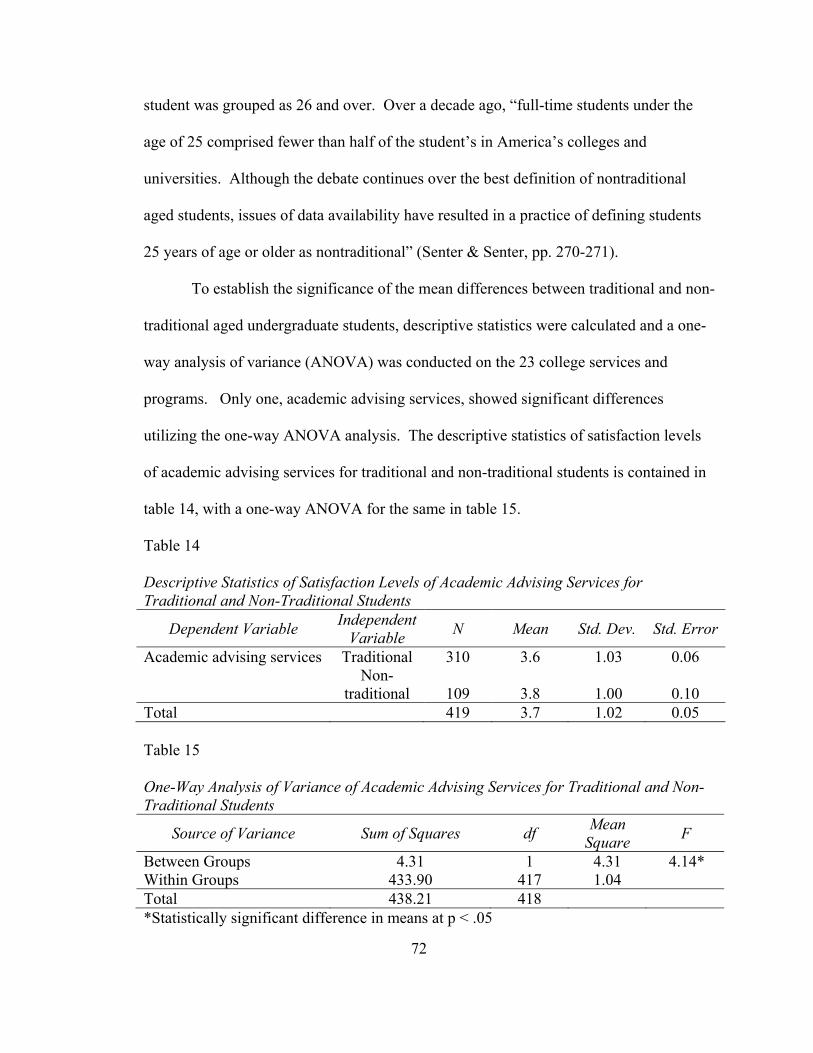
72
student was grouped as 26 and over. Over a decade ago, “full-time students under the
age of 25 comprised fewer than half of the student’s in America’s colleges and
universities. Although the debate continues over the best definition of nontraditional
aged students, issues of data availability have resulted in a practice of defining students
25 years of age or older as nontraditional” (Senter & Senter, pp. 270-271).
To establish the significance of the mean differences between traditional and non-
traditional aged undergraduate students, descriptive statistics were calculated and a one-
way analysis of variance (ANOVA) was conducted on the 23 college services and
programs. Only one, academic advising services, showed significant differences
utilizing the one-way ANOVA analysis. The descriptive statistics of satisfaction levels
of academic advising services for traditional and non-traditional students is contained in
table 14, with a one-way ANOVA for the same in table 15.
Table 14
Descriptive Statistics of Satisfaction Levels of Academic Advising Services for Traditional and Non-Traditional Students
Dependent Variable Independent Variable N Mean Std. Dev. Std. Error
Academic advising services Traditional 310 3.6 1.03 0.06 Non-
traditional 109 3.8 1.00 0.10 Total 419 3.7 1.02 0.05 Table 15 One-Way Analysis of Variance of Academic Advising Services for Traditional and Non-Traditional Students
Source of Variance Sum of Squares df Mean Square F
Between Groups 4.31 1 4.31 4.14* Within Groups 433.90 417 1.04 Total 438.21 418 *Statistically significant difference in means at p < .05
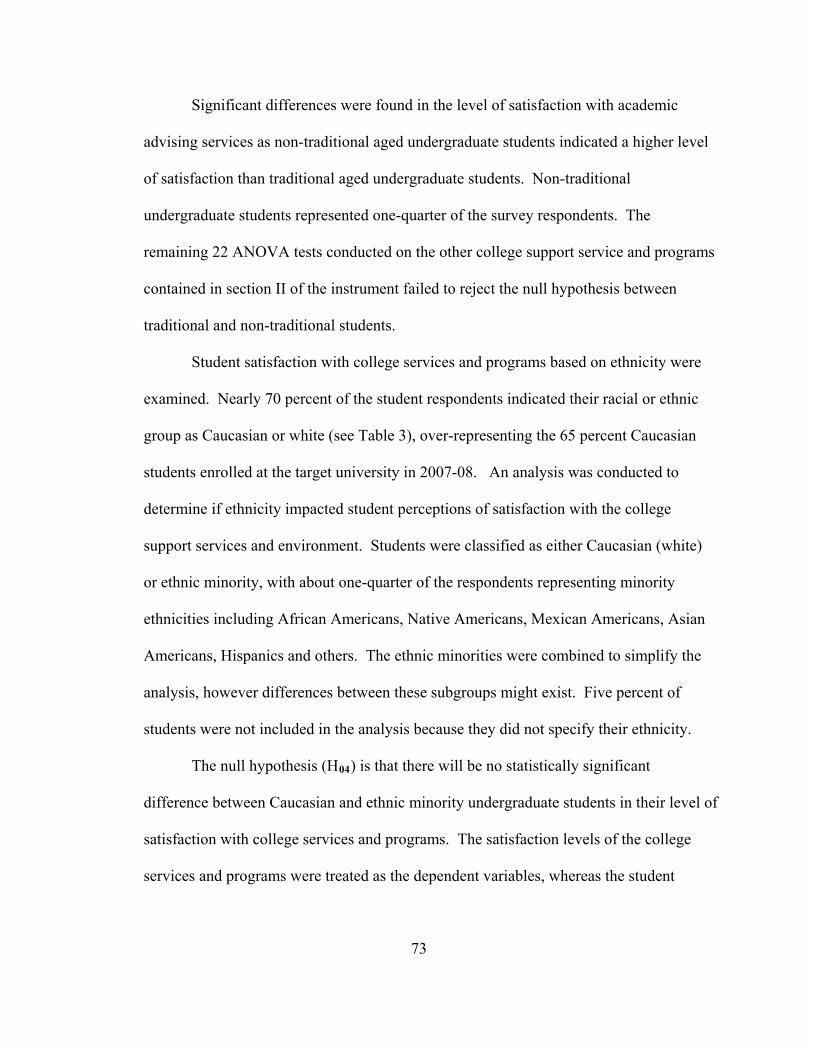
73
ir level of
Significant differences were found in the level of satisfaction with academic
advising services as non-traditional aged undergraduate students indicated a higher level
of satisfaction than traditional aged undergraduate students. Non-traditional
undergraduate students represented one-quarter of the survey respondents. The
remaining 22 ANOVA tests conducted on the other college support service and programs
contained in section II of the instrument failed to reject the null hypothesis between
traditional and non-traditional students.
Student satisfaction with college services and programs based on ethnicity were
examined. Nearly 70 percent of the student respondents indicated their racial or ethnic
group as Caucasian or white (see Table 3), over-representing the 65 percent Caucasian
students enrolled at the target university in 2007-08. An analysis was conducted to
determine if ethnicity impacted student perceptions of satisfaction with the college
support services and environment. Students were classified as either Caucasian (white)
or ethnic minority, with about one-quarter of the respondents representing minority
ethnicities including African Americans, Native Americans, Mexican Americans, Asian
Americans, Hispanics and others. The ethnic minorities were combined to simplify the
analysis, however differences between these subgroups might exist. Five percent of
students were not included in the analysis because they did not specify their ethnicity.
The null hypothesis (H04) is that there will be no statistically significant
difference between Caucasian and ethnic minority undergraduate students in the
satisfaction with college services and programs. The satisfaction levels of the college
services and programs were treated as the dependent variables, whereas the student
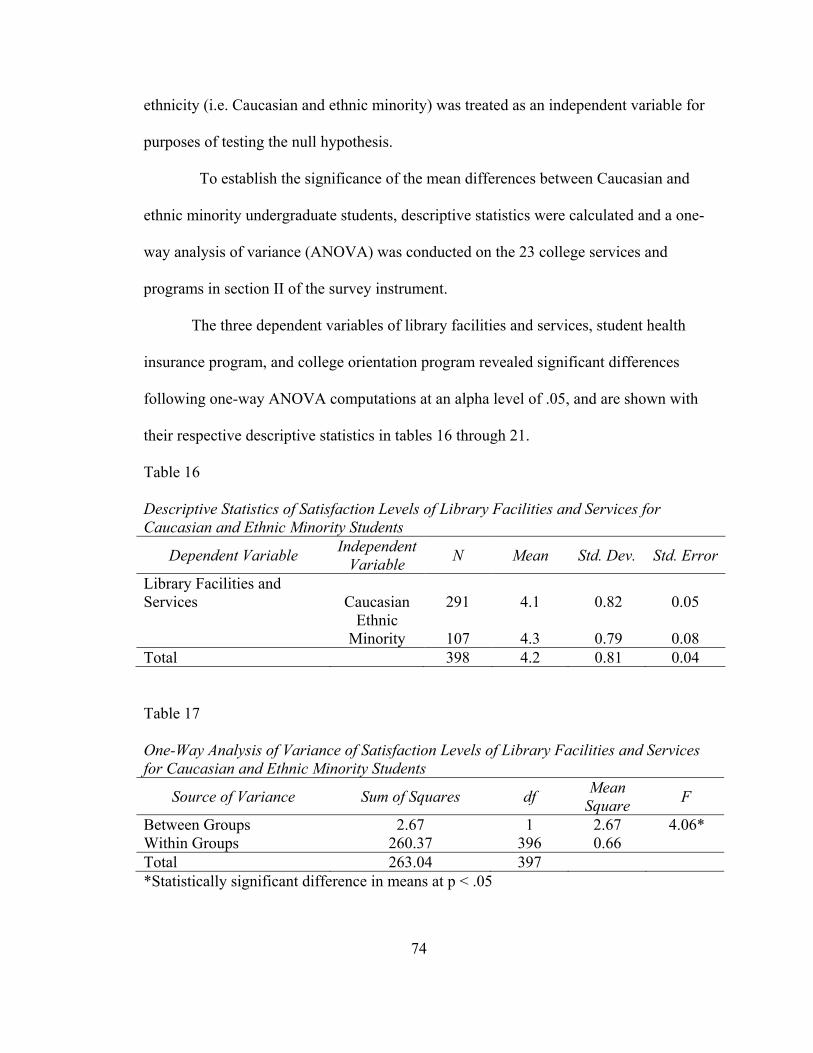
74
ethnicity (i.e. Caucasian and ethnic minority) was treated as an independent variable for
purposes of testing the null hypothesis.
To establish the significance of the mean differences between Caucasian and
ethnic minority undergraduate students, descriptive statistics were calculated and a one-
way analysis of variance (ANOVA) was conducted on the 23 college services and
programs in section II of the survey instrument.
The three dependent variables of library facilities and services, student health
insurance program, and college orientation program revealed significant differences
following one-way ANOVA computations at an alpha level of .05, and are shown with
their respective descriptive statistics in tables 16 through 21.
Table 16 Descriptive Statistics of Satisfaction Levels of Library Facilities and Services for Caucasian and Ethnic Minority Students
Dependent Variable Independent Variable N Mean Std. Dev. Std. Error
Library Facilities and Services Caucasian 291 4.1 0.82 0.05 Ethnic
Minority 107 4.3 0.79 0.08 Total 398 4.2 0.81 0.04
Table 17 One-Way Analysis of Variance of Satisfaction Levels of Library Facilities and Services for Caucasian and Ethnic Minority Students
Source of Variance Sum of Squares df Mean Square F
Between Groups 2.67 1 2.67 4.06* Within Groups 260.37 396 0.66 Total 263.04 397 *Statistically significant difference in means at p < .05
75
Table 18 Descriptive Statistics of Satisfaction Levels of Student Health Services for Caucasian and Ethnic Minority Students
Dependent Variable Independent Variable N Mean Std. Dev. Std. Error
Student Health Services Caucasian 169 3.7 1.06 0.82 Ethnic
Minority 70 4.0 0.88 0.11 Total 239 3.8 1.02 0.07 Table 19 One-Way Analysis of Variance of Satisfaction Levels of Student Health Services for Caucasian and Ethnic Minority Students
Source of Variance Sum of Squares df Mean Square F
Between Groups 4.36 1 4.36 4.25* Within Groups 243.04 237 1.03 Total 247.41 238 *Statistically significant difference in means at p < .05
Table 20 Descriptive Statistics of Satisfaction Levels of College Orientation Program for Caucasian and Ethnic Minority Students
Dependent Variable Independent Variable N Mean Std. Dev. Std. Error
College Orientation Program Caucasian 216 3.5 1.05 0.07 Ethnic
Minority 84 4.0 0.81 0.09 Total 300 3.6 1.01 0.06 Table 21 One-Way Analysis of Variance of Satisfaction Levels of College Orientation Program for Caucasian and Ethnic Minority Students
Source of Variance Sum of Squares df Mean Square F
Between Groups 4.36 1 4.36 4.25* Within Groups 243.04 237 1.03 Total 247.41 238 *Statistically significant difference in means at p < .05

76
tion
and
Significant differences were found in the level of satisfaction with library
facilities and services, student health services, and college orientation program as ethnic
minority undergraduate students indicated a higher level of satisfaction than Caucasian
undergraduate students on all three of these college services and programs. The null
hypotheses for these three variables were rejected. The remaining 20 ANOVA tests
conducted on the other college support service and programs contained in section II of
the instrument failed to reject the null hypothesis between Caucasian and ethnic minority
undergraduate students.
Gender was explored to determine if significant differences existed between male
and female perceptions of satisfaction with college services and programs. Nearly 70
percent of the student respondents were females (see Table 3), over-representing the 58%
female undergraduate students at the target university in the 2007-08 year.
The null hypothesis (H05) is that there will be no statistically significant
difference between male and female undergraduate students in their level of satisfac
with college services and programs. The satisfaction levels of the college services
programs were treated as the dependent variables, whereas the student gender was treated
as an independent variable for purposes of testing the null hypothesis.
To establish the significance of the mean differences between male and female
undergraduate students, descriptive statistics were calculated and a one-way analysis of
variance (ANOVA) was conducted on the 23 college services and programs in section II
of the survey instrument. Two dependent variables, student health services and food
services, showed significant differences upon analysis with a one-way ANOVA at the p <
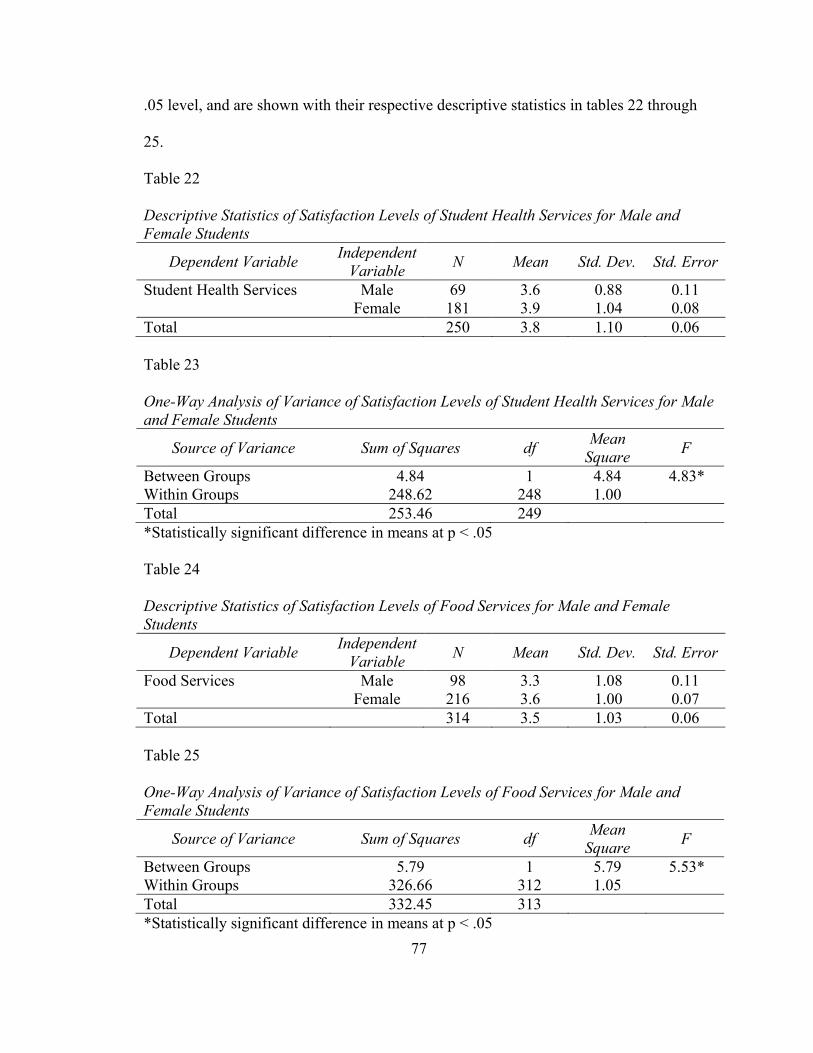
77
.05 level, and are shown with their respective descriptive statistics in tables 22 through
25.
Table 22 Descriptive Statistics of Satisfaction Levels of Student Health Services for Male and Female Students
Dependent Variable Independent Variable N Mean Std. Dev. Std. Error
Student Health Services Male 69 3.6 0.88 0.11 Female 181 3.9 1.04 0.08 Total 250 3.8 1.10 0.06 Table 23 One-Way Analysis of Variance of Satisfaction Levels of Student Health Services for Male and Female Students
Source of Variance Sum of Squares df Mean Square F
Between Groups 4.84 1 4.84 4.83* Within Groups 248.62 248 1.00 Total 253.46 249 *Statistically significant difference in means at p < .05
Table 24 Descriptive Statistics of Satisfaction Levels of Food Services for Male and Female Students
Dependent Variable Independent Variable N Mean Std. Dev. Std. Error
Food Services Male 98 3.3 1.08 0.11 Female 216 3.6 1.00 0.07 Total 314 3.5 1.03 0.06 Table 25 One-Way Analysis of Variance of Satisfaction Levels of Food Services for Male and Female Students
Source of Variance Sum of Squares df Mean Square F
Between Groups 5.79 1 5.79 5.53* Within Groups 326.66 312 1.05 Total 332.45 313 *Statistically significant difference in means at p < .05
78
ir
A
lue
The
Significant differences were found in the level of satisfaction with student health
services and food services as female undergraduate students indicated a higher level of
satisfaction than their male counterparts on both of these college services and programs.
The null hypotheses for these two variables were rejected. The remaining 21 ANOVA
tests conducted on the other college support service and programs contained in section II
of the instrument failed to reject the null hypothesis between male and female
undergraduate students.
One-way ANOVAs were carried out on the forty-two aspects of the college
environment in section III of the Student Opinion Survey (see Table 10). The individual
aspects of student satisfaction scores in the academic, admissions, rules and policies,
facilities, registration, and general categories were tested among the age, ethnicity, and
gender subgroups to determine if a significant difference existed in their level of
satisfaction with the college environment.
The null hypothesis (H06) is that there will be no statistically significant
difference between traditional and non-traditional aged undergraduate students in the
level of satisfaction with the college environment. Of the forty-two possible ANOV
test combinations, significant differences at the p < .05 level of satisfaction were
manifested between traditional and non-traditional students in the college environment
aspects of out-of-class availability of your instructors, availability of your advisor, va
of the information provided by your advisor, and availability of student housing.
descriptive statistics and the ANOVA analysis for these aspects of college environment
are presented in tables 26 through 33.
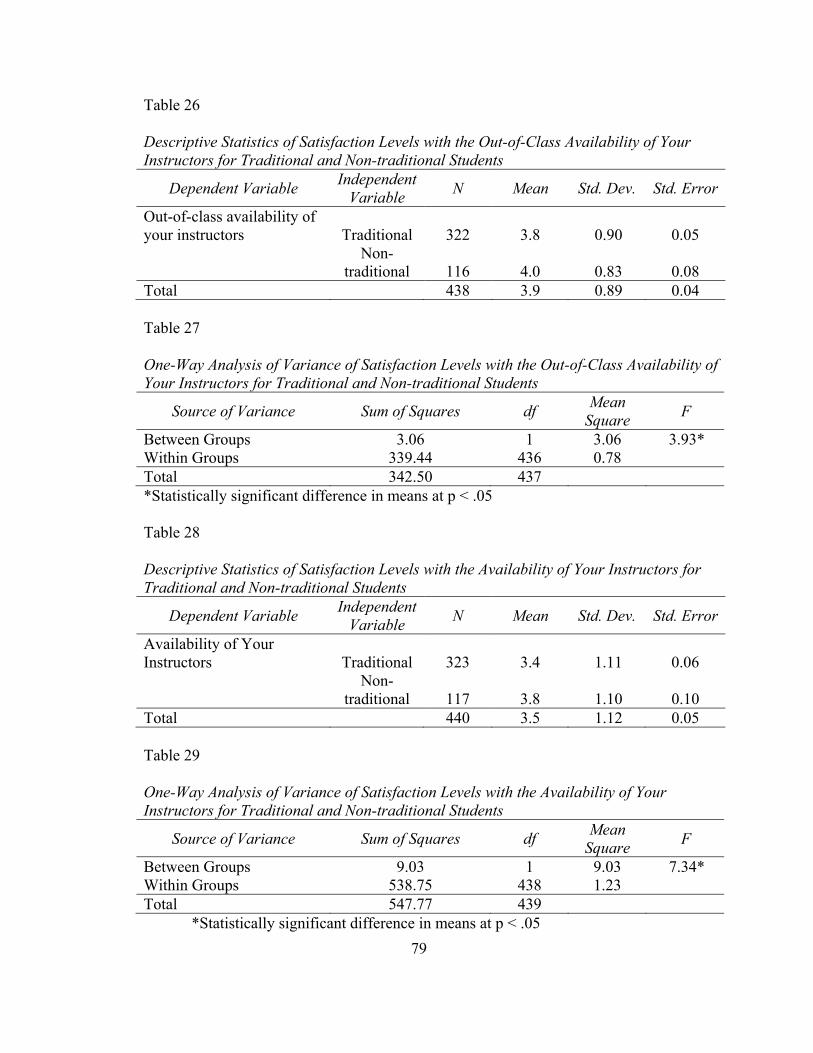
79
Table 26 Descriptive Statistics of Satisfaction Levels with the Out-of-Class Availability of Your Instructors for Traditional and Non-traditional Students
Dependent Variable Independent Variable N Mean Std. Dev. Std. Error
Out-of-class availability of your instructors Traditional 322 3.8 0.90 0.05 Non-
traditional 116 4.0 0.83 0.08 Total 438 3.9 0.89 0.04 Table 27 One-Way Analysis of Variance of Satisfaction Levels with the Out-of-Class Availability of Your Instructors for Traditional and Non-traditional Students
Source of Variance Sum of Squares df Mean Square F
Between Groups 3.06 1 3.06 3.93* Within Groups 339.44 436 0.78 Total 342.50 437 *Statistically significant difference in means at p < .05 Table 28 Descriptive Statistics of Satisfaction Levels with the Availability of Your Instructors for Traditional and Non-traditional Students
Dependent Variable Independent Variable N Mean Std. Dev. Std. Error
Availability of Your Instructors Traditional 323 3.4 1.11 0.06 Non-
traditional 117 3.8 1.10 0.10 Total 440 3.5 1.12 0.05 Table 29 One-Way Analysis of Variance of Satisfaction Levels with the Availability of Your Instructors for Traditional and Non-traditional Students
Source of Variance Sum of Squares df Mean Square F
Between Groups 9.03 1 9.03 7.34* Within Groups 538.75 438 1.23 Total 547.77 439
*Statistically significant difference in means at p < .05
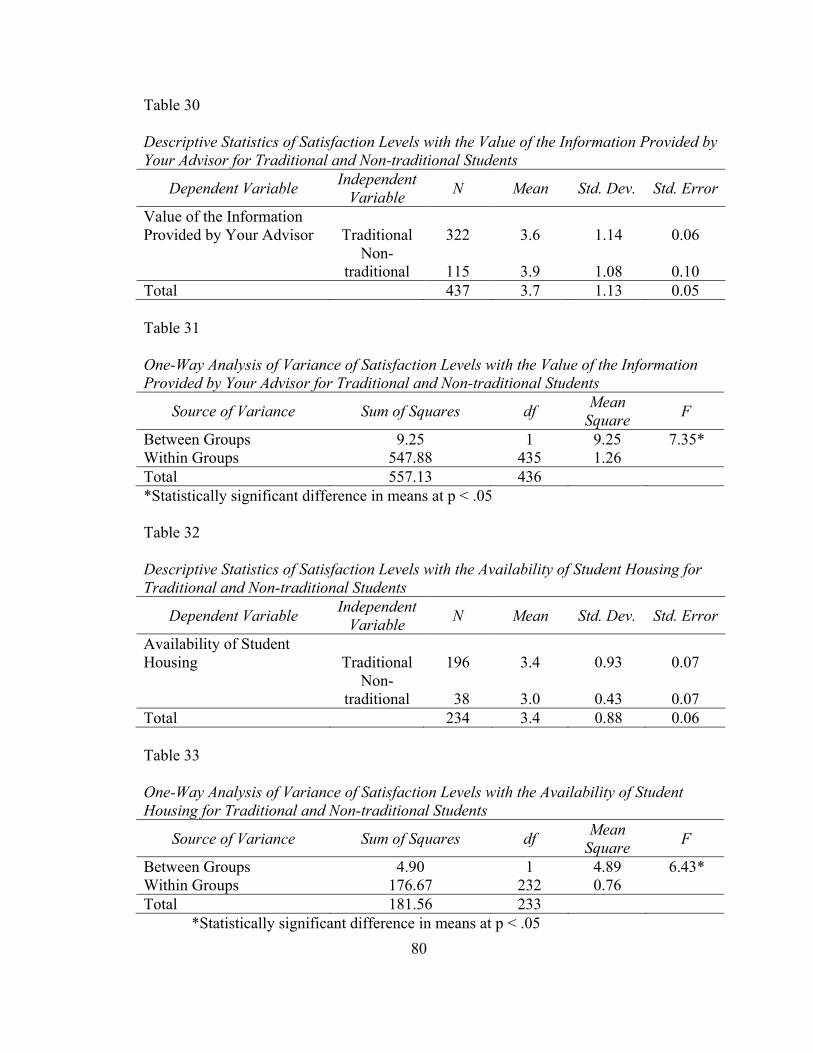
80
Table 30 Descriptive Statistics of Satisfaction Levels with the Value of the Information Provided by Your Advisor for Traditional and Non-traditional Students
Dependent Variable Independent Variable N Mean Std. Dev. Std. Error
Value of the Information Provided by Your Advisor Traditional 322 3.6 1.14 0.06 Non-
traditional 115 3.9 1.08 0.10 Total 437 3.7 1.13 0.05 Table 31 One-Way Analysis of Variance of Satisfaction Levels with the Value of the Information Provided by Your Advisor for Traditional and Non-traditional Students
Source of Variance Sum of Squares df Mean Square F
Between Groups 9.25 1 9.25 7.35* Within Groups 547.88 435 1.26 Total 557.13 436 *Statistically significant difference in means at p < .05 Table 32 Descriptive Statistics of Satisfaction Levels with the Availability of Student Housing for Traditional and Non-traditional Students
Dependent Variable Independent Variable N Mean Std. Dev. Std. Error
Availability of Student Housing Traditional 196 3.4 0.93 0.07 Non-
traditional 38 3.0 0.43 0.07 Total 234 3.4 0.88 0.06 Table 33 One-Way Analysis of Variance of Satisfaction Levels with the Availability of Student Housing for Traditional and Non-traditional Students
Source of Variance Sum of Squares df Mean Square F
Between Groups 4.90 1 4.89 6.43* Within Groups 176.67 232 0.76 Total 181.56 233
*Statistically significant difference in means at p < .05
81
Significant differences were found in the level of satisfaction with out-of-class
availability of your instructors, availability of your advisor, and value of the information
provided by your advisor as non-traditional aged undergraduate students indicated a
higher level of satisfaction than traditional aged undergraduate students. Traditional aged
undergraduate students showed significantly higher levels of satisfaction with the
availability of student housing. The null hypotheses for these four variables were
rejected.
The remaining 38 ANOVA tests conducted on the other aspects of college
environment contained in section III of the instrument failed to reject the null hypothesis
between traditional and non-traditional students. Attributes of the college environment
were examined for differences based on student ethnicity employing statistical analysis
with one-way ANOVAs. The null hypothesis (H07) is that there will be no statistically
significant difference between Caucasian (white) and ethnic minority undergraduate
students in their level of satisfaction with the college environment.
A number of significant differences in student perceptions of their college
environment were evident in relation to their ethnicity. Significant differences existed
among six of the forty-two test combinations between students in this subgroup.
Availability of your advisor, value of the information provided by your advisor, general
admissions procedures, availability of financial aid information prior to enrolling,
opportunities for personal involvement in campus activities, and religious activities and
programs all showed significant differences. The descriptive statistics and the ANOVA
analysis for these aspects of college environment are presented in tables 34 through 45.

82
Table 34 Descriptive Statistics of Satisfaction Levels with the Availability of Your Advisor for Caucasian and Ethnic Minority Students
Dependent Variable Independent Variable N Mean Std. Dev. Std. Error
Availability of your advisor Caucasian 305 3.5 1.13 0.07 Ethnic
Minority 115 3.8 0.98 0.09 Total 420 3.6 1.10 0.05 Table 35 One-Way Analysis of Variance of Satisfaction Levels with the Availability of Your Advisor for Caucasian and Ethnic Minority Students
Source of Variance Sum of Squares df Mean Square F
Between Groups 10.28 1 10.278 8.63* Within Groups 497.86 418 1.19 Total 508.14 419 *Statistically significant difference in means at p < .05 Table 36 Descriptive Statistics of Satisfaction Levels with the Value of the Information Provided by Your Advisor for Caucasian and Ethnic Minority Students
Dependent Variable Independent Variable N Mean Std. Dev. Std. Error
Value of the Information Provided by Your Advisor Caucasian 304 3.6 1.17 0.07 Ethnic
Minority 115 3.9 0.96 0.09 Total 419 3.7 1.12 0.06 Table 37 One-Way Analysis of Variance of Satisfaction Levels with the Value of the Information Provided by Your Advisor for Caucasian and Ethnic Minority Students
Source of Variance Sum of Squares df Mean Square F
Between Groups 9.38 1 9.38 7.54* Within Groups 518.50 417 1.24 Total 527.88 418 *Statistically significant difference in means at p < .05
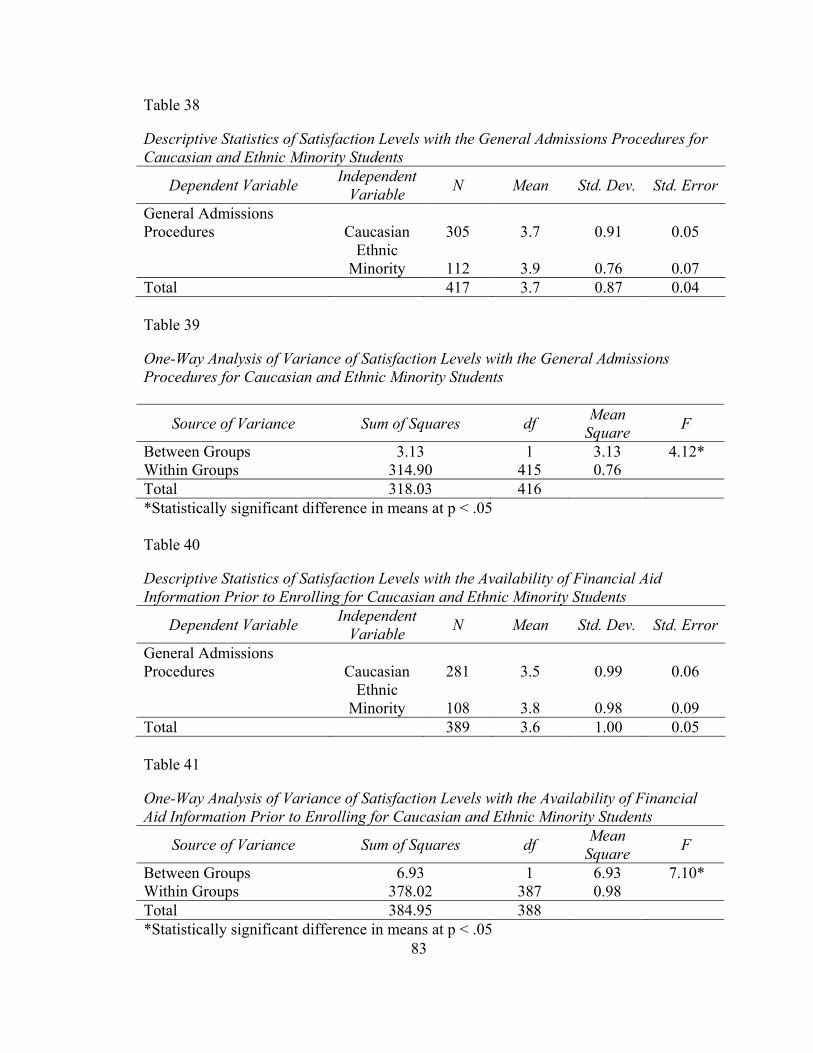
83
Table 38 Descriptive Statistics of Satisfaction Levels with the General Admissions Procedures for Caucasian and Ethnic Minority Students
Dependent Variable Independent Variable N Mean Std. Dev. Std. Error
General Admissions Procedures Caucasian 305 3.7 0.91 0.05 Ethnic
Minority 112 3.9 0.76 0.07 Total 417 3.7 0.87 0.04 Table 39 One-Way Analysis of Variance of Satisfaction Levels with the General Admissions Procedures for Caucasian and Ethnic Minority Students
Source of Variance Sum of Squares df Mean Square F
Between Groups 3.13 1 3.13 4.12* Within Groups 314.90 415 0.76 Total 318.03 416 *Statistically significant difference in means at p < .05 Table 40 Descriptive Statistics of Satisfaction Levels with the Availability of Financial Aid Information Prior to Enrolling for Caucasian and Ethnic Minority Students
Dependent Variable Independent Variable N Mean Std. Dev. Std. Error
General Admissions Procedures Caucasian 281 3.5 0.99 0.06 Ethnic
Minority 108 3.8 0.98 0.09 Total 389 3.6 1.00 0.05 Table 41 One-Way Analysis of Variance of Satisfaction Levels with the Availability of Financial Aid Information Prior to Enrolling for Caucasian and Ethnic Minority Students
Source of Variance Sum of Squares df Mean Square F
Between Groups 6.93 1 6.93 7.10* Within Groups 378.02 387 0.98 Total 384.95 388 *Statistically significant difference in means at p < .05
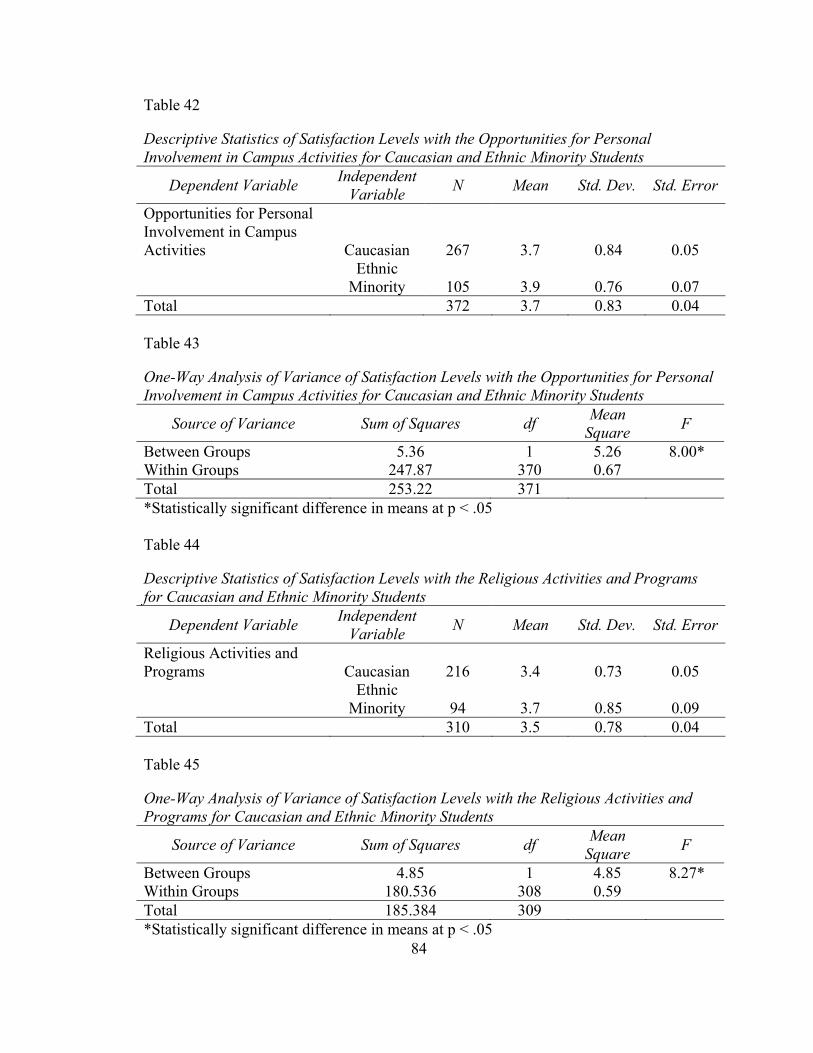
84
Table 42 Descriptive Statistics of Satisfaction Levels with the Opportunities for Personal Involvement in Campus Activities for Caucasian and Ethnic Minority Students
Dependent Variable Independent Variable N Mean Std. Dev. Std. Error
Opportunities for Personal Involvement in Campus Activities Caucasian 267 3.7 0.84 0.05 Ethnic
Minority 105 3.9 0.76 0.07 Total 372 3.7 0.83 0.04 Table 43 One-Way Analysis of Variance of Satisfaction Levels with the Opportunities for Personal Involvement in Campus Activities for Caucasian and Ethnic Minority Students
Source of Variance Sum of Squares df Mean Square F
Between Groups 5.36 1 5.26 8.00* Within Groups 247.87 370 0.67 Total 253.22 371 *Statistically significant difference in means at p < .05 Table 44 Descriptive Statistics of Satisfaction Levels with the Religious Activities and Programs for Caucasian and Ethnic Minority Students
Dependent Variable Independent Variable N Mean Std. Dev. Std. Error
Religious Activities and Programs Caucasian 216 3.4 0.73 0.05 Ethnic
Minority 94 3.7 0.85 0.09 Total 310 3.5 0.78 0.04 Table 45 One-Way Analysis of Variance of Satisfaction Levels with the Religious Activities and Programs for Caucasian and Ethnic Minority Students
Source of Variance Sum of Squares df Mean Square F
Between Groups 4.85 1 4.85 8.27* Within Groups 180.536 308 0.59 Total 185.384 309 *Statistically significant difference in means at p < .05
85
nment.
Ethnic minority students indicated a significantly higher level of satisfaction with
the availability of their advisor, value of the information provided by their advisor,
general admissions procedures, availability of financial aid information prior to enrolling,
opportunities for personal involvement in campus activities, and religious activities and
programs than their Caucasian contemporaries. The null hypotheses for these six
variables were rejected. The remaining 36 ANOVA tests conducted on the other aspects
of college environment contained in section III of the instrument failed to reject the null
hypothesis between Caucasian and ethnic minority undergraduate students.
The final area earmarked for statistical analysis was the relationship between the
college environment and student’s gender. One-way ANOVAs were calculated for all 42
aspects of the college environment to explore differences in male and female satisfaction.
The null hypothesis (H08) is that there will be no statistically significant
difference between male and female undergraduate students in their level of satisfaction
with the college enviro
Of the 42 dependent variables, only one, availability of courses when students
want at the times they can take them, showed statistically significant differences between
the sexes. The descriptive statistics and the ANOVA analysis for this aspect of college
environment are presented in tables 46 and 47, respectively.
Male students indicated a significantly higher level of satisfaction with the
availability of courses they wanted at the times they could take them than female
students. The null hypothesis for this variable was rejected.
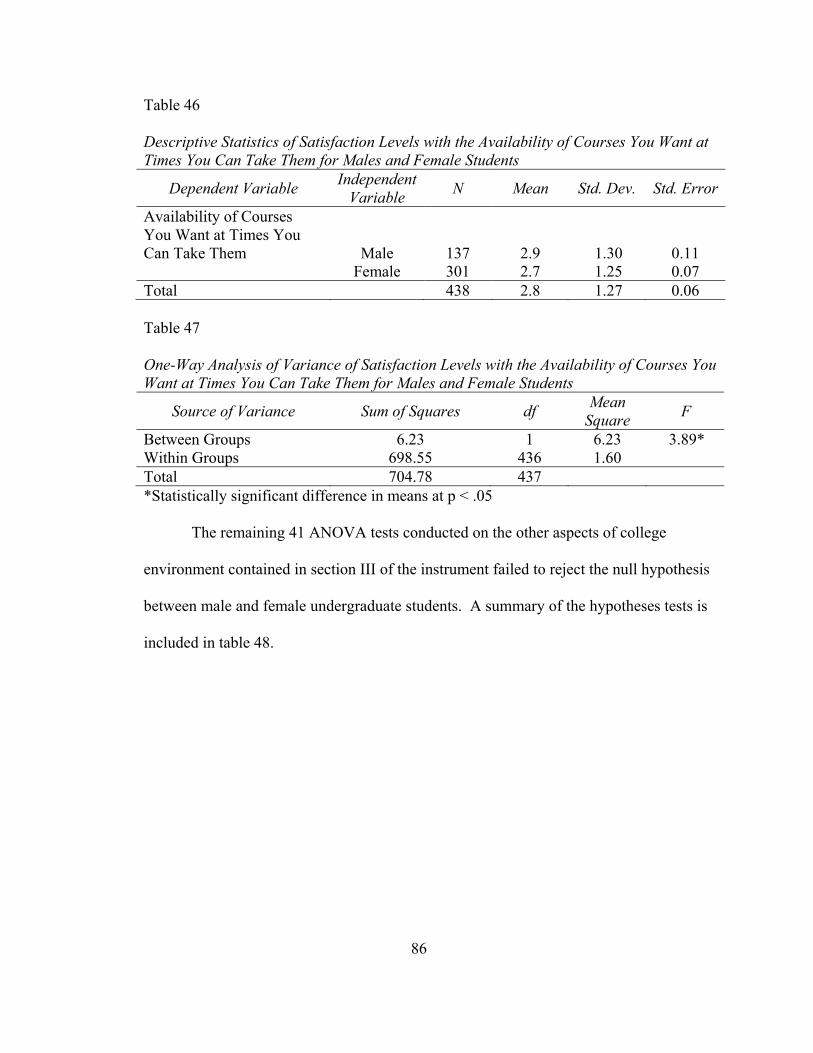
86
Table 46 Descriptive Statistics of Satisfaction Levels with the Availability of Courses You Want at Times You Can Take Them for Males and Female Students
Dependent Variable Independent Variable N Mean Std. Dev. Std. Error
Availability of Courses You Want at Times You Can Take Them Male 137 2.9 1.30 0.11 Female 301 2.7 1.25 0.07 Total 438 2.8 1.27 0.06 Table 47 One-Way Analysis of Variance of Satisfaction Levels with the Availability of Courses You Want at Times You Can Take Them for Males and Female Students
Source of Variance Sum of Squares df Mean Square F
Between Groups 6.23 1 6.23 3.89* Within Groups 698.55 436 1.60 Total 704.78 437 *Statistically significant difference in means at p < .05
The remaining 41 ANOVA tests conducted on the other aspects of college
environment contained in section III of the instrument failed to reject the null hypothesis
between male and female undergraduate students. A summary of the hypotheses tests is
included in table 48.

87
Table 48 Summary of Hypothesis Tests Number Hypothesis Statistical Test
H01
There will be no statistically significant difference between the target university and national norms for public college students in their level of satisfaction with college services and programs.
Reject H0
H02 There will be no statistically significant difference between the target university and national norms for public college students in their level of satisfaction with the college environment.
Reject H0
H03 There will be no statistically significant difference between traditional and non-traditional aged undergraduate students in their level of satisfaction with college services and programs.
Reject H0
H04 There will be no statistically significant difference between Caucasian and ethnic minority undergraduate students in their level of satisfaction with college services and programs.
Reject H0
H05 There will be no statistically significant difference between male and female undergraduate students in their level of satisfaction with college services and programs.
Reject H0
H06 There will be no statistically significant difference between traditional and non-traditional aged undergraduate students in their level of satisfaction with the college environment.
Reject H0
H07 That there will be no statistically significant difference between Caucasian (white) and ethnic minority undergraduate students in their level of satisfaction with the college environment.
Reject H0
H08 That there will be no statistically significant difference between male and female undergraduate students in their level of satisfaction with the college environment.
Reject H0
88
Tailored Survey Questions
Aside from examining undergraduate student satisfaction with college services
and environment at a large southeastern doctoral/research extensive university (target
university), the additional raison d'être for the study was to better understand the long-
term intent of minimizing detractors to providing exceptional service quality, positively
influencing customer satisfaction, and building loyalty intentions among students.
Students were asked three additional tailored questions in section IV of the
Student Opinion Survey (ACT, Inc.). Fully four-fifths of the undergraduate students at
the target university replied “yes” when asked, “If you had it to do again, would you
attend this college?” This may indicate satisfaction with the university as a whole which
could influence student loyalty intentions.
To determine if students were generally satisfied, the survey asked, “How
satisfied are you with the college as a whole?” Again, four-fifths (N=450) of students
responded that they were satisfied with the college as a whole (M=4.0, SD = .85). Nearly
one-quarter of the respondents were “very satisfied.”
The underlying purposes of the study may be influenced by students’ perceptions
regarding how they are treated and cared for by university staff and faculty. Students
were asked, “Do you feel that university personnel are caring, warm people who are
willing to help individual students?” Over 90 percent of students responded “yes”
(N=450). Of those, about 16 percent of students replied “yes, always,” with nearly two-
thirds indicating “yes, sometimes” and 13 percent “yes, but seldom.” Less than 8 percent
of students answered “no” to that question (M=3.8, SD = .85). Consistently delivering
89
friendly, caring service to students may positively impact student satisfaction, and would
likely influence student loyalty intentions to the university in the long term.
Discussion of Survey Respondent Comments and Suggestions
As part of the study design, section V of the Student Opinion Survey (ACT, Inc.)
offered an opportunity for students to respond with written, open-ended qualitative
feedback on their perceptions of the target university’s college services and college
environment. One quarter of the survey respondents (N=117) provided this written
feedback concerning their interests, beliefs, attitudes, opinions, and behaviors (Gay,
1992). These student comments and suggestions helped further inform and support the
research questions in this study.
The student comments and suggestions were examined and grouped into a
collection of summative categories in an effort to discern relevant trends or themes
contained in the qualitative feedback. Some students offered comments that spanned
multiple categories myriad issues. The most frequently cited comments and suggestions
are summarized, along with selected excerpts from the student comments. Students
commented mostly about parking, advising, class availability, facilities, and the
deportment of college staff.
Students described the availability of campus parking facilities as “horrible,”
“ridiculous,” “horrendous,” “a disaster” and “a nightmare.” There were no positive
comments recorded in this category, which ranked the lowest of all college services and
programs surveyed. The primary concern was a lack of available parking spaces for
commuter students. Additional concerns voiced were expensive parking fees, plentiful
90
vacant staff parking spaces, and a lack of conveniently located parking garages on
campus. Students commented:
“Parking situation needs to be dealt with. The campus is crazy strict on parking,
yet there is not enough of it… many people will never give any money to this school
because they were sucked dry when they were students.”
“Parking sucks, but I think it’s like that everywhere.”
“I would like the meters removed from the student parking areas. I think it is
unfair to make students buy parking decals and on top of that make them pay additional
monies to park in their designated area.”
“Parking is horrendous. They take away parking lots to build more housing
units… more places to house students and less parking… bad logic there.”
“Parking is a nightmare because the school allowed more students to attend than
they had parking available. Many parking spaces for teachers sit empty while students
have to park further away, could be a safety risk and an inconvenience for some.”
“Every day I go to class and… half of the staff/faculty parking spaces are empty,
and at the same time I have to fight with 25,000 other full-time, non-resident students to
get a parking space within a mile of my class.”
“For at least the first six weeks of a new semester it was not uncommon for me to
spend over 30 minutes looking for an open (parking) space, every day. I have missed
class, quizzes and important lectures because of (a) lack of parking.”
“I don’t think freshman should be able to park on campus… when I am spending
so much for a parking spot I can’t get, it’s a problem.”
91
The parking issue is becoming ridiculous… and honestly it has been one of the
reason(s) why I have considered attending (another university in the area) instead of (the
target university). Though I paid for my permit, I am unable to find parking (on campus)
and have to resort to parking at the mall and catching the shuttle bus….”
The parking (situation)… really makes us students feel like the university does
not care about us at all.
Several students commented about handicapped parking on campus:
“Handicapped parking should be free for handicapped students with proper I.D.
We don’t take any parking spaces from students who are not disabled.”
Academic advising commonly supports students by helping them select relevant
and required courses for a plan of study, evaluating the acceptability of course credits
transferred from other institutions, and guiding them with course sequencing and timing
so that students might graduate in a timely manner. Feedback gathered from students
with regard to academic advising services, used by nearly 90 percent of all survey
respondents, varied. Most comments centered on advisors that were unacquainted with
the course requirements for the major, offered conflicting or incorrect advice, or were
unresponsive to student needs. Some students commented on a scarcity of advisors in
their colleges and departments, which they observed were insufficiently staffed to
accommodate all the students, resulting in rushed meetings and prolonged wait times.
Many students indicated satisfaction with academic advising services. Students
commented:
“My advisor has seldom ever (given) me useful information and has actually
steered me in the wrong direction entirely.”

92
“I see a definite lack of caring advisors that are willing to work with individuals.
I hate getting the ‘run around’ from advisors, leading me to ask three different people for
one valid answer to a question.”
“Freshman advisors should not advise students against doing what they want. I
had more academic advising from the… instructors that was useful then (from) the
academic advisors who are getting paid to do a job.”
“I did not care for my advisor meeting. I properly scheduled my appointment
and while I was there, he ended up advising someone else over the phone… he was
mouthing to me the classes he wanted me to take while on the phone with the other
student! I waited over 20 minutes while he was advising another student and I was then
rushed out due to… another appointment coming in. This is very unsatisfactory and I am
disappointed in my advisor’s lack of professionalism.”
“I took several classes that I did not need that were satisfied at my community
college, but the general advisors said that I needed and placed me into.”
“Providing undergraduate academic counselors that have expert knowledge in
certain majors could be improved.”
“I don’t know what the ratio is of advisors to students, but it is evident that there
(are) too many students for the advisors to handle.”
“Advising in the business building during registration is unreal. I’ve waited over
3 hours to see an advisor during walk-in only times. Hire more advisors or hire
temporary advisors who can answer general questions and help speed up the process.”
93
“We have one single advisor for our entire art program. He works very hard to
help us all but he cannot do it all on his own. With the growing number of art students
we seriously need more advisors and more guidance with what classes to take.”
Several students praised the academic advising services they received:
“I have, so far, been extremely satisfied with my program’s advising staff.”
“My advisor has been very helpful.”
The only statistically significant finding regarding the target university
environment was that students were dissatisfied with the availability of courses at times
they were able to take them (M=2.8, SD = 1.27), which was statistically below the
national norms for this registration item at other public universities. More student
feedback was provided on course availability than in any other qualitative category. In
addition, students noted that classes required for their major were limited or unavailable
and that preferential registration treatment was extended to certain classifications of
students (i.e. Honors and ROTC undergraduates), thereby extending their time until
graduation. Students remarked:
“(The target university’s) new class scheduling is the worst thing to happen to this
college. While it may not want to be seen as a commuter school, adding so many Friday
sections and 7:30 a.m. sections is just going to end up losing … students and thereby
revenue for the college. Budget cuts and ignorant decisions regarding losing the
‘commuter college’ image have made it so much harder to create my fall 2008 class
schedule. I considered switching to another college just so I could take the classes I need
at the times I needed them.”
94
“(The target university) needs to seriously address their class availability
situation… I am a senior and it appears it may take me a year or more to get my last four
classes… due to availability issues. I work full time and it appears that (the target
university) could care less about those students who work full time.”
“…for seniors who need classes to graduate on time, the university makes it very
difficult to schedule the classes you need. For instance, this upcoming semester I can
only take one of the four classes I need to take because they are all at the same time
during the same day… my graduation date is being pushed back another semester or
two.”
“The budget cuts for the state have had a detrimental effect on the education of
many of the students. It makes scheduling classes much more difficult…”
“…there is not enough class time variety in the College of Business. Now that we
can see ahead on the class schedule search, I looked up a class for fall 2008 and fall 2009,
since it’s not offered in the summer… and it is at the same time for both semesters.
There are three sections: two are at night, and one is late in the day. None of them will
work with my schedule.”
“More seats in the introductory science courses and enough lab seats for each
student in the lecture should be available. When registering for courses, the professor
teaching the course should be listed in the schedule at the time the course schedule
becomes available.”
“It’s frustrating when registering for classes (when) the subjects you are interested
in and/or were planning on taking are no longer offered.”
“I would appreciate more flexibility in the hours offered for classes.”
95
“I transferred in… and had problems registering. Two semesters I didn’t attend
because I couldn’t get the classes I needed.”
“I understand that with the many budget cuts it may be difficult to offer as many
classes as before. However, one of the things that slowed me down was the overlapping
of class times for the classes I needed or an insufficient number of class sections for
certain high demand classes.”
“(The target university offers) a substantial surplus of gen ed courses, but only
one class per semester for core classes that people must take in order to graduate.”
“I have seen (in college emails) that the number of classes offered per course are
going to be cut in half, and I’ve also seen encouragement from College of Education
advisors to take as many courses at community colleges while at (the target university)
because there will not be enough classes for all of the enrolled students. That scares me a
bit as I will be entering my senior year and I am on a specific course plan. I would be
very upset if I wasn’t able to get a course that I needed and I had to spend an extra
semester in college.”
“It is very difficult to find classes that are available. There are limited classes
being offered for each section. So, many students are not able to graduate on time.”
“Even if you happen to find a few classes that interest you (and get credit for),
there is always a good chance it will be closed by the time you can register. It is
incredibly unfair that an honors freshman can register before a non-honors senior. No
wonder people ever graduate from here.”
“(Target university) registration process is ridiculous. Honors freshman have
priority registration over regular seniors. Someone isn't doing their job to assist students
96
properly. For a sophomore, junior, or senior it is very difficult to register for courses due
to the horrible registration policies at (the target university). Priority registration either
should not be allowed (except when graduation is an issue), or it should be limited to
being below upperclassmen. For example, an honors freshman (or ROTC freshman for that
matter) should not be granted priority registration over sophomores, juniors, and seniors.
By doing this, they are making it very difficult for the upperclassmen to graduate on time,
or take the classes they want and/or need.”
Student perceptions about college facilities covered the gamut, from a dismal to
superb. Survey respondents commented on the condition and maintenance of the
buildings and grounds, as well as lab equipment and desk chairs. Students wrote:
“Some of the buildings are quite old and could use some renovation.”
“Exterior buildings look great. Interiors need some attention. Cleanliness is not
always a top priority.”
“I am not satisfied with the fact that the school would rather build a new gym, or
new parking garages, when Social Work students and Arts & Science students do not
have the proper classrooms of their own.”
“I have been here for four years, and still the girl’s bathroom (seats) haven’t been
fixed yet near the lab rooms.”
“The school of music we have now is terrible. There are not enough classrooms,
rehearsal rooms, practice rooms, or recital halls. There are classrooms with mold and
water leaks.”
“…there are some really nice buildings and classrooms on campus. These nice
facilities, however, are not available to students of the social sciences.”
97
“The physical structures used in social sciences are old and pitiful.”
“The Fine Arts building is rotting before my very eyes, while a new student union
is erected! (The College of Arts and Sciences building) is a monolithic testament to the
McCarthy era!”
“My biochemistry lab was grossly unequipped for the handling of the toxic
chemicals which experiments required (gloves, pipet tips, etc...).”
“It is frustrating to spend 4-5 hours in a lab with a broken sink and broken lab
equipment…”
“There are no accommodations for students who do not comfortably fit into (the
desk chairs) and few, if any, desks for left-handed (students). Students with disabilities
are instructed to notify instructors or disability services with special needs, but large
students may not consider themselves “disabled” and/or may be embarrassed to make
such a request. It would be helpful to have a few different accommodations other than
the small desks in the classrooms available.”
“For the most part, the campus is very modern looking.”
“The classrooms just need some spring cleaning done, and some brighter lights.
There are not any windows in any classes, so (better lighting would be) good…”
The vast majority of students responded in uncomplimentary terms when
describing the service they received from non-teaching college support staff, using
language such as “rude,” “impolite,” and “uncaring” to articulate their experiences. Like
most consumers, students prefer service providers that offer friendly and caring service,
help solve their problems, and are flexible when confronted with bureaucratic policies,
practices, or procedures. Along those lines, students commented:
98
“Non-teaching staff are constantly rude and could care less if your problem is
resolved. At this school a student is a drop in the ocean (of tuition money) and if they are
unsatisfied that is too bad.”
“Although the staff I have spoken to in (the financial aid office) have been
friendly, they have not always been helpful.”
“Encourage staff to be more helpful and pleasant when students need them most.”
“Staff sometimes forgets that their job is to address students and their concerns.”
“People are rude and slow. You always get different stories from different
people.”
“Honestly, the one thing that bothered me more than anything about the (target
university) is the people in the golf carts zooming around (campus). First, it (doesn’t)
make for a comfortable surrounding and second, these people have no regard for students
walking on sidewalks. Extremely rude people. For some reason, they feel the golf cart
gives them some sort of ‘power’ believe it or not.”
“Staff (are) not polite with students.”
“One of the main issues I have with the (target university) is non-academic staff.
I never have a satisfying time dealing with registrars, financial aid, or the cash group.
They are always very rude and don’t feel it is necessary to go above and beyond anyone’s
expectation. If you call over the phone, it is worse because you will wait on hold for a
long period of time, and when you get to someone, they don’t understand how to resolve
the issue most of the time. They will transfer you to another person ever if it says on
(the) form to call that particular office. If this… could be changed, this would be a great
college.”

99
“Sometimes it feels like you are just a number.”
“It seems that the departments don’t communicate, such as the academic and
financial aid departments, or the financial aid and admissions departments.”
“I love this school so much, but I think it is sometimes hard to be considered a
person here. Generally, I know that many people feel that they are just a (student)
number and another source of money for the college.”
“I think some of the support staff such as in the registration office and in financial
aid are burnt out and have developed bad attitudes towards students. Additionally, some
of the policies are unnecessarily confusing and the staff are not clear communicators and
so (they’re) unable to clarify policy for students. The end result is that students often
have to figure things out for themselves. I think some staff in some offices of this
university could benefit from further training and attitude adjustments.”
“I feel the attitude from most of the faculty and staff is apathy and egocentrism.”
‘It is almost impossible to get in touch with anyone live, you can leave messages
for weeks and no one gets back to you.”
“Many from the… staff do not know how to respectfully talk to people.”
“Give your staff some customer service training.”
The next chapter will present a discussion of the above findings along with their
implications for practice. In addition, limitations of the study will be addressed,
recommendations for future research offered, and a conclusion presented to summarize
the study.
100
Chapter Five
Discussion, Conclusions and Recommendations
Introduction
The purpose of this study was to use a service quality model to investigate
undergraduate student perceptions of service quality in a large southeastern
doctoral/research extensive university. In addition, this study examined whether
undergraduate student satisfaction varied based on selected demographic characteristics,
and compared student satisfaction to that of similar institutions of higher education. This
chapter presents an analysis and interpretation of the study findings in relation to the
three research questions and eight hypotheses, discusses the implications and offers ideas
for additional research.
Discussion of Research Findings
Using quantitative research analysis techniques, this study addressed three
research questions. Each research question is presented, followed by a discussion of the
findings.
Research Question One
What is the general level of satisfaction with the college services and environment
among undergraduate students at a large southeastern doctoral/research extensive
university as measured by the Student Opinion Survey (ACT, Inc.)?
101
The question was designed to ascertain the general level of satisfaction with
college services and programs, as well as the college environment, at the target
university. Academic advising, parking services, and the library were the most heavily
utilized services on campus. Of the twenty-three support services examined, students
were satisfied with only one, the library, and dissatisfied with only one, parking.
The student library is modern, convenient, and stocked with a plethora of useful
publications and databases, however some students commented that the library operating
hours should be extended. Like the library, campus parking is also used by over 85
percent of students; however it was ranked at the very bottom of the list for student
satisfaction. This is most likely due to the perception that there is a lack of adequate
parking spaces conveniently located on campus. This perception may be shared by
others, as parking was also ranked very low on the satisfaction scale nationwide by
students, likely signaling a widespread problem at many universities.
One of the 42 measures of the college environment, the availability of courses
students want at the times they can take them, showed marked dissatisfaction by the
majority of student respondents, and ranked well below the national norm of other public
universities. Some students indicated that the lack of flexible class times and limited
course availability had preventing them from graduating in a timely manner, while others
considered defecting to nearby institutions to complete their degrees.
Research Question Two
What is the level of satisfaction with the college services and environment among
undergraduate students at a large southeastern doctoral/research extensive university in
relation to students at similar institutions nationwide?
102
Satisfaction levels with support services for the students at the target university
were compared to those of over 92,000 other students. Again, only satisfaction with the
library was ranked significantly higher than the national norm, with recreational and
intramural programs, personal counseling services, career planning services, and job
placement services significantly below the national norms.
Generally regarded as a commuter school with a comparatively small on-campus
population, many off-campus students at the target university may not avail themselves to
the many on-campus recreational activities, as they might do in a “college town” where
the university is the focal point of student life in the community. Since nearly three-fifths
of all survey respondents were seniors, and over 90 percent indicated that their primary
purpose in college was to obtain a bachelor’s degree, suggests that a number of these
students may well be preparing for life beyond graduation. As such, help with career
planning and job placement might be considered critical elements to securing a new job
in their chosen profession. The lower satisfaction scores in these areas might be
attributed to students entering the work force at a time of slow economic growth in the
local metropolitan area, and if unable to secure employment, concluding that these
support services were ineffective and unsatisfactory. Overall, students at the target
university are significantly less likely to be satisfied with the college environment than
those at other public universities in the ACT national norms.
Research Question Three
What is the relationship between the personal characteristics of undergraduate
students and student satisfaction with the college services and environment derived from
comparisons among subgroups?
103
Student satisfaction with the college services and environment were compared
among the age, ethnicity, and gender subgroups. Twenty-five percent of the respondents
were non-traditional students, those 26 years and older. They showed a significantly
higher level of satisfaction with academic advising services than their junior counterparts.
This may be a result of some traditional students’ displeasure over mandatory first-year
advising at the target university, a product of maturity and academic savvy among non-
traditional students to discern accurate information from erroneous advice, or possibly
non-traditional students’ confidence to bypass the academic advising services and plot
their own plan-of-study.
Although 70 percent of the students who responded to the study were Caucasian,
ethnic minorities were significantly more satisfied with the library facilities and services,
student health services, and the college orientation program than were their white
colleagues. The minority population of the target university is around 31 percent, one of
the highest in the state. The target university has been ranked in national publications,
and received numerous awards, for its inclusiveness and diversity. Many ethnic minority
students transfer in from the surrounding community colleges, where the library holdings
and health care services are far more limited, and the orientation programs perhaps less
comprehensive, so they might be inclined to view these services favorably.
Female students were significantly more satisfied with both student health
services and food services than their male counterparts, with females comprising nearly
70 percent of survey respondents. Each term, students pay a mandated health fee and
receive unlimited doctor’s visits, reduced costs for laboratory tests and medications, and
health education programs. The treatment provided is individualized and personalized to
104
each patient, regardless of sex, depending on their unique symptoms. Female students at
the target university were offered special gender-based services from medical
practitioners that have undergone special training in women’s health care, including
gynecological procedures and contraceptive counseling. Their higher satisfaction may be
explained, in part, to the positive reception of the practitioners in this specialized area of
medicine. The significant difference in student satisfaction with food services between
the sexes requires additional research into food preferences, including healthy menu
options and available food choices.
The 42-individual aspects of the college environment were examined based on the
age, ethnicity, and gender student subgroups. Significant differences in satisfaction
levels were manifest in all three subgroups, with ethnicity showing the greatest number of
significant differences (p. 74) and gender the least (p. 78).
Traditional students (aged 18-25) were significantly more satisfied with student
housing than non-traditional students (aged 26 and over). This finding is consistent with
the ACT national norms. Although only 12 percent of all survey respondents lived on
campus, three times more traditional students than non-traditional students responded to
the question regarding satisfaction with student housing, possibly indicating a higher
degree of familiarity among traditional students with the accommodations offered.
It is likely that traditional students are the primary residents of on-campus student
housing, and thereby more aware of the accommodations and features of student housing
than non-traditional students. In fact, one-half of all incoming freshman students lived on
campus. Student housing is clustered into four centers of community activity, essentially
offering an academic support community along with simple immersion into campus life
105
activities and events. Notably, the target university offers learning communities and
separate accommodations for students with shared interests in both academic majors and
philosophy. These accommodations and features of student housing may contribute to
the higher level of satisfaction among the primary residents, traditional students.
Closely patterning an earlier finding on the topic of academic advising services,
non-traditional students had significantly higher satisfaction scores than traditional
students in the availability of academic advisors and the value of information provided by
those advisors. Non-traditional student respondents are mostly upperclassman, with
generally easier access to registration and course choices since they register for classes
ahead of freshman and sophomores. When courses are unavailable for these late
registrants, they are sometimes encouraged to register for courses that may not be
relevant or required for their major, thus delaying their time-to-graduation and possibly
negatively impacting their level of satisfaction with the advising services. More courses
are being offered to meet this shortfall at the target university in an effort to improve
graduation rates and capture a portion of the State’s performance funding tied to
improved graduation rates.
Non-traditional students who completed the survey instrument are working, on
average, at least 10-hours more each week than traditional students, and it is conceivable
that they are also enrolled in more evening and weekend classes to accommodate those
demanding work schedules. As a result, the possibility exists that non-traditional
students are more satisfied with the guidance they are receiving from academic advisors,
since the courses they are advised to take are available and relevant to the major.
106
Students differed significantly in their satisfaction level with several aspects of
the college environment based on their ethnicity, Caucasian or ethnic minority. Ethnic
minority students noted a significantly higher level of satisfaction with the availability of
their advisor, value of the information provided by their advisor, general admissions
procedures, availability of financial aid information prior to enrolling, opportunities for
personal involvement in campus activities, and religious activities and programs than
Caucasians.
In an effort to support and retain minority students, the target university has
established a number of special programs for ethnic minorities that provide individually
assigned mentors and advisors, minority-based scholarships, special interest newsletters
and workshops, and personal one-on-one counseling, all in an effort to closely monitor
and guide minority students. In a 2004 report entitled, “A Proposed Action Plan to
Enhance Student Academic Persistence and Success at (the Target University)” indicated
that some special minority programs have a student to advisor ratio of 80 to 1, whereas
many other advisors support as many as 600 to 1,100 students each term (subsequently
reduced with the addition of more academic advisor). Advisors are rewarded for
satisfying “special populations” as part of their performance surveys. The higher levels
of satisfaction with the advisor availability and the value of the information they provide
might be attributed, in part, to the more personalized attention provided to this group of
students.
Procedures to streamline admissions for minority candidates, and make financial
aid readily available, have been instituted by the target university in an effort to remove
barriers to admission and attract ethnic minority students to the university, thereby
107
enjoying the benefits of a diverse student body. The target university is committed to
providing educational opportunities and financial support for all students; however
particular predilection is extended to qualified ethnic minorities, which might explain
their higher satisfaction with admissions procedures and availability of information prior
to enrolling.
Opportunities for personal involvement in campus activities was also ranked
significantly higher among ethnic minority students than Caucasian students. The target
university has an extraordinary array of opportunities for students of every background
and ethnicity to become involved in campus activities. A student involvement center
supports volunteer efforts in the community, various Greek organizations cater to specific
ethnic minorities, and the university offers a myriad of college sports, performance arts,
guest speakers, and events throughout the year. All students are offered a wide
assortment of activities, however many activities are tailored to specific ethnic groups,
possibly fostering a sense of belonging and inclusion. As a result, some ethnic minorities
might be more satisfied with their opportunities to become involved in campus life and
activities.
Few differences in student perceptions of the college environment based on a
student’s gender were revealed in the course of this study. Males experienced a
significantly higher level of satisfaction with the availability of courses they wanted at
the times they could take them than females (if equal variances are assumed). Both
genders were dissatisfied with this aspect of the college environment, however males
were slightly less dissatisfied. This satisfaction ranking between the sexes is patterned in
the national ACT norms as well.
108
Over two-thirds of the students who responded to the availability of courses
aspect of the college environment were female. One explanation for the higher
dissatisfaction among female respondents might be explained by the unavailability of
courses in specific high demand majors that have a higher proportion of female students.
Two-fifths of all student respondents were either business or science majors, both with
majority female populations at the target university. These majors may offer too few
required courses, inadequate lab sections, or inconvenient class times in comparison to
other male-dominated majors like engineering and mathematics.
A relatively small number of significant differences existed in student satisfaction
with the college services and environment when compared among the age, ethnicity, and
gender subgroups. Of the nearly 200 ANOVA analysis conducted to explore this
research question, only 11 showed significant differences in satisfaction levels, and in
almost every case, the differences were small.
Recommendations and Implications
The important role of measuring service quality in achieving student satisfaction
is often understated, misunderstood, or disregarded in higher education. There is a need
for staff, faculty, and administrators to be held accountable for effectively meeting or
exceeding student service quality expectations. Students form perceptions of their
service experience each time they come in contact with the university, and it is the results
of these perceptions that drive the following implications and recommendations for this
study:
1. There is a need for university leaders to take a decisive role in removing barriers
to student satisfaction by listening and responding to student expectations,
109
continuously measuring student perceptions, implementing a customer-focused
mission statement, rewarding service oriented departments and support staff, and
revising policies, practices, and procedures that interfere with satisfying students.
2. There is a need to respond to student feedback. The simple act of surveying
student opinions regarding their level of satisfaction with college services and
programs shows that the university cares. However, if administrators do not make
improvements based on their feedback, it is likely student satisfaction will not
improve. Specifically, student satisfaction at the target university would likely
improve with the addition of more parking spaces, additional academic advisors,
and more required classes. Several new parking garages are in various stages of
completion at the target university, and a number of additional academic advisors
are now in place to explicitly address and improve students’ satisfaction with
these support services.
3. There is a need for university service providers to participate in service quality
training that promotes friendly and caring service, problem solving, flexibility,
and recovery from mistakes, which are critical elements to building student
satisfaction and stemming student defections to competitors.
4. Students expect the university to be focused on their academic, social, and
emotional needs. As such, there is a need for the university’s executive
management team to develop a student-centric mission statement if they expect to
satisfy these student needs. Playing “lip service” to serving students will not
suffice, or lead to greater levels of student satisfaction. Executive managers
110
should have a portion of their compensation tied to the improvement of
quantitative student satisfaction results for their key areas of responsibility.
5. The individuals and departments that provide consistently higher levels of student
satisfaction should be rewarded. Support staff that are not focused on student
satisfaction should be mentored and coached to provide a higher level of service
quality. Student satisfaction measures should be an integral part of student-
contact employees’ performance plans.
6. There is a requirement to eliminate unnecessarily burdensome or overtly
bureaucratic university policies, practices, and procedures throughout the
enterprise. Student satisfaction will likely increase when they are presented with
organizational flexibility, choices, and options.
Limitations
Study limitations are due primarily to the recall design of the research and the
problems inherent in studying perceptions. These limitations include:
1. Limited generalizability of the study exists because the findings were limited to
undergraduate students at one large southeastern doctoral/research extensive
university located in a major urban setting in the spring of 2008, and were not
necessarily generalizable to other groups or institutions.
2. The results were limited by the validity and reliability of the survey instrument
and the timeframe in which the data was gathered.
3. The data for this study were collected using an online, self-reported survey
questionnaire.

111
4. Sample participants had the option to choose to participate, or not participate, in
the questionnaire.
Recommendations for Further Study
Specific research suggestions that emerged from this empirical investigation
include:
1. Further studies using the same methodology at the target university to examine
the long-term implications of service quality improvement efforts.
2. Expansion of the study to include all public and private institutions of higher
education in the State to establish competitive benchmarks, track student
defections to other institutions caused by poor service delivery, and promote a
statewide service quality measurement and compensation system.
3. Additional exploratory, qualitative, and empirical research on the impact of
student satisfaction vis-à-vis the wide variety of student demographic variables.
4. Further studies of the many types of service encounters, including service failures
and recoveries, present in higher education.
5. An examination of the linkages between service quality measures, performance
plans, and compensation in higher education.
6. An extension and testing of a model to measure internal customer satisfaction
between service providers and institutional departments.
7. A comparison, evaluation, and cross-validation of the most common service
quality measurement instruments in higher education.

112
Conclusions
This study of undergraduate student perceptions of service quality and satisfaction
in a large southeastern doctoral/research extensive university yielded support for the
model tested, and expanded on previous service quality research in business and higher
education. All hypotheses were supported, and significant differences in student
satisfaction levels were manifest based on selected demographic characteristics and
comparisons to similar institutions of higher education.
It is likely that students base their continued enrollment at higher education
institutions, in part, on how well an institution’s programs and services meet their
expectations (Plank & Chiagouris, 1997). When students are dissatisfied with an
institution’s services, they are more likely to defect to competitive institutions (Plank &
Chiagouris, 1997). Some academicians have suggested that institutional efforts to
measure service quality and student satisfaction have fallen short (Lewis & Smith, 1989).
In an effort to stem possible student defections, it is imperative that universities measure
the quality of the services they provide in an effort to improve on them. Oftentimes,
institutions measure things that may not be important to their primary customers, the
students.
Students’ perceptions of the quality of their service experiences should be
assessed. Each time a student experiences some occurrence of an institution’s service,
that service is judged against their expectations (Parasuraman, Zeithaml & Berry 1985,
1988, 1991). In an increasingly competitive higher education arena, research indicates
that service quality is an important determinant of student satisfaction (Young &Varbel,
113
1997). Institutions should be held accountable for effectively meeting or exceeding
students’ expectations of the quality of services it provides.
114
References ACT, Inc., author. (1997). Student Opinion Survey, Iowa City, IA: Author. Athiyaman, A. (1997). Linking student satisfaction and service quality perceptions: the
case of university education. European Journal of Marketing, 31(7), 528-540. Bartlett, J. E., Kotrlik, J. W., & Higgins, C. C. (2001). Organizational research:
Determining appropriate sample size in survey research. Information Technology, Learning, and Performance Journal, 19(1), 43-50.
Boulding, W., Kalra, A., Staelin, R., & Zeithaml, V. A. (1993). A Dynamic Process
Model of Service Quality: From Expectations to Behavioral Intentions. Journal of Marketing Research, 30(1), 7-27.
Cooil, B., Keiningham, T. L., Aksoy, L., & Hsu, M. (2007). A Longitudinal Analysis of
Customer Satisfaction and Share of Wallet: Investigating the Moderating Effect of Customer Characteristics. Journal of Marketing, 71(S 67), 83.
Cronin Jr, J. J., & Taylor, S. A. (1992). Measuring Service Quality: A Reexamination and
Extension. Journal of Marketing, 56(3), 55-68. Crosby, P. B. (1979). Quality is still free: making quality certain in uncertain times. New
York: McGraw-Hill. Delene, L., & Bunda, M. A. (1991). The Assessment of Service Quality in Higher
Education. Paper presented at the International Conference on Assessing Quality in Higher Education Bath, England.
Deming, W. E. (2000). The New Economics: For Industry, Government, Education.
Cambridge, MA: MIT Press. Denzin, N. K., & Lincoln, Y. S. (2005). The Sage Handbook of Qualitative Research (3rd
ed.). Thousand Oaks, CA: Sage Publications Inc. Dill, D. D. (1992). Quality by design: Toward a framework for academic quality
management. Higher Education: Handbook of Theory and Research, 8, 37-83. Dillman, D. A., & Bowker, D. K. (2001). The Web questionnaire challenge to survey
methodologists. Dimensions of Internet Science, Pabst Science Publishers, Lengerich.
Feigenbaum, A. V. (1983). Total Quality Control. New York, NY: McGraw-Hill.
115
Fraenkel, J. R., & Wallen, N. E. (1993). How to Design and Evaluate Research in Education. Boston, MA: McGraw-Hill.
Gage, S. M. (2001). Extraordinary Customer Service: The Agile Manager's Guide.
Bristol, VT: Velocity Business Publishing. Gay, L. R., Mills, G. E., & Airasian, P. W. (2005). Educational research: Comptetencies
for analysis and application. Upper Saddle River, NJ: Prentice Hall. Grapentine, T. (1998). The history and future of service quality assessment. Marketing
Research, 10(4), 4-21. Greene, S. J. (2007). Exploration of Deep Thinking Skills ofUW-Stout Students via
Examination ofNational Survey of Student Engagement (NSSE) and Additional1nstitutional Data. The Graduate School at the University of Wisconsin-Stout, Menomonie.
Gremler, D.D. and Brown, S.W. (1996). Service loyalty; its nature, importance and implications, in Edvardsson B., Brown, S.W., Johnston, R. and Scheuing, E.
(Eds), QUIS V: Advancing Service Quality: A Global Perspective, ISQA, New York, NY, pp. 171-81.
Grönroos, C. (1982). Strategic Management and Marketing in the Service Sector
(Helsingfors, Swedish School of Economics and Business Administration). Hamel, G., & Prahalad, C. K. (1989). To revitalize corporate performance, we need a
whole new model of strategy. Strategic intent. Harvard Business Review, 67(3), 63-76.
Hampton, G. M. (1993). Gap analysis of college student satisfaction as a measure of
professional service quality. Journal of Professional Services Marketing, 9(1), 115-128.
Hanna, N., & Wagle, J. S. (1989). Who is your satisfied customer? Journal of Consumer
Marketing, 6(1), 53-61. Heskett, J. L., Sasser Jr, W. E., & Schlesinger, L. A. (1997). The Service Profit Chain:
How Leading Companies Link Profit and Growth to Loyalty, Satisfaction, and Value. New York: The Free Press.
Heskett, J. L., Sasser, W. E., & Schlesinger, L. A. (1997). The Service Profit Chain. New
York. Hill, F. M. (1995). Managing service quality in higher education: the role of the student
as primary consumer. Quality Assurance in Education, 3(3), 10-21.
116
Huber, F., & Herrmann, A. (2000). The Role of Customer Value in Arriving at an Assessment of Satisfaction: Results of a Causal Analytic Study. Developments In Marketing Science, 110-115.
Johnston, K. B. (1993). Busting Bureaucracy: How to Conquer Your Organization's
Worst Enemy. Homewood, IL: Irwin Professional Pub. Juran, J. M. (1995). A history of managing for quality: the evolution, trends, and future
directions of managing for quality. Milwaukee, WI: ASQC Quality Press. Juran, J. M., & Godfrey, A. B. (1999). Juran's Quality Handbook. New York: McGraw-
Hill. Keller, G. (1983). Academic Strategy: The Management Revolution in American Higher
Education. Baltimore, MD: Johns Hopkins University Press. Kotler, P., & Fox, K. F. A. (1995). Strategic Marketing for Educational Institutions.
Englewoods Cliffs, N.J.: Prentice-Hall. Kuh, G. D. (1995). The Other Curriculum: Out-of-Class Experiences Associated with
Student Learning and Personal Development. The Journal of Higher Education, 66(2), 123-155.
Kvale, S. (1996). Interviews: An Introduction to Qualitative Research Interviewing.
Thousand Oaks, CA: Sage Publications. Kwak, N., & Radler, B. (2002). A Comparison Between Mail and Web Surveys:
Response Pattern, Respondent Pro® le, and Data Quality. Journal of Official Statistics, 18(2), 257-273.
Lewis, B. R., & Smith, A. M. (1989). Customer Care in the Service Sector: The
Customer' s Perspective. FSRC, Manchester School of Management. Lewis, R. C., & Booms, B. H. The marketing aspects of service quality. Energy
Perspectives on Service Marketing, 99-104. Lopez, C. L. (2002). Assessment of student learning: challenges and strategies. The
Journal of Academic Librarianship, 28(6), 356-367. Martensen, A., Grønholdt, L., Eskildsen, J.K. and Kristensen, K. (1999),“Measuring
student oriented quality in higher education: Application of the ECSI methodology”. Proceedings of the Conference on TQM for Higher Education Institutions, August 1999, Verona, University of Verona.
117
Mashall, C., & Rossman, G. B. (1995). Designing Qualitative Research. Thousand Oaks,
CA: Sage Publications. Meirovich, G., & Romar, E. J. (2006). The difficulty in implementing TQM in higher
education instruction. Quality Assurance in Education, 14(4), 324-337. Milakovich, M. (1995). Improving Service Quality: Achieving High Performance in The
Public and Private Sectors, Delray Beach, Fl.: St: Lucie Press. Morgan, R. M., & Hunt, S. D. (1994). The Commitment-Trust Theory of Relationship
Marketing. Journal of Marketing, 58(3), 20-38. Oliver, R. L. (1980). A Cognitive Model of the Antecedents and Consequences of
Satisfaction Decisions. Journal of Marketing Research, 17(4), 460-469. Oliver, R. L., & DeSarbo, W. S. (1988). Response Determinants in Satisfaction
Judgments. The Journal of Consumer Research, 14(4), 495-507. Parasuraman, A., Berry, L. L., & Zeithaml, V. A. (1991). Perceived service quality as a
customer-based performance measure: an empirical examination of organizational barriers using an extended service quality model. Human Resource Management, 30(3), 335-364.
Parasuraman, A., Berry, L. L., & Zeithaml, V. A. (1991). Refinement and reassessment
of the SERVQUAL scale. Journal of Retailing, 67(4), 420-450. Parasuraman, A., Berry, L. L., & Zeithaml, V. A. (1991). Understanding customer
expectations of service. Sloan Management Review, 32(3), 39-48. Parasuraman, A., Zeithaml, V. A., & Berry, L. L. (1985). A Conceptual Model of Service
Quality and Its Implications for Future Research. Journal of Marketing, 49(4), 41-50.
Parasuraman, A., Zeithaml, V. A., & Berry, L. L. (1988). SERVQUAL: a multi-item
scale for measuring consumer perceptions of service quality. Journal of Retailing, 64(1), 12-40.
Plank, R., & Chiagouris, L. (1997). Perceptions of quality of higher education: An
exploratory study of high school guidance counsellors. Journal of Marketing for Higher Education, 8(1), 55-67.
Ramsden, P. (1991). A performance indicator of teaching quality in higher education:
The Course Experience Questionnaire. Studies in Higher Education, 16(2), 129-150.
118
Reichheld, F. F., & Sasser Jr, W. E. (1990). Zero defections: quality comes to services.
Harvard Business Review, 68(5), 105-111. Sallis, D. E. (2002). Total Quality Management in Education. Oxford, U.K.:
RoutledgeFalmer. Schneider, B., & White, S. S. (2004). Service Quality: Research Perspectives. Thousand
Oaks, CA: Sage Publications Inc. Seidman, I. (1998). Interviewing as qualitative research: a guide for researchers in
education and the social sciences (2nd ed.). New York , NY: Teachers College Press.
Senter, M.S., & Senter, R.Jr. (1998). A comparative study of traditional and nontraditional students’ identities and needs. NASPA Journal, 35, 270–280. Seymour, D. (1993). On Q: Causing quality in higher education. Phoenix, AZ: Oryx
Press. Seymour, D. (1993). Quality on Campus: Three Institutions, Three Beginnings. Change,
25(3), 14-27. Shank, M. D., Walker, M., & Hayes, T. (1995). Understanding professional service
expectations: do we know what our students expect in a quality education. Journal of Professional Services Marketing, 13(1), 71-89.
Sureshchandar, G. S., Rajendran, C., & Anantharaman, R. N. (2002). Determinants of
customer-perceived service quality: a confirmatory factor analysis approach. Journal of Services Marketing, 16(1), 9-34.
Swan, J. E., & Nolan, J. J. (1985). Gaining Customer Trust: A Conceptual Guide for the
Salesperson. Journal of Personal Selling and Sales Management, 5(2), 39-48. Tenner, A. R., & DeToro, I. J. (1992). Total Quality Management: Three Steps to
Continuous Improvement. Reading, MA: Addison-Wesley. Thomas, E. H., & Galambos, N. (2004). What Satisfies Students? Mining Student-
Opinion Data with Regression and Decision Tree Analysis. Research in Higher Education, 45(3), 251-269.
Tsutsui, W. M. (1996). W. Edwards Deming and the Origins of Quality Control in Japan.
Journal of Japanese Studies, 22(2), 295-325.
119
Watty, K. (2006). Want to Know About Quality in Higher Education? Ask an Academic. Quality in Higher Education, 12(3), 291-301.
Webster, C. (1989). Can consumers be segmented on the basis of their service quality
expectations? Journal of Services Marketing, 3(2), 35-53. Webster, C. (1991). Influences upon consumer expectations of services. Journal of
Services Marketing, 5(1), 5-17. Webster, C., & Hung, L. C. (1994). Measuring service quality and promoting decentring.
The TQM Magazine, 6(5), 50-55. Weisberg, H. F., Krosnick, J. A., & Bowen, B. D. (1989). An Introduction to Survey
Research and Data Analysis. San Francisco, CA: Scott Foresman & Co. Yi, Y. (1990). A Critical Review of Customer Satisfaction. Review of Marketing, 4, 68-
123. Zeithaml, V. A. (2000). Service Quality, Profitability, and the Economic Worth of
Customers: What We Know and What We Need to Learn. Journal of the Academy of Marketing Science, 28(1), 67.
Zeithaml, V. A., Berry, L. L., & Parasuraman, A. (1988). Communication and Control
Processes in the Delivery of Service Quality. Journal of Marketing, 52(2), 35-48. Zeithaml, V. A., Berry, L. L., & Parasuraman, A. (1993). The Nature and Determinants
of Customer Expectations of Service. Journal of the Academy of Marketing Science, 21(1), 1.
Zeithaml, V. A., Berry, L. L., & Parasuraman, A. (1996). The Behavioral Consequences
of Service Quality. Journal of Marketing, 60(2), 31-46. Zeithaml, V. A., & Bitner, M. J. (2006). Services marketing: integrating customer focus
across the firm. Boston, MA: McGraw-Hill. Zeithaml, V. A., Parasuraman, A., & Berry, L. L. (1990). Delivering quality service:
balancing customer perceptions and expectations. New York: Free Press. Zemsky, R., Wegner, G. R., & Massy, W. F. (2005). Remaking the American University:
Market-smart and Mission-centered: Rutgers University Press.

120
Appendices
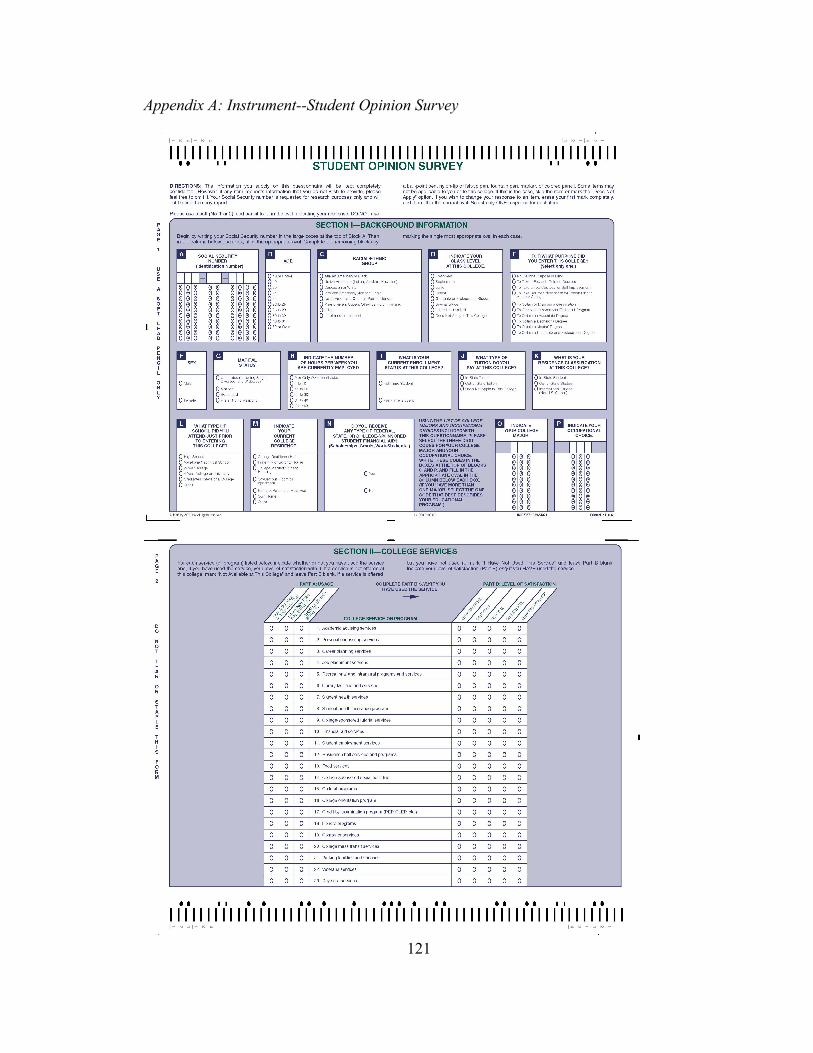
Appendix A: Instrument--Student Opinion Survey
121
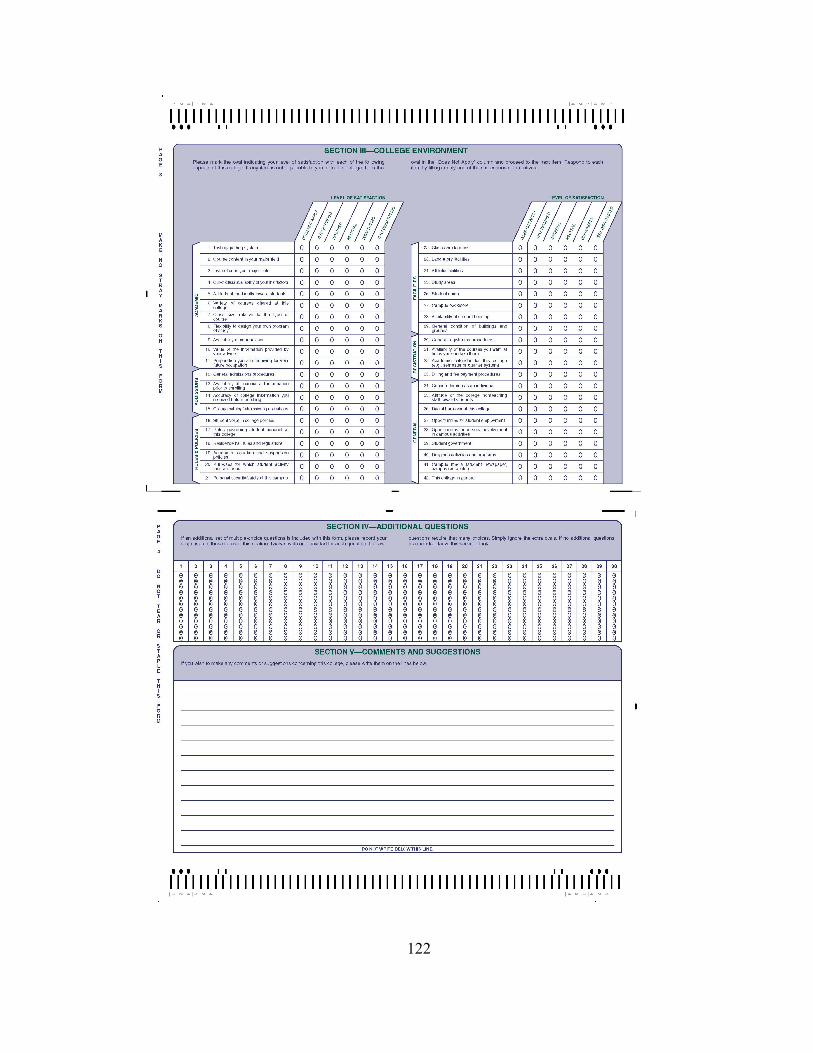
122
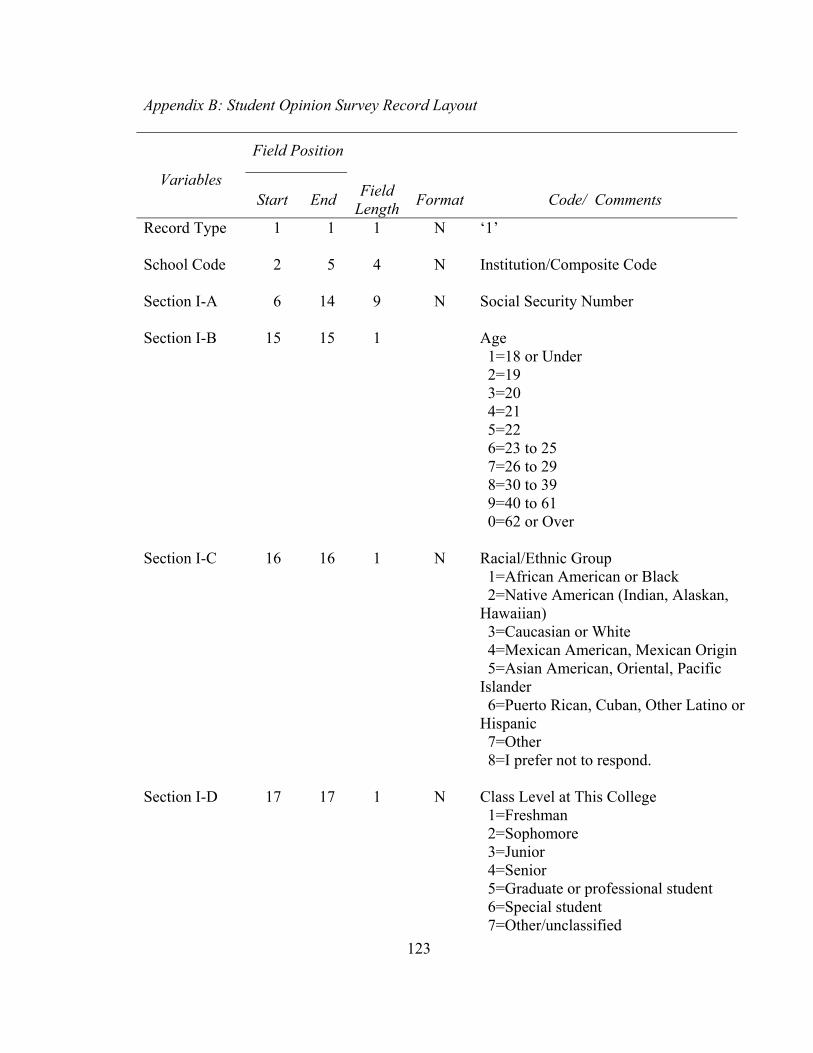
123
Appendix B: Student Opinion Survey Record Layout
Variables
Field Position
Start End Field Length Format Code/ Comments
Record Type 1 1 1 N ‘1’ School Code 2 5 4 N Institution/Composite Code Section I-A 6 14 9 N Social Security Number Section I-B 15 15 1 Age
1=18 or Under 2=19 3=20 4=21 5=22 6=23 to 25 7=26 to 29 8=30 to 39 9=40 to 61 0=62 or Over
Section I-C 16 16 1 N Racial/Ethnic Group
1=African American or Black 2=Native American (Indian, Alaskan, Hawaiian) 3=Caucasian or White 4=Mexican American, Mexican Origin 5=Asian American, Oriental, Pacific Islander 6=Puerto Rican, Cuban, Other Latino or Hispanic 7=Other 8=I prefer not to respond.
Section I-D 17 17 1 N Class Level at This College
1=Freshman 2=Sophomore 3=Junior 4=Senior 5=Graduate or professional student 6=Special student 7=Other/unclassified
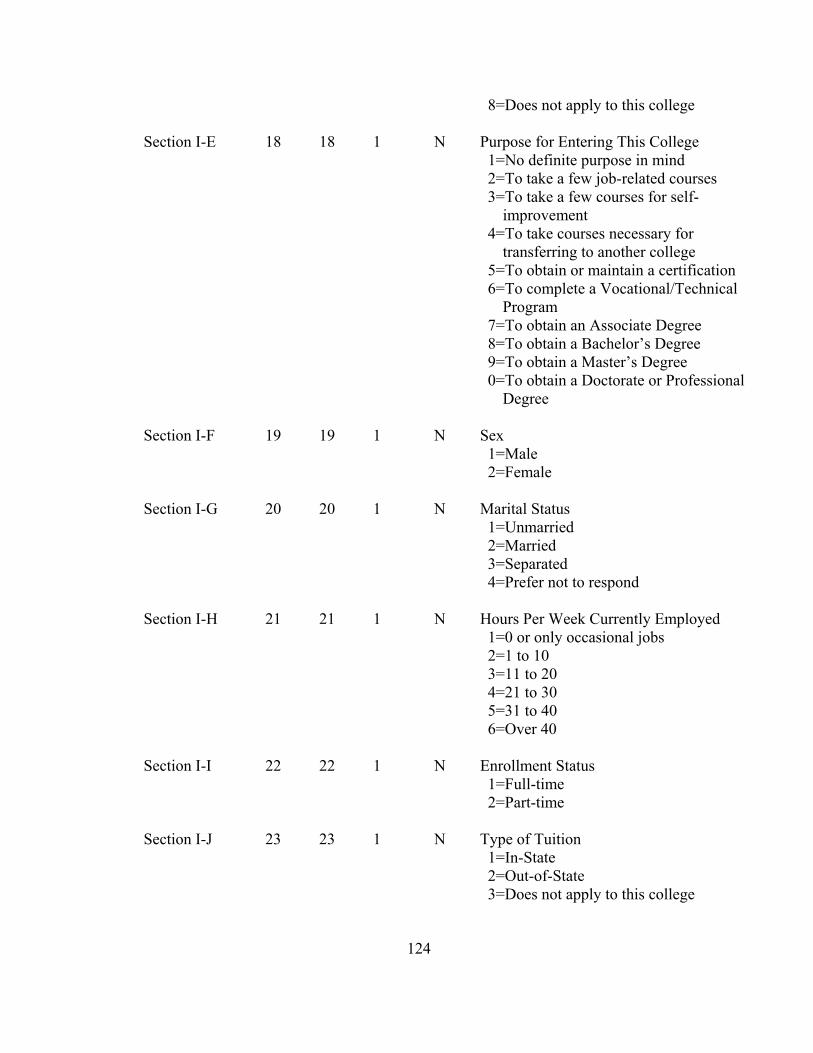
124
8=Does not apply to this college Section I-E 18 18 1 N Purpose for Entering This College
1=No definite purpose in mind 2=To take a few job-related courses 3=To take a few courses for self-
improvement 4=To take courses necessary for
transferring to another college 5=To obtain or maintain a certification 6=To complete a Vocational/Technical
Program 7=To obtain an Associate Degree 8=To obtain a Bachelor’s Degree 9=To obtain a Master’s Degree 0=To obtain a Doctorate or Professional
Degree Section I-F 19 19 1 N Sex
1=Male 2=Female
Section I-G 20 20 1 N Marital Status 1=Unmarried 2=Married 3=Separated 4=Prefer not to respond
Section I-H 21 21 1 N Hours Per Week Currently Employed
1=0 or only occasional jobs 2=1 to 10 3=11 to 20 4=21 to 30 5=31 to 40 6=Over 40
Section I-I 22 22 1 N Enrollment Status
1=Full-time 2=Part-time
Section I-J 23 23 1 N Type of Tuition
1=In-State 2=Out-of-State 3=Does not apply to this college
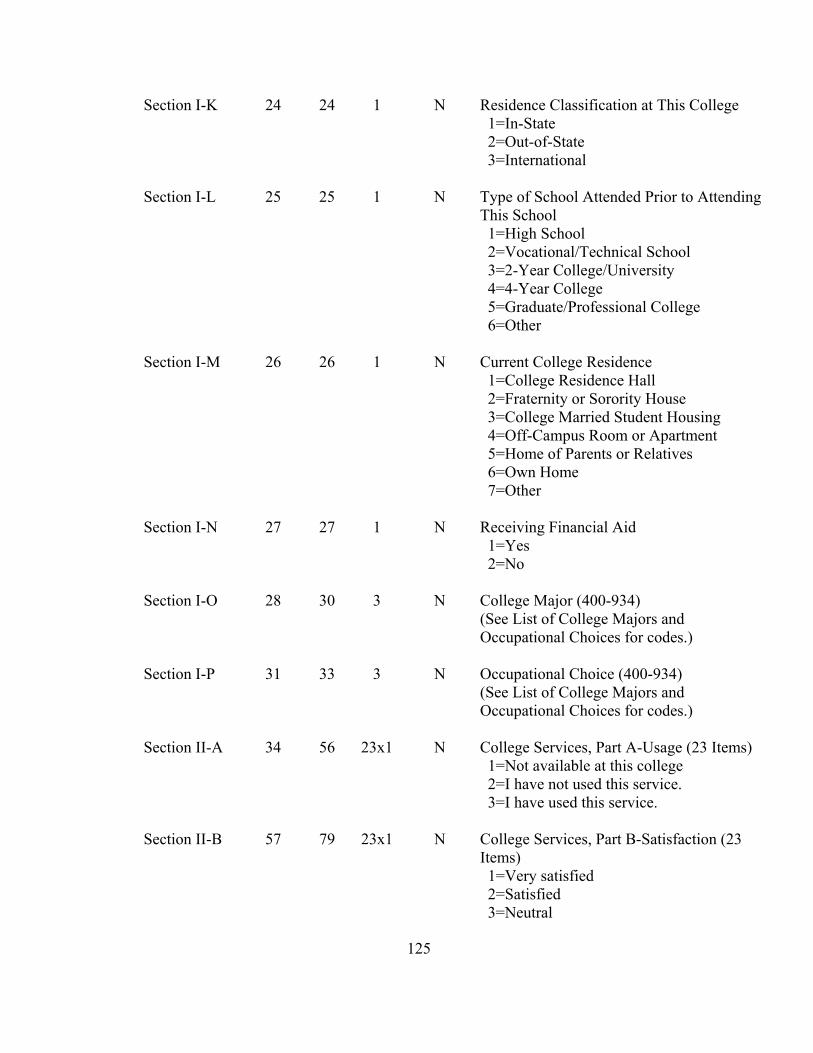
125
Section I-K 24 24 1 N Residence Classification at This College 1=In-State 2=Out-of-State 3=International
Section I-L 25 25 1 N Type of School Attended Prior to Attending
This School 1=High School 2=Vocational/Technical School 3=2-Year College/University 4=4-Year College 5=Graduate/Professional College 6=Other
Section I-M 26 26 1 N Current College Residence
1=College Residence Hall 2=Fraternity or Sorority House 3=College Married Student Housing 4=Off-Campus Room or Apartment 5=Home of Parents or Relatives 6=Own Home 7=Other
Section I-N 27 27 1 N Receiving Financial Aid
1=Yes 2=No
Section I-O 28 30 3 N College Major (400-934)
(See List of College Majors and Occupational Choices for codes.)
Section I-P 31 33 3 N Occupational Choice (400-934)
(See List of College Majors and Occupational Choices for codes.)
Section II-A 34 56 23x1 N College Services, Part A-Usage (23 Items)
1=Not available at this college 2=I have not used this service. 3=I have used this service.
Section II-B 57 79 23x1 N College Services, Part B-Satisfaction (23 Items) 1=Very satisfied 2=Satisfied 3=Neutral
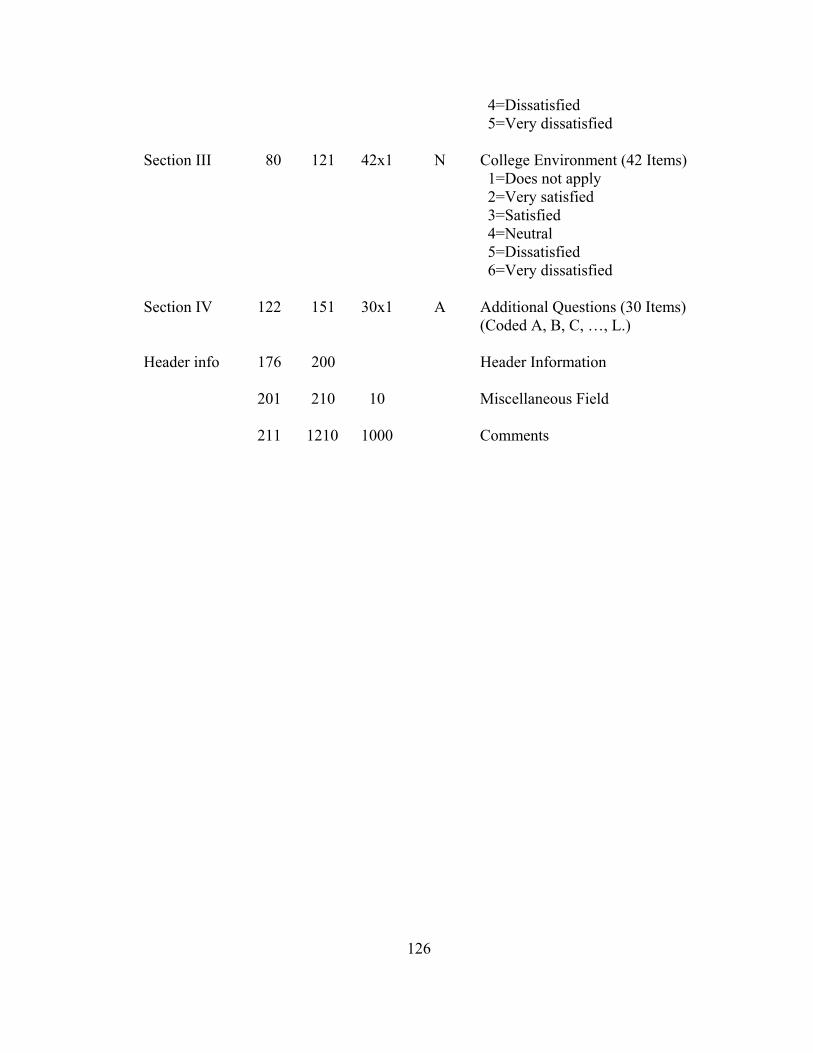
126
4=Dissatisfied 5=Very dissatisfied
Section III 80 121 42x1 N College Environment (42 Items)
1=Does not apply 2=Very satisfied 3=Satisfied 4=Neutral 5=Dissatisfied 6=Very dissatisfied
Section IV 122 151 30x1 A Additional Questions (30 Items)
(Coded A, B, C, …, L.) Header info 176 200 Header Information 201 210 10 Miscellaneous Field 211 1210 1000 Comments

127
Appendix C: Letter of Instruction
Dear (Target University)Student: Researchers at the (Target University) study many topics. To do this, we need the help of people who agree to take part in a research study. This form tells you about this research study. We are asking you to take part in a research study that is called “Measuring Service Quality in Higher Education.” The person who is in charge of this research study is Richard Kelso, a Ph.D. student and Principal Investigator, as part of his doctoral dissertation research. Other research staff may be involved and can act on behalf of the person in charge. The research will be done online. Purpose of the Study The purpose of this study is to examine student satisfaction with programs and services at (the target university). Your opinions are very important to us in assessing the quality of your educational experience at this University. Study Procedures If you take part in this study, you will be asked to take 15 minutes to share your opinions with us by taking the online survey referenced within this email. You have the alternative to choose not to participate in this research study. If while completing the survey, you decide you would like to stop the process and continue taking the survey at another time, your responses will be saved IF you have used the “CONTINUE” button at the end of each survey section you completed. Instructions for Completing the Survey Make a note of your password listed below. Copy the USER ID written below in order to log on to the Student Opinion Survey. Click on the link below to go to the ACT web site. Paste the USER ID into the appropriate space and enter the password. Click the "SUBMIT" button to proceed to the survey. Benefits and Risks We don’t know if you will get any benefits by taking part in this study. There are no known risks to those who take part in this study. Compensation
128
We will not pay you for the time you volunteer while being in this study. Confidentiality We must keep your study records confidential. Your responses will be kept encrypted on the Principle Researchers personal computer for three years; however certain people may need to see your study records. By law, anyone who looks at your records must keep them completely confidential. The only people who will be allowed to see these records are:
• The research team, including the Principal Investigator, study coordinator, and all other research staff.
• Certain government and university people who need to know more about the study. (For example, individuals who provide oversight on this study may need to look at your records. This is done to make sure that we are doing the study in the right way. They also need to make sure that we are protecting your rights and your safety.) These include the (Target University) Institutional Review Board (IRB) and the staff that work for the IRB. Other individuals who work for (the target university) that provide other kinds of oversight may also need to look at your records.
• We may publish what we learn from this study. If we do, we will not let anyone
know your name. We will not publish anything else that would let people know who you are.
Voluntary Participation / Withdrawal You should only take part in this study if you want to volunteer. You should not feel that there is any pressure to take part in the study, to please the investigator or the research staff. You are free to participate in this research or withdraw at any time. There will be no penalty or loss of benefits you are entitled to receive if you stop taking part in this study. As a student, the decision to participate or not participate will not affect your student status (course grade). New information about the study During the course of this study, we may find more information that could be important to you. This includes information that, once learned, might cause you to change your mind about being in the study. We will notify you as soon as possible if such information becomes available. Questions, concerns, or complaints
129
If you have any questions, concerns or complaints about this study, call Richard Kelso at (principle investigators telephone). If you have questions about your rights as a participant in this study, general questions, or have complaints, concerns or issues you want to discuss with someone outside the research, call the Division of Research Integrity and Compliance of the (target university) at (Division of Research Integrity and Compliance telephone). If you experience an adverse event or unanticipated problem, please call Richard Kelso at (principle investigators telephone). Consent to Take Part in this Research Study It is up to you to decide whether you want to take part in this study. If you want to take part, please complete the online survey following the link above. In so doing, you acknowledge that you freely give your consent to take part in this study and understand that you are agreeing to take part in the research. Please print a copy of this form to take with you, Thank you again for your participation! Sincerely, Richard S. Kelso Principle Investigator

Appendix D: List of College Majors and Occupational Choices
130

131
About the Author
Richard S. (Rick) Kelso received a Bachelor of Science (BS) Degree in
Economics from The University of Florida, and a Masters in Business Administration
(MBA) from the University of South Florida.
Following a successful business career with IBM, Achieve Global, DDI, and after
building several small businesses, Rick began a second career in higher education.
He has served as an adjunct faculty member at the University of South Florida
teaching strategic and human resource management courses, where he also worked with
the offices of the Provost and Chief Financial Officer. He also served as an adjunct
faculty member at Florida Southern College where he taught finance, investment, and
statistics courses.