Embed Size (px)
Citation preview

Measuring the ttbb production cross-section with 8 TeV ATLAS data
Spyros Argyropoulos(supervised by J. Katzy)
DPG Wuppertal9/3/2015

Measuring ttbb
Strategy:• Aim for simplicity and robustness: cut-and-count method• Minimize complexity by choosing a clean final state• use as much information from data as possible
➡ MC-to-data correction factors derived from in-situ measurements➡ measure cross section in regions with significantly different S/B
• Minimize extrapolations➡ measure in a fiducial region close to the experimental acceptance
4 b-jets - 2 leptons
2
Several reasons to measure ttbb:1. it’s the dominant irreducible background for ttH(bb),
also background for other physics searches 2. theoretical predictions suffer from large
uncertainties σ = O(αs4)3. it can give access to g → bb splitting (constraints
from LEP/SLC at the 25-30% only)
Overview
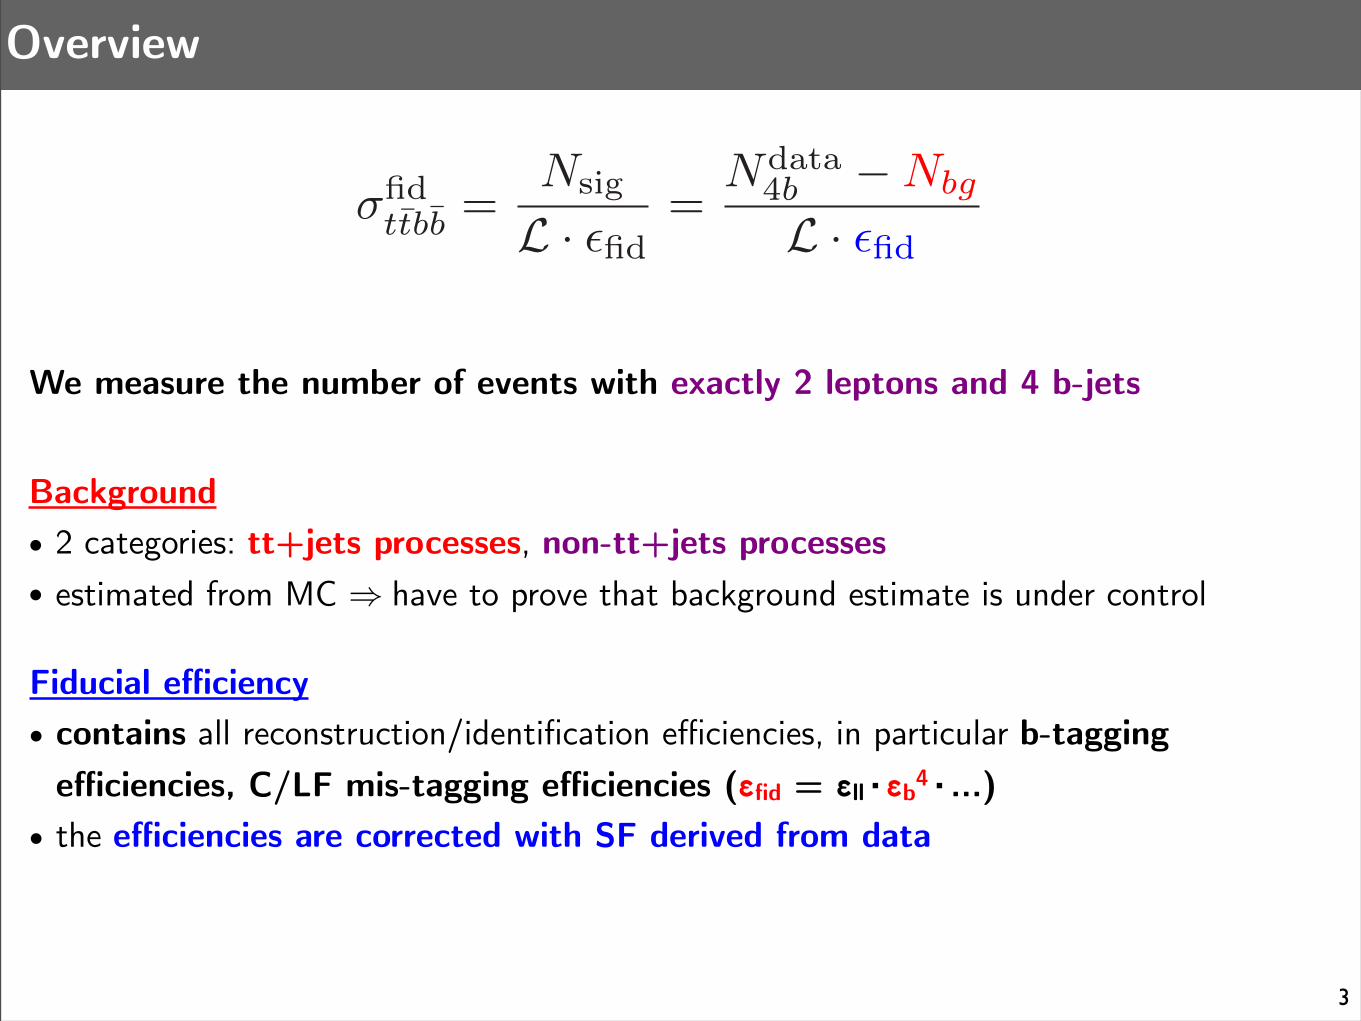
Background• 2 categories: tt+jets processes, non-tt+jets processes• estimated from MC ⇒ have to prove that background estimate is under control
Fiducial efficiency• contains all reconstruction/identification efficiencies, in particular b-tagging
efficiencies, C/LF mis-tagging efficiencies (εfid = εll·εb4·...)• the efficiencies are corrected with SF derived from data
We measure the number of events with exactly 2 leptons and 4 b-jets
3
σfidtt̄bb̄ =
Nsig
L · �fid=
Ndata4b −Nbg
L · �fid

4
tt+jets background
Dominant background comes from tt+jets processes:
(i) mis-tagged (ii) non-fiducial
The non-fiducial background comes from the same underlying partonic process as ttbb, so we want to scale it with the signal:
=⇒ σfidtt̄bb̄ =
�Ndata
4b −Nmis−taggedtt̄+jets −Nnon−tt̄+jets
bg
�fsig
L · �fid
σfidtt̄bb̄ =
�Nsig +Nnon−fiducial
tt̄bb̄
�fsig
L · �fid=⇒
�Ndata
4b = Nsig +Nnon−fiducialtt̄bb̄
+Nmis−taggedtt̄+jets +Nnon−tt̄+jets
bg
�
fsig ≡ Nsig
Nsig +Nnon−fiducialtt̄bb̄

Powheg+Pythia (AFII) - nominal
Powheg+Pythia (GEANT4)damp
Powheg+Pythia h
Powheg+Herwig
MadGraph+Pythia
MadGraph+Pythia (Q2 up)
MadGraph+Pythia (Q2 down)
sig
f
0.50.550.6
0.650.7
0.750.8
0.850.9
0.951
ATLAS Internal
Reconstructed in Signal Region Fiducial
Mis-tagged and non-fiducial background
5
non-fid
ucial
mis-tagged
Signal
σfidtt̄bb̄ =
�Ndata
4b −Nmis−taggedtt̄+jets −Nnon−tt̄+jets
bg
�fsig
L · �fid
other bg
Signal regionSignal regionData 37
MC (Signal+Bg) 28.6 +7.4 -5.2
Non-fiducial 7.8 +3.5 -2.9
Mis-tagged 3.5 +1.6 -2.0
Other bg 1.3 +1.1 -0.9
work in progress
Simulation√s = 8 TeV
How can we validate our background estimate using data?
6
highest jet MV1c scoreth4
80%-70% 70%-60% 60%-50% 50%-0%
[fb]
fidbbtt!
0
5
10
15
20
25
30
35
Fixe
d B
kg /
Dat
a
0
0.1
0.2
0.3
0.4
0.5
0.6
0.7
0.8
ATLAS Internal
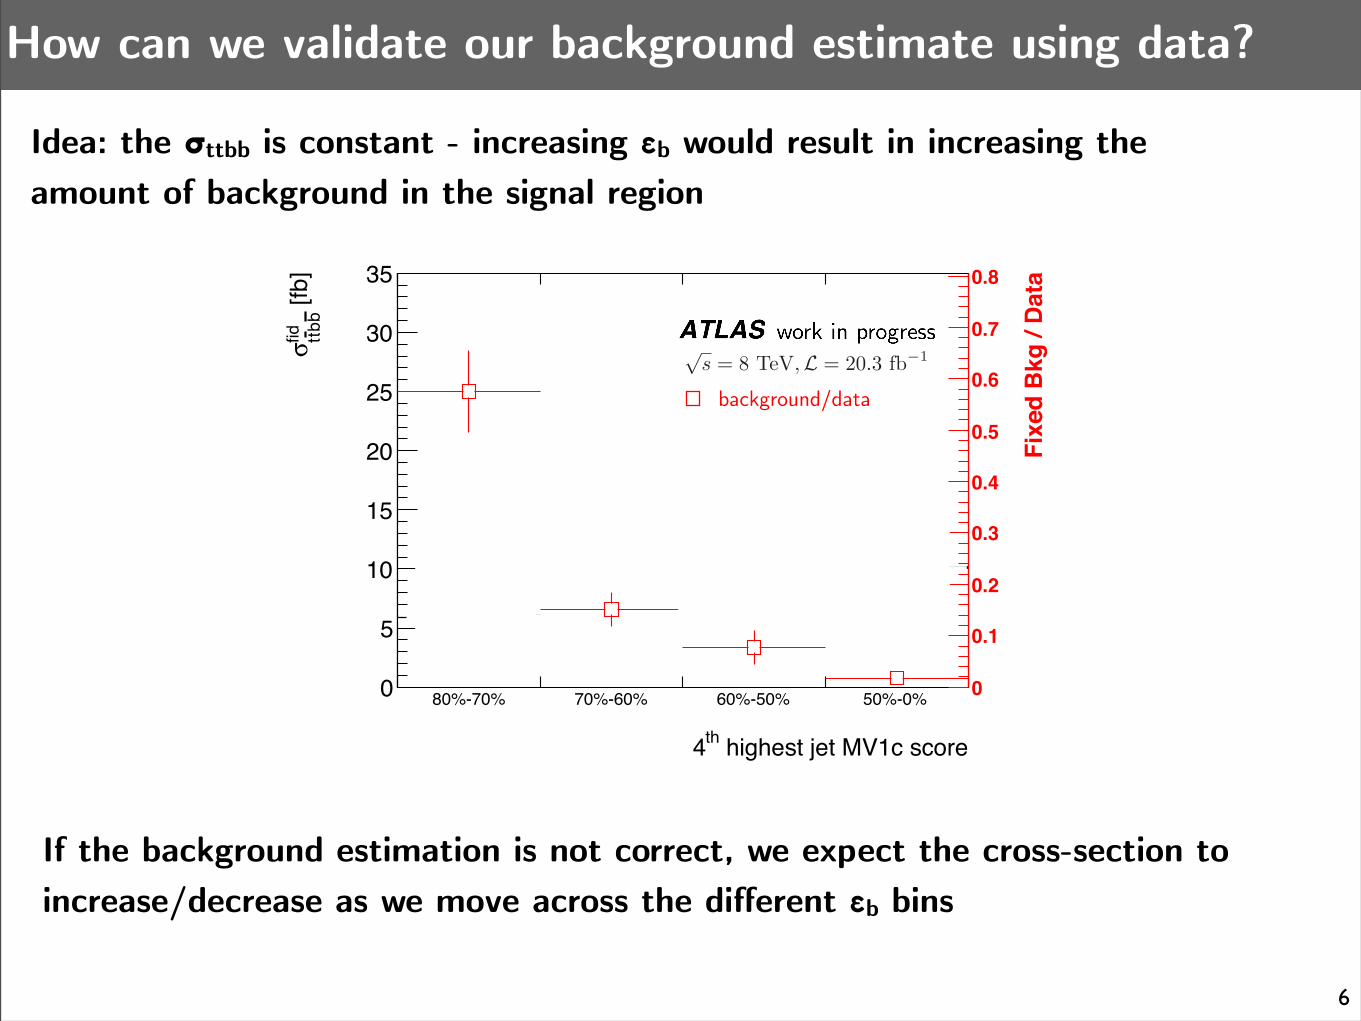
Idea: the σttbb is constant - increasing εb would result in increasing the amount of background in the signal region
If the background estimation is not correct, we expect the cross-section to increase/decrease as we move across the different εb bins
background/data
√s = 8 TeV,L = 20.3 fb−1

Validation of background estimate
• no trend appearing across MV1/MV1c points• background estimation procedure seems to work well
7
highest jet MV1c scoreth4
80%-70% 70%-60% 60%-50% 50%-0%
[fb]
fidbbtt!
0
5
10
15
20
25
30
35
Fixe
d B
kg /
Dat
a
0
0.1
0.2
0.3
0.4
0.5
0.6
0.7
0.8
ATLAS Internal
Idea: the σttbb is constant - increasing εb would result in increasing the amount of background in the signal region
background/data
Measured cross-section
√s = 8 TeV,L = 20.3 fb−1

Control distributions - Leading b-jets
• data prefer softer lepton/leading jet spectra than nominal MC (known issue)• data/MC disagreement covered by modeling uncertainties
8
work in progress
-3 -2 -1 0 1 2 3
Even
ts-110
1
10
210
310
410
510
610ATLAS Internal
Data inclusivettVtt
Single TopZ+jetsDibosonsHtt
!2nd b-jet -3 -2 -1 0 1 2 3
Dat
a/M
C
0.5
1
1.5
0 50 100 150 200 250 300
Even
ts
1
10
210
310
410ATLAS Internal
Data inclusivettVtt
Single TopZ+jetsDibosonsHtt
[GeV]T
2nd b-jet p0 50 100 150 200 250 300
Dat
a/M
C
0.5
1
1.50 50 100 150 200 250 300
Even
ts
210
310
410
ATLAS InternalData inclusivettVtt
Single TopZ+jetsDibosonsHtt
[GeV]T
1st b-jet p0 50 100 150 200 250 300
Dat
a/M
C
0.5
1
1.5
-3 -2 -1 0 1 2 3
Even
ts
-110
1
10
210
310
410
510
610ATLAS Internal
Data inclusivettVtt
Single TopZ+jetsDibosonsHtt
!1st b-jet -3 -2 -1 0 1 2 3
Dat
a/M
C
0.5
1
1.5
work in progresswork in progress
work in progress work in progress
√s = 8 TeV
L = 20.3 fb−1

Control distributions - additional b-jets
• Powheg+Pythia gives slightly softer additional b-jets than what’s observed in data- in Powheg+Pythia additional b-jets only come from the shower ⇒ valid only in soft/
collinear limit• More events in data with 4 b-jets than in MC • Generators which include matrix elements for ttbb seem to offer a better description of
the pT spectra and of the b-jet multiplicity 9
0 1 2 3 4 5 6 7
Even
ts
-210
-110
1
10
210
310
410
510
610ATLAS Internal
Data inclusivettVtt
Single TopZ+jetsDibosonsHtt
N b-jets0 1 2 3 4 5 6 7
Dat
a/M
C
0.5
1
1.5
0 50 100 150 200 250 300
Even
ts
-110
1
10
210
310ATLAS Internal
Data inclusivettVtt
Single TopZ+jetsDibosonsHtt
[GeV]T
3rd b-jet p0 50 100 150 200 250 300
Dat
a/M
C
0.5
1
1.5 0 20 40 60 80 100 120 140
Even
ts
-210
-110
1
10
210ATLAS Internal
Data inclusivettVtt
Single TopZ+jetsDibosonsHtt
[GeV]T
4th b-jet p0 20 40 60 80 100 120 140
Dat
a/M
C
0.5
1
1.5
-3 -2 -1 0 1 2 3
Even
ts
-210
-110
1
10
210
310
410
510ATLAS Internal
Data inclusivettVtt
Single TopZ+jetsDibosonsHtt
!3rd b-jet -3 -2 -1 0 1 2 3
Dat
a/M
C
0.5
1
1.5 -3 -2 -1 0 1 2 3
Even
ts
-210
-110
1
10
210
310 ATLAS InternalData inclusivettVtt
Single TopZ+jetsDibosonsHtt
!4th b-jet -3 -2 -1 0 1 2 3
Dat
a/M
C
2
4
work in progress
work in progresswork in progress
work in progress work in progress
√s = 8 TeV
L = 20.3 fb−1

Uncertainties
Uncertainty source Effect on σ
Modeling 23%
Generator 18%
Scale/ISR/FSR 13%
Detector simulation 6%
Shower/Hadronization 4%
PDF 1%
Detector systematics +18% -14%b-tagging +15% -13%
Jet reconstruction +8% -6%
Statistical uncertainty 19%
Luminosity 3%
Total uncertainty +36% -34%
10
• dominant uncertainty are due to modeling
• dominant systematic from detector performance is from b-tagging
Powheg+Pythia (AFII) - nominal
Powheg+Pythia (GEANT4)damp
Powheg+Pythia h
Powheg+Herwig
MadGraph+Pythia
MadGraph+Pythia (Q2 up)
MadGraph+Pythia (Q2 down)
[fb]
fidbbtt!
5
10
15
20
25 ATLAS Internalwork in progress√s = 8 TeV,L = 20.3 fb−1

Result
• measurement compared to MadGraph5_aMC@NLO + Pythia8
• NLO calculation of ttbb using massive b-quarks
• Scales: μ = mtop1/2(pT(b)pT(bbar))1/4
11
[fb]bbttfid!
5 10 15 20 25 30 35 40
ATLAS InternalData
MG5_aMC@NLO+Pythia8
work in progress
Results• σttbbfid,measured = 12.9 +4.6 -4.4 fb (including ttH/ttZ in signal)• σttbbfid,measured = 12.1 ± 4.6 fb (subtracting ttH/ttZ from signal)• σttbbfid,theory = 14.3 +7.2 -4.8 fb
The measured cross-section agrees with NLO QCD calculations

Summary and outlook
12
• ttbb: difficult but interesting• measurement uncertainties are competitive with theory uncertainties• dominant uncertainties: modeling (23%), statistics (19%), b-tagging (15%)• Result is consistent with NLO QCD calculations
Outlook• improving the modeling uncertainties ⇐ better theory models (e.g. NLO ttbb, NLO
merged tt+jets samples etc)• statistics will be increased in Run 2• b-tagging uncertainty could be reduced by including more constraints from data (e.g.
more control regions can be included in a template fit)

Backup

• calculated with all MC that correspond to the different variations considered for the modeling uncertainty
• differences between models taken into account in the calculation of the cross-section
Fiducial efficiency
�fid =N reco&fid
NfidFiducial
Reco
14
Powheg+Pythia (AFII) - nominal
Powheg+Pythia (GEANT4)damp
Powheg+Pythia h
Powheg+Herwig
MadGraph+Pythia
MadGraph+Pythia (Q2 up)
MadGraph+Pythia (Q2 down)
[%]
fid!
24
68
101214
161820
ATLAS InternalSimulation
work in progress
√s = 8 TeV

Selecting the signal sample
Objects usedObjects used
Electrons • pT > 25 GeV, |η| < 2.47 • excluding 1.37 < |η| < 1.52
Muons • pT > 25 GeV, |η| < 2.5
Jets • Anti-kT R=0.4, pT > 25 GeV, |η| < 2.5
b-tagging • MV1 algorthm (70% efficiency)• diffent WP and MV1c were used for cross-checks•
Event pre-selection
single lepton triggers
exactly 2 opposite sign leptons
di-lepton mass cut: Mll > 15 GeV and |Mll - 90GeV| > 10 GeV (for ee,μμ events)
at least 2 b-tagged jets
Signal Region: exactly 4 b-jets
Fiducial volume
exactly 2 opposite sign leptons
di-lepton mass cut
veto events with ΔR(lepton,jet) < 0.4
exactly 4 particle b-jets
15

16
The full story
Denner, Feger, Scharf [1412.5290]
Non-resonant
O(α3sα) O(α2
sα2) O(αsα
3)
ttbb
O(α2sα
2) O(αsα3) O(α4)
ttH
O(αsα3) O(αsα
3) O(α4)

17
The full story
Denner, Feger, Scharf [1412.5290]
Interferenceincluded
• total cross-section for pp → l+vl jj bbbb 8% higher than pp → ttbb• pure EW production negligible• Non-resonant contribution small < 2%• Mixed QCD/EW terms significant• Destructive interference ∼5%

18
ttbb production - QCD and EW
Denner, Feger, Scharf [1412.5290]
Interferenceincluded
• pure EW production negligible• Mixed QCD/EW terms significant (∼40%)• Destructive interference ∼4%

19
ttbb production (resonant part only)
Denner, Feger, Scharf [1412.5290]
O(α2sα
2) O(αsα3)
Interferenceincluded
63% of total2 Wt vertices
probability for bottomnesschanging interaction:
1-0.9992 = 0.2%
37% of total4 Wt vertices
probability for bottomnesschanging interaction:
1-0.9994=0.4%
Total probability for bottomness changing interaction (e.g. incl. probability to have ttb+X) = 0.3%
What we assume:- Bottomness of proton is 0- QCD conserves bottomness- only EW interactions can produce an odd number of b

20
g→bb splitting kernels
dPg→qq̄ ∝ αs(Q2)
2π
1
2
�z2 + (1− z)2
�dz
Parton showers usually provide massless splitting kernels:
In Pythia8 mass dependence can be included:
dPg→QQ̄ ∝ αs(Q2)
2π
βQ
2
�z2 + (1− z)2+2(1− β2
Q)z(1− z)�dz
Several options in Pythia - TimeShower:weightGluonToQuark• 1 (default): neglect mass ⇒ low splitting probability in threshold region• 2: include mass dependence • 3: “DGLAP form” ⇒ high splitting probability out to large masses (upper bound) • 4: “ME form” ⇒ like 3 but with a phase-space suppression factor (lower bound)• 5-8: like 1-4 but using αs(m2) instead of αs(pT2)
Preliminary studies with MadGraph5_aMC@NLO+Pythia8 indicate a factor of 2 difference between the default and most extreme scenarios!This is still within the uncertainties of the measurement though.

R(jet,jet)!min0 1 2 3 4 5
b"
00.10.20.30.40.50.60.70.80.9
1
ATLAS Internal(35,40) GeV"Tp
(1.2,1.6)"#Top b-jetsOther b-jets
21
εb - what does it depend on?
tb
W
gb
b
• εfid ∝ εb4 ⇒ make sure that the b-tagging efficiency is under control
1. correction factors derived from tt events with exactly 2 b-jets
➡ can we rely on these SF for b-jets that come from gluon splittings?
2. correction factors derived from tt events where b-jets are back-to-back ⇒ b-jets usually contain only 1 B hadron
➡ can the same SF be used for b-jets with multiple B hadrons?
[GeV]T
p0 50 100 150 200 250 300 350 400
b!
00.1
0.20.30.40.5
0.60.70.8
0.91
=(67.3 +- 0.5)%b!Jets with 1 B =(69.0 +- 2.4)%b!Jets with at least 2 B


![Angbatssang [TTBB] - O. Lindblad](https://img.dokumen.tips/doc/110x75/55cf862c550346484b95042f/angbatssang-ttbb-o-lindblad.jpg)