Embed Size (px)
Citation preview

International Telecommunication UnionTelecommunication Development Bureau
Place des NationsCH-1211 Geneva 20
Switzerland
www.itu.int
Printed in SwitzerlandGeneva, 2014
Photo credits: Shutterstock
9 7 8 9 2 6 1 1 5 3 3 1 1
ISBN 978-92-61-15331-1
Measuring the Information
Society Report2014
Executive Summary
Mea
surin
g th
e In
form
atio
n So
ciet
y Re
port
201
4 –
Exe
cutiv
e Su
mm
ary

Measuring the Information Society Report
2014
Executive Summary

© 2014 ITU International Telecommunication Union
Place des Nations CH-1211 Geneva Switzerland
Original language of publication: English.
All rights reserved. No part of this publication may be reproduced, stored in a retrieval system, or transmitted in any form or by any means, electronic, mechanical, photocopying, recording, or otherwise, without the prior permission of the
International Telecommunication Union.
ii

ForewordI am pleased to present to you the 2014 edition of the Measuring the Information Society Report. Now in its sixth year, this annual report identifies key information and communication technology (ICT) developments and tracks the cost and affordability of ICT services, in accordance with internationally agreed methodologies. Its core feature is the ICT Development Index (IDI), which ranks countries’ performance with regard to ICT infrastructure, use and skills. The report aims to provide an objective international performance evaluation based on quantitative indicators and benchmarks, as an essential input to the ICT policy debate in ITU Member States.
Over the past year, the world witnessed continued growth in the uptake of ICT and, by end 2014, almost 3 billion people will be using the Internet, up from 2.7 billion at end 2013. While the growth in mobile-cellular subscriptions is slowing as the market reaches saturation levels, mobile broadband remains the fastest growing market segment, with continuous double-digit growth rates in 2014 and an estimated global penetration rate of 32 per cent – four times the penetration rate recorded just five years earlier. International bandwidth has also grown steeply, at 45 per cent annually between 2001 and 2013, and the developing countries’ share of total international bandwidth increased from around 9 per cent in 2004 to almost 30 per cent in 2013. Overall, almost all of the 166 countries included in the IDI improved their values in the last year.
Despite this encouraging progress, there are important digital divides that need to be addressed: 4.3 billion people are still not online, and 90 per cent of them live in the developing world. Fixed-broadband penetration stands at 6 per cent in developing countries, compared with 27.5 per cent in developed countries, and growth rates are slowing. Mobile broadband is growing fast, but the difference between developed and developing regions remains large, with 84 per cent penetration in the former as against 21 per cent in the latter. Increasing ICT uptake in the world’s least connected countries (LCCs), which are home to some 2.5 billion people, should therefore be the policy focus for the years to come. In these countries, the share of population living in rural areas is often high, reinforcing the urban-rural digital divide. As this report finds, ICT performance is better in countries with higher shares of the population living in urban areas, where access to ICT infrastructure, usage and skills is more favourable. Yet it is precisely in poor and rural areas where ICTs can make a particularly significant impact. New analysis featured in this report shows that many of the indicators of the Millennium Development Goals (MDGs) show significant correlation with the IDI, notably those related to poverty reduction and health improvement. Furthermore, the report finds that progress in ICT development is linked to progress in achieving some of the MDGs, yet another testimony to the role of ICT as a development enabler.
One reason for the limited uptake of ICT in the developing world is the price of the service, which is often unaffordable for poor segments of the population. While the prices of fixed and mobile services continue to decrease globally, in most developing countries the cost of a fixed-broadband plan represents more than 5 per cent of GNI per capita, and mobile broadband is six times more affordable in developed countries than in developing countries. Income inequalities within countries are one of the reasons why broadband – in particular fixed broadband – remains unaffordable to large segments of the population. The report finds that in 40 per cent of countries a basic fixed-broadband
iii

subscription still represents more than 5 per cent of household income for over half of the population. For these income groups, mobile broadband may be the affordable alternative.
An enabling telecommunication regulatory environment can significantly influence the affordability of services. The report finds that the price of ICT services falls with better market regulation and increased competition. For example, in developing countries, fixed-broadband prices could be reduced by 10 per cent and mobile-cellular prices by 5 per cent if competition and/or the regulatory framework improved. International regulatory best practices, such as the ones adopted by the ITU Global Symposium for Regulators (GSR), may serve as a guideline for effective regulatory frameworks which can lay the foundations for affordable fixed-broadband services.
In this fast-changing digital era, one of the key challenges in measuring the information society is the lack of up-to-date data, in particular in developing countries. ITU is joining the international statistical community in looking into ways of using new and emerging data sources – such as those associated with big data – to better provide timely and relevant evidence for policy-making. Calls for a “data revolution” are prominent in the international debates around the post-2015 development agenda, and ICTs have an important role to play in view of their capacity to produce, store and analyse huge amounts of data, as well as being a major source of big data in their own right. Big data from mobile operators, for example, are real-time and low-cost and have one of the greatest development potentials in view of the widespread use and availability of mobile networks and services. This report provides the reader with a comprehensive and critical overview of the role of big data from the telecommunication sector, for use in social and economic development policy and for monitoring the future information society.
I trust that the data and analysis contained in this report will be of great value to the ITU membership, including policy-makers, the ICT industry and others working towards building an inclusive global information society.
Brahima Sanou Director
Telecommunication Development Bureau (BDT) International Telecommunication Union

AcknowledgementsThe 2014 edition of the Measuring the Information Society Report was prepared by the ICT Data and Statistics Division within the Telecommunication Development Bureau of ITU. The team included Susan Teltscher (Head of Division), Esperanza Magpantay, Vanessa Gray, Ivan Vallejo, Lisa Kreuzenbeck and Ola Amin. The following consultants to ITU provided substantive inputs: Pantelis Koutroumpis (Chapter 4) and Sriganesh Lokanathan (Chapter 5). André Wills, Fernando Callorda and Zhazna Zuhely contributed to the compilation of datasets on prices, and Michael Minges to the compilation of data on international bandwidth, revenue and investment. Helpful inputs and suggestions were received from Joan Calzada Aymerich from the University of Barcelona (Chapter 4), Jake Kendall from the Gates Foundation, Anoush Tatevossian and Alex Rutherford from UN Global Pulse, and Tommy van der Vorst and Reg Brennenraedts from Dialogic (Chapter 5). The following ITU colleagues also made insightful comments: Martin Adolph, Nikolaos Volanis, Phillippa Biggs, Youlia Lozanova, Nancy Sundberg and Chelsea Silva Mori. The work was carried out under the overall direction of Cosmas Zavazava, Chief, Project Support and Knowledge Management Department, Telecommunication Development Bureau.
The report includes data from Eurostat, OECD, IMF, Informa, the UNESCO Institute for Statistics, the United Nations Population Division and the World Bank, which is greatly acknowledged.
ITU also appreciates the cooperation of countries that have provided data included in this report.
The report was edited by Anthony Pitt and Bruce Granger, ITU English Translation Section. The desktop publishing was carried out by Nathalie Delmas, and the cover was designed by Jesus Vicente. Administrative support was provided by Herawasih Yasandikusuma.
v

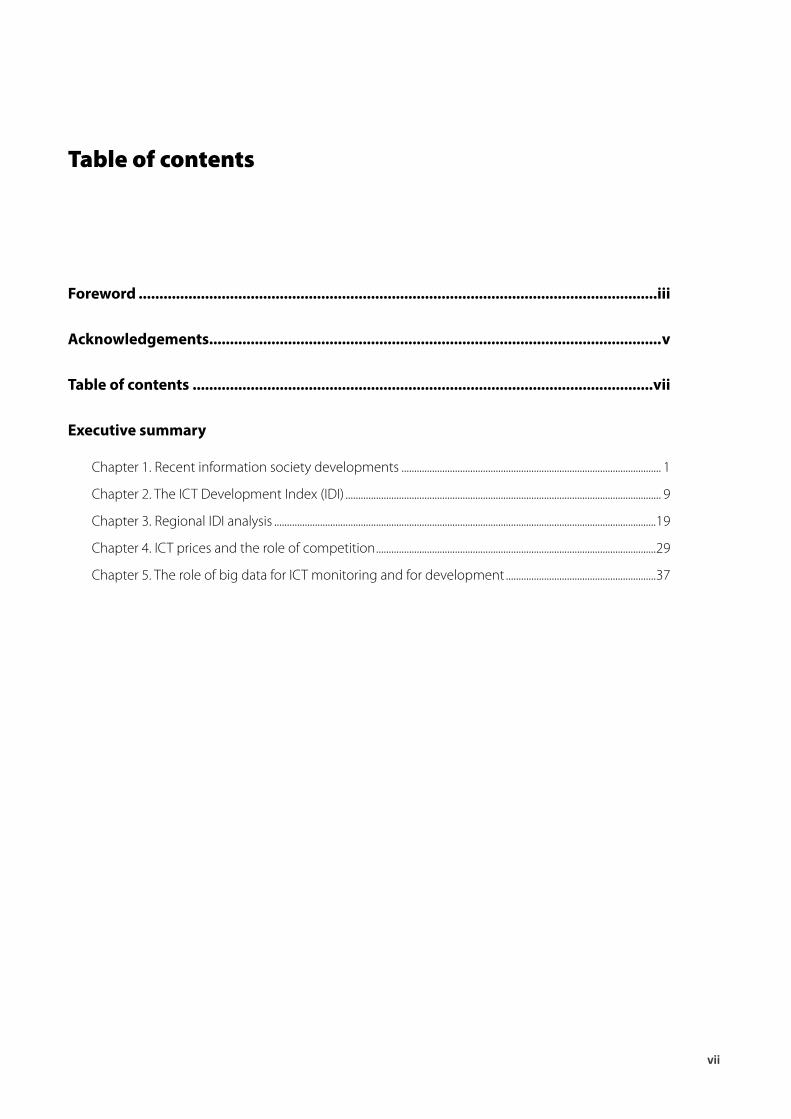
Table of contents
Foreword .............................................................................................................................iii
Acknowledgements .............................................................................................................v
Table of contents ...............................................................................................................vii
Executive summary
Chapter 1. Recent information society developments ...................................................................................................... 1
Chapter 2. The ICT Development Index (IDI) ............................................................................................................................ 9
Chapter 3. Regional IDI analysis ......................................................................................................................................................19
Chapter 4. ICT prices and the role of competition ..............................................................................................................29
Chapter 5. The role of big data for ICT monitoring and for development ...........................................................37
vii


1
Measuring the Information Society Report 2014
Chapter 1. Recent information society developments
In 2014, global growth in mobile penetration will slow to a ten-year low of 2.6 per cent, as the market reaches saturation levels, with almost 7 billion subscriptions
In line with the trend observed in recent years, fixed telephony is on the decline in all regions of the world. Fixed-telephone penetration decreased by about 2 per cent globally in the past year, and is set to drop to its lowest level in 14 years – lower than at the turn of the century – with an estimated 1.1 billion subscriptions by end 2014. The decline in fixed-telephone subscriptions over the past decade was accompanied by strong growth in the mobile-cellular market until 2010, at which point mobile-cellular growth rates dropped to single digits; and they have continued to slow down since then. In 2014, global growth in mobile penetration will slow to a ten-year low of 2.6 per cent, as the market reaches saturation levels, in particular in developed countries, where penetration will reach 121 per cent. By end 2014, there will be almost as many mobile-cellular subscriptions (6.9 billion) as people on Earth, more than three quarters of them (5.4 billion) in the developing world and more than half (3.6 billion) in the Asia-Pacific region.
Digital divides still exist, and some people are still excluded from access to mobile communication networks
Despite very high penetration levels of mobile-cellular subscriptions, some people are still excluded from access to mobile services. Even though rural population coverage for mobile-cellular services is very high, at 87 per cent globally, at end 2012 around 450 million people worldwide still lived out of reach of a mobile signal. Furthermore, high mobile-cellular penetration does not imply that everyone owns or is using a mobile phone. For countries where data are available, the number of mobile subscriptions far exceeds the number of mobile phone users: according to GSMA estimates, unique mobile subscribers account for about half of mobile-cellular subscriptions, which would translate into a penetration rate of around 48 per cent globally, 63 per cent in developed countries, 45 per cent in developing countries and 30 per cent in least developed countries (LDCs).
While fixed-broadband uptake in developed countries is reaching mature levels, it has not (yet) materialized in least developed countries

Executive Summary
2
In 2014, the number of fixed-broadband subscriptions will reach a total of 711 million globally, corresponding to a penetration rate of almost 10 per cent, as against 220 million and 3.4 per cent in 2005. Distinct patterns can be observed, though, between developed and developing regions. In most developed countries, fixed-broadband penetration has already reached relatively mature levels, with a penetration of 27.5 per cent and continuous low growth, at around 3.5 per cent, in 2014. In developing countries, fixed-broadband penetration growth rates have dropped from 18 per cent in 2011 to 6 per cent in 2014, reaching an overall (low) penetration rate of 6 per cent by end 2014, and less than 1 per cent in LDCs. In the latter, fixed-broadband infrastructure and uptake have not (yet) materialized.
Mobile broadband is growing fastest in developing countries, but the divide between developed and developing countries remains huge
Mobile broadband remains the fastest growing market segment, with continuous double-digit growth rates in 2014 and an estimated global penetration of 32 per cent – four times the penetration rate recorded just five years earlier.
This growth is driven by the availability and uptake of more affordable devices (smartphones) and types of plans on offer in the market. Nevertheless, the divide between developed and developing countries remains huge: mobile-broadband penetration will reach 84 per cent in the former, compared with 21 per cent in the latter.
While these double-digit growth rates are observed in all regions, Africa stands out with a growth rate of over 40 per cent – twice as high as the global average. By end 2014, mobile-broadband penetration in Africa will have climbed to almost 20 per cent, up from less than 2 per cent four years earlier (Chart 1.1). This is partly explained by strong growth in populous countries such as Nigeria and South Africa, where mobile-broadband penetration reached 37 per cent and 29 per cent, respectively, by end 2013.
In developed countries, 3G subscriptions overtook 2G subscriptions in 2010 and 3G growth is flattening. In developing countries, the large majority of subscriptions are still 2G, but 3G is growing rapidly and will overtake 2G subscriptions in a few years. These numbers are, however, expected to change significantly in the near future, as more and more countries are
Chart 1.1: Active mobile-broadband subscriptions by level of development, 2007-2014 (left), and by region, 2014* (right)
Note: *Estimate. Source: ITU World Telecommunication/ICT Indicators database.
83.7
32.0
21.1
6.30
10
20
30
40
50
60
70
80
90Developed
World
Developing
LDCs
Pe
r 1
00
in
ha
bit
an
ts
63.859.1
48.9
32.0
24.6 22.819.0
0
10
20
30
40
50
60
70
Pe
r 1
00
in
ha
bit
an
ts
CIS

3
Measuring the Information Society Report 2014
deploying 3G+ technologies and services, and given the strong growth in mobile-broadband subscriptions. At the same time, the issue of spectrum allocation will have to be addressed to ensure that the increasing demand for high-speed mobile access can be met, including in rural areas, where the additional spectrum represented by the digital dividend could play a crucial role in universalizing mobile-broadband access.
The developing countries’ share of total international bandwidth increased from around 9 per cent in 2004 to almost 30 per cent in 2013
Over the past decade, international Internet bandwidth has climbed sharply, from around 1 600 Gbit/s in 2001 to 60 400 Gbit/s in 2010 and more than 140 000 Gbit/s in 2013 (Chart 1.2, left). The average annual growth over this period was 45 per cent, reflecting the strong investment in backbone infrastructure in all parts of the world. Growth in international bandwidth has been strong in all regions, and the developing countries’ share of total international bandwidth increased from around 9 per cent in 2004 to almost 30 per cent in 2013. Europe leads the way by far in terms of international Internet
bandwidth, accounting for more than 50 per cent of the world’s total (2013), compared with Africa’s share of less than 1 per cent (Chart 1.2, right).
In developed countries, 78 per cent of households have Internet access, as compared with 31 per cent in developing countries and 5 per cent in LDCs
By end 2014, almost 44 per cent of the world’s households will have Internet access at home, up from 40 per cent one year earlier and 30 per cent four years earlier (Chart 1.3). Household Internet access is growing steadily, and strongly, at 9 per cent over the past year. Global growth is mostly driven by developing countries, where household Internet access is growing at 14 per cent as against around 4 per cent in developed countries. By end 2014, 78 per cent of households in developed countries will have Internet access, as compared with 31 per cent in developing countries and 5 per cent in LDCs.
There is a significant urban-rural divide when it comes to household Internet access. In countries where data are available, rural household access falls far below urban household access, with differences ranging from 4 per cent (i.e.
Chart 1.2: Total International Internet bandwidth (Gbit/s), by level of development (left) and by region (right), 2004-2013
Source: ITU World Telecommunication/ICT Indicators database.
0
20'000
40'000
60'000
80'000
100'000
120'000
140'000
160'000 Africa
Arab States
CIS
Asia & Pacific
The Americas
Europe
Inte
rna
tio
na
l In
tern
et
ba
nd
wid
th (
Gb
it/ s
)
2004
2005
2006
2007
2008
2009
2010
2011
2012
2013
-
20'000
40'000
60'000
80'000
100'000
120'000
140'000
160'000 World
Developed
Developing
Inte
rna
tio
na
l In
tern
et
ba
nd
wid
th (
Gb
it/s
)
2004
2005
2006
2007
2008
2009
2010
2011
2012
2013

Executive Summary
4
household Internet penetration in urban areas is 4 per cent higher than in rural areas) in highly developed countries such as Japan and the Republic of Korea to 35 per cent in developing countries such as Colombia and Morocco. Available data also show that Internet access in rural households is growing slowly, and much more slowly than urban access, leading to a widening gap. In low-income countries and LDCs, the differences are presumably even more pronounced, but data are not readily available for those countries. Therefore, connecting rural households to broadband networks should remain a priority for policy-makers in all countries.
The potential of libraries and post offices to provide public Internet access is currently not yet fully tapped
Research has shown that the potential of libraries and post offices to provide public Internet access is currently not yet fully tapped. For example, worldwide, only 10 per cent of post offices provide public access to the Internet, even though 20 per cent of post offices have a broadband Internet connection (Chart 1.4). There is huge potential, if all post offices were provided with broadband Internet and offered this as a
service to the public. According to the Universal Postal Union (UPU), increasing the proportion of post offices offering public Internet access to over 45 per cent would ensure that up to a third of all rural areas and small towns had access to the Internet, while with 60 per cent coverage half of all rural areas would be connected.
The developing countries’ share of total telecommunication revenues increased from 26 per cent in 2007 to 32 per cent in 2012, but remains below their 40 per cent share in total telecommunication investment
In 2012, total telecommunication revenue stagnated at around USD 1.88 trillion, or 2.7 per cent of world GDP (Chart 1.5). After the slump experienced during the financial crisis in 2008-2009, in developed countries the sector saw some signs of recovery in 2011, but returned to negative growth in 2012. In contrast, developing countries saw a 4 per cent growth in telecommunication revenues in 2012, hence mitigating the global decrease in revenues experienced in 2012. This confirms the steady progress of telecommunication revenues seen in developing countries in the period 2007-2012, except for a slight dip in 2008, which coincided with the most turbulent period of the
Chart 1.3: Percentage of households with Internet access, by level of development, 2005-2014 (left) and by region, 2014* (right)
Note: *Estimate.Source: ITU World Telecommunication/ICT Indicators database.
78.0
57.453.0
43.6
36.0 35.9
11.1
0
10
20
30
40
50
60
70
80
%
CIS
78.4
43.6
31.2
5.00
10
20
30
40
50
60
70
80
%
Developed
World
Developing
LDCs

5
Measuring the Information Society Report 2014
Chart 1.4: Proportion of post offices providing public Internet access and post offices with broadband Internet access, 2012, by level of development
Note: Simple averages.Source: UPU.
59
29
21
9
31
10
0
10
20
30
40
50
60
70
Proportion of post offices with
broadband Internet access
Proportion of post offices
providing public Internet access
%
Developed countries
Developing countries
World
global financial crisis. As a result, the developing countries’ share of total telecommunication revenues increased from 26 per cent in 2007 to 32 per cent in 2012, thus approaching their share of global GDP, which amounts to 36 per cent. This testifies to the growing importance of the telecommunication sector in the economic growth of the developing world.
In 2012, investment in telecommunications grew by 4 per cent to USD 307 billion globally. Despite the continuous growth since 2010, the 2008 investment levels have not been restored. Recovery has been hampered by the situation in developed countries, where the downturn experienced in 2008 was strongest and the reduction in telecommunication investment persisted in 2009. In developing countries, investment in telecommunication infrastructure and services has been more stable. This led to the 2008 investment levels being restored by 2011, and an all-time high of USD 121 billion at end 2012. The developing countries’ share in total investment was almost 40 per cent in 2012, which is relatively high compared with the share of global telecommunication revenues generated in developing countries (32 per cent).
Chart 1.5: Telecommunication revenues (left) and annual investment by telecommunication operators (right), world and by level of development, 2007-2012, total in USD
Note: Revenue data: ‘World’ includes 103 countries accounting for 96 per cent of world GDP. ‘Developed’ includes 40 developed countries accounting for 99 per cent of total GDP in the developed world. ‘Developing’ includes 63 developing countries accounting for 89 per cent of total GDP in the developing world.
Annual investment data: ‘World’ includes countries accounting for 91 per cent of world GDP. ‘Developed’ includes 35 developed countries accounting for 98 per cent of total GDP in the developed world. ‘Developing’ includes 45 developing countries accounting for 80 per cent of total GDP in the developing world.
Source: ITU.
1 678'1 785'
1 724' 1 777'1 885' 1 881'
1 236'1 301'
1 243' 1 243'1 302' 1 277'
442 484 482 534 582 604
0
200
400
600
800
1 000'
1 200'
1 400'
1 600'
1'800
2'000
2007 2008 2009 2010 2011 2012
World
Developed
Developing
Billion U
SD
Some 4.3 billion people worldwide are not yet using the Internet, 90 per cent of whom live in the developing world
Internet usage is growing steadily, at 6.6 per cent in 2014 – 3.3 per cent in developed countries and 8.7 per cent in developing countries. In developing countries, the number of Internet users has
287
312
276 276296
307
195 202
169 165180 186
92111 107 110 117 121
0
50
100
150
200
250
300
350
2007 2008 2009 2010 2011 2012
World
Developed
Developing
Billion U
SD

Executive Summary
6
doubled in five years (2009-2014), and two-thirds of today’s Internet users live in the developing world. By end 2014, almost 3 billion people will be using the Internet, corresponding to a global penetration rate of 40.4 per cent (Chart 1.6). Despite the progress, there are still 4.3 billion people worldwide who are not yet using the Internet, 90 per cent of whom live in the developing world.
Internet usage is growing across different sectors throughout the world, but Internet content is still dominated by providers from developed countries
An assessment of ICT uptake across different sectors shows that e-business is growing in all regions, although there are significant differences across regions and according to the size and location of enterprises: small and micro businesses are much less connected than large enterprises, and rural enterprises are less connected than urban enterprises. In addition, not all have broadband access, which is essential to enable businesses to engage in, and take full advantage of, the potential of e-business.
Government entities are major users of ICTs, and governments are also increasingly employing the Internet to provide services to their citizens.
Chart 1.6: Individuals using the Internet, by level of development, 2005-2014 (left) and by region, 2014* (right)
Note: *Estimate.Source: ITU World Telecommunication/ICT Indicators database.
According to the United Nations E-government Survey, today, governments of all countries have established central websites and more than 50 per cent of countries provide links to local and/or regional government agencies’ sites. Over the past decade, online information and services on government website portals increased threefold, with 70 per cent of countries providing a one-stop shop portal in 2012, as against 26 per cent in 2003. The UN E-government Development Index (EGDI) has been rising in all regions (Chart 1.7), and more and more countries are providing e-government transactional services and e-participation services.
Internet access and use in schools has also increased significantly over the past decade. In developed countries, the vast majority of schools have Internet access, to the extent that some countries no longer track this indicator, having reached 100 per cent connectivity. In developing countries, school access to Internet is lower on average, although substantial progress has been made in recent years. There are significant differences across countries, even within the same region and with similar income levels. In some developing countries, the proportion of schools with fixed-broadband Internet access (out of all schools with Internet access) is still low, suggesting that, in those countries, many
78.3
40.4
32.4
8.0
%
0
10
20
30
40
50
60
70
80
90
100 Developed
World
Developing
LDCs
74.8
65.5
55.9
40.6 40.4
32.4
19.0
0
10
20
30
40
50
60
70
80
%
CIS

7
Measuring the Information Society Report 2014
Chart 1.7: E-government Development Index (EGDI), 2003-2014
Source: UNDESA. Data from United Nations E-government Survey (2014).
schools have connections at only narrowband speed. Internet connectivity in schools also depends on the development of the national telecommunication infrastructure and on whether service providers have reached out to rural and sometimes geographically difficult areas with low population density. Rural areas often suffer from much lower network coverage and hence ICT uptake compared with urban areas.
The overall growth in Internet usage has been accompanied by a parallel, steep growth in the volume of Internet content. The emergence of social media applications and sites has contributed significantly to the increase in Internet use, as more and more people are creating, sharing and uploading content and using social media and other Internet-based applications. For example, more than 6 billion hours of video are being watched each month and more than 100 hours of video content are uploaded every minute on YouTube, the leading international video-filesharing site with services in 61 countries, which boasted more than 1 billion unique visitors a month in early 2014. Wikipedia, the largest and most
widely used online encyclopaedia, featured more than 30 million articles by end 2013, and articles are now available in 287 languages. At the same time, the large majority of Internet content still originates from content providers in developed countries. For example, domain-name registrations from developed countries accounted for over 80 per cent in 2013, whereas domain-name registrations from Africa accounted for less than 1 per cent.
Several of the proposed post-2015 sustainable development goals (SDGs) include targets which refer to ICTs
The year 2015 is imminent. It will mark the target date of the Millennium Development Goals (MDGs), and is also the deadline for the targets set by the World Summit on the Information Society (WSIS) and the targets set by the Broadband Commission for Digital Development. Accordingly, the process of discussing and determining the post-2015 development agenda, and setting new sustainable development goals (SDGs) for the next decade or so, culminates in 2014.
0
0.1
0.2
0.3
0.4
0.5
0.6
0.7
0.8
2002 2004 2006 2008 2010 2012 2014
Africa
Americas
Asia
Europe
Oceania
World
Linear (Africa)
Linear (Americas)
Linear (Asia)
Linear (Europe)
Linear (Oceania)
Linear (World)
EG
DI

Executive Summary
8
The United Nations Open Working Group (OWG) on SDGs concluded its work in July 2014, with a proposal for a set of 17 SDGs and 169 targets, which were forwarded to the UN General Assembly for consideration in the post-2015 development agenda that is to be adopted in late 2015. Several of the proposed goals include targets which refer to technology, and specifically ICTs, such as providing affordable Internet access in LDCs and enhancing the use of ICTs to promote women’s empowerment.
While the future international development goals have not yet been defined, ICTs will continue to play a major role in facilitating access to information, knowledge and key services. As more and more people join the information society and high-speed communication networks become an indispensable infrastructure, the tracking and measurement of ICT developments become even more relevant. Continuous monitoring and measurement of ICT developments will help to identify progress and gaps, and will guide policies to ensure equal access, use and impact in respect of ICTs.

9
Measuring the Information Society Report 2014
Chapter 2. The ICT Development Index (IDI)
The ICT Development Index (IDI) is a composite index combining 11 indicators into one benchmark measure that serves to monitor and compare developments in information and communication technology (ICT) across countries (Figure 2.1). The main objectives of the IDI are to measure:
• the level and evolution over time of ICT developments in countries and relative to other countries;
• progress in ICT development in both developed and developing countries;
• the digital divide, i.e. differences between countries in terms of their levels of ICT development;
• the development potential of ICTs or the extent to which countries can make use of ICTs to enhance growth and development.
The IDI is divided into three sub-indices: the access sub-index, the use sub-index and the skills sub-index, each capturing different aspects and components of the ICT development process. This report presents IDI values for a total of 166
economies based on 2013 data, and makes comparisons with 2012.
Almost all countries improved their IDI values in the last year, but differences in ICT uptake and use persist
The IDI results show that between 2012 and 2013 nearly all countries, at the top as well as at the bottom, increased their IDI values. While this points to a continued increase in access to and use of ICTs, the results also highlight that current levels of ICT development differ widely across the globe, with IDI values ranging from 0.96 to 8.86 (Table 2.1).
Denmark leads the IDI, replacing long-time front runner the Republic of Korea
Denmark leads the IDI ranking with the highest IDI 2013 value, replacing long-time front runner the Republic of Korea, which follows very closely. The remaining top ten IDI countries are predominantly European (Sweden, Iceland, United Kingdom, Norway, Netherlands, Finland and Luxembourg), together with an additional economy from Asia and the Pacific (Hong Kong, China) (Table 2.1).The top 30 of the IDI 2013 includes mostly countries from Europe, a number

Executive Summary
10
ICT access Reference value (%)
1. Fixed-telephone subscriptions per 100 inhabitants
2. Mobile-cellular telephone subscriptions per 100 inhabitants
3. International Internet bandwidth (bit/s) per Internet user
4. Percentage of households with a computer
5. Percentage of households with Internet access
60
120
787’260*
100
100
20
20
20
20
20
ICT use Reference value (%)
6. Percentage of individuals using the Internet
7. Fixed (wired)-broadband subscriptions per 100 inhab.itants
8. Wireless-broadband subscriptions per 100 inhabitants
100
60
100
33
33
33
ICT skills Reference value (%)
9. Adult literacy rate
10. Secondary gross enrolment ratio
11. Tertiary gross enrolment ratio
100
100
100
33
33
33
ICT
Development
Index
40
40
20
Figure 2.1: ICT Development Index: indicators, reference values and weights
Note: * This corresponds to a log value of 5.90, which was used in the normalization step. Source: ITU.
of high-income countries from Asia and the Pacific (Japan, Australia, Singapore, New Zealand and Macao (China)), the United States and Canada, as well as Bahrain, the only country from the Arab States region. All countries included in the top 30 have an IDI value of more than seven.
Top IDI performers have high income levels, competitive markets and a skilled population base
The top IDI performers share a number of common characteristics that help to explain their high levels of ICT access and use. All have highly liberalized and competitive ICT markets
that are at the forefront of innovation, are technology-driven and benefit from a highly skilled population to make effective use of ICTs. Furthermore, there is a strong link between countries’ national income levels and their IDI values, all of the top ten countries being relatively high-income economies. In terms of ICT developments, all IDI top performers benefit from abundant availability of international Internet bandwidth. High levels of Internet connectivity at home and the availability of mobile Internet translate into high degrees of Internet usage in the IDI’s top ten countries. The Nordic countries stand out with the highest percentage of Internet users globally.

11
Measuring the Information Society Report 2014
Table 2.1: ICT Development Index (IDI), 2012 and 2013
Economy Rank 2013 IDI 2013 Rank 2012 IDI 2012 Economy Rank 2013 IDI 2013 Rank 2012 IDI 2012Denmark 1 8.86 2 8.78 Albania 84 4.72 85 4.42Korea (Rep.) 2 8.85 1 8.81 Maldives 85 4.71 82 4.50Sweden 3 8.67 3 8.68 China 86 4.64 86 4.39Iceland 4 8.64 4 8.58 Jordan 87 4.62 84 4.48United Kingdom 5 8.50 7 8.28 Ecuador 88 4.56 88 4.28Norway 6 8.39 6 8.35 Egypt 89 4.45 87 4.28Netherlands 7 8.38 5 8.36 South Africa 90 4.42 89 4.19Finland 8 8.31 8 8.27 Fiji 91 4.40 103 3.90Hong Kong, China 9 8.28 11 8.08 Mongolia 92 4.32 90 4.19Luxembourg 10 8.26 9 8.19 Cape Verde 93 4.30 104 3.86Japan 11 8.22 10 8.15 Iran (I.R.) 94 4.29 97 4.02Australia 12 8.18 12 8.03 Mexico 95 4.29 94 4.07Switzerland 13 8.11 13 7.94 Morocco 96 4.27 92 4.09United States 14 8.02 14 7.90 Jamaica 97 4.26 98 4.01Monaco 15 7.93 17 7.72 Suriname 98 4.26 93 4.08Singapore 16 7.90 15 7.85 Tunisia 99 4.23 96 4.07Germany 17 7.90 18 7.72 Palestine 100 4.16 95 4.07France 18 7.87 16 7.73 Viet Nam 101 4.09 99 3.94New Zealand 19 7.82 19 7.62 Dominican Rep. 102 4.06 105 3.78Andorra 20 7.73 24 7.41 Philippines 103 4.02 102 3.91Estonia 21 7.68 21 7.54 Botswana 104 4.01 100 3.94Macao, China 22 7.66 20 7.59 Peru 105 4.00 101 3.92Canada 23 7.62 25 7.37 Indonesia 106 3.83 106 3.70Austria 24 7.62 23 7.46 Bolivia 107 3.78 109 3.52Belgium 25 7.57 26 7.33 Kyrgyzstan 108 3.78 107 3.69Ireland 26 7.57 22 7.48 Paraguay 109 3.71 108 3.56Bahrain 27 7.40 28 7.22 El Salvador 110 3.61 110 3.47Spain 28 7.38 29 7.14 Guyana 111 3.48 111 3.44Israel 29 7.29 27 7.25 Syria 112 3.46 112 3.39Malta 30 7.25 30 7.08 Ghana 113 3.46 115 3.29Slovenia 31 7.13 31 6.96 Algeria 114 3.42 114 3.30United Arab Emirates 32 7.03 46 6.27 Uzbekistan 115 3.40 116 3.27Latvia 33 7.03 33 6.84 Sri Lanka 116 3.36 113 3.31Qatar 34 7.01 42 6.46 Namibia 117 3.24 118 3.08Barbados 35 6.95 32 6.87 Guatemala 118 3.20 117 3.11Italy 36 6.94 36 6.66 Honduras 119 3.18 119 3.01Croatia 37 6.90 34 6.70 Nicaragua 120 2.96 120 2.78Belarus 38 6.89 43 6.45 Zimbabwe 121 2.89 123 2.68Greece 39 6.85 35 6.70 Sudan 122 2.88 121 2.69Lithuania 40 6.74 40 6.50 Bhutan 123 2.85 126 2.58Czech Republic 41 6.72 38 6.57 Kenya 124 2.79 124 2.62Russian Federation 42 6.70 41 6.48 Cuba 125 2.77 122 2.69Portugal 43 6.67 39 6.57 Gabon 126 2.66 125 2.61Poland 44 6.60 37 6.63 Cambodia 127 2.61 127 2.54Slovakia 45 6.58 45 6.30 Swaziland 128 2.60 128 2.43Hungary 46 6.52 44 6.35 India 129 2.53 129 2.42Saudi Arabia 47 6.36 50 6.01 Senegal 130 2.46 133 2.20Uruguay 48 6.32 51 5.92 Nepal 131 2.37 134 2.20Bulgaria 49 6.31 47 6.12 Lesotho 132 2.36 131 2.22Serbia 50 6.24 49 6.07 Nigeria 133 2.35 135 2.14Cyprus 51 6.11 48 6.09 Lao P.D.R. 134 2.35 130 2.25Oman 52 6.10 61 5.43 Gambia 135 2.31 136 2.12Kazakhstan 53 6.08 53 5.80 Solomon Islands 136 2.29 132 2.22St. Kitts and Nevis 54 6.01 52 5.89 Congo (Rep.) 137 2.24 137 2.09Costa Rica 55 5.92 55 5.64 Yemen 138 2.18 138 2.07Chile 56 5.92 54 5.68 Angola 139 2.17 139 2.06Antigua & Barbuda 57 5.89 59 5.49 Cameroon 140 2.10 142 1.98Romania 58 5.83 58 5.52 Djibouti 141 2.08 140 2.01Argentina 59 5.80 56 5.58 Pakistan 142 2.05 141 2.01TFYR Macedonia 60 5.77 62 5.42 Mali 143 2.04 147 1.86Moldova 61 5.72 60 5.44 Zambia 144 2.02 143 1.97Lebanon 62 5.71 64 5.32 Bangladesh 145 1.97 146 1.90Montenegro 63 5.67 57 5.52 Uganda 146 1.94 144 1.90Azerbaijan 64 5.65 65 5.22 Mauritania 147 1.91 145 1.90Brazil 65 5.50 67 5.16 Rwanda 148 1.86 151 1.74Brunei Darussalam 66 5.43 63 5.36 Benin 149 1.84 149 1.75Trinidad & Tobago 67 5.29 70 4.99 Myanmar 150 1.82 148 1.75Turkey 68 5.29 68 5.12 Côte d'Ivoire 151 1.80 150 1.74Bosnia and Herzegovina 69 5.23 74 4.89 Tanzania 152 1.76 152 1.72Mauritius 70 5.22 72 4.96 Liberia 153 1.70 154 1.57Malaysia 71 5.20 66 5.18 Guinea-Bissau 154 1.67 153 1.60St. Vincent and the Gren. 72 5.17 69 5.04 Afghanistan 155 1.67 155 1.57Ukraine 73 5.15 71 4.97 Burkina Faso 156 1.56 160 1.35Armenia 74 5.08 73 4.89 Congo (Dem. Rep.) 157 1.56 157 1.47Seychelles 75 4.97 76 4.70 Malawi 158 1.52 156 1.50Grenada 76 4.96 75 4.83 Mozambique 159 1.52 159 1.40Colombia 77 4.95 80 4.61 Madagascar 160 1.42 158 1.43Georgia 78 4.86 83 4.48 Guinea 161 1.42 161 1.31St. Lucia 79 4.81 79 4.66 Ethiopia 162 1.31 162 1.24Venezuela 80 4.81 78 4.68 Eritrea 163 1.20 163 1.18Thailand 81 4.76 91 4.09 Chad 164 1.11 164 1.09Panama 82 4.75 77 4.69 Niger 165 1.03 165 0.97Dominica 83 4.72 81 4.58 Central African Rep. 166 0.96 166 0.93
Source: ITU.

Executive Summary
12
Setting ambitious ICT targets can help drive national information economies
The countries displaying the highest IDI achievements have governments that recognize ICTs as a major driver for growth, innovation and economic development. To spur the information economy, they have set ambitious ICT targets, including to provide ultra-high speed Internet access to a large part of the (and sometimes the entire) population, to encourage the development of wireless-broadband access (including LTE), and to bring ICTs to homes. The European Commission’s Digital Agenda for Europe, for example, acknowledges the importance of connecting households with fast and ultra-fast broadband, and sets ambitious targets to have 50 per cent of households subscribed to ultra-fast broadband (at least 100 Mbit/s) and coverage of all households by broadband speeds of at least 30 Mbit/s by 2020. As ICT access levels reach saturation, these countries have also started to move from policies aimed at delivering access to increasing the quality of access.
Wireless broadband is driving IDI progress in the dynamic countries, most of which are from the developing world
Even though most countries do not see any dramatic increase in their IDI rank within a year
(and some countries decrease in rank), there are some significant and remarkable developments. Table 2.2 lists the so-called “dynamic” countries, i.e. those that register the highest increases in overall IDI, IDI access sub-index and/or IDI use sub-index rank from 2012 to 2013. The use sub-index is much more dynamic than the access sub-index. The indicator that has witnessed the largest increases from 2012 to 2013, spurring most of the IDI rank increase, is wireless-broadband subscriptions. Globally, the number of mobile-broadband subscriptions grew by 24 per cent from 2012 to 2013. Developing countries recorded the strongest growth, at 37 per cent. The dynamic countries’ increase in IDI use sub-index value far exceeds the average relative change in the use sub-index value between 2012 and 2013.
Significant disparities remain between developed and developing countries when it comes to IDI achievement
The analysis of IDI values by level of development reveals a significant disparity between developed and developing countries. Developed countries exhibit an average IDI value of 7.20, while the developing-country average is almost half that, at 3.84. The increase in average value between 2012 and 2013 was almost the same
Table 2.2: Most dynamic countries – changes between IDI 2013 and 2012
Note: * In the access sub-index, Mali, Mexico, Nepal, Nigeria, the Russian Federation and Uruguay also went up four places between 2012 and 2013. **In the use sub-index, Belarus and Oman also went up seven places.
Source: ITU.
Change in IDI ranking Change in access ranking Change in use ranking
IDI rank 2013
CountryIDI
rank change
Access rank 2013
CountryAccess rank
change
Use rank 2013
CountryUse rank
change32 United Arab Emirates 14 47 Oman 16 71 Thailand 3491 Fiji 12 101 Cape Verde 7 72 Fiji 2493 Cape Verde 11 124 Gambia 7 142 Burkina Faso 1381 Thailand 10 22 Qatar 6 79 Cape Verde 1252 Oman 9 28 Estonia 5 24 United Arab Emirates 1234 Qatar 8 64 Seychelles 5 134 Congo (Rep.) 1138 Belarus 5 97 Albania 4* 111 Bhutan 869 Bosnia and Herzegovina 5 38 Belarus 4* 30 Qatar 878 Georgia 5 112 Bolivia 4* 61 Antigua & Barbuda 7**

13
Measuring the Information Society Report 2014
in developing (+0.17) and developed (+0.18) countries when measured in absolute terms (Table 2.3), indicating that the overall progress in the developing countries is not enough in terms of ICT development to close the gap. Given their lower starting point and the high coefficient of variation within this group, however, when measured in relative terms the average IDI value of developing countries increased twice as much (+4.9 per cent) compared to developed countries (+2.5 per cent) (Chart 2.1, top).
Developing countries showed strong improvements in both the IDI access and IDI use sub-indices
The IDI access sub-index displays the highest average value, suggesting that, generally, countries have reached a higher level of ICT readiness, which is yet to translate into more intense usage of ICTs in many countries. The largest increases in the access sub-index occurred in developing countries, with an average value increase almost three times that of developed countries. The difference in average value between these two groups is lower than in the IDI use sub-index, showing that developing countries are catching up in terms of ICT infrastructure and access levels, which is a prerequisite for intensifying ICT usage (Chart 2.1, middle).
The IDI use sub-index is the most dynamic, showing the biggest improvements, particularly
in developing countries. However, the average value is lowest in this sub-index, affording the biggest potential for growth. The difference in average value between developed and developing countries is also highest in the use sub-index, which underlines that significant differences exist with regard to the intensity of ICT usage (Chart 2.1, bottom). In many developing countries, the availability and uptake of wireless-broadband and fixed-broadband services in particular is still relatively limited. While many developing countries saw substantial increases in their use sub-index value following the introduction of 3G services in 2012/2013, there were still a few countries that had not launched 3G services by end 2013. In 2014, close to 4.3 billion people, most of them living in the developing world, were not using the Internet. Bringing those people online is an important challenge for developing countries.
Some 2.5 billion people living in the world’s least connected countries (LCCs) need targeted policies for improved access to ICTs
Besides evaluating the gap between developed and developing countries, the digital divide was also analysed by grouping countries on the basis of their IDI values, reflecting four different levels of ICT development: high, upper, medium and low (Table 2.4).
Results show that the average value of each of the IDI groups increased between 2012 and
Table 2.3: IDI by level of development, 2012-2013
Note: *Simple averages. StDev= Standard deviation, CV= Coefficient of variation.Source: ITU.
IDI 2012 IDI 2013 Change in average value
2012-2013Average value* Min. Max. Range StDev CV Average
value* Min. Max. Range StDev CV
World 4.60 0.93 8.81 7.87 2.19 47.61 4.77 0.96 8.86 7.90 2.22 46.44 0.17
Developed 7.03 4.42 8.78 4.35 1.08 15.39 7.20 4.72 8.86 4.14 1.03 14.24 0.18
Developing 3.67 0.93 8.81 7.87 1.75 47.61 3.84 0.96 8.85 7.89 1.80 46.93 0.17

Executive Summary
14
Chart 2.1: IDI, IDI access sub-index and IDI use sub-index, by level of development
Note: Simple averages. Source: ITU.
2012
2013
IDI
4.6
7.0
3.7
4.8
7.2
3.8
0
1
2
3
4
5
6
7
8
9
World Developed Developing
Change:
+4.9%
Change:
+2.5%
Change:
+3.9%
2012
2013
IDI
acc
ess
su
b-i
nd
ex
5.3
7.6
4.4
5.4
7.7
4.5
0
1
2
3
4
5
6
7
8
9
World Developed Developing
:
Change:
+3.6%
Change:
+1.2%
Change:
+2.6%
2012
2013
IDI
use
su
b-i
nd
ex
Change:
+15.4%
2.9
5.5
1.9
3.2
5.9
2.2
0
1
2
3
4
5
6
7
8
9
World Developed Developing
Change:
+6.3%
Change:
+10.6%
group displays the highest increase in average value, while the range and measures of disparity in IDI values decreased for the high IDI group. This suggests that countries with higher IDI values are making good progress in terms of ICT development, and are moving at a similar pace. In the low IDI group, the range is the smallest – reflecting the extremely low levels of ICT development reached across this group – but is also widening. The 42 countries in the low group of the IDI, termed the “least connected countries” (LCCs), where levels of ICT access and usage are extremely low, are home to 2.5 billion people. Targeted policies should be directed towards connecting people in LCCs, because they are most in need of improved access to ICTs and could benefit most from the impact of ICTs to advance socio-economic development (Figure 2.2).
The higher a country’s share of population living in urban areas, the higher the values reached on the IDI
Countries differ significantly in terms of land area, relative size of the economy, population and geographic location. In order to understand the underlying factors that can have an influence on ICT development and IDI performance, an analysis was carried out to explore the extent to which geographic and other variables are important in terms of ICT development.
Given the strong correlation between IDI and GNI p.c. levels, a partial correlation analysis between geographic factors, population factors and IDI value was conducted in which GNI p.c. was used as a control variable (Table 2.5).
Among the variables tested, the percentage of population living in urban areas was the only one that showed a relationship with IDI results; no correlation was found between the IDI and the other geographic and population variables. The correlation analysis suggests that the higher a country’s share of population living in urban areas, the higher the values reached on the IDI (Chart 2.2).
2013, indicating that all countries are progressing
in terms of ICT development. The upper IDI

15
Measuring the Information Society Report 2014
Table 2.4: IDI by groups, 2012 and 2013
Note: *Simple averages. StDev= Standard deviation, CV= Coefficient of variation.Source: ITU.
Group
IDI 2012 IDI 2013
Number of coun-
tries
Averagevalue* Min. Max. Range StDev CV Average
value* Min. Max. Range StDev CV
High 42 7.52 6.46 8.81 2.35 0.70 9.27 7.69 6.70 8.86 2.16 0.63 8.22
Upper 40 5.38 4.50 6.45 1.95 0.56 10.38 5.63 4.75 6.67 1.91 0.58 10.26
Medium 42 3.69 2.62 4.48 1.86 0.54 14.61 3.88 2.79 4.72 1.93 0.58 14.97
Low 42 1.83 0.93 2.61 1.68 0.44 23.77 1.93 0.96 2.77 1.81 0.46 24.03
Total 166 4.60 0.93 8.81 7.87 2.19 47.61 4.77 0.96 8.86 7.90 2.22 46.44
Figure 2.2: Least connected countries (LCCs), 2013
Source: ITU.
There is a pressing need to address the urban-rural digital divide that prevails in many developing countries
There is a strong positive link between the level of urbanization and a number of the ICT indicators included in the IDI, in particular those
related to household ICT access, ICT skills and fixed telecommunication infrastructure. The relationship is most marked when it comes to Internet access and use, the levels of which are extremely low for rural households in developing countries. In addition, although by 2013 mobile-cellular coverage for rural populations has
IDI value:
Above 2.78LCC (2.78 and below)Data not available

Executive Summary
16
Table 2.5: Partial correlation analysis of IDI, population and geographic characteristics
Note: Data on urban population, population density, land area and GNI p.c. are sourced from the World Bank. Data on population size are sourced from UNPD. *Correlation is significant at 0.01 level.
Source: ITU.
reached a stage where almost 90 per cent of the world’s rural inhabitants are covered by a 2G mobile-cellular signal, 3G mobile-cellular coverage remains comparatively low for rural populations. There is a pressing need to address the urban-rural digital divide that prevails in many developing countries. People living in rural areas, particularly in developing countries, are disadvantaged compared to their urban counterparts because of lower service coverage; they also often lack the economic means to pay for broadband Internet services, as well as the skills to make effective use of ICTs. On the other hand, they are the population group that could potentially benefit most from ICT access. This
Chart 2.2: IDI and percentage of population living in urban areas
Source: ITU.
0
r = 0.501
IDI
20
13
0
1
2
3
4
5
6
7
8
9
10
10 20 30 40 50 60 70 80 90 100
Population in urban areas (%)
applies in particular to most LCCs (Box 2.X). The majority of LCCs have large rural populations: in 25 out of the 42 LCCs, less than 35 per cent of the population lives in urban areas, and these closely correspond to the list of LDCs.
IDI performance is not linked to a country’s population or geographic size
The correlation analysis found no relationship with the other selected geographic variables, such as population density, population size, or the size of a country’s land area. This indicates that these features do not make any difference in terms of the IDI values that countries attain. Indeed, countries with low population densities, small populations and small geographic size exhibit very diverse levels of ICT development. Rather than population density, population size, and geographic size, it is thus the concentration of people in certain areas of a country (i.e. the percentage of population in urban areas) that seems to play a role in determining ICT development.
Many of the MDG indicators (20 out of 38) show significant correlation with the IDI, in particular those related to poverty reduction, health and environmental sustainability
A growing number of studies suggest that ICTs are enablers of all three pillars of sustainable development, i.e. social development, economic
Control VariableCorrelations
IDI Population size
Population density
Land area
Urban population
GNI per capita
IDI 1 -0.032 0 0.017 0.501*
Population size -0.032 1 -0.009 0.455* -0.045
Population density 0 -0.009 1 -0.090 0.101
Land area 0.017 0.455* -0.090 1 0.075
Urban population 0.501* -0.045 0.101 0.075 1

17
Measuring the Information Society Report 2014
development and environmental sustainability. Since the Millennium Declaration was issued in 2000, ICTs have grown unprecedentedly, a trend which has underscored their potential for enabling socio-economic development. In this context, and as a contribution to the ongoing debate, a correlation analysis was carried out to quantify the relationship between ICT development (as measured by the IDI) and the Millennium Development Goals (MDGs).
The analysis revealed that there is a significant correlation between IDI values and 20 of the 38 MDG indicators for which data were available. The results show an important relationship between ICT development and selected development indicators, in particular in the areas of poverty reduction (MDG 1), health (MDGs 4, 5 and 6) and environmental sustainability (MDG 7). On the other hand, no significant correlation was found between the IDI and the indicators under MDGs 3 and 8 (Figure 2.3).
In particular, the results of the correlation analysis reveal that there is a significant negative correlation between IDI and the proportion of people whose income is less than one dollar a day, as well as the percentage of population that is undernourished. High IDI levels are thus associated with lower percentages of undernourished population and lower proportions of population living below the poverty line. Higher IDI levels are also associated with lower maternal and child mortality rates and low incidence and prevalence of malaria and tuberculosis.
Progress in ICT development was found to be linked to progress in selected MDGs
In a second step, an analysis was carried out to compare the relative change (increase) in IDI and
the relative change in MDG indicators between the years 2002 and 2011. The results revealed significant correlations between increases in IDI and progress towards selected MDG indicators. This suggests that ICT development could lead to improvements in other areas of social and economic development, too.
For example, results show a significant negative correlation between percentage change (increase) in IDI and percentage change in the proportion of population living below the national poverty line, as well as between percentage change in IDI and percentage change in the undernourished population in developing countries. This means that there is a relationship between improved ICT access/usage and poverty reduction. Furthermore, results highlighted a significant and negative correlation between percentage change in IDI and percentage changes in infant mortality, child mortality and maternal mortality. These results are particularly true in non-LDCs, where the IDI values increased more during the ten-year period than in LDCs. The analysis nonetheless revealed a significant positive correlation between percentage change in carbon dioxide (CO2) emissions and percentage increase in IDI, which highlights a possible adverse impact that ICTs can exert on the environment.
These finding should be understood as a starting point for further quantitative analyses linking ICT development with social and economic development. In particular, future research could focus on developing methodologies that can quantitatively assess the impact of ICTs on a range of socio-economic variables. This type of analysis will require different data sets, including micro data on ICT usage collected from official surveys.

Executive Summary
18
Figure 2.3: Significant partial correlations between IDI and MDG indicators
Source: ITU.
Goal 1
1.1 Proportion of population below $1 (PPP) per day1.1 Population below national poverty line1.2 Poverty gap ratio1.6 Proportion of employed people living below 1$ per day1.9 Proportion of population below minimum level of dietary energy consumption
Goal 66.1 HIV prevalence among population aged 15-49 years old6.9 Incidence, prevalence and death rates associated with tuberculosis6.10 Proportion of tuberculosis cases detected and cured under directly observed treatment short course
Goal 44.1 Under-five mortality rate4.2 Infant mortality rate4.3 Proportion of 1 year-old children immunised against measles
Goal 55.1 Maternal mortality ratio5.2 Proportion of births attended by skilled health personnel5.4 Adolescent birth rate5.5 Antenatal care coverage (at least one visit and at least four visits)
IDI
Goal 77.2 CO2 emissions, metric tons of CO2 per capita7.8 Proportion of population using an improved drinking water source7.9 Proportion of population using improved sanitation facility

19
Measuring the Information Society Report 2014
Chapter 3. Regional IDI analysis
An analysis of the latest ICT Development Index (IDI) results on the basis of the six ITU Telecommunication Development Bureau (BDT) regions (Africa, Americas, Arab States, Asia and the Pacific, Commonwealth of Independent States (CIS) and Europe)1 provides insights into differences in global ICT developments, highlighting disparities within and among regions, showing trends and developments over time and pointing to important bottlenecks that the regions are facing in becoming equally vibrant information societies.
Major regional differences in ICT uptake persist
IDI values in Europe, CIS and the Americas lie above the world average. Europe displays by far the highest average IDI value of 7.14. The regional IDI values of the CIS (5.33), the Americas (4.86), Asia and the Pacific (4.57) and Arab States (4.55) are relatively close to each other. However, they fall either side of an important benchmark, as only the CIS and the Americas regional averages exceed the world average of 4.77, while Asia and the Pacific and Arab States remain below that value. Africa has by far the lowest regional IDI of 2.31, less than one-third of the European average (Chart 3.1).
Differences in IDI values within the regions are decreasing in Europe and Asia-Pacific, and increasing in CIS, Africa and the Arab States
A look at the IDI range (calculated by subtracting the lowest IDI value in the region from the highest value) and additional measures of disparity2 yields information on differences in ICT development within regions and allows a comparative analysis of regional
Chart 3.1: IDI ranges and averages, by region and compared to world average, 2013
Note: Simple averages. Source: ITU.
IDI
20
13
7.14
5.33 4.86
4.57 4.55
2.31
0
1
2
3
4
5
6
7
8
9
10
Europe CIS The
Americas
Asia &
Pacific
Arab
States
Africa
Regional average
World average (4.77)
Range

Executive Summary
20
disparities (see Table 3.1). Europe saw by far the biggest decrease in IDI range, and both the country at the top and that at the bottom of the regional ranking progressed from 2012 to 2013. Furthermore, Europe’s standard deviation and coefficient of variation, which are lowest of all regions, further decreased, suggesting that differences within the region are becoming smaller. The range also slightly decreased in Asia and the Pacific, where the top and bottom-ranked countries both improved their values. While this region still has the most significant regional divide (in terms of range, StDev and CV), it is encouraging to see that the divide is narrowing. Differences in IDI values grew in CIS, Africa and the Arab States. Over the same time period (2012-2013), the Americas region showed little variation in range.
Europe leads the way in ICT uptake and use
All countries in Europe, with the sole exception of Albania, exceed the global average IDI of 4.77, and Europe is well ahead of all other regions. Half of the countries in the region have an IDI value that is higher than the developed-country average of 7.20. The measures of disparity (StDev and CV) are lowest in Europe, which underlines that not only do European countries have a generally
Table 3.1: IDI by region, 2013 and 2012
Note: *Simple averages. StDev= Standard deviation, CV= Coefficient of variation.Source: ITU.
Region
IDI 2013 IDI 2012 Difference 2012-2013M
ax.
Min
.
Rang
e
Aver
age
valu
e*
StDe
v
CV Max
.
Min
.
Rang
e
Aver
age
valu
e*
StDe
v
CV Rang
e
Aver
age
valu
e*
CV
Europe 8.86 4.72 4.14 7.14 1.04 14.55 8.78 4.42 4.35 6.98 1.09 15.60 -0.21 0.16 -1.05
CIS 6.89 3.40 3.49 5.33 1.13 21.26 6.45 3.27 3.18 5.07 1.06 20.91 0.31 0.26 0.35
The Americas 8.02 2.77 5.25 4.86 1.30 26.76 7.90 2.69 5.21 4.67 1.27 27.33 0.04 0.20 -0.56
Asia & Pacific 8.85 1.67 7.18 4.57 2.30 50.44 8.81 1.57 7.24 4.42 2.31 52.22 -0.06 0.15 -1.78
Arab States 7.40 1.91 5.49 4.55 1.80 39.51 7.22 1.90 5.32 4.30 1.64 38.10 0.17 0.25 1.41
Africa 5.22 0.96 4.26 2.31 1.08 46.68 4.96 0.93 4.02 2.18 1.02 46.53 0.24 0.13 0.15
high level of ICT development, but also that differences between them are relatively small. This comparatively small regional divide exists between the lower ranking Eastern and Southern European countries, on the one hand, and the Western, and in particular Nordic, European countries that rank at the top of the regional and global IDI, on the other. Most importantly, Denmark took the leading position in the IDI 2013, replacing long-time number one Republic of Korea. Bosnia and Herzegovina made the largest improvement in rank of all European countries, jumping from 74th to 69th position in the IDI 2013 (see Table 3.2).
Asia-Pacific is the most heterogeneous region in terms of ICT developments
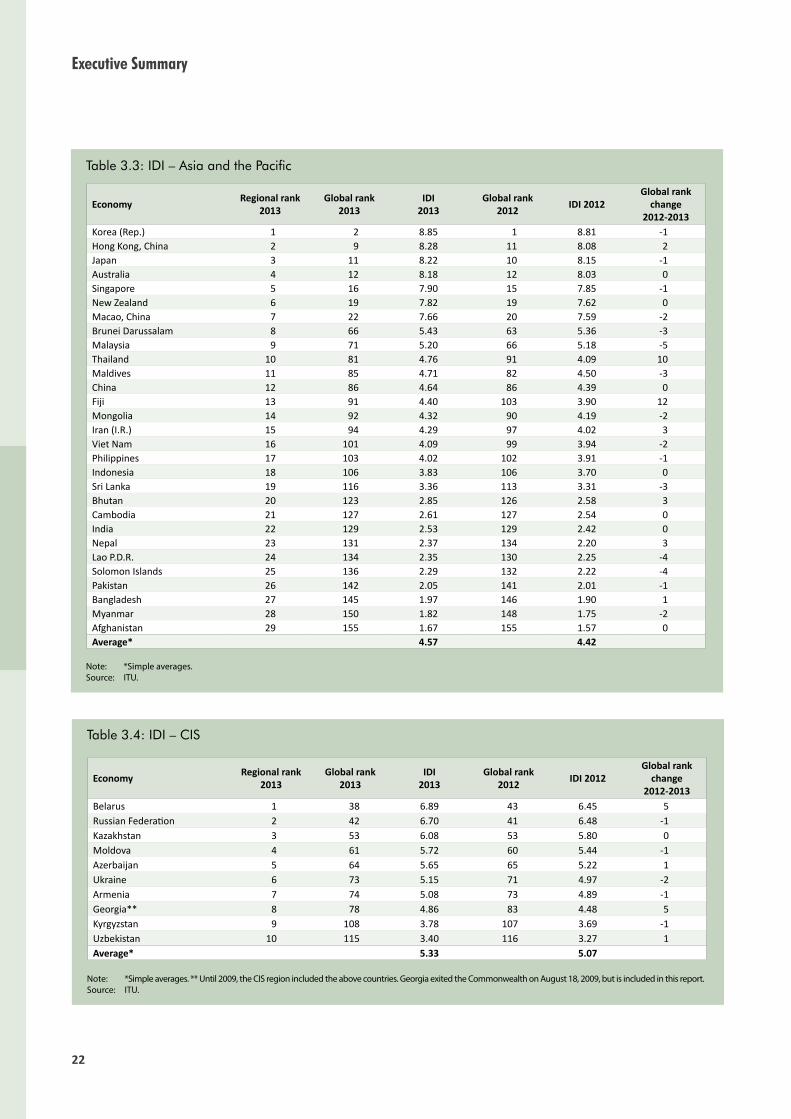
Asia and the Pacific is indisputably the most diverse region in terms of ICT developments, reflecting stark differences in economic development throughout the region. It has the highest range in IDI values, as well as high levels of standard deviation (StDev) and coefficient of variation (CV). The region includes both top performers (such as the Republic of Korea, Hong Kong (China) and Japan) and a number of least connected countries (LCCs) (including Afghanistan, Myanmar and Bangladesh) (see Table 3.3). At the same time, a comparison

21
Measuring the Information Society Report 2014
between 2012 and 2013 shows that both the range in IDI values and the levels of StDev and CV within the region have decreased, and that both the top performers and those ranked at the bottom of the IDI have improved their values. The most dynamic countries in the region are Fiji and Thailand, which increased their IDI rank by 12 and 10 places, respectively, between 2012 and 2013.
The CIS region has made the most progress over the last year, but differences within the region are increasing
A comparison between 2012 and 2013 regional IDI values shows that the CIS and Arab States regional IDI averages increased the most within one year, and twice as much as in Africa, the region with the least improvements
Table 3.2: IDI – Europe
Note: *Simple averages. Source: ITU.
Economy Regional rank 2013
Global rank 2013
IDI 2013
Global rank 2012 IDI 2012
Global rank change
2012-2013Denmark 1 1 8.86 2 8.78 1Sweden 2 3 8.67 3 8.68 0Iceland 3 4 8.64 4 8.58 0United Kingdom 4 5 8.50 7 8.28 2Norway 5 6 8.39 6 8.35 0Netherlands 6 7 8.38 5 8.36 -2Finland 7 8 8.31 8 8.27 0Luxembourg 8 10 8.26 9 8.19 -1Switzerland 9 13 8.11 13 7.94 0Monaco 10 15 7.93 17 7.72 2Germany 11 17 7.90 18 7.72 1France 12 18 7.87 16 7.73 -2Andorra 13 20 7.73 24 7.41 4Estonia 14 21 7.68 21 7.54 0Austria 15 24 7.62 23 7.46 -1Belgium 16 25 7.57 26 7.33 1Ireland 17 26 7.57 22 7.48 -4Spain 18 28 7.38 29 7.14 1Israel 19 29 7.29 27 7.25 -2Malta 20 30 7.25 30 7.08 0Slovenia 21 31 7.13 31 6.96 0Latvia 22 33 7.03 33 6.84 0Italy 23 36 6.94 36 6.66 0Croatia 24 37 6.90 34 6.70 -3Greece 25 39 6.85 35 6.70 -4Lithuania 26 40 6.74 40 6.50 0Czech Republic 27 41 6.72 38 6.57 -3Portugal 28 43 6.67 39 6.57 -4Poland 29 44 6.60 37 6.63 -7Slovakia 30 45 6.58 45 6.30 0Hungary 31 46 6.52 44 6.35 -2Bulgaria 32 49 6.31 47 6.12 -2Serbia 33 50 6.24 49 6.07 -1Cyprus 34 51 6.11 48 6.09 -3Romania 35 58 5.83 58 5.52 0TFYR Macedonia 36 60 5.77 62 5.42 2Montenegro 37 63 5.67 57 5.52 -6Turkey 38 68 5.29 68 5.12 0Bosnia and Herzegovina 39 69 5.23 74 4.89 5Albania 40 84 4.72 85 4.42 1Average* 7.14 6.98
Executive Summary
22
Table 3.3: IDI – Asia and the Pacific
Note: *Simple averages. Source: ITU.
Economy Regional rank 2013
Global rank 2013
IDI 2013
Global rank 2012 IDI 2012
Global rank change
2012-2013Korea (Rep.) 1 2 8.85 1 8.81 -1Hong Kong, China 2 9 8.28 11 8.08 2Japan 3 11 8.22 10 8.15 -1Australia 4 12 8.18 12 8.03 0Singapore 5 16 7.90 15 7.85 -1New Zealand 6 19 7.82 19 7.62 0Macao, China 7 22 7.66 20 7.59 -2Brunei Darussalam 8 66 5.43 63 5.36 -3Malaysia 9 71 5.20 66 5.18 -5Thailand 10 81 4.76 91 4.09 10Maldives 11 85 4.71 82 4.50 -3China 12 86 4.64 86 4.39 0Fiji 13 91 4.40 103 3.90 12Mongolia 14 92 4.32 90 4.19 -2Iran (I.R.) 15 94 4.29 97 4.02 3Viet Nam 16 101 4.09 99 3.94 -2Philippines 17 103 4.02 102 3.91 -1Indonesia 18 106 3.83 106 3.70 0Sri Lanka 19 116 3.36 113 3.31 -3Bhutan 20 123 2.85 126 2.58 3Cambodia 21 127 2.61 127 2.54 0India 22 129 2.53 129 2.42 0Nepal 23 131 2.37 134 2.20 3Lao P.D.R. 24 134 2.35 130 2.25 -4Solomon Islands 25 136 2.29 132 2.22 -4Pakistan 26 142 2.05 141 2.01 -1Bangladesh 27 145 1.97 146 1.90 1Myanmar 28 150 1.82 148 1.75 -2Afghanistan 29 155 1.67 155 1.57 0Average* 4.57 4.42
Table 3.4: IDI – CIS
Note: *Simple averages. ** Until 2009, the CIS region included the above countries. Georgia exited the Commonwealth on August 18, 2009, but is included in this report.Source: ITU.
Economy Regional rank 2013
Global rank 2013
IDI 2013
Global rank 2012 IDI 2012
Global rank change
2012-2013Belarus 1 38 6.89 43 6.45 5Russian Federation 2 42 6.70 41 6.48 -1Kazakhstan 3 53 6.08 53 5.80 0Moldova 4 61 5.72 60 5.44 -1Azerbaijan 5 64 5.65 65 5.22 1Ukraine 6 73 5.15 71 4.97 -2Armenia 7 74 5.08 73 4.89 -1Georgia** 8 78 4.86 83 4.48 5Kyrgyzstan 9 108 3.78 107 3.69 -1Uzbekistan 10 115 3.40 116 3.27 1Average* 5.33 5.07

23
Measuring the Information Society Report 2014
and lowest average in 2013. The CIS region has the smallest range in IDI values, which shows that the relatively small number of countries it comprises are fairly homogenous in terms of ICT development. At the same time, the region registered the highest increase in regional range and in StDev and CV, suggesting that differences within the region are becoming larger. Two countries – Belarus and Georgia – stand out in terms of improvement in their global IDI rankings from 2012 to 2013. Belarus overtook the Russian Federation as the country with the highest IDI in the region (Table 3.4).
From 2012 to 2013, more countries in the Americas declined than improved in the global IDI ranking
The United States and Canada lead the Americas regional ranking, with IDI values of 8.02 and 7.62, respectively. Half of the countries in the Americas have IDI values above the global average, while the other half fall below. Uruguay is the highest ranked Latin American country, with an IDI of 6.32, which is significantly above the regional (4.86) and developing-country (3.84) averages. The region’s most populous developing country, Brazil (5.50), also lies above the regional and developing-country averages. Cuba is the only LCC in the Americas, and has an IDI value of just 2.77. From 2012 to 2013, more countries in the Americas declined than improved in the global IDI rankings. Those that dropped down the global rankings from 2012 to 2013 include Panama and Suriname (-5 ranks) and Peru (-4 ranks). In particular, Cuba is falling further behind, ranking 125th in the IDI 2013 as against 122nd in 2012 (see Table 3.5).
Africa is the region with the lowest IDI value, and 29 out of 38 African countries are considered to be least connected countries
The African regional IDI is the lowest of all six regions. Only two countries – Mauritius (5.22) and Seychelles (4.97) – lie above the global IDI average of 4.77. Three-quarters (29 out
of 38) of African countries are considered to be LCCs. The bottom ten of the IDI 2013 are all African countries, including the Central African Republic, the only country with an IDI value of less than one (see Table 3.6). This underlines that there is a severe divide between the regions, and that the large majority of Africans still need to develop their information societies. A comparison of regional IDI values over the last year, as measured by the average growth rate of IDI values, also suggests that other regions are progressing faster than Africa. This indicates that Africa is not advancing enough in terms of ICT development to catch up with other, more advanced regions. In particular, the lack of International Internet bandwidth is seriously hampering ICT development and ICT household penetration remains very low.
IDI values in the Arab States reflect the income disparities in this region
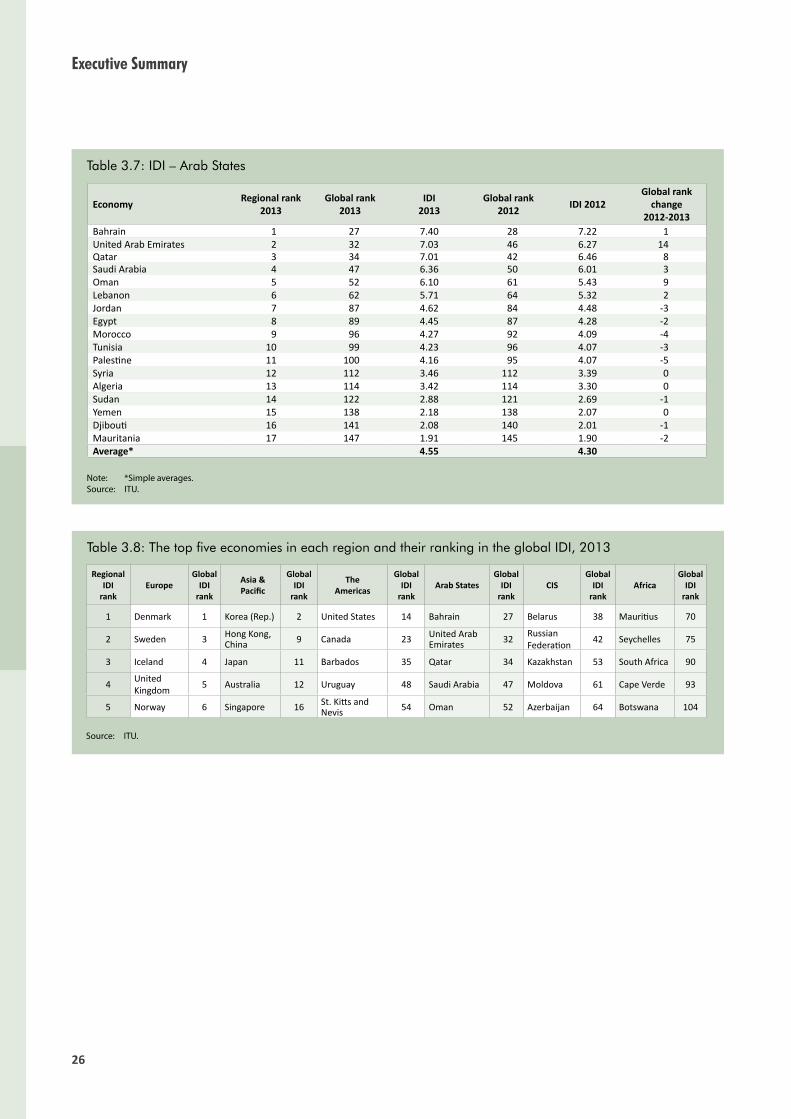
The top five countries in the Arab States in terms of ICT development – Bahrain, United Arab Emirates, Qatar, Saudi Arabia and Oman – are oil-rich, high-income economies and are part of the Cooperation Council for the Arab Sates of the Gulf (GCC). They are in the top 60 in the global ranking, and their performance underlines the link between IDI and GNI per capita, with high-income countries attaining higher average IDI values. At the other end of the scale, there are a number of countries which have a much lower level of development, namely Syria, Algeria, Sudan, Yemen, Djibouti and Mauritania, with IDI values below the developing-country average. While the six Arab countries with the highest IDI values managed to improve their global ranking from 2012 to 2013, all the other Arab countries remained at the same position as in 2012, or went down in international comparisons (see Table 3.7). This indicates that the Arab States with a lower IDI are not keeping up with global ICT developments, while the top countries in the region are catching up with the IDI top performers.

Executive Summary
24
Table 3.5: IDI – The Americas
Note: *Simple averages. Source: ITU.
Economy Regional rank 2013
Global rank 2013
IDI 2013
Global rank 2012 IDI 2012
Global rank change
2012-2013United States 1 14 8.02 14 7.90 0Canada 2 23 7.62 25 7.37 2Barbados 3 35 6.95 32 6.87 -3Uruguay 4 48 6.32 51 5.92 3St. Kitts and Nevis 5 54 6.01 52 5.89 -2Costa Rica 6 55 5.92 55 5.64 0Chile 7 56 5.92 54 5.68 -2Antigua & Barbuda 8 57 5.89 59 5.49 2Argentina 9 59 5.80 56 5.58 -3Brazil 10 65 5.50 67 5.16 2Trinidad & Tobago 11 67 5.29 70 4.99 3St. Vincent and the Grenadines 12 72 5.17 69 5.04 -3Grenada 13 76 4.96 75 4.83 -1Colombia 14 77 4.95 80 4.61 3St. Lucia 15 79 4.81 79 4.66 0Venezuela 16 80 4.81 78 4.68 -2Panama 17 82 4.75 77 4.69 -5Dominica 18 83 4.72 81 4.58 -2Ecuador 19 88 4.56 88 4.28 0Mexico 20 95 4.29 94 4.07 -1Jamaica 21 97 4.26 98 4.01 1Suriname 22 98 4.26 93 4.08 -5Dominican Rep. 23 102 4.06 105 3.78 3Peru 24 105 4.00 101 3.92 -4Bolivia 25 107 3.78 109 3.52 2Paraguay 26 109 3.71 108 3.56 -1El Salvador 27 110 3.61 110 3.47 0Guyana 28 111 3.48 111 3.44 0Guatemala 29 118 3.20 117 3.11 -1Honduras 30 119 3.18 119 3.01 0Nicaragua 31 120 2.96 120 2.78 0Cuba 32 125 2.77 122 2.69 -3Average* 4.86 4.67
The regional top five ranking confirms differences within and among regions
Table 3.8 presents a comparison of the global and regional rankings of the top five economies in each of the six regions, thereby providing further insights into the differences in ICT development. The European top five countries closely resemble the global top five – the Republic of Korea is the only non-European country among the global top five – which is dominated by Nordic countries. The top five economies from Asia and the Pacific also rank relatively high globally, all of them coming in the global top 20. In the Arab States and CIS
regions, the top five countries are somewhat further apart, and rank lower globally, but are all still in the high and upper group of the IDI (see Chapter 2). The Americas’ regional top five shows the highest disparity, reflecting the divide between the North American countries (United States and Canada), which are in the global top 25, and the Caribbean and Latin American countries, which rank somewhat lower. African countries generally rank quite low in the IDI and disparities between the top five are also quite considerable. Mauritius (70th position) and Seychelles (75th position) are the highest placed countries in the region.

25
Measuring the Information Society Report 2014
Table 3.6: IDI – Africa
Note: *Simple averages. Source: ITU.
Economy Regional rank 2013
Global rank 2013
IDI 2013
Global rank 2012 IDI 2012
Global rank change
2012-2013Mauritius 1 70 5.22 72 4.96 2Seychelles 2 75 4.97 76 4.70 1South Africa 3 90 4.42 89 4.19 -1Cape Verde 4 93 4.30 104 3.86 11Botswana 5 104 4.01 100 3.94 -4Ghana 6 113 3.46 115 3.29 2Namibia 7 117 3.24 118 3.08 1Zimbabwe 8 121 2.89 123 2.68 2Kenya 9 124 2.79 124 2.62 0Gabon 10 126 2.66 125 2.61 -1Swaziland 11 128 2.60 128 2.43 0Senegal 12 130 2.46 133 2.20 3Lesotho 13 132 2.36 131 2.22 -1Nigeria 14 133 2.35 135 2.14 2Gambia 15 135 2.31 136 2.12 1Congo (Rep.) 16 137 2.24 137 2.09 0Angola 17 139 2.17 139 2.06 0Cameroon 18 140 2.10 142 1.98 2Mali 19 143 2.04 147 1.86 4Zambia 20 144 2.02 143 1.97 -1Uganda 21 146 1.94 144 1.90 -2Rwanda 22 148 1.86 151 1.74 3Benin 23 149 1.84 149 1.75 0Côte d'Ivoire 24 151 1.80 150 1.74 -1Tanzania 25 152 1.76 152 1.72 0Liberia 26 153 1.70 154 1.57 1Guinea-Bissau 27 154 1.67 153 1.60 -1Burkina Faso 28 156 1.56 160 1.35 4Congo (Dem. Rep.) 29 157 1.56 157 1.47 0Malawi 30 158 1.52 156 1.50 -2Mozambique 31 159 1.52 159 1.40 0Madagascar 32 160 1.42 158 1.43 -2Guinea 33 161 1.42 161 1.31 0Ethiopia 34 162 1.31 162 1.24 0Eritrea 35 163 1.20 163 1.18 0Chad 36 164 1.11 164 1.09 0Niger 37 165 1.03 165 0.97 0Central African Rep. 38 166 0.96 166 0.93 0Average* 2.31 2.18
Executive Summary
26
Table 3.7: IDI – Arab States
Note: *Simple averages. Source: ITU.
Economy Regional rank 2013
Global rank 2013
IDI 2013
Global rank 2012 IDI 2012
Global rank change
2012-2013Bahrain 1 27 7.40 28 7.22 1United Arab Emirates 2 32 7.03 46 6.27 14Qatar 3 34 7.01 42 6.46 8Saudi Arabia 4 47 6.36 50 6.01 3Oman 5 52 6.10 61 5.43 9Lebanon 6 62 5.71 64 5.32 2Jordan 7 87 4.62 84 4.48 -3Egypt 8 89 4.45 87 4.28 -2Morocco 9 96 4.27 92 4.09 -4Tunisia 10 99 4.23 96 4.07 -3Palestine 11 100 4.16 95 4.07 -5Syria 12 112 3.46 112 3.39 0Algeria 13 114 3.42 114 3.30 0Sudan 14 122 2.88 121 2.69 -1Yemen 15 138 2.18 138 2.07 0Djibouti 16 141 2.08 140 2.01 -1Mauritania 17 147 1.91 145 1.90 -2Average* 4.55 4.30
Table 3.8: The top five economies in each region and their ranking in the global IDI, 2013
Regional IDI
rankEurope
Global IDI
rank
Asia & Pacific
Global IDI
rank
The Americas
Global IDI
rankArab States
Global IDI
rankCIS
Global IDI
rankAfrica
Global IDI
rank
1 Denmark 1 Korea (Rep.) 2 United States 14 Bahrain 27 Belarus 38 Mauritius 70
2 Sweden 3 Hong Kong, China 9 Canada 23 United Arab
Emirates 32 Russian Federation 42 Seychelles 75
3 Iceland 4 Japan 11 Barbados 35 Qatar 34 Kazakhstan 53 South Africa 90
4 United Kingdom 5 Australia 12 Uruguay 48 Saudi Arabia 47 Moldova 61 Cape Verde 93
5 Norway 6 Singapore 16 St. Kitts and Nevis 54 Oman 52 Azerbaijan 64 Botswana 104
Source: ITU.

27
Measuring the Information Society Report 2014
1 See: http://www.itu.int/ITU-D/ict/definitions/regions/index.html.
2 The standard deviation (StDev) shows the average distance of a value to the mean. The coefficient of variation (CV) measures the dispersion of a variable independently of the variable’s measurement unit. The higher the CV, the greater the dispersion in the variable.
3 For analytical purposes, countries were grouped on the basis of their IDI values, reflecting four different levels of ICT development: high, upper, medium and low (see Table 2.4).
Endnotes

29
Measuring the Information Society Report 2014
Chapter 4. ICT prices and the role of competition
The price of ICT services constitutes a determining factor for ICT uptake and, as such, continues to be a focus of attention for regulators and policy-makers. Affordability remains the main barrier to Internet access at home in many developing countries. In developed countries, price is the most important factor when choosing the type of service, and it strongly influences usage.
Fixed-broadband prices continue to decrease, albeit at slower pace, and entry-level fixed-broadband speeds are increasing
In the period 2008-2013, the price of an entry-level fixed-broadband plan decreased by almost 70 per cent globally: from an average of PPP$ 158 in 2008 to PPP$ 49 in 2013. In parallel with the reduction in prices, there was a notable increase in the advertised speed for fixed-broadband plans: 256 kbit/s was the most common entry-level speed in 2008, compared with 1 Mbit/s in 2013 (Chart 4.1).
The decrease in fixed-broadband prices was remarkable in developing countries, where average prices dropped by 70 per cent in the five-year period, down to PPP$ 59 (or USD 34) in 2013. The fall in prices was particularly strong in the period 2008-2012, with the average price in
developing countries declining by more than 20 per cent per year. In 2013, there was a slowdown, with the average entry-level fixed-broadband price in developing countries decreasing by only 4 per cent. On the other hand, this was accompanied by an upgrade of entry-level fixed-broadband speeds, with 1 Mbit/s becoming the most common entry-level speed in 2013, as opposed to 256 kbit/s in 2012.
Entry-level fixed-broadband prices remained much more stable in developed countries, and registered only a slight decrease in the period 2008-2013, to an average of PPP$ 26 (or USD 25). The almost flat evolution of entry-level fixed-broadband prices in the developed world suggests that competition in the market is centred around higher-end users contracting higher speeds and/or fixed broadband bundled with other services.
Despite the progress made, in most developing countries the cost of a fixed-broadband plan represents more than 5 per cent of GNI per capita
In line with the reduction of fixed-broadband prices in PPP$ and USD, entry-level fixed-broadband plans are becoming more and

Executive Summary
30
more affordable: they fell from an average price representing 94 per cent of GNI p.c. in 2008 to 18 per cent of GNI p.c. in 2013 (Chart 4.1).
Despite the progress made in improving the affordability of fixed-broadband services, the average price for an entry-level fixed-broadband plan still represented 26 per cent of GNI p.c. in the developing world at end 2013. Moreover, in most developing countries the price of fixed-broadband services corresponds to more than 5 per cent of GNI p.c.
Mobile broadband in developed countries is six times more affordable than in developing countries
Mobile-broadband plans are becoming more and more available, particularly in developing countries, where around 20 per cent more countries were offering mobile-broadband plans in 2013 than in 2012. Prepaid plans are slightly more available than postpaid plans in developing countries, whereas the opposite is true in developed countries. Globally, the type of mobile-broadband service available in the most countries is prepaid handset-based, which was offered in 153 countries at end 2013.
The average cost for a handset-based mobile-broadband service with 500 MB monthly data allowance was PPP$ 25 (or USD 17) for prepaid plans and PPP$ 26 (or USD 18) for postpaid plans in 2013. Prices were cheaper compared with computer-based plans with 1 GB monthly data allowance (an average of PPP$ 37 and PPP$ 30 for prepaid and postpaid, respectively) because the monthly data allowance was half as large. Nevertheless, the reduction in price was not proportional to the reduction in the data allowance, confirming that the price per GB is lower for larger data allowances, the equivalent of a volume discount.
Mobile-broadband prices in PPP$ are more expensive in developing countries than in developed countries, for all types of plans. In terms of USD, mobile-broadband services cost almost the same on average in developed and developing countries. This suggests that operators in developing countries still have ample room to streamline their mobile-broadband services and offer cheaper prices.
The differences in mobile-broadband prices between developed and developing countries are even more apparent when looking at the
Chart 4.1: Fixed-broadband prices as a percentage of GNI p.c. (left) and most common entry-level fixed-broadband speed (right), world and by level of development, 2008-2013
Note: Simple averages in the case of the fixed-broadband prices; mode in the case of the entry-level fixed-broadband speeds. Based on 143 economies for which 2008-2013 data on fixed-broadband prices were available.
Source: ITU.
0
1
2
3
2008 2009 2010 2011 2012 2013
Developed
World
Developing
Mb
it/s
25
6 k
bit
/s
25
6 k
bit
/s2
56
kb
it/s
25
6 k
bit
/s
25
6 k
bit
/s2
56
kb
it/s
25
6 k
bit
/s2
56
kb
it/s
25
6 k
bit
/s
1 M
bit
/s
1 M
bit
/s
1 M
bit
/s
2 M
bit
/s
2 M
bit
/s
5 M
bit
/s
1 M
bit
/s
1 M
bit
/s1
Mb
it/s
0
20
40
60
80
100
120
140
2008 2009 2010 2011 2012 2013
Developed
World
Developing
As
a %
of
GN
I p
.c.

31
Measuring the Information Society Report 2014
affordability of the service. Indeed, handset-based mobile-broadband plans with a monthly data allowance of 500 MB are about eight times more affordable in developed countries than in developing countries, on average (Chart 4.2). Computer-based services with a monthly allowance of 1 GB are about six times more affordable in developed countries, on average.
Entry-level mobile broadband is cheaper than fixed broadband in many countries, in particular in Africa
In almost half of the African countries for which price data are available, mobile-broadband services were more than USD 10 cheaper per month than entry-level fixed-broadband services (Chart 4.3). Taking into account the GNI p.c. levels in Africa, such price savings could make the difference between a service being affordable or not. Considering that fixed-broadband infrastructure has a limited reach in several African countries, mobile broadband may thus be the only alternative for broadband access.
In the Arab States and the CIS, there are almost as many countries where mobile broadband is cheaper than entry-level fixed broadband as vice versa. In Asia and the Pacific and the Americas, mobile-broadband prices are significantly cheaper than entry-level fixed-broadband plans in selected countries.
Mobile broadband is cheaper than entry-level fixed-broadband plans in 80 per cent of countries in Europe, and indeed more than USD 10 cheaper per month in one in three countries in the region. Caution must be exercised when interpreting these results, because in practice most fixed-broadband plans allow unlimited data use, whereas most computer-based mobile-broadband plans have a cap of 1 GB. In any event, European countries dominate the global top ten of most affordable mobile-broadband plans, with Austria, Finland and Iceland featuring in the
Chart 4.2: Mobile-broadband prices as a percentage of GNI p.c., world and by level of development, 2013
Note: Simple averages. Based on 119 economies for which data on mobile-broadband prices were available for the four types of plans.
Source: ITU.
Developing
Developed
World
6.4
5.8
8.3
8.5
1.0
1.1
1.2
1.9
8.9
8.0
11.5
11.5
0 2 4 6 8 10 12
Postpaid handset-
based (500MB)
Prepaid handset-
based (500MB)
Postpaid computer-
based (1GB)
Prepaid computer-
based (1GB)
% GNI p.c.
top ten for all categories of mobile-broadband services.
Income inequalities are one of the reasons why fixed broadband remains unaffordable for large segments of the population in developing countries
Household income and expenditure inequalities within countries greatly influence the affordability of fixed-broadband services. The smallest differences were found in Iceland, where an entry-level fixed-broadband plan is 3.5 times more affordable for the richest 20 per cent of the population than for the poorest 20 per cent. Differences are much wider in several developing countries, such as Brazil, Colombia, Honduras, Bolivia and South Africa, where fixed broadband is more than 20 times more affordable for the richest 20 per cent of the population than for the poorest 20 per cent.
Partly owing to household income inequalities, in 40 per cent of countries for which data are available a basic fixed-broadband subscription still represents more than 5 per cent of household income/consumption for over
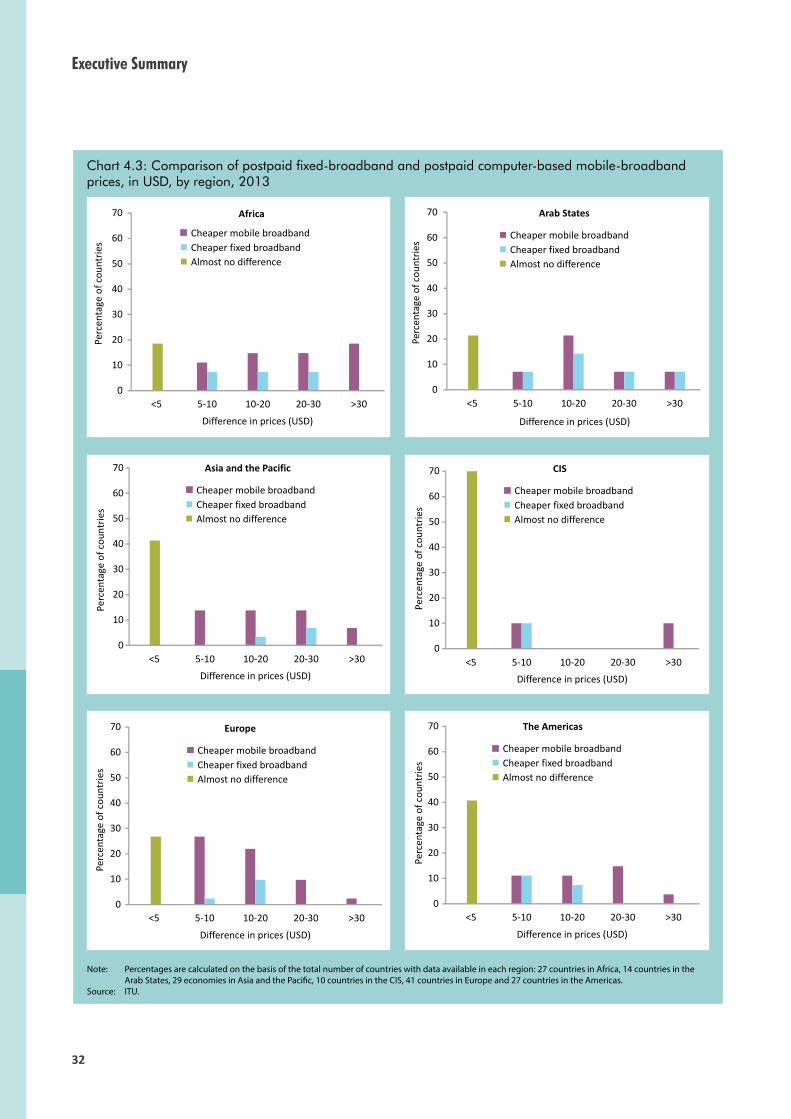
Executive Summary
32
Chart 4.3: Comparison of postpaid fixed-broadband and postpaid computer-based mobile-broadband prices, in USD, by region, 2013
Note: Percentages are calculated on the basis of the total number of countries with data available in each region: 27 countries in Africa, 14 countries in the Arab States, 29 economies in Asia and the Pacific, 10 countries in the CIS, 41 countries in Europe and 27 countries in the Americas.
Source: ITU.
Pe
rce
nta
ge
of
cou
ntr
ies
Africa
Cheaper mobile broadband
Cheaper fixed broadband
Almost no difference
0
10
20
30
40
50
60
70
<5 5-10 10-20 20-30 >30
Difference in prices (USD)P
erc
en
tag
e o
f co
un
trie
s
Arab States
Cheaper mobile broadband
Cheaper fixed broadband
Almost no difference
0
10
20
30
40
50
60
70
<5 5-10 10-20 20-30 >30
Difference in prices (USD)
Pe
rce
nta
ge
of
cou
ntr
ies
Asia and the Pacific
Cheaper mobile broadband
Cheaper fixed broadband
Almost no difference
0
10
20
30
40
50
60
70
<5 5-10 10-20 20-30 >30
Difference in prices (USD)
Pe
rce
nta
ge
of
cou
ntr
ies
CIS
Cheaper mobile broadband
Cheaper fixed broadband
Almost no difference
0
10
20
30
40
50
60
70
<5 5-10 10-20 20-30 >30
Difference in prices (USD)
Pe
rce
nta
ge
of
cou
ntr
ies
Europe
Cheaper mobile broadband
Cheaper fixed broadband
Almost no difference
0
10
20
30
40
50
60
70
<5 5-10 10-20 20-30 >30
Difference in prices (USD)
Pe
rce
nta
ge
of
cou
ntr
ies
The Americas
Cheaper mobile broadband
Cheaper fixed broadband
Almost no difference
0
10
20
30
40
50
60
70
<5 5-10 10-20 20-30 >30
Difference in prices (USD)

33
Measuring the Information Society Report 2014
Table 4.1: Fixed-broadband prices as a percentage of household disposable income (left), and as a percentage of household consumption expenditure (right), selected countries, 2013
Note: Data on household disposable income and consumption expenditure refer to 2011 or latest year available. * ‘Lowest 20%’ refers to the price divided by the average income/expenditure of the first and second income/expenditure deciles. ‘Highest 20%’ refers to the price divided by the average income/expenditure of the ninth and tenth income/expenditure deciles.
Source: ITU. Household disposable income for OECD countries and the Russian Federation based on data from the OECD Database on Income Distribution adjusted with ITU estimates on average persons per household. Household disposable income and consumption expenditure for other countries based on World Bank’s PovcalNet data adjusted with ITU estimates on average persons per household.
Fixed-broadband prices as a % of household disposable income
% households whee fixed broadband
< 5% household income
Country Average Lowest 20%*
Highest 20%*
Ireland 0.37 0.97 0.18 100United Kingdom 0.39 1.06 0.19 100Switzerland 0.45 1.07 0.23 100Luxembourg 0.53 1.14 0.29 100Japan 0.54 1.66 0.27 100Austria 0.57 1.24 0.32 100France 0.65 1.52 0.33 100United States 0.68 2.47 0.31 100Norway 0.69 1.49 0.41 100Finland 0.71 1.50 0.40 100Italy 0.76 2.16 0.39 100Iceland 0.80 1.62 0.47 100Belgium 0.81 1.79 0.46 100Australia 0.82 2.29 0.41 100Netherlands 0.83 1.88 0.44 100Sweden 0.83 1.89 0.47 100Canada 0.84 2.25 0.42 100Greece 0.88 2.61 0.43 100Denmark 0.88 1.83 0.51 100Slovenia 0.92 1.96 0.54 100Korea (Rep.) 1.03 3.10 0.54 100Poland 1.05 2.64 0.54 100Germany 1.06 2.43 0.56 100Portugal 1.27 3.46 0.60 100Czech Republic 1.29 2.62 0.72 100New Zealand 1.35 3.48 0.68 100Slovakia 1.96 4.26 1.11 100Russian Federation 0.59 1.94 0.26 90Israel 1.04 3.81 0.49 90Spain 1.06 3.49 0.53 90Estonia 1.67 4.55 0.85 90Turkey 1.25 4.41 0.53 80Panama 1.39 8.41 0.49 80Brazil 1.53 10.76 0.52 80Uruguay 1.63 6.63 0.64 80Malaysia 1.64 7.22 0.64 80Mexico 1.70 8.42 0.66 80Hungary 3.23 7.13 1.76 80Costa Rica 1.94 10.08 0.69 70Chile 2.23 10.31 0.79 70Colombia 2.89 19.28 0.96 50Peru 3.03 15.52 1.15 50Ecuador 3.06 14.25 1.14 50El Salvador 3.57 19.24 1.34 50Honduras 3.51 34.76 1.17 40Paraguay 3.73 22.86 1.32 40Dominican Rep. 4.94 21.16 1.87 30Bolivia 7.20 67.58 2.43 20
Fixed-broadband prices as a % of household consumption expenditure
% householdswhere fixed broadband
< 5% expenditure
Country Average Lowest 20%*
Highest 20%*
Croatia 1.60 3.98 0.76 100Lithuania 1.76 5.31 0.79 90Tunisia 1.99 5.90 0.93 90Jordan 2.10 5.44 0.96 90Viet Nam 2.42 6.52 1.11 80Romania 2.69 6.08 1.49 80Montenegro 2.74 6.27 1.47 80TFYR Macedonia 2.40 8.89 0.96 70Fiji 2.67 8.60 1.08 70Azerbaijan 2.95 7.39 1.40 70Sri Lanka 2.98 7.72 1.34 70Albania 3.03 7.45 1.41 70Bhutan 3.23 9.58 1.41 60Latvia 3.53 10.11 1.68 60Kazakhstan 3.93 8.62 2.05 60Ukraine 3.76 12.88 1.48 40Egypt 4.65 10.07 2.31 40Sudan 4.84 14.21 2.28 40South Africa 3.40 25.18 1.00 30Thailand 5.19 15.36 2.23 30Georgia 5.35 21.27 2.25 30Bangladesh 5.44 12.25 2.63 30Armenia 5.57 12.63 2.75 30Serbia 5.77 13.80 3.02 30Moldova 5.98 15.32 2.90 30Nepal 6.14 14.84 2.96 20Belarus 6.65 14.16 3.71 20Cambodia 6.87 17.32 3.09 20Philippines 7.92 26.49 3.19 20Côte d'Ivoire 8.11 28.97 3.41 10Lao P.D.R. 8.39 21.95 3.74 10Kyrgyzstan 9.07 23.62 4.38 10Senegal 9.25 30.59 3.95 10Mauritania 9.43 31.33 4.01 10Uganda 15.11 51.74 5.96 10Togo 19.36 64.66 8.47 0Angola 21.73 80.47 8.93 0Burkina Faso 24.26 72.20 10.31 0Mali 27.86 69.92 13.49 0Swaziland 29.34 144.91 10.37 0Nigeria 35.06 119.04 15.21 0Ethiopia 44.45 111.69 21.24 0Zambia 68.76 384.13 22.12 0Madagascar 123.19 455.40 49.14 0Malawi 160.18 568.03 63.87 0Central African Rep. 439.65 2609.18 145.10 0Rwanda 490.31 1900.41 172.52 0

Executive Summary
34
half of the population (Table 4.1). This is the case not only in low-income countries, but also in several countries classified as upper-middle-income economies by the World Bank. In most developing countries for which data on household income or expenditure distribution are available, fixed-broadband plans represent more than 5 per cent of household income/expenditure for large segments of the population.
Mobile broadband may help to connect the 20-30 per cent of households with the lowest incomes for which a fixed-broadband plan is unaffordable
Handset-based mobile-broadband services are affordable for the large majority of the population in all developed countries, suggesting that income inequality is less of an issue for accessing mobile-broadband services in the developed world.
The affordability of prepaid handset-based mobile-broadband services differs considerably across developing countries, and within some developing countries, due to household income inequalities. In Latin American, for example, the cost of handset-based mobile-broadband services in countries such as Ecuador, El Salvador, Honduras and Paraguay corresponds to less than 1.5 per cent of household disposable income for the richest 20 per cent of the population, but more than 15 per cent of household disposable income for the poorest 20 per cent. Other developing countries that are in a similar situation because of household income and expenditure inequalities include Sudan, Philippines and Nepal. In Africa, handset-based mobile-broadband prices are affordable (i.e. represent less than 5 per cent of household expenditure) for less than 40 per cent of the population in every country for which data are available.
A comparison of fixed-broadband and prepaid handset-based mobile-broadband prices shows that mobile broadband may be the only affordable alternative for low-income households in several developing countries. For instance, for more than 40 per cent of the population in Belarus, Cambodia, Georgia, Moldova, Serbia and Thailand, a handset-based mobile-broadband plan corresponds to less than 5 per cent of household expenditure, whereas a basic fixed-broadband plan is more expensive. In other developing countries where fixed-broadband services are affordable for most of the population, mobile broadband
Chart 4.4: Evolution of prices and competition in fixed-broadband markets (top), and mobile-cellular markets (bottom), 2008-2013
Note: Simple averages for 140 economies with available data on fixed-broadband prices, mobile-cellular prices and competition for the period 2008-2013.
Source: ITU. Herfindahl-Hirschman Index (HHI) data sourced from Informa.
0
10
20
30
40
50
60
70
80
90
100
0.48
0.50
0.52
0.54
0.56
0.58
0.60
2008 2009 2010 2011 2012 2013
Fixed-broadband basket
as a % of GNI p.c.
HHI fixed (competition)
+
-
HH
I fi
xed
bro
ad
ba
nd
(co
mp
eti
tio
n)
Fix
ed
-bro
ad
ba
nd
ba
ske
t a
s %
of
GN
I p
.c.
+
-
HH
I m
ob
ile
(co
mp
eti
tio
n)
Mo
bil
e-c
ell
ula
r b
ask
et
as
% o
f G
NI
p.c
.
0
1
2
3
4
5
6
7
8
9
0.40
0.41
0.42
0.43
0.44
0.45
0.46
0.47
0.48
2008 2009 2010 2011 2012 2013
Mobile-cellular basket as
a % of GNI p.c.
HHI mobile (competition)

35
Measuring the Information Society Report 2014
Chart 4.5: Variation in fixed-broadband prices (%) explained by each variable, 2013
Note: Calculated taking as a reference the average of each variable and adding a standard deviation. In each case, the percentage displayed is the relative difference in fixed-broadband prices that would be obtained keeping all other variables constant. The calculation does not take into consideration the region fixed effects. All variables are negatively correlated with prices (i.e. an increase in their value is linked to a decrease in prices), except GNI p.c., which is positively correlated with prices. GNI p.c. and % urban population are correlated, so the explanatory power of these variables needs to be considered together.
Source: ITU.
0
5
10
15
20
25
GNI p.c. Fixed-
broadband
cap
Regulation(clusters 1-3Regulatory
Tracker)
% urbanpopulation
Competition(HHI)
%
may help to connect the 20-30 per cent of households with the lowest incomes, for which a fixed-broadband plan may be unaffordable, but which could afford a mobile-broadband plan. This could be the case in countries such as Albania, Azerbaijan, Kazakhstan, Sri Lanka and TFYR Macedonia.
Market competition is one of the main drivers of affordable prices in telecommunication services
From the supply side, the price of ICT services is linked to regulation and competition. As shown by Chart 4.4, the fall in both entry-level fixed-broadband prices and entry-level mobile-cellular prices coincides with an increase in competition in the respective markets in the period 2008-2013.
Fixed-broadband prices could be reduced by 10 per cent if competition and the regulatory framework in developing countries improved
Of all the important elements in the analysis of the affordability of ICT prices, competition and regulation are those upon which telecommunication administrations may exert more direct control, and they therefore merit particular attention.
Based on an econometric model and data for up to 144 countries for the five-year period from 2008 to 2013, it can be concluded that factors that are purely attributable to the telecommunication sector, such as operators’ strategies on data caps, competition in the fixed-broadband market and the ICT regulatory environment, are together more of a determinant for fixed-broadband prices than exogenous factors, such as overall levels of economic development (Chart 4.5). Thus, policy-makers and regulators can contribute significantly to setting the conditions for more affordable fixed-broadband prices, particularly in those developing countries where fixed-broadband prices remain unaffordable for the majority of the population.
According to the results of the econometric model, if fixed-broadband markets in developing countries were to achieve the competition levels of developed countries, entry-level fixed-broadband prices could be reduced by as much as 10 per cent in the developing world. Furthermore, if the regulatory framework in developing countries converged on that prevailing in developed countries, fixed-broadband prices could be reduced by as much as 9.7 per cent. This highlights the importance of an enabling regulatory environment for affordable fixed-broadband prices. Although there is no one-size-fits-all approach, international regulatory best practices, such as the ones adopted by the global community of regulators at meetings of the ITU Global Symposium for Regulators (GSR) and reflected in the ITU ICT Regulatory Tracker, may serve as a guideline for effective regulatory frameworks which can lay the foundations for affordable fixed-broadband services.

Executive Summary
36
An increase in competition in developing countries could lead to a reduction of mobile-cellular prices by 5 per cent
Differences in mobile-cellular prices across countries are smaller than differences in fixed-broadband prices, and competition is stronger in mobile-cellular markets. Nevertheless, according to the results of the econometric model, if mobile-cellular markets in developing countries were to achieve the competition levels prevailing in developed countries, mobile-cellular prices could be reduced by up to 5 per cent in the developing world.
Differences in the regulatory environment have less of an impact in setting mobile-cellular prices, since regulation in most countries is already open enough to allow competition. Regulatory efforts should be focused on ensuring that higher levels of competition are achieved, particularly in those countries where dominant operators still hold market shares of over 60 per cent, thus limiting the possible benefits that competition may yield in terms of more affordable prices for customers. Efficient spectrum allocation and assignment could allow the entry of new players or the consolidation of stronger alternative operators and thus help to spur competition in some markets, even if penetration levels are already high.

37
Measuring the Information Society Report 2014
Chapter 5. The role of big data for ICT monitoring and for development
One of the key challenges in measuring the information society has been the lack of up-to-date and reliable data, in particular from developing countries. The ICT sector is evolving rapidly, as are the types of service and application that are driving the information society, all of which makes identifying and tracking new trends even more challenging. For example, too little information is available about the types of activity that the Internet is used for, and little is known about the Internet user in terms of age, gender, educational or income level, and so on. In other areas, such as education, health or public services, even fewer data are available to show developments over time and enable informed policy decisions. The emergence of big data holds great promise to complement the existing, but often limited, ICT data.
Big data are the result of an increasingly digitized world
The term “big data” usually refers to datasets whose volume, velocity or variety is very high compared to the kinds of datasets that have traditionally been used. The emergence of big data reflects advances in technology that make it possible to capture, store and process increasing amounts of data from different data
sources. Indeed, one of the key trends fostering the emergence of big data is the massive “datafication” and digitization, including of human activity, into digital “breadcrumbs” or “footprints”. In an increasingly digitized world, big data are generated in digital form from a number of sources. They include administrative records (for example, bank or electronic medical records), commercial transactions between two entities (such as online purchases or credit card transactions), sensors and tracking devices (for example, mobile phones and GPS devices), and activities carried out by users on the Internet (including searches and social media content). Apart from volume, velocity and variety, big data characteristics also include veracity, as well as value, which refers to the potentially high socio-economic value that it may generate (Figure 5.1).
Big data hold great promise for improving the timeliness and completeness of official statistics
Big data have great potential to help produce new and insightful information, and there is a growing debate on how businesses, governments and citizens can maximize the benefits of big data. Although it was the private sector that first used big data to enhance

Executive Summary
38
efficiency and increase revenues, the practice has expanded to the global statistical community. The United Nations Statistical Commission (UNSC) and national statistical offices are looking into ways of using big data sources for official statistics and to better fulfil their mandate of providing timely and relevant evidence for policy-making.
Big data from the ICT sector are already being used for formulating social and economic development policy
One of the richest sources of big data is the data captured through the use of ICTs. This broadly includes data captured directly by telecommunication operators, as well as by Internet companies and by content providers such as Google, Facebook, Twitter, etc. Big data from the ICT services industry are already helping to produce large-scale development insights of relevance to public policy, such as understanding socio-economic well-being and poverty (Box 5.1), forecasting unemployment and analysing societal ties. ICT-related big data, in particular mobile network data, play a particularly important role because they are the only stream of big data with global socio-economic coverage.
Data from mobile operators are real-time and low-cost, and are an area with huge development potential
Data from mobile operators offer a low-cost, high-resolution and real-time view of an individual’s behaviour. Each time a user interacts with a mobile operator, many details of the interaction are captured, creating a rich dataset relating to the consumer. Topping up airtime, making calls and sending SMSs, downloading applications or using value-added services are all examples of interactions for which the time, location, device, user and other detailed information are captured in the operator’s system. From these interactions, information about a subscriber’s identity, movement patterns, social relationships, finances and even ambient environmental conditions can be extracted. In addition to the fact that these data are uniquely detailed and tractable, the information captured cannot easily be derived from other sources on such a scale. The fact that the format of the data is relatively similar across different operators and countries creates huge potential for the global scaling of any application found to have significant benefits.
Figure 5.1: The five Vs of big data
Source: ITU.
VOLUME
VARIETY VERACITYVast amounts
of datagenerated through
large-scaledatafication
and digitization of information
Differenttypes and forms of
data, including large amounts of unstructured data
Level ofquality,
accuracy anduncertainty of data and data
sources
VALUE
Potential of big data forsocio-
economicdevelopment
VELOCITY
Speed at whichdata are
generated and analyzed

39
Measuring the Information Society Report 2014
Box 5.1: Poverty mapping in Côte d’Ivoire using mobile-network data
In Côte d’Ivoire, researchers used mobile-network data (specifically communication patterns, but also airtime credit purchase records) from Orange to estimate the relative income of individuals, as well as the diversity and inequality of income
levels. The research helped to understand socio-economic segregation at a fine-grained level for Côte d’Ivoire, with the following map showing poor areas (in blue) in relation to the areas of high economic activity (yellow to red areas).
Source: Gutierrez et al. (2013).
Figure Box 5.1: High-and low-income areas in Côte d’Ivoire
Abidjan
Road to Ghana
Liberian border
Roads to Mali and
Burkina Faso
0.53
0.73
1.02
1.44
Average reload (top-up)
amount, by geographic
location (USD)
Urban areas
Roads
Big data could reveal new insights into the digital divide
In today’s hyperconnected digital world, there is a case to be made for analysing big data from the ICT sector to improve monitoring of the information society. Mobile subscription data provide mobility profiles, and could be further broken down to understand the utilization of services – including voice, data and value-added services (VAS) – over time. Mobile operators are able to provide information not only on the different technologies (3G, LTE-Advanced, etc.), but also on the types of service, that subscribers are using, and the frequency and intensity of that use. They could, therefore, potentially reveal Internet and VAS usage patterns between rural and urban areas, and
pinpoint the kinds of application or webpage that mobile-Internet users access. Combined with individual subscriber characteristics, this information could yield new and rich insights into the digital divide, and help understand usage patterns, including intensity of use, by gender, socio-economic status and also location.
Pooling big data from different sources could lead to new indicators and insights
Mobile-operator data could be combined with customer information from popular online services, such as Facebook, Google or other, local (financial, social etc.) services so as to provide additional insights, including on online activities and customer profiles. In addition, big data

Executive Summary
40
techniques could help extrapolate the actual number of unique mobile subscribers or users, rather than just subscriptions, by comparing subscription numbers to user numbers derived from household surveys, and by taking into account usage patterns or data from popular Internet companies such as Google or Facebook. By linking data collected from different sources and combining subscription data and usage patterns, a correlation algorithm could be developed to reverse engineer approximate values for these indicators, for example to estimate user numbers in the intervals between surveys, and possibly in real time, or to improve estimation techniques for countries that do not carry out surveys. This would require telecommunication operators, OTT providers and other Internet content providers, and NSOs, to work together and share information.
Big data proof of concept studies must be brought to a replicable scale
While there have been a number of interesting research collaborations and some promising proof-of-concept studies in the field of big data, no significant programme has yet been brought to a replicable scale. Future efforts will have to overcome a number of barriers to scale, including the development of models which protect user privacy while still allowing for the extraction of insights that can serve development purposes, particularly where those in most need, including low-income populations, are concerned. Very limited information is available on the possibility of using big data to complement official ICT statistics. Although this report highlights some of the big data sources and techniques that could be employed, further research is needed in order to understand and confirm the usefulness of big data sources for monitoring the information society.
Privacy issues remain the biggest challenge to big data
Attempting to extract value from an exponentially growing deluge of data of varying
structures and types comes with its share of challenges. The most pressing concerns are those associated with the standardization and interoperability of big data analytics, as well as with privacy, security and continuity. Addressing these concerns with respect to data sharing and use is critical, and it is important for big data producers and users to collaborate closely in that regard. This includes raising awareness about the importance and prospects of producing new insights, and the establishment of public-private partnerships to exploit fully the potential of big data for development.
Big data can complement but not replace official statistics
Big data will not replace official statistics, since the latter will continue to be required in order to build models using big data sources and for periodic benchmarking so that new models can be fine-tuned to reflect ground realities. Surveys and other official datasets will remain important to sharpen the analyses, to build and test correlations, to verify the underlying assumptions used to build big data analysis and to validate big data results.
International stakeholders have to work together to understand the role of big data
International stakeholders – including UN agencies and initiatives (such as ITU and UN Global Pulse), the Partnership on Measuring ICT for Development, ICT industry associations and producers of ICT big data – have an important role globally. More work is needed to understand fully the potential of big data and examine the challenges and opportunities related to big data in the ICT sector. Where using big data for monitoring the information society is concerned, new partnerships, including public-private partnerships between data providers and the ICT statistical community, including ITU, could be formed to explore new opportunities and address challenges, including in the area of international data comparability and standards. As one of the

41
Measuring the Information Society Report 2014
main international bodies working on issues related to the telecommunication sector, ITU could also leverage its position to facilitate global discussion on the use of big data from the telecommunication industry for monitoring the information society.
Public-private partnerships will play an important role in harnessing the potential of big data from the ICT industry
Cooperation between different big data producers and big data users is important in order to identify opportunities and understand needs and constraints, to benefit from the pooling of different datasets and to raise awareness about the importance and potential
of producing new insights. Since many of the big data sources lie within the private sector, close cooperation between NSOs, on the one hand, and telecommunication operators and Internet companies, including search engines and social networks, on the other, is necessary and could be institutionalized through public-private partnerships. In particular, NSOs, given their legal mandate to collect and disseminate official statistics and set statistical standards, have an important role to play. They could become standards bodies and big data clearing houses at the national level that promote analytical best practices in relation to the use of big data for complementing official statistics and for development.


International Telecommunication UnionTelecommunication Development Bureau
Place des NationsCH-1211 Geneva 20
Switzerland
www.itu.int
Printed in SwitzerlandGeneva, 2014
Photo credits: Shutterstock
9 7 8 9 2 6 1 1 5 3 3 1 1
ISBN 978-92-61-15331-1
Measuring the Information
Society Report2014
Executive Summary
Mea
surin
g th
e In
form
atio
n So
ciet
y Re
port
201
4 –
Exe
cutiv
e Su
mm
ary