Embed Size (px)
Citation preview

MEASURING THE FREQUENCY OF INNER EXPERIENCE 1
Measuring the Frequency of Inner Experience Characteristics
Russell T. Hurlburt, Christopher L. Heavey, Leiszle Lapping-Carr,
Alek E. Krumm, Stefanie A. Moynihan, Cody Kaneshiro,
Vincent P. Brouwers, Dio K. Turner II, and Jason M. Kelsey
Department of Psychology, University of Nevada, Las Vegas
This manuscript accepted by Perspectives on Psychological Science, 2021. Please do not
quote this manuscript; quote the published version:
https://doi.org/10.1177/1745691621990379
Author Note
Russell T. Hurlburt 0000-0003-4672-2562
Christopher Heavey 0000-0002-2970-5237
Leiszle Lapping-Carr 000-0002-0538-6999
Alek E. Krumm 0000-0002-7737-6829
Cody Kaneshiro 0000-0001-9781-0090
Vincent Brouwers 0000-0002-2936-2422
Correspondence concerning this article should be addressed to Russell T. Hurlburt,
Department of Psychology, University of Nevada, Las Vegas, 4505 S. Maryland Parkway, Las
Vegas, NV 89154-5030. Email: [email protected]
MEASURING THE FREQUENCY OF INNER EXPERIENCE 2
Abstract
Inner experience is widely accepted by psychologists and lay people as being straightforwardly
observable: inner speech, visual images, feelings and so on are understood to be directly
apprehendable “before the footlights of consciousness.” Many psychologists hold that such
characteristics of inner experience play substantial theoretical roles and have applied significance
across a wide range of cognitive, affective, performance, and clinical situations. If so, the
frequency of occurrence of these characteristics is of fundamental importance. Such frequencies
are usually estimated by questionnaires or by questionnaire-based experience sampling.
However, there are reasons to wonder about the accuracy of such questionnaire-based estimates.
We present three studies that compared, head-to-head, questionnaire-based experiential
frequencies with frequencies discovered using descriptive experience sampling (DES), a
random-sampling-in-the-natural-environment method that aspires to apprehend inner experience
with as high fidelity as the state of the art allows. Together, they suggest that estimates of inner-
experience frequency produced by questionnaires and DES are irreconcilably discrepant:
Questionnaire-based methods produced dramatically higher (from two to four times as high)
frequencies than did DES. These results suggest caution when interpreting questionnaire-based
experiential results and the importance of additional high-fidelity studies of inner experience.
KEYWORDS: Inner experience; questionnaire; experience sampling; descriptive experience
sampling; inner speech; self-talk
MEASURING THE FREQUENCY OF INNER EXPERIENCE 3
Measuring the Frequency of Inner Experience Characteristics
Most people (including most behavioral scientists) accept that inner experiences (inner
speech, visual imagery, feelings, etc.) exist as naturally occurring, directly apprehendable
phenomena. Lay references to such inner phenomena are ubiquitous, as when the TV reporter
asks, “How did you feel when you…?” or “What were you thinking when you…?”
Psychologists writing about inner speech typically begin with a sentence such as “Inner speech is
the little voice in the head” (Langland-Hassan et al., 2015, p.1), implying that such little voices
are familiar phenomena. “No author ever denies the experiential aspects of [visual] imagery”
(Runge et al., 2017), even though they might disagree about imagery information processing
(Kosslyn, 1994). Experience-sampling probes such as “At the time of the beep, my mind had
wandered” (Kane et al., 2007, p. 616) imply that participants have direct access to their mind
wandering. Psychologists generally agree that emotion has an experiential “feeling” aspect
(Rottenberg & Gross, 2003; Watson, 2000). Psychiatric diagnosis depends on accounts of
distressing thoughts and feelings. In short: People are generally understood as having direct
access to (at least some of) their inner phenomena.
There are, broadly speaking, two widely used methods to investigate the frequencies of
inner phenomena: questionnaires and questionnaire-based experience sampling. Questionnaires
about frequency typically present straightforward, face-valid queries such as, “How often do you
experience an inner voice when you read?” (Moore & Schwitzgebel, 2018, p. 59). Such
questions presume that the respondent not only has direct immediate access to the phenomenon
of interest but also has retrospective knowledge about such phenomena and the skill to estimate
their frequencies.

MEASURING THE FREQUENCY OF INNER EXPERIENCE 4
Because the problematics of such retrospection and frequency-estimation processes are
well known, some investigators use experience-sampling methods, which reduce retrospection
by beeping participants in their natural environments and presenting questionnaire-like items that
inquire whether specified kinds of experience were ongoing (e.g., “In the final split second
before the beep”; Moore & Schwitzgebel, 2018, p. 61) or recent (e.g., “Over the last two hours”;
Brinthaupt et al., 2015, p. 5, emphasis in original). Such questionnaire-based experience
sampling eliminates the need for participants’ frequency estimations: investigators compute
frequencies from the proportion of Yes responses.
These methods have been validated by comparing questionnaire and experience-sampling
results. For example, Moore and Schwitzgebel (2018) found the frequency of self-talk while
reading averaged about 60% whether estimated by participants on retrospective self-report
questionnaires (“How often do you…?”) or by tallying online questionnaire-based experience
sampling responses (“In the final split-second before the beep were you…?”).
Brinthaupt et al. (2015) investigated self-talk in a variety of situations both by
questionnaire and questionnaire-based experience sampling. Using the Self-talk Scale (STS;
Brinthaupt et al., 2009) questionnaire, which uses Likert-scale frequency ratings from 1 = never
to 5 = very often on items such as “I talk to myself when I feel ashamed of something I’ve done,”
they found that self-talk was reported as occurring in about 58% of situations. Similarly, when
using experience sampling, they found that self-talk occurred in about 65% of situations: they
delivered randomly-timed text messages asking participants to respond Yes or No to modified
STS items about pre-defined situations (e.g., “Over the last two hours, I have been in a situation
where I feel ashamed of something I’ve done”). If participants responded Yes (that the situation
had occurred), they were prompted to respond Yes or No to “Did you talk to yourself (either

MEASURING THE FREQUENCY OF INNER EXPERIENCE 5
silently or aloud) during or immediately after the situation occurred?” (Brinthaupt et al., 2015, p.
5).
Thus, despite their very different contexts (while reading or in specified situations) and
very different experience-sampling methods (immediately after the event vs. over the past two
hours), these studies produced very similar results: whether by questionnaire or questionnaire-
based experience sampling, self-talk occurred roughly two-thirds of the time.
Such consistency might suggest that self-talk actually occurs roughly two-thirds of the
time across a wide variety of situations, and that questionnaires and questionnaire-based
experience sampling are adequate measures of that frequency. However, Hurlburt and Heavey
(2006, 2015) claimed that people are often mistaken about the nature of their own inner
experience and are therefore unlikely to answer accurately such questions as “How often do
you…?” Hurlburt and Heavey worried that people’s characterizations of their inner experiences
on questionnaires or questionnaire-based experience sampling may reflect situational demands
and presuppositions about inner experience rather than their actual experienced phenomena. For
example, participants who believe that self-talk is frequent or omnipresent would likely respond
very often to the STS questionnaire items and Yes to the modified-STS experience-sampling
items regardless of whether self-talk actually occurs often or in the last two hours. This worry
parallels Sherlock Holmes’ “insensibly [they would] begin to twist facts to suit theories, instead
of theories to suit facts” (Doyle, 1900/2019, p. 3).
There are, broadly speaking, three strategies for dealing with this worry (Hurlburt &
Heavey, 2001): accede to the worry and bar from science all reports of inner experience;
overlook the worry and act as if people know their inner experience; or confront the worry head
on by trying, in principled ways, to reduce the effect of situation and presuppositions and thus to
MEASURING THE FREQUENCY OF INNER EXPERIENCE 6
obtain samples of inner experience apprehended with high fidelity. Hurlburt and his colleagues
developed descriptive experience sampling (DES; Hurlburt, 1990, 1993, 2011; Hurlburt &
Heavey, 2006; Caracciolo & Hurlburt, 2016) in that third spirit.
Unlike questionnaire-based experience sampling, DES uses an iterative-training,
presupposition-bracketing interview method that aspires to obtain a high-fidelity description of
each at-the-moment-of-the-beep experience. DES is described more fully in the accompanying
Online Supplemental Materials: Box S1 provides a case-study illustration of DES—how it works
and why its results can be surprising. Box S2 shows that DES is very different from eyewitness
testimony because DES “witnesses” are iteratively trained and prepared rather than taken by
surprise by a one-time occurrence. Box S3 shows that DES avoids the false memories of the
kind discussed by Loftus (2005) because typical false memories are for distantly past rather than
immediate events. Box S4 shows that DES avoids the kinds of pressures on participants’ reports
discussed by Ross and Nisbett (1991) and others by including substantial channel-opening
factors. Box S5 provides a discussion of memory and use of the DES notebook.
Box S6 discusses the aspirational goal of apprehending inner experience with fidelity. In
brief, fidelity refers to “faithfulness to the original”; apprehending inner experiences with fidelity
refers to the creation of deft and unbiased (to the extent possible) descriptions of experiences that
actually transpired but could be directly apprehended only by the experiencers themselves.
Setting aside for now the important question of the extent to which DES investigators actually
achieve that goal, we note that DES requires substantially more effort and investigator skill than
do either questionnaires or questionnaire-based experience-sampling methods (McKelvie, 2019).
Furthermore, DES presents experiential science with far more difficulties (such as establishing
the credibility of an investigator) than are present with questionnaire-based methods. Therefore,

MEASURING THE FREQUENCY OF INNER EXPERIENCE 7
science should examine whether DES produces results that are substantially similar to
questionnaire-based methods. If so, then science can rely on questionnaires and use the labor-
intensive DES only rarely, perhaps only as a validating criterion for questionnaire-based
measures. If the results are substantially discrepant, however, then behavioral science will have
to sort out the differences among the methods and the conditions under which each is
appropriate.
There has been one pair of studies that allows a rough comparison of questionnaire,
questionnaire-based-experience-sampling, and DES. Recall that Moore and Schwitzgebel (2018)
found both by questionnaire and by questionnaire-based experience sampling that self-talk
occurred about 60% of the time when people were reading. By contrast, Brouwers et al. (2018)
found using DES that self-talk occurs only about 3% of the time while reading. That huge
discrepancy suggests that the difference between questionnaire-based methods and DES might
be substantial. However, that interpretation is confounded by methodological differences (e.g.,
recruiting methods, reading material). Furthermore, reading is a specialized situation, so
generalizing to everyday non-reading experience is questionable. It is therefore desirable to
attempt a comparison of questionnaire-estimated frequency and DES-based frequency that limits
these potential confounds.
Three Studies Comparing Questionnaires and DES
We present here three studies that directly compare questionnaires and DES; such head to
head comparisons have never (to our knowledge) been attempted. (Supplemental Box S7
explains why we did not also compare questionnaire-based experience sampling.)
Our studies used two questionnaires, the STS (Self-Talk Scale) and the Nevada Inner Experience
Questionnaire (NIEQ; Heavey et al., 2019). We used the STS to allow replication of Brinthaupt

MEASURING THE FREQUENCY OF INNER EXPERIENCE 8
et al. (2015). We used the NIEQ to generalize beyond self-talk and because it has three features
that allow a direct comparison to DES frequencies: (a) The NIEQ measures the same five
frequent phenomena (5FP; Kühn et al., 2014) that DES studies typically discover: inner speaking
(a.k.a. inner speech); inner seeing (a.k.a. seeing images); unsymbolized thinking; feelings; and
sensory awareness (see supplemental Box S8 for a description of these phenomena); (b) the
NIEQ inquires directly about experiential frequencies whereas other questionnaires conflate
frequency and other variables (e.g., the STS inquires about self-talk in specific situations but
does not measure the frequency of those situations); and (c) the NIEQ asks for frequency
estimates by using visual-analogue scales with unambiguous anchors such as from Never to
Always, whereas other questionnaires use Likert-type scales with ambiguous anchors (e.g., the
STS endpoint is very often).
Our three studies ask: to what extent are the frequencies of inner experience as measured
by questionnaires similar to the natural-environment frequencies measured by the fidelity-
aspiring DES method? The method details for studies 1, 2 and 3 are found in Supplemental
Boxes S9, S10, and S11 respectively. Table 1 provides a comparative overview of the three
studies.
Study 1 is a conceptual replication of Brinthaupt et al.’s (2015) study 2, which
administered the STS questionnaire to a large screening group, selected participants whose STS
scores were in either the upper or the lower quartile, and then engaged them in experience
sampling using items modified from the STS. Brinthaupt and colleagues found, via experience
sampling (and as predicted), that the high-STS group reported more self-talk (73%) than did the
low-STS group (54%). Our replication differs from Brinthaupt et al. in three ways. First, we
considered not only self-talk but also the 5FP (inner speaking, inner seeing, unsymbolized

MEASURING THE FREQUENCY OF INNER EXPERIENCE 9
Table 1
All studies: Comparing the methods
Study 1 Study 2 Study 3
Method Supplemental Box S9 Supplemental Box S10 Supplemental Box S11
Rationale Conceptual replication of
Brinthaupt et al.’s (2015)
STS validity study except we
used DES whereas
Brinthaupt et al. used
questionnaire-based
experience sampling
Replication of study 1
except without
stratification
Replication of study 2
except in a clinical
sample to extend
generalizability and no
specific focus on self-talk
Analysis Between methods
(questionnaire vs. DES;
within subjects). Also
between groups (high-STS
subjects vs. low-STS
subjects)
Between methods
(questionnaire vs. DES;
within subjects)
Between methods
(questionnaire vs. DES;
within subjects)
Screening
population
N = 260 subject pool
volunteers who took the STS
and NIEQ
N = 60 subject pool
volunteers who took the
STS and NIEQ
N = 43 community
mental health center
prospective clients
Sampling
participants
N = 16, stratified into two
groups. The “high-STS
group” (N = 10) was a
random sample from the STS
upper quartile (STS score >
66; mean STS percentagea =
86.6%). The “low-STS
group” (N = 6) was a random
sample from the STS lower
quartile (STS score < 52;
mean STS percentage =
40.6%).
N = 12, randomly
chosen, no stratification
N = 13, volunteers
Questionnaires
administered
STS and NIEQ STS and NIEQ NIEQ
Sampling
method
DES in the natural
environment
DES in the natural
environment
DES in the natural
environment
Coding method Both phenomenological and
inclusive
Phenomenological Phenomenological
Sampling days 4 5 4 to 8
Number of
samplesb
270 270 456
Samples per
participantc
16.88 22.50 35.08
a STS percentages were derived from STS total score following Brinthaupt et al. (2015, p. 6):
STS percentage = 100 × (STS total − 16)/64. b Excluding first day as training c Mean, excluding first day

MEASURING THE FREQUENCY OF INNER EXPERIENCE 10
thinking, feelings, and sensory awareness); we therefore used not only the STS but also the
NIEQ. Second, we obtained frequency estimates from an unambiguous visual-analogue
questionnaire (the NIEQ) instead of relying only on the ambiguous STS. Third, we used a
fidelity-aspiring experience-sampling method (DES) instead of a questionnaire-based
experience-sampling method (items modified from the STS).
Briefly, each participant wore a beeper which delivered six random beeps in the
participant’s natural environment. Within 24 hours, at least two investigators conducted an
“expositional interview” with the participant; the interview asked, “What, if anything, was in
your experience at the moment of the beep?” followed by clarifying and disambiguating
questions designed to bracket presuppositions and iteratively improve the participant’s skills.
Then within 24 hours of the interview, the interviewers wrote a “contemporaneous description”
of each sampled experience. This natural-environment-sampling-followed-by-interview process
was repeated three additional times.
Because of the increase in bracketing-presupposition and attending-to-experience skills
fostered in the first expositional interview, the participant’s second-day sampling was likely to be
more skillful than was the first-day sampling, the second-day expositional interview was likely to
be more focused than was the first-day interview, and so on, iteratively, across subsequent days
(Hurlburt, 2009).
After an individual completed their four days of sampling, the investigators met to review
all of that individual’s samples and briefly characterize the phenomena present for each sampled
experience. Then, each sampled experience was independently coded for the presence (= 1),
absence (= 0), or partial or possible presence (= .5) of self-talk and each of the 5FP by three
investigators who had participated in the interviews. The coding procedure is more completely

MEASURING THE FREQUENCY OF INNER EXPERIENCE 11
described in Supplemental Box S9b. Inner speaking was coded in two ways: phenomenological
and inclusive. In general, speaking includes the (1) experience of words, (2) the experience of a
voice, and (3) the experience of producing the speaking. Phenomenologically, speaking is
distinguished from, for example, hearing: your own voice is experienced as speaking when you
talk into a tape recorder and as being heard when the same utterance is played back. DES
typically defines inner speaking in that same way, so we coded phenomenological inner speaking
in a way that excludes inner hearing. However, many researchers consider inner speech to be
heard, so we also coded inclusive inner speaking in a way designed to cast as wide a net for inner
speech as is reasonable, including any instance where the participant’s own words were innerly
present regardless of whether those words were innerly spoken, innerly heard, or innerly present
without being spoken or heard.
Brinthaupt et al. (2009) defined self-talk as including either aloud self-talk or inner
speaking. Therefore we coded aloud self-talk and calculated (total) self-talk as occurring if an
experience included either aloud self-talk or inner speaking (or both).
Thus three investigators independently coded each sample for seven phenomena: inner
speaking (phenomenological), inner speaking (inclusive), inner seeing, unsymbolized thinking,
sensory awareness, feelings, and aloud self-talk.
Study 2 replicated study 1 except there was no stratification, thus ruling out the
possibility that the study-1 participant selection-from-the-extremes stratification might have had
unintended effects on some inner-experience characteristics. Study 2 also eliminated the focus on
self-talk because study 1 had shown very similar results for self-talk and the 5FP’s inner
speaking; similarly, study 2 eliminated the inclusive coding because the study-1 inclusive coding
showed the same pattern of results as did the phenomenological coding.

MEASURING THE FREQUENCY OF INNER EXPERIENCE 12
Study 3 replicated study 2 except with a clinical (non-subject-pool) sample, thus
extending the study’s generalizability. Studies 2 and 3 are parts of larger unpublished studies
(see Supplemental Box S12).
Reliability of DES
Supplemental Box S13 describes three ways that we evaluated the adequacy of our DES
implementation in study 1. Briefly: (a) three independent coders provided 1890 codings (270
samples × 7 codings each); they unanimously agreed on 1782 of them (94%). (b) For each
participant, we computed the self-talk and the 5FP DES mean ratings separately for the odd-
numbered and even-numbered samples. The first row of Table 2 shows the split-half-derived
Spearman-Brown-corrected reliabilities of these DES measurements. (c) Supplemental Table S1
shows that the study-1 intercorrelations between DES 5FP measurements are relatively small.
The second and third rows of Table 2, and Supplemental Tables S2 and S3, show parallel results
for studies 2 and 3.
These reliabilities are very high for self-talk and inner speaking and acceptable for the
other coded phenomena. The off-diagonal correlations are small in Supplemental Tables S1, S2,
and S3, as is desirable. The conclusion: Whatever DES measures, it does so reliably.
Comparing Questionnaires and DES
There are two main features of study 1’s replication of Brinthaupt et al. (2015): the
between-method comparison (questionnaire vs. DES) and the between-group comparison (high-
STS vs. low-STS). Because our primary focus here is on between-method comparisons, we
describe the between-group results in Supplemental Box S14. Briefly, our study 1 found, unlike
Brinthaupt et al. (2015), no statistically significant difference in DES-discovered self-talk

MEASURING THE FREQUENCY OF INNER EXPERIENCE 13
Table 2
All studies: Spearman-Brown-corrected (split-half) DES reliabilities
Note. N partic. = number of participants; N samp. = mean number of samples per participant;
ISpeaking = Inner speaking; ISeeing = Inner seeing; UnsTh = Unsymbolized thinking;
SensAw = Sensory awareness.
a Self-talk measured only in study 1
b All means weighted by df.
between our high-STS and low-STS groups, regardless of whether self-talk was coded
phenomenologically or inclusively.
The between-method (questionnaire vs. DES) comparison for the 16 DES participants of
our study 1 is shown in Table 3. The first row shows the questionnaire descriptive statistics; its
first entry shows the STS percentage (replicating Brinthaupt) and the remaining entries show the
NIEQ percentages. Note that the STS estimate of self-talk (69.3%) is very similar to the NIEQ
estimate of inner speech (66.6%), even though these two questionnaires are very different—the
STS uses Likert scales with ambiguous anchors whereas the NIEQ uses visual-analog scales with
Study N partic. N samp. Self-talk 5FP See Table
ISpeaking ISeeing UnsTh Feeling SensAw
1 16 16.88 .94 .92 .73 .35 .83 .82 S1 main diagonal
2 12 22.50 --a .97 .81 .82 .72 .94 S2 main diagonal
3 13 35.08 -- .96 .98 .88 .59 .86 S3 main diagonal
Meanb .95 .83 .65 .72 .87
MEASURING THE FREQUENCY OF INNER EXPERIENCE 14
unambiguous anchors. That is, the two questionnaires operated as expected (see also the
discussion of Table S4 in Supplemental Box S14).
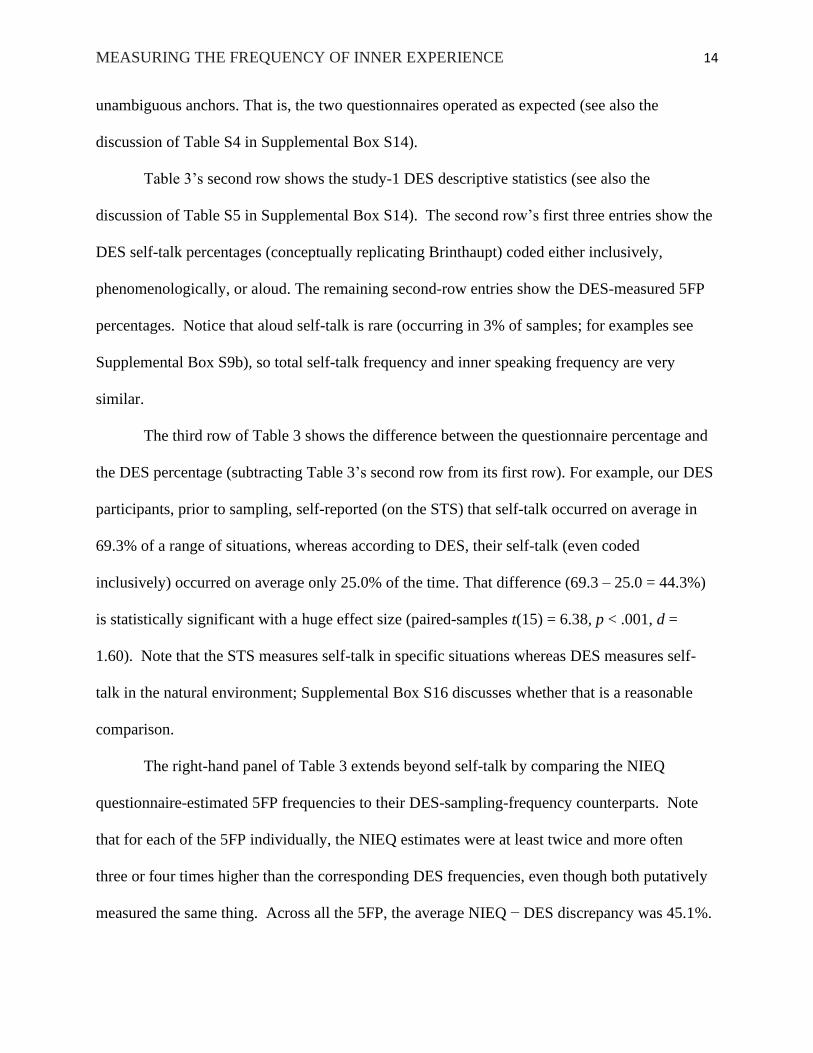
Table 3’s second row shows the study-1 DES descriptive statistics (see also the
discussion of Table S5 in Supplemental Box S14). The second row’s first three entries show the
DES self-talk percentages (conceptually replicating Brinthaupt) coded either inclusively,
phenomenologically, or aloud. The remaining second-row entries show the DES-measured 5FP
percentages. Notice that aloud self-talk is rare (occurring in 3% of samples; for examples see
Supplemental Box S9b), so total self-talk frequency and inner speaking frequency are very
similar.
The third row of Table 3 shows the difference between the questionnaire percentage and
the DES percentage (subtracting Table 3’s second row from its first row). For example, our DES
participants, prior to sampling, self-reported (on the STS) that self-talk occurred on average in
69.3% of a range of situations, whereas according to DES, their self-talk (even coded
inclusively) occurred on average only 25.0% of the time. That difference (69.3 – 25.0 = 44.3%)
is statistically significant with a huge effect size (paired-samples t(15) = 6.38, p < .001, d =
1.60). Note that the STS measures self-talk in specific situations whereas DES measures self-
talk in the natural environment; Supplemental Box S16 discusses whether that is a reasonable
comparison.
The right-hand panel of Table 3 extends beyond self-talk by comparing the NIEQ
questionnaire-estimated 5FP frequencies to their DES-sampling-frequency counterparts. Note
that for each of the 5FP individually, the NIEQ estimates were at least twice and more often
three or four times higher than the corresponding DES frequencies, even though both putatively
measured the same thing. Across all the 5FP, the average NIEQ − DES discrepancy was 45.1%.

MEASURING THE FREQUENCY OF INNER EXPERIENCE 15
Table 3
Study 1: Comparing Questionnaire Percentages and DES Sampling Percentages for All DES
Participants
Self-Talk 5FP
Total Aloud Inner Speaking
Inner
Seeing
Unsym. Th. Feeling
Sensory
Aw.
Inclusive Phenom. Inclusive Phenom.
M a (SD) M (SD) M (SD) M (SD) M (SD) M (SD) M (SD) M (SD) M (SD)
Questionnaireb 69.3 (24.4) 66.6 (25.6) 69.0 (27.2) 38.8 (25.3) 79.1 (20.0) 68.5 (18.7)
DES Samplingc 25.0 (19.02) 17.9 (16.7) 3.0 (6.7) 22.0 (17.0) 15.0 (15.5) 20.1 (16.2) 11.8 (10.8) 17.8 (16.9) 33.0 (19.3)
Questionnaire – DES 44.3d (27.8) 51.4d (26.7) n/ae 44.6f (29.6) 51.6 (29.1) 48.9 (27.4) 27.0 (26.8) 61.3 (26.2) 35.6 (27.9)
t (15)g 6.38 7.72 6.03 7.09 7.13 4.03 9.35 5.11
p < .001 < .001 < .001 < .001 < .001 .001 < .001 < .001
d 1.60 1.93 1.51 1.77 1.78 1.01 2.34 1.28
Note. Unsym. Th. = Unsymbolized thinking; Sensory Aw. = Sensory awareness; Phenom. =
Phenomenological
a All means are frequencies averaged (unweighted) across participants.
b From the All DES Participants (N = 16) row of Table S4. The Self-Talk panel shows the STS
percentage; the remaining columns show NIEQ percentages.
c From the All DES Participants (N = 16) row of Table S5.
d STS percentage minus DES percentage for all DES participants.
e Too few instances to be meaningful.
f For the rest of this row, NIEQ subscale percentage minus DES percentage for all DES
participants.
g Comparing questionnaire percentage and DES percentage, dependent samples.
MEASURING THE FREQUENCY OF INNER EXPERIENCE 16
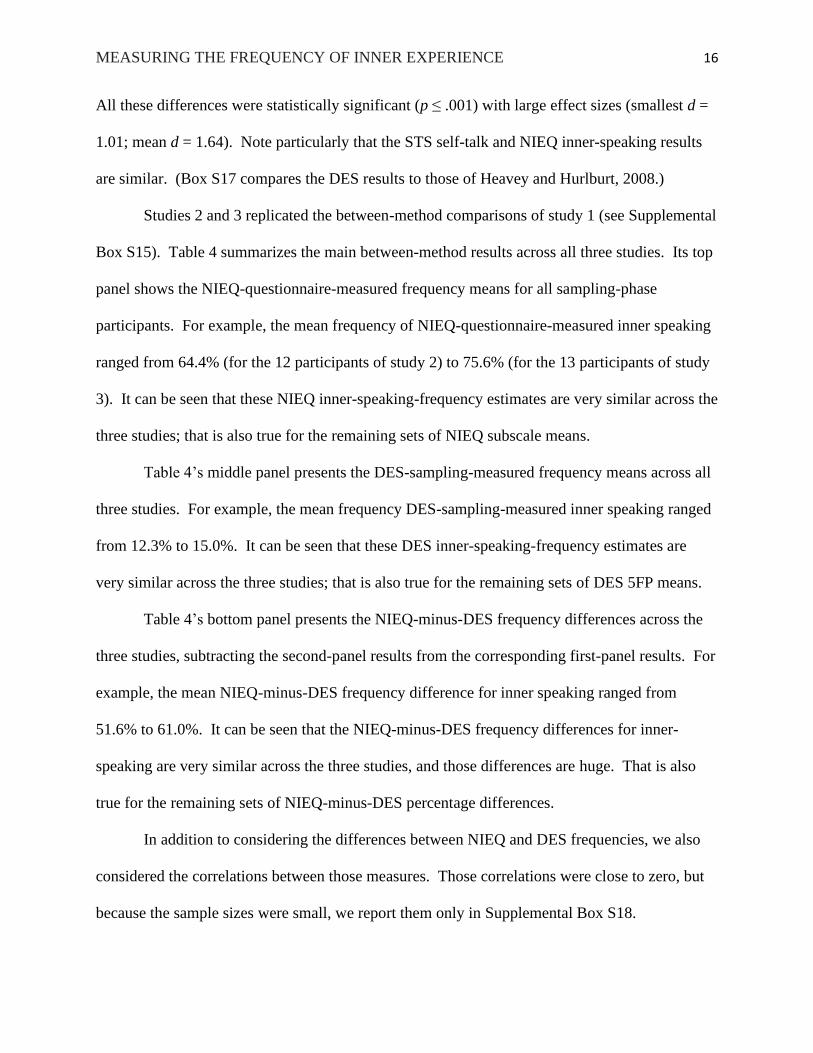
All these differences were statistically significant (p ≤ .001) with large effect sizes (smallest d =
1.01; mean d = 1.64). Note particularly that the STS self-talk and NIEQ inner-speaking results
are similar. (Box S17 compares the DES results to those of Heavey and Hurlburt, 2008.)
Studies 2 and 3 replicated the between-method comparisons of study 1 (see Supplemental
Box S15). Table 4 summarizes the main between-method results across all three studies. Its top
panel shows the NIEQ-questionnaire-measured frequency means for all sampling-phase
participants. For example, the mean frequency of NIEQ-questionnaire-measured inner speaking
ranged from 64.4% (for the 12 participants of study 2) to 75.6% (for the 13 participants of study
3). It can be seen that these NIEQ inner-speaking-frequency estimates are very similar across the
three studies; that is also true for the remaining sets of NIEQ subscale means.
Table 4’s middle panel presents the DES-sampling-measured frequency means across all
three studies. For example, the mean frequency DES-sampling-measured inner speaking ranged
from 12.3% to 15.0%. It can be seen that these DES inner-speaking-frequency estimates are
very similar across the three studies; that is also true for the remaining sets of DES 5FP means.
Table 4’s bottom panel presents the NIEQ-minus-DES frequency differences across the
three studies, subtracting the second-panel results from the corresponding first-panel results. For
example, the mean NIEQ-minus-DES frequency difference for inner speaking ranged from
51.6% to 61.0%. It can be seen that the NIEQ-minus-DES frequency differences for inner-
speaking are very similar across the three studies, and those differences are huge. That is also
true for the remaining sets of NIEQ-minus-DES percentage differences.
In addition to considering the differences between NIEQ and DES frequencies, we also
considered the correlations between those measures. Those correlations were close to zero, but
because the sample sizes were small, we report them only in Supplemental Box S18.
MEASURING THE FREQUENCY OF INNER EXPERIENCE 17
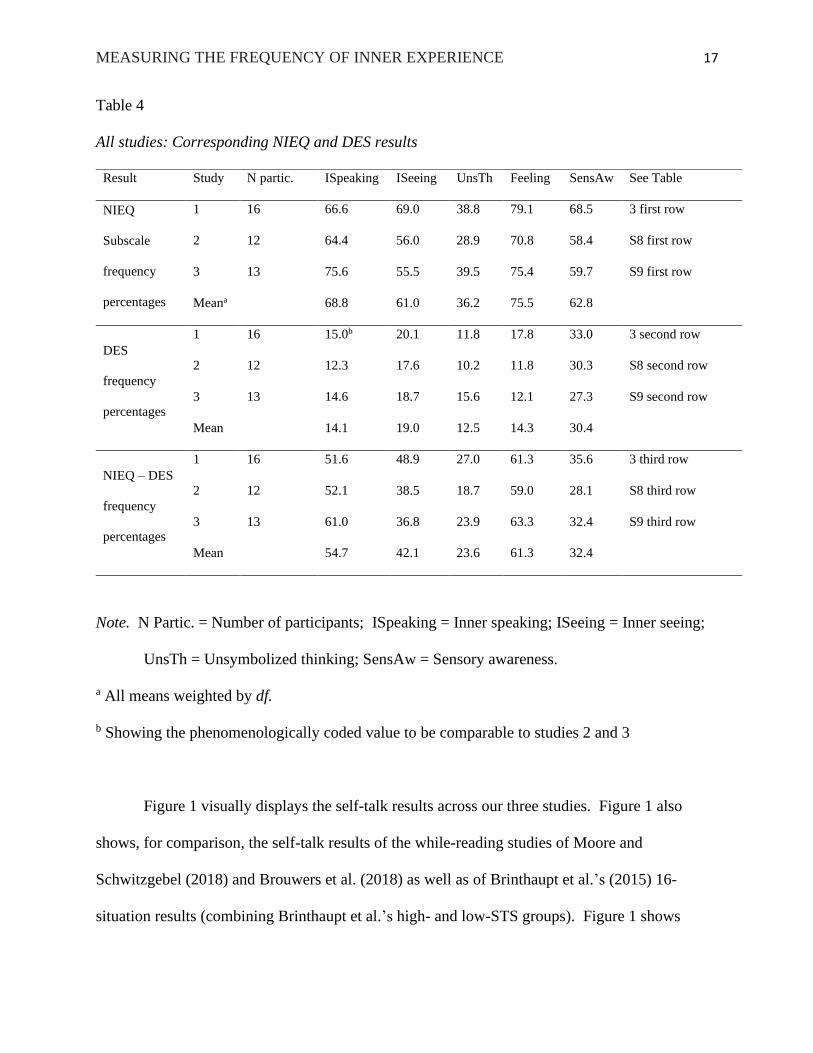
Table 4
All studies: Corresponding NIEQ and DES results
Note. N Partic. = Number of participants; ISpeaking = Inner speaking; ISeeing = Inner seeing;
UnsTh = Unsymbolized thinking; SensAw = Sensory awareness.
a All means weighted by df.
b Showing the phenomenologically coded value to be comparable to studies 2 and 3
Figure 1 visually displays the self-talk results across our three studies. Figure 1 also
shows, for comparison, the self-talk results of the while-reading studies of Moore and
Schwitzgebel (2018) and Brouwers et al. (2018) as well as of Brinthaupt et al.’s (2015) 16-
situation results (combining Brinthaupt et al.’s high- and low-STS groups). Figure 1 shows
Result Study N partic. ISpeaking ISeeing UnsTh Feeling SensAw See Table
NIEQ
Subscale
frequency
percentages
1 16 66.6 69.0 38.8 79.1 68.5 3 first row
2 12 64.4 56.0 28.9 70.8 58.4 S8 first row
3 13 75.6 55.5 39.5 75.4 59.7 S9 first row
Meana 68.8 61.0 36.2 75.5 62.8
DES
frequency
percentages
1 16 15.0b 20.1 11.8 17.8 33.0 3 second row
2 12 12.3 17.6 10.2 11.8 30.3 S8 second row
3 13 14.6 18.7 15.6 12.1 27.3 S9 second row
Mean 14.1 19.0 12.5 14.3 30.4
NIEQ – DES
frequency
percentages
1 16 51.6 48.9 27.0 61.3 35.6 3 third row
2 12 52.1 38.5 18.7 59.0 28.1 S8 third row
3 13 61.0 36.8 23.9 63.3 32.4 S9 third row
Mean 54.7 42.1 23.6 61.3 32.4

MEASURING THE FREQUENCY OF INNER EXPERIENCE 18
Figure 1. All studies: Comparing self-talk by questionnaire and experience sampling.
Notes: STS = Self-Talk Questionnaire; NIEQ = Nevada Inner Experience Questionnaire; ST-i =
self-talk (inclusively coded); IS-p = inner speaking (phenomenologically coded). Error
bars are plus or minus one standard error.
a Moore and Schwitzgebel’s (2018) online questionnaire item regarding inner speech
b Called “Words of any kind” by Brouwers et al. (2018)
c Called “Inner speaking” by Brouwers et al. (2018), but it includes inner hearing
d Results from Moore and Schwitzgebel’s (2018) Study 2 of experience while reading (for
comparison)
e Results from Brouwers et al. (2018) study of experience while reading (for comparison)
f Results from Brinthaupt et al. (2015) study 2, combining all participants (for comparison)

MEASURING THE FREQUENCY OF INNER EXPERIENCE 19
questionnaires with dots and experience sampling with diagonal lines. Questionnaire-based
experience-sampling diagonals are black and descending; DES experience-sampling diagonals
are gray and ascending. Observe that: (a) everywhere that questionnaires occur (dots), the results
are very similar. In particular, everywhere that NIEQ ISpeaking questionnaire occurs (white dots
on black), the results are very similar to each other and to the other questionnaires; (b)
everywhere that questionnaire-based sampling appears (black descending diagonals), the results
are very similar to the questionnaires—much more similar to the questionnaires than to the DES
experience sampling; and (c) everywhere DES sampling occurs (gray ascending diagonals), the
results (regardless of whether the DES coding is inclusive or phenomenological) are very similar
to each other but dramatically smaller than any questionnaire-based method.
In short: All self-talk frequencies based on questionnaires, whether retrospective
questionnaires (Moore and Schwitzgebel’s item, the STS, or NIEQ ISpeaking) or questionnaire-
based experience sampling (Moore & Schwitzgebel or Brinthaupt et al.), are approximately equal
and high (roughly two-thirds of the time). The self-talk frequencies based on DES (whether
coded inclusively or phenomenologically) are approximately equal and much smaller (roughly
one-sixth of the time).
The self-talk frequency distributions between questionnaire and DES have relatively little
overlap. See Supplemental Box S19, which zooms in on a portion of Figure 1.
Figure 2 extends beyond self-talk to the 5FP by comparing the NIEQ questionnaire and
the DES sampling results. As in Figure 1, the NIEQ results are shaded in white-dotted black
bars; the DES results are shaded with light-gray diagonals. Note that for each of the 5FP, the
NIEQ-questionnaire estimates are very consistent across studies, as are the DES-sampling

MEASURING THE FREQUENCY OF INNER EXPERIENCE 20
Figure 2. All studies: Comparing the 5FP by NIEQ and DES.
Notes: NIEQ = Nevada Inner Experience Questionnaire. Error bars are plus or minus one
standard error. Inner Speaking results are redisplayed from Figure 1.
results. Note also that for each of the 5FP, the DES results are dramatically smaller than are the
NIEQ estimates.
How Can Results Be So Discrepant?
Despite the fact that the NIEQ (by questionnaire) and DES (by sampling) intend to
measure the same thing (the 5FP frequencies in the natural environment), the NIEQ and DES
apparently measure very different things: The questionnaire provided hugely higher estimates
than the sampling frequencies. These results are striking and consistent.

MEASURING THE FREQUENCY OF INNER EXPERIENCE 21
Supplemental Box S20 suggests that the relatively small sample sizes of these studies are
not grounds for dismissing them, so we ask whether science should understand these studies’
huge discrepancies to be (a) merely a difference in the point of view between questionnaires and
DES (as when fractal analysis shows different coastline lengths depending on the length of the
measuring instrument); (b) that questionnaires overestimate the frequency of actual phenomena;
(c) that DES underestimates actual frequencies; or (d) some combination of the above. These
studies cannot definitively choose among those options but they do suggest that psychological
science might profit from a series of studies by a variety of investigators, all trying to tease these
and other options apart.
Without being dogmatic, we favor (b): questionnaires likely overestimate the frequencies
of inner experiential phenomena. That perspective comes not only from these three studies but
from many careful observations of DES participants (e.g., Steven in Supplemental Box S1) who
themselves came to realize that they had been ignorant about their own inner experience. For
example, Hurlburt and Krumm (2020) publicly used DES with Ryan, the protagonist in the
recent everyone-has-constant-internal-monologue Internet kerfuffle (Soloducha, 2020), finding
few examples of the internal monologue that Ryan had thought were ubiquitous.
One might wonder how people can be mistaken about their own experience. We offer six
speculations. First, people have no comparison group on which to hone the skills required to
apprehend, discriminate, and describe phenomena. The totality of your experienced phenomena
come from a single source—yourself. Second, most people find their own DES-discovered inner
experience mundane and boring (by their own standards). Faithfully apprehending and
describing your inner experience doesn’t seem interesting. Third, there may be evolutionary or
cultural pressure favoring suppressing candid expression of inner experience (think about those
MEASURING THE FREQUENCY OF INNER EXPERIENCE 22
who reveal that they find the queen attractive). Fourth, inner-experience characteristics are
almost always importantly just outside of view. You are generally interested in whatever you are
interested in, not in the manner in which you experience it. Fifth, armchair introspection (asking
yourself, “What’s going on with me right now?”) is doubly fraught (Hurlburt & Schwitzgebel,
2011): you choose to introspect only on certain occasions (exactly those in which it occurs to you
to introspect), and asking the question substantially disturbs the experience meant to be
introspected. The beep’s randomness alleviates the special-occasion problem, and its fast rise
time might substantially lessen the disturbance, but of course that is open to scientific evaluation.
Sixth, people confuse self-theories, folk-theories, generalities, and/or plausibility notions with
experience itself. On a questionnaire, or at a questionnaire-based beep, one might endorse inner
speech because it seems reasonable, not because one directly apprehends it. We note that the
characteristics of one’s experience might be important even if one is mistaken about those
characteristics.
Implications
In a narrow sense, we have examined the contrast between one fidelity-aspiring method
(DES) and questionnaire-based measures of experiential frequencies. In a broader sense, this
paper suggests the potential importance of high-fidelity explorations of everyday inner
experience. Investigations that seek to characterize everyday inner experience are rare. For
example, whereas introductory psychology textbooks frequently include chapters on
“consciousness,” those chapters focus predominantly on dreaming, drugs, and selective attention.
Only rarely do they even mention the characteristics of everyday waking experience.
Psychological science has not invested in high-fidelity investigations of experience.
MEASURING THE FREQUENCY OF INNER EXPERIENCE 23
Experience-sampling studies typically include instructions such as “Please refer to the
thought occurring right before the alarm sounds” (Bryant et al., 2013, p. 705, underlining in
original). Those instructions seem simple and unambiguously straightforward, but DES has
shown that first-sampling-day DES participants respond to such instructions in hugely discrepant
ways. For example, DES participants (as subsequent interviewing shows) use “thought” to refer
to vastly different phenomena ranging from feelings to sensory awarenesses to (as might have
been expected) cognitive events (Hurlburt & Schwitzgebel, 2007, p. 61). Furthermore, despite
being instructed to focus on experience “right before the beep sounds,” first-sampling-day DES
participants sometimes describe experiences that actually occurred hours or days before the beep,
during the beep, after the beep, or that were not experienced at all (Hurlburt, 2011). We believe
that questionnaire-based experience-sampling participants have similarly discrepant ways of
understanding seemingly unambiguous instructions, but that those discrepancies remains hidden
in questionnaire-based research. We conclude that substantial (probably iterative) training is
required to disambiguate everyday terminology and instructions; such training is rare or
nonexistent in questionnaire-based experience sampling (Hurlburt & Heavey, 2015).
Furthermore, if questionnaire users provide any training that goes beyond the validation sample,
their questionnaire administration would be considered invalid.
There are studies that investigate directly apprehended experiential aspects other than
frequency. For example, Fazekas et al. (2020) considered the neural correlates of vividness of
visual imagery, which was typically measured with the Vividness of Visual Imagery
Questionnaire (VVIQ; Marks, 1973) and/or the Perceptual Awareness Scale (PAS; Ramsøy &
Overgaard, 2004). Visual-imagery vividness was said to have three characteristics: (a) the
maximum visual-imagery vividness is as clear and as vivid as normal vision (as the VVIQ puts

MEASURING THE FREQUENCY OF INNER EXPERIENCE 24
it); (b) if imagery is not clear or vivid, it is “degraded” or “reduced in quality” (Fazekas et al.,
2020, p. 1202); and (c) vividness is a characteristic of the entire conscious experience (as it must
be in order to inquire about its neural correlates). However, our DES studies suggest that none
of those characteristics are necessary. Regarding (a), Hurlburt (1990) described instances where
patients with schizophrenia had imagery that was more clear and vivid than normal vision. This
phenomenon is not limited to people with schizophrenia; Raymond (2011) also reported it in
veterans with PTSD. Regarding (b) and (c), here is an example from Hurlburt and Schwitzgebel
(2007):
Susan, a college student, was critical of her roommate Helen’s relationships with boys.
Susan had an image of Helen, seen from the waist up sitting on their couch with a boy.
Helen in the image was wearing only a bra. Helen and the couch and the bra were seen
clearly in this image, but the boy’s face was unelaborated or indistinct. … [Susan’s]
indeterminate boy was not merely the result of weak imagery but was a highly skilled
construction of indeterminacy precisely where she meant indeterminately to represent lots
of boys. (Hurlburt, in Hurlburt & Schwitzgebel, 2007, p. 106)
Susan’s lack of clarity was (or at least might have been) an intentional blurring that was highly
skillful, not (b) degraded or reduced in quality. Moreover, the blurring applied only to a portion
of the imagery, not (c) the entire conscious experience.
Our studies suggest that skilled distortions such as Susan’s blurring are not unique to
Susan. Whether such distortions are important to the scientific study of vividness remains to be
seen; here we note questionnaires such as the VVIQ or SAS can never investigate such
characteristics. To do so requires an aim at fidelity, which is not the case for questionnaire-based
data (see Supplemental Box S6).
MEASURING THE FREQUENCY OF INNER EXPERIENCE 25
A second example concerns mind wandering, which “is rooted in competition between
self-relevant, internal priorities and task-relevant, external priorities” (Murray et al., 2020, p.
575). Following William James’ “Everyone knows what attention is. It is the taking possession
by the mind, in clear and vivid form, of one out of what seem several simultaneously possible
objects or trains of thought” (James, 1890, p. 403–404, emphasis added), mind-wandering
researchers typically presume that consciousness is (1) unitary and (2) composed of either
externally driven trains of thought (i.e., perceptual experience) or internally driven trains of
thought (experiences generated by the autobiographical memory system). However, Fernyhough
et al. (2018) used DES to show that experience could be multiple, not (1) unitary; and could be
simultaneously internal and external, not only (2) one or the other. Here is an example from a
participant in that study:
Jane was focused on the geometry of the scanner above her head, particularly on the
distance between the mirror and the ceiling of the scanner (an external focus).
Simultaneously she innerly saw the office where the DES interviews had taken place, as
if she had been walking into the room. She saw the table and RH, the people behind him,
the computer, and so on. This imaginary seeing is an internal focus. (Fernyhough et al.,
2018, p. 8)
The mind-wandering literature does not discuss such samples because, as Murray and colleagues
summarize (p. 582), mind-wandering studies typically interrupt participants and prompt them
with some variant of “At the time of the beep, my mind had wandered to something other than
what I was doing.” That prompt presumes that the mind is (1) unitary and (2) either focused
externally on the task or internally on something else.

MEASURING THE FREQUENCY OF INNER EXPERIENCE 26
Much of the energy in modern psychological science involves neuroscientific (fMRI,
etc.) studies that seek to identify brain-region correlates of cognitive events. Substantial
resources are being expended to improve brain-region measurements, but the cognitive events
are still typically measured by questionnaire (e.g., Delamillieure et al., 2010) or performance on
cognitive tasks (e.g., Christoff et al., 2009), techniques that have not changed much since the
invention of fMRI. However, Hurlburt et al. (2016), in an fMRI study, compared inner speech as
elicited by the experimenter (e.g., “Say ‘pencil’”) with spontaneously-occurring-in-the-scanner
inner speech (as identified by DES), finding that experimenter-elicited and spontaneous inner
speech had different brain-region footprints. This small study clearly needs replication, but it
suggests that neural-correlates-of-consciousness science might profit from improving
measurements of both brain activity and experience.
Many questionnaires (unlike those we have been considering) measure personality traits
or other inferred constructs, not directly apprehended experience. Our results do not apply
directly to such questionnaires. For example, the NEO-PI-3 personality inventory (McCrae et
al., 2005) measures traits such as conscientiousness and extraversion by presenting general-self-
characterization items such as “I’m not a very orderly or methodical person,” which has no or
only minor relationship to directly apprehended experience. We do not take a position on how
our results might extrapolate to such questionnaires.
The bottom line, as we see it, is this: Scientists and practitioners should not assume that
people adequately characterize their inner experience on questionnaires or in questionnaire-based
experience-sampling methods. The studies presented or reviewed here show dramatic
differences between questionnaire-based characterizations (done via retrospection or non-
retrospectively via experience sampling) and fidelity-aspiring ones (done via DES). If we are to

MEASURING THE FREQUENCY OF INNER EXPERIENCE 27
have a mature science of inner experience, the field must grapple with these findings. Perhaps
replication attempts will reveal limitations of these studies. Perhaps science can advance
fidelity-aspiring methods superior to or more efficient than DES. Perhaps science will find a way
to create questionnaires that capitalize on the issues raised here—for example, perhaps a few
days of DES iterative training can be followed by several days of questionnaire-based experience
sampling. Perhaps if psychological science came to distinguish between high fidelity
explorations and self-characterizations, that distinction would percolate through to the lay
community, the general societal appreciation for apprehending inner experience would increase,
and the ability to respond to questionnaire-based probes would improve. Perhaps psychological
science will recognize that whereas high fidelity explorations are required for the exploration of
absolute frequencies, the exploration of relative frequencies, personality traits, or other
constructs may not have such requirements. Perhaps psychological science will decide that it is
important to devote substantially more of its resources to high fidelity explorations of inner
experience. Much work remains.
Declaration of Conflicting Interests
The authors declared no conflicts of interest with respect to the authorship or the publication of
this article.
MEASURING THE FREQUENCY OF INNER EXPERIENCE 28
References
Brinthaupt, T. M., Benson, S. A., Kang, M., & Moore, Z. D. (2015). Assessing the accuracy of
self-reported self-talk. Frontiers in Psychology, 6, 570. doi:10.3389/fpsyg.2015.00570
Brinthaupt, T. M., Hein, M. B., & Kramer, T. E. (2009). The Self-Talk Scale: Development,
factor analysis, and validation. Journal of Personality Assessment, 91(1), 82-92.
doi:10.1080/00223890802484498
Brouwers, V. P., Heavey, C. L., Lapping-Carr, L., Moynihan, S., Kelsey, J., & Hurlburt, R. T.
(2018). Pristine inner experience while silent reading: It’s not silent speaking of the
text. Journal of Consciousness Studies, 25(3-4), 29-54.
Bryant, L., Coffey, A., Povinelli, D. J., & Pruett Jr., J. R. (2013). Theory of Mind experience
sampling in typical adults. Consciousness and Cognition, 22, 697-707.
Caracciolo, M., & Hurlburt, R. T. (2016). A passion for specificity: Confronting inner experience
in literature and science. Columbus, OH: Ohio State University Press.
Christoff, K., Gordon, A. M., Smallwood, J., Smith, R., and Schooler, J. W. (2009). Experience
sampling during fMRI reveals default network and executive system contributions to
mind wandering. Proceedings of the National Academy of Sciences of the United States
of America, 106, 8719–8724. doi:10.1073/pnas.0900234106
Delamillieure, P., Doucet, G., Mazoyer, B., Turbelina, M., Delcroix, N., Mellet, E., … Joliot, M.
(2010). The resting state questionnaire: an introspective questionnaire for evaluation of
inner experience during the conscious resting state. Brain Research Bulletin, 81, 565–
573. doi:10.1016/j.brainresbull.2009.11.014

MEASURING THE FREQUENCY OF INNER EXPERIENCE 29
Doyle, A. C. (1900/2019). A Scandal in Bohemia. Retrieved from
http://www.pagebypagebooks.com/Arthur_Conan_Doyle/The_Adventures_of_Sherlock_
Holmes/ADVENTURE_I_A_SCANDAL_IN_BOHEMIA_p3.html.
Fazekas, P., Nemeth, G., & Overgaard, M. (2020). Perceptual representations and the vividness
of stimulus-triggered and stimulus-independent experiences. Perspectives on
Psychological Science, 15(5) 1200-1213. doi: 10.1177/1745691620924039
Fernyhough, C. P., Alderson-Day, B., Hurlburt, R. T., & Kühn, S. (2018). Investigating multiple
streams of consciousness: Using Descriptive Experience Sampling to explore internally
and externally directed streams of thought. Frontiers in Human Neuroscience, 12, 494.
doi: 10.3389/fnhum.2018.00494
Heavey, C. L., & Hurlburt, R. T. (2008). The phenomena of inner experience. Consciousness
and Cognition, 17(3), 798-810. doi:10.1016/j.concog.2007.12.006
Heavey, C. L., Moynihan, S. A., Brouwers, V. P., Lapping-Carr, L., Krumm, A. E., Kelsey, J.
M., Turner II, D. K., & Hurlburt, R. T. (2019). Measuring the frequency of inner-
experience characteristics by self-report: The Nevada Inner Experience Questionnaire.
Frontiers in Psychology, 11, 2615. doi:10.3389/fpsyg.2018.02615
Hurlburt, R. T. (1990). Sampling normal and schizophrenic inner experience. New York, NY:
Plenum Press.
Hurlburt, R. T. (1993). Sampling inner experience in disturbed affect. New York, NY: Plenum
Press.
Hurlburt, R. T. (2009). Iteratively apprehending pristine experience. Journal of Consciousness
Studies, 16(10-12), 156-188.

MEASURING THE FREQUENCY OF INNER EXPERIENCE 30
Hurlburt, R. T. (2011). Investigating pristine inner experience. New York, NY: Cambridge
University Press.
Hurlburt, R. T., Alderson-Day, B., Kühn, S., & Fernyhough, C. (2016). Exploring the ecological
validity of thinking on demand: Neural correlates of elicited vs. spontaneously occurring
inner speech. PLoS-ONE, 11(2): e0147932. doi:10.1371/journal.pone.0147932.
Hurlburt, R. T., & Heavey, C. L. (2001). Telling what we know: Describing inner experience.
Trends in Cognitive Sciences, 5(9), 400-403. doi:10.1016/S1364-6613(00)01724-1
Hurlburt, R. T., & Heavey, C. L. (2006). Exploring inner experience: The descriptive experience
sampling method. Amsterdam; Philadelphia, PA: John Benjamins.
Hurlburt, R. T., & Heavey, C. L. (2015). Investigating pristine inner experience: Implications for
experience sampling and questionnaires. Consciousness and Cognition, 31, 148-159.
doi:10.1016/j.concog.2014.11.002
Hurlburt, R. T., Heavey, C. L., & Kelsey, J. M. (2013). Toward a phenomenology of inner
speaking. Consciousness and Cognition, 22, 1477–1494.
doi:10.1016/j.concog.2013.10.003
Hurlburt, R. T., & Krumm, A. E. (2020). Do I really have internal monologue? (Reality TV
about inner experience). Retrieved from
htttp://hurlburt.faculty.unlv.edu/lena/do_I_have_internal_monologue_sampling.html
Hurlburt, R. T., & Schwitzgebel, E. (2007). Describing inner experience? Proponent meets
skeptic. Cambridge, MA: MIT Press.
Hurlburt, R. T., & Schwitzgebel, E. (2011). Methodological pluralism, armchair introspection,
and DES as the epistemic tribunal. Journal of Consciousness Studies, 18(1), 253-273.
James, W. (1890). The principles of psychology. Volume 1. New York: Henry Holt.

MEASURING THE FREQUENCY OF INNER EXPERIENCE 31
Kane, M. J., Brown, L. H., McVay, J. C., Silvia, P. J., Myin-Germeys, I., & Kwapil, T. R.
(2007). For whom the mind wanders, and when: An experience-sampling study of
working memory and executive control in daily life. Psychological Science, 18(7), 614–
621. doi:10.1111/j.1467-9280.2007.01948.x
Kosslyn, S. M. (1994). Image and brain: The resolution of the imagery debate. Cambridge, MA:
The MIT Press.
Kühn, S., Fernyhough, C., Alderson-Day, B., & Hurlburt, R. T. (2014). Inner experience in the
scanner: Can high fidelity apprehensions of inner experience be integrated with fMRI?
Frontiers in Psychology: Cognitive Science, 5, article 1393, 1-8.
doi:10.3389/fpsyg.2014.01393
Langland-Hassan, P., Faries, F. R., Richardson, M. J., & Dietz, A. (2015). Inner speech deficits
in people with aphasia. Frontiers in Psychology, 6, 528. doi:10.3389/fpsyg.2015.00528
Loftus, E. F. (2005). Planting misinformation in the human mind: A 30-year investigation of the
malleability of memory. Learning & Memory, 12(4), 361-366. doi:10.1101/lm.94705
Marks, D. F. (1973). Visual imagery differences in the recall of pictures. British Journal of
Psychology, 64,17–24. doi:10.1111/j.2044-8295.1973.tb01322.x
McCrae, R. R., Costa, Jr., P. T., & Martin, T. A. (2005). The NEO-PI-3: A more readable
Revised NEO Personality Inventory. Journal of Personality Assessment, 84(3), 261–270.
doi:10.1207/s15327752jpa8403_05
McKelvie, S. J. (2019). Classical introspection revisited: Implications of research on visual
imagery for the functions of pristine inner experience as apprehended by descriptive
experience sampling. Current Psychology, 1-15. doi:10.1007/s12144-019-00176-2
MEASURING THE FREQUENCY OF INNER EXPERIENCE 32
Moore, A.T., & Schwitzgebel, E. (2018). The experience of reading. Consciousness and
Cognition, 62, 57-68. doi:10.1016/j.concog.2018.03.011
Murray, S., Krasich, K., Schooler, J. W., & Seli, P. (2020). What’s in a task? Complications in
the study of the task-unrelated-thought variety of mind wandering. Perspectives on
Psychological Science, 15(3), 572–588. doi:10.1177/1745691619897966
Ramsøy, T. Z., & Overgaard, M.. (2004). Introspection and subliminal perception.
Phenomenology and the Cognitive Sciences, 3(1), 1–23.
doi:10.1023/b:phen.0000041900.30172.e8
Ross, L., & Nisbett, R. E. (1991). The person and the situation: Perspectives of social
psychology. Philadelphia, PA: Temple University Press.
Raymond, N. C. (2011). Examining the experience of recent war veterans who report
posttraumatic stress disorder (Doctoral dissertation). Retrieved from UNLV Theses,
Dissertations, Professional Papers, and Capstones. (1225)
Rottenberg, J., & Gross, J. (2003). When emotion goes wrong: Realizing the promise of affective
science. Clinical Psychology: Science and Practice, 10, 227-232.
doi:10.1093/clipsy.bpg012
Runge, M. S., Cheung, M. W., & D’Angiulli, A. (2017). Meta-analytic comparison of trial-
versus questionnaire-based vividness reportability across behavioral, cognitive and neural
measurements of imagery. Neuroscience of Consciousness, 2017(1), nix006.
doi:10.1093/nc/nix006
Soloducha, A. (2020, March 6). What it like living without an inner monologue. Retrieved from
https://www.cbc.ca/news/canada/saskatchewan/inner-monologue-experience-science-
1.5486969

MEASURING THE FREQUENCY OF INNER EXPERIENCE 33
Watson, D. (2000). Mood and temperament. New York, NY: Guilford Press.