Embed Size (px)
Citation preview

Measuring the Effects of Delayed or Avoided Developmental Coursework
A Suggested Approach for Assessingthe Effectiveness of Pre-College CoursesT.M. Wright
Columbia-Greene
Community College


Context
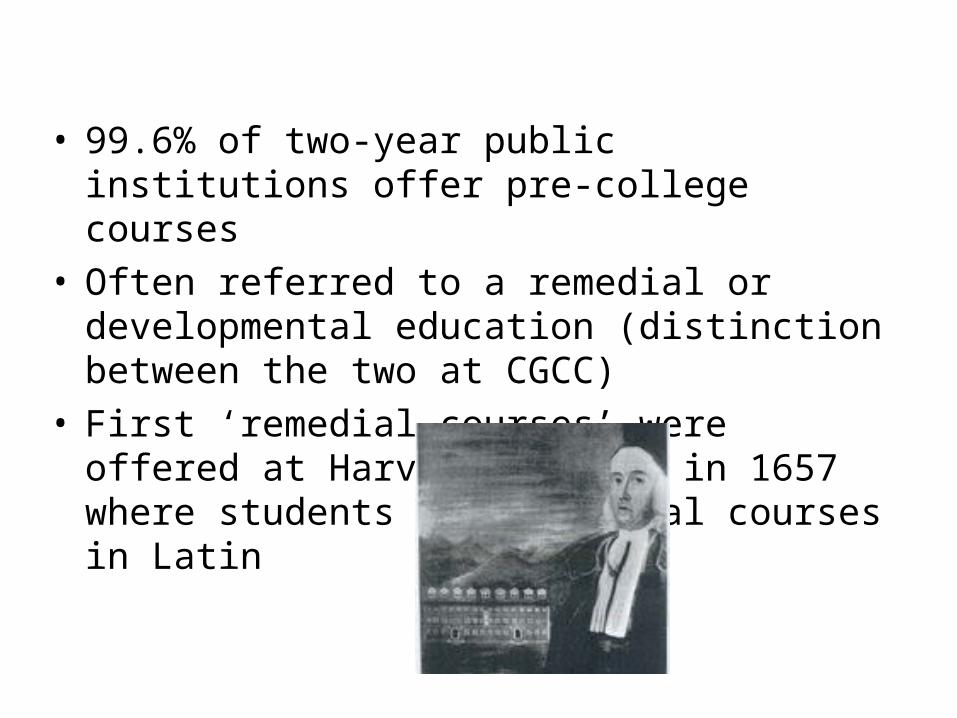
• 99.6% of two-year public institutions offer pre-college courses
• Often referred to a remedial or developmental education (distinction between the two at CGCC)
• First ‘remedial courses’ were offered at Harvard College in 1657 where students took remedial courses in Latin
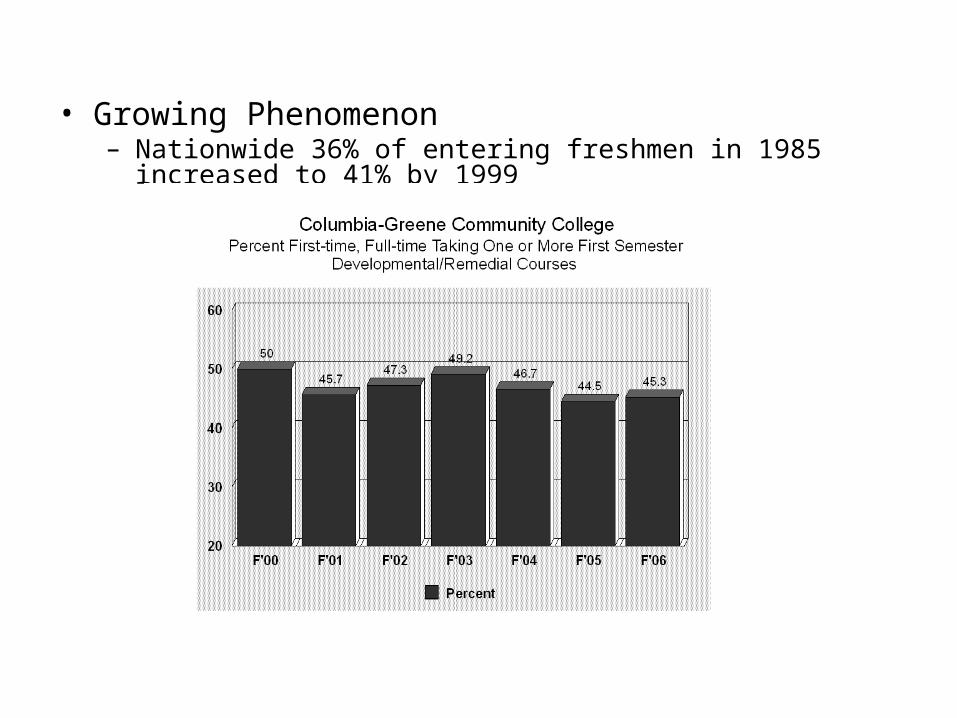
• Growing Phenomenon– Nationwide 36% of entering freshmen in 1985 increased to 41% by
1999

Enrollment in Remedial Courses in New York State 1996-97
Level Sector Total Freshmen
Percent of Freshmen
in Remediation
Total Undergraduates
Percent of Total Undergraduates in Remediation
4-Year or More
SUNY CUNY Independent Proprietary Total
29,441 18,507 62,777
3,821 114,546
4.5 54.9
8.4 83.8 17.4
181,400 139,962 306,693
14,532 642,587
2.3 15.6
3.1 24.1
6.1
2-Year SUNY CUNY Independent Proprietary Total
49,805 17,904
2,291 14,631 84,631
16.5 82.8 51.2 24.1 32.8
258,238 85,927
8,538 28,648
381,351
12.5 4.4
20.1 16.0 20.1
Total SUNY CUNY Independent Proprietary Total
79,246 36,411 65,068 18,452
199,177
12.0 68.6
9.9 36.5 23.9
439,638 225,889 315,231
43,180 1,023,938
8.3 26.5
3.4 18.7 11.3
Source: NYSED Survey, 1998


Two-thirds of students requiring pre-college preparation in one subject only are deficient in math

Context Continued

• National Trend to transfer developmental/remedial mission to the two-year sector either by– De jure
• CUNY Initiative, Florida, California, others– De facto
• Open access and expanded support services offered at a lower cost by two-year sector
– Two-year sector share approaching 90% (2003)• Costly Endeavor
– Michigan Study in 2000 found that the cost to the state was $600 million (post secondary and private industry)
– If the costs nationwide are comparable, then remedial education for basic skills costs about $16.6 billion annually in the United States.

The Debate

• Are inadequate state high school graduation standards to blame for so many academically under prepared students?
ACT Survey of Faculty (2006)• How well do you think your state’s standards prepare students for college-level work in your content area?• Percent reporting “Very Well” or “Well”
– Post Secondary Faculty » Writing 33%» Reading 37%» Math 42%
– High School Faculty» Writing 76%» Reading 72%» Math 79%

• Do the outcomes of pre-college courses justify the costs?– Lower mandated class sizes and reduced loads for
remedial & developmental faculty plus enhanced support services result in a higher cost per credit hour
• CGCC max class size for pre-college course=15
• Full load for developmental faculty = 4 courses
• CGCC max class size for college-level course=22
• Full load for faculty teaching college level = 5 courses
– Developmental & remedial classes have higher withdrawal and failure rates

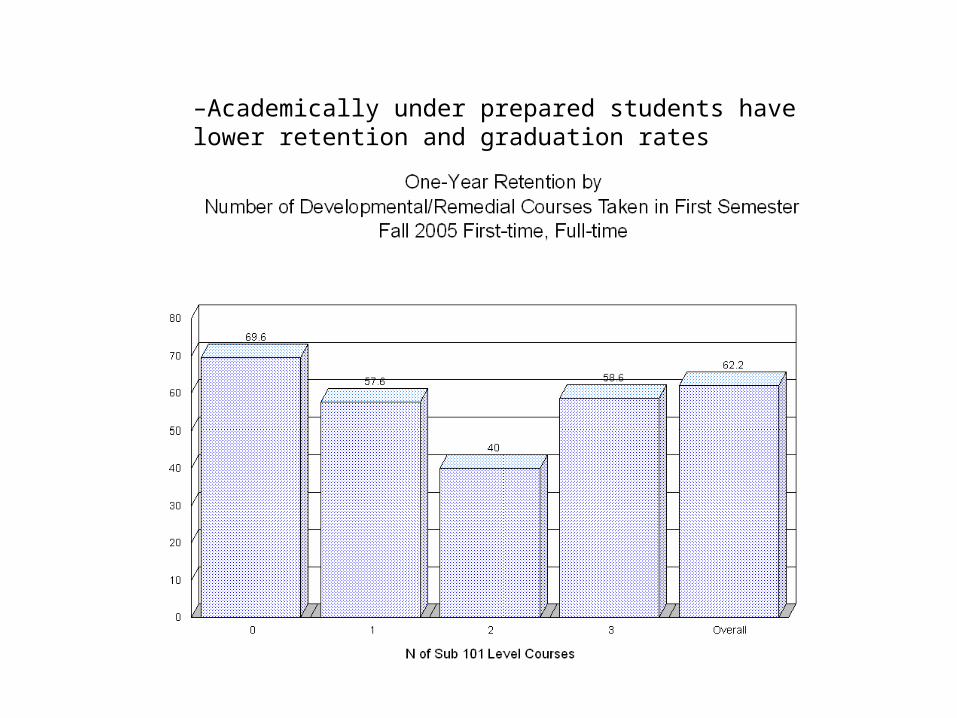
–Academically under prepared students have lower retention and graduation rates


Typical Approach to Measuring Developmental Course Outcomes
Developmental Course (EN100 & MA100) Follow on Course GradesFALL '04 FIRST-TIME STUDENT GRADES THROUGH FALL '05++++++++++++++++++++++++++++++++++++++++++++++++++++++++++++++++++++++++++++++++++++++++++++++++++++++++++++++++++++++++++++++++++++++++++++++++++++++++++++++++++++++++++++++++++++++++++++++++++++++++++++++++++++++++
ENROLLED PASS (A-C) F W ENROLL MA102+ SPR'05 PASS (A-C) D F W ENROLL MA102+ F'05FALL '04 MA100 153 102 35 16 65 37 9 11 8 27PERCENT 100.00% 66.67% 22.88% 15.69% 63.73% 56.92% 13.85% 16.92% 12.31%
ENROLLED PASS (A-C) F W ENROLL EN101+ SPR'05 PASS (A-C) D F W ENROLL EN102+ F'05FALL '04 EN100 84 55 27 2 43 22 5 11 5 13PERCENT 100.00% 65.48% 32.14% 3.64% 78.18% 51.16% 11.63% 25.58% 11.63%
ENROLLED PASS (A-C) F W ENROLL MA102+ SPR'05 PASS (A-C) D F W ENROLL MA102+ F'05FALL '04 MA102+ 89 65 4 16 95 65 10 16 11 68PERCENT 100.00% 73.03% 4.49% 24.62% 68.42% 10.53% 16.84% 11.58%
ENROLLED PASS (A-C) F & D W ENROLL EN102+ SPR'05 PASS (A-C) D F W ENROLL EN102+ F'05FALL '04 EN101 225 168 45 12 145 102 10 19 14 86PERCENT 100% 74.67% 20.00% 5.33% 64.44% 70.34% 6.90% 13.10% 9.66%
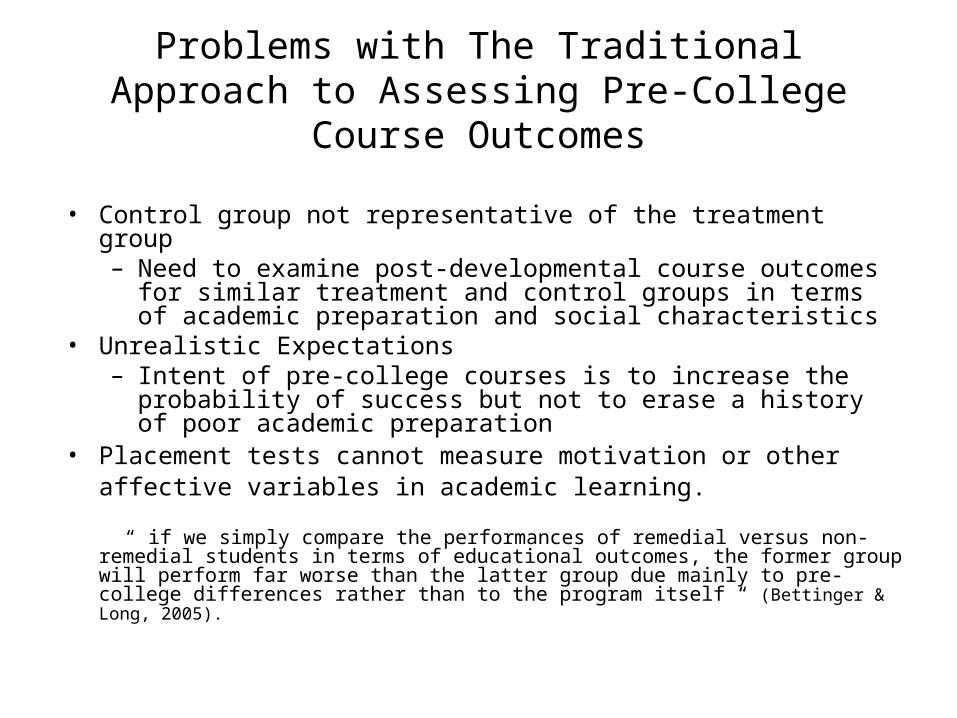
Problems with The Traditional Approach to Assessing Pre-College Course Outcomes
• Control group not representative of the treatment group– Need to examine post-developmental course outcomes for
similar treatment and control groups in terms of academic preparation and social characteristics
• Unrealistic Expectations– Intent of pre-college courses is to increase the probability of
success but not to erase a history of poor academic preparation• Placement tests cannot measure motivation or other affective
variables in academic learning. “ if we simply compare the performances of remedial versus non-remedial students in
terms of educational outcomes, the former group will perform far worse than the latter group due mainly to pre-college differences rather than to the program itself “ (Bettinger & Long, 2005).
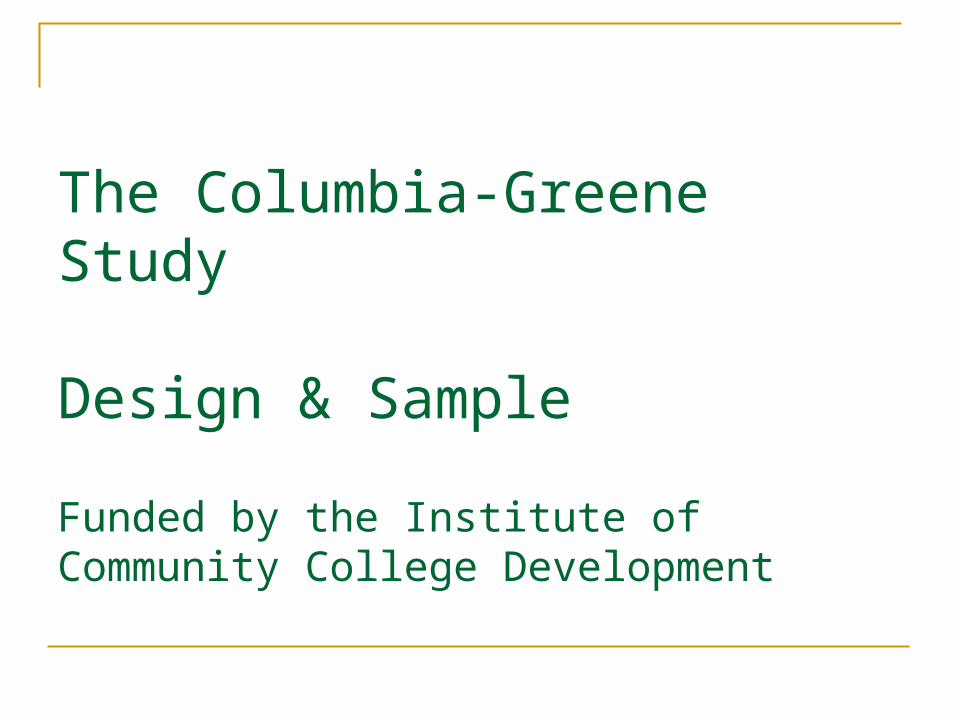
The Columbia-Greene Study
Design & Sample
Funded by the Institute of Community College Development
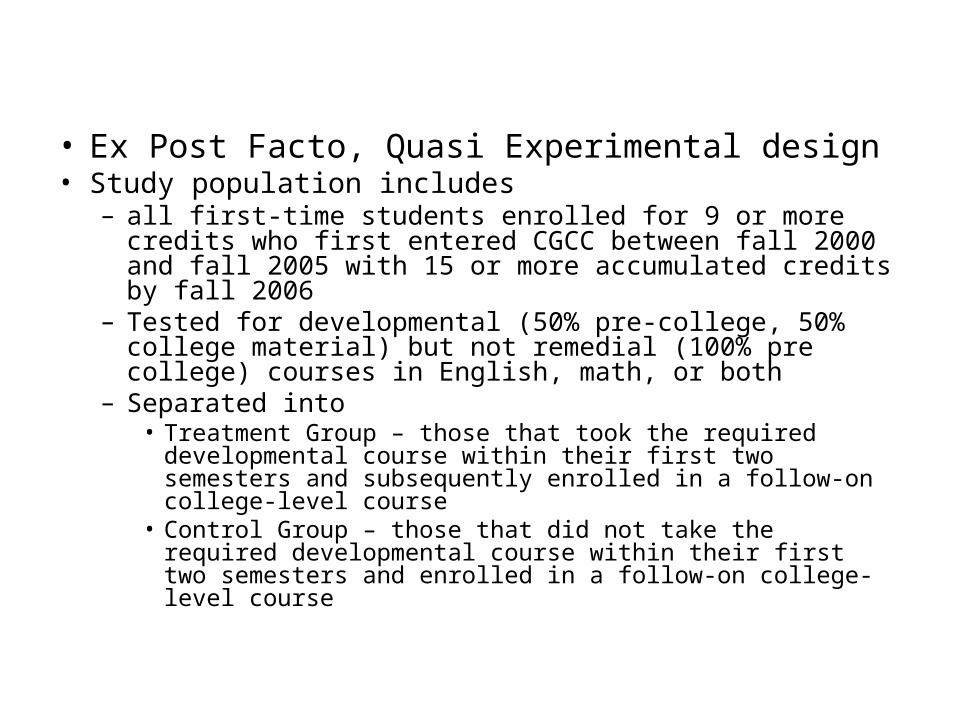
• Ex Post Facto, Quasi Experimental design• Study population includes
– all first-time students enrolled for 9 or more credits who first entered CGCC between fall 2000 and fall 2005 with 15 or more accumulated credits by fall 2006
– Tested for developmental (50% pre-college, 50% college material) but not remedial (100% pre college) courses in English, math, or both
– Separated into• Treatment Group – those that took the required
developmental course within their first two semesters and subsequently enrolled in a follow-on college-level course
• Control Group – those that did not take the required developmental course within their first two semesters and enrolled in a follow-on college-level course

• Control Group further broken down into subgroups– Those that tested or waived out of the requirement
• Advisor may waive EN100 requirement based upon review of writing sample (WAIVE)
• Student tests out of the course on the first day– Those that delayed taking the required course(s) beyond
their first two semesters (DELAY) but did not take a follow on course
– Those that managed to avoid the requirement altogether. Took follow on course w/o taking developmental (AVOID)
• Did drop then add in first week• Advisor error allowed student to enroll in follow-on course
(student did not take or failed the required developmental course)

Developmental English
58%
7%
17%
18%
Compy Test Waive Delay Avoid

Developmental Math
63%
3%
14%
20%
Compy Test Waive Delay Avoid
How the need for Pre College Coursework is Determined at CGCC

Course Placement at CGCC Using COMPASS• CGCC Uses the ACT COMPASS tests to make placement decisions for
selected first-time students:– Students with a non-Regents diploma, including students from other
states.– Students with a Regents diploma but whose grades are weak or
inconsistent (set at < 76).– Students with a GED.– Students without a high school diploma or GED.– Students who are or have been home-schooled.– Transfer students who have not successfully completed (C or better)
college-level or skill building coursework in English and math.
• The COMPASS tests provide an objective measure of students’ academic achievement and readiness for college and incorporates curriculum-based tests of educational development in: – English (writing)– mathematics– reading.

COMPASS Placement ScoreProbability of Success Chartfor Establishing Cutoff Points
100
0
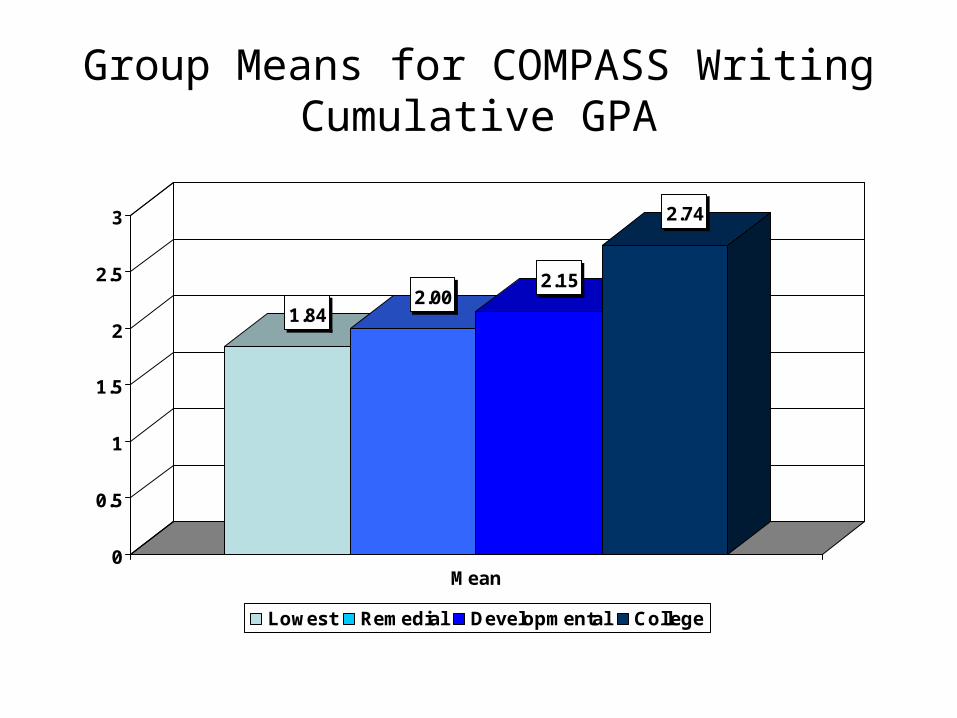
Group Means for COMPASS WritingCumulative GPA
1.842.00
2.15
2.74
0
0.5
1
1.5
2
2.5
3
Mean
Lowest Remedial Developmental College

Group Means for COMPASS WritingEarn Rate
0.552 0.5620.618
0.755
0
0.1
0.2
0.3
0.4
0.5
0.6
0.7
0.8
Mean
Lowest Remedial Developmental College

Group Means for COMPASS MathCumulative GPA
2.262.43
2.67 2.73
0
0.5
1
1.5
2
2.5
3
Mean
Lowest Remedial Developmental College

Group Means for COMPASS Math Earn Rate
0.619 0.645
0.742
0.878
0
0.1
0.2
0.3
0.4
0.5
0.6
0.7
0.8
0.9
Mean
Lowest Remedial Developmental College

The Columbia-Greene Study
Results
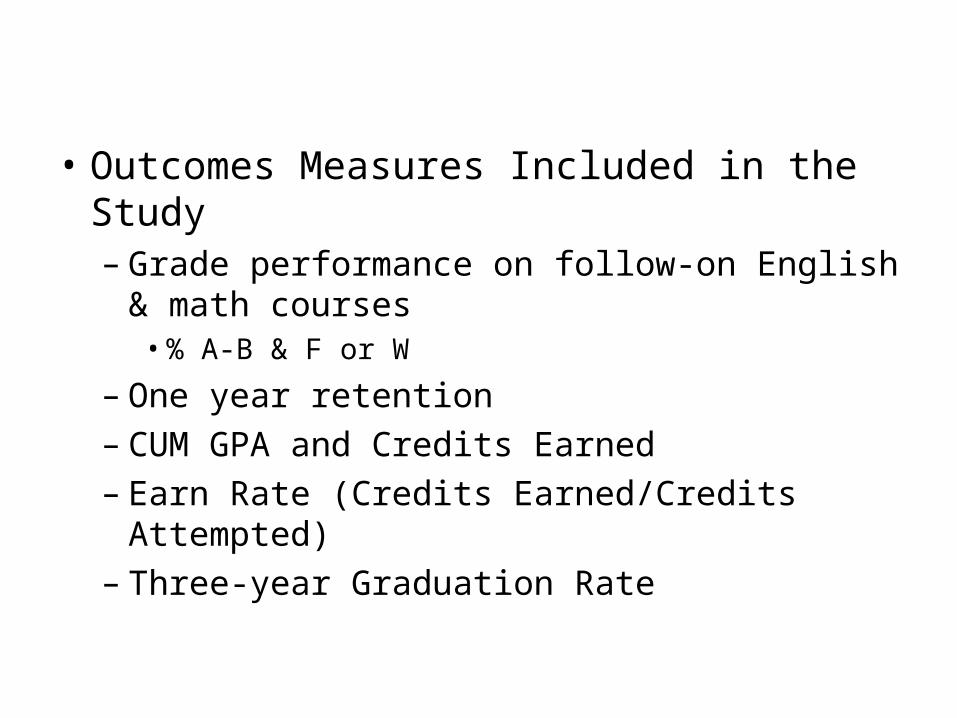
• Outcomes Measures Included in the Study– Grade performance on follow-on English &
math courses• % A-B & F or W
– One year retention– CUM GPA and Credits Earned– Earn Rate (Credits Earned/Credits Attempted)– Three-year Graduation Rate

Developmental English OnlyCumulative GPA
2.36
2.51
2.61
2.42
2.67
2.2
2.25
2.3
2.35
2.4
2.45
2.5
2.55
2.6
2.65
2.7
Treatment Control Waive Delay Avoid
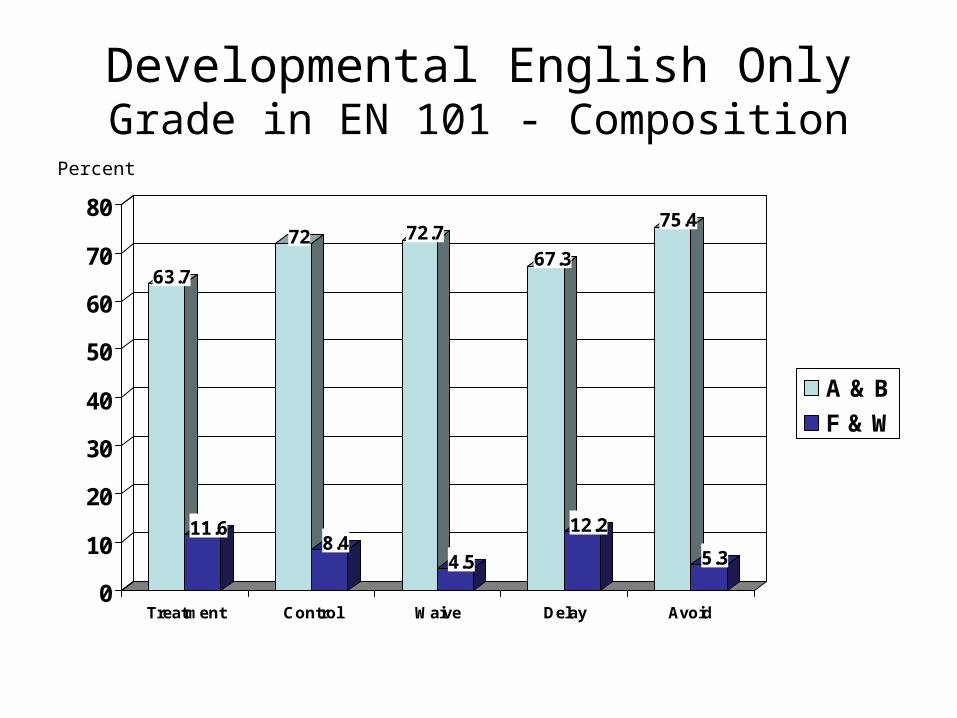
Developmental English OnlyGrade in EN 101 - Composition
63.7
11.6
72
8.4
72.7
4.5
67.3
12.2
75.4
5.3
0
10
20
30
40
50
60
70
80
Treatment Control Waive Delay Avoid
A & B
F & W
Percent

Developmental English OnlyOne Year Retention Rate
2005-06
62.6
65.7
68.2
65
63.8
59
60
61
62
63
64
65
66
67
68
69
Treatment Control Waive Delay Avoid
Percent

Developmental Math OnlyCumulative GPA
2.36
2.73
2.67
2.88
2.71
2.5
2.55
2.6
2.65
2.7
2.75
2.8
2.85
2.9
Treatment Control Waive Delay Avoid

Developmental Math OnlyGrade in Follow on Math Courses
40.8
20.6
50.6
12.4
53.1
9.4
46.7
16.7
50.7
21.7
0
10
20
30
40
50
60
Treatment Control Waive Delay Avoid
A & B
F & W
Percent

Developmental Math OnlyOne Year Retention Rate
2005-06
73.5
84.791.2
7581.4
0
10
20
30
40
50
60
70
80
90
100
Treatment Control Waive Delay Avoid
Percent


Developmental StudentsThree-Year Graduation Rate
26 25
43.9
37.5
0
5
10
15
20
25
30
35
40
45
EN Treatment EN Control MA Treatment MA Control
Percent

Conclusions
• Effectiveness of developmental courses is questionable as control group exhibits better academic outcomes on most indicators
• Non academic factors seem to play a large role (Control Group’s Savvy Student)
• More confident• Finds creative ways around requirement
– Obtains advisor waiver– Drop/Add ploy– Transfer in from another institution
• Need to examine other factors such as # tutoring hours, class attendance, goal commitment

Discussion/Questions

Exam Question

What is the difference between a dead dean and a dead skunk lying in the middle of the road?