Embed Size (px)
Citation preview
Measuring the clustering Measuring the clustering of galaxies in COSMOSof galaxies in COSMOS
Olivier Le Fèvre, LAM
Why ?Why ? How ? correlation functionHow ? correlation function What has been done from other What has been done from other
datasets ?datasets ? Toward a strategy for COSMOSToward a strategy for COSMOS
– Use the unique parameter spaceUse the unique parameter space– Capitalize on morphology Capitalize on morphology
measurementsmeasurements
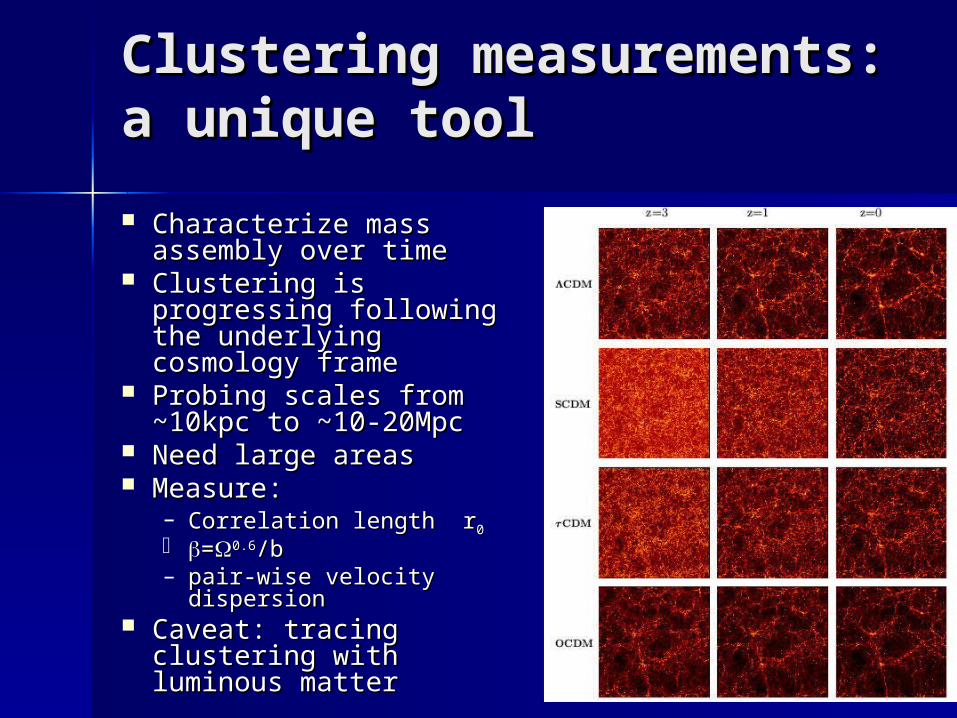
Clustering Clustering measurements: a unique measurements: a unique tooltool Characterize mass Characterize mass
assembly over timeassembly over time Clustering is progressing Clustering is progressing
following the underlying following the underlying cosmology framecosmology frame
Probing scales from Probing scales from ~10kpc to ~10-20Mpc~10kpc to ~10-20Mpc
Need large areasNeed large areas Measure:Measure:
– Correlation length rCorrelation length r00 ==0.60.6/b/b– pair-wise velocity pair-wise velocity
dispersiondispersion Caveat: tracing Caveat: tracing
clustering with luminous clustering with luminous mattermatter

Standard Standard methodmethod
Compute 2-point correlation function Compute 2-point correlation function (r(rpp, , ) and projection w(r) and projection w(rpp))
Higher order statistics: a powerful tool Higher order statistics: a powerful tool in COSMOS fieldin COSMOS field
2DFGRS
COSMOS-Subaru, Guzzo et al.
Constraints on COSMOS: Constraints on COSMOS: what has been done what has been done before ? before ? COSMOS do not need to repeat COSMOS do not need to repeat
previous experimentsprevious experiments Many other datasets with deep multi-Many other datasets with deep multi-
wavelength and/or HST morphology wavelength and/or HST morphology information existinformation exist– Photo-zPhoto-z– Spectro-zSpectro-z– Wide fields / deep fieldsWide fields / deep fields
No other single daset with same wide No other single daset with same wide field, depth AND HST morphologyfield, depth AND HST morphology
Current Current measurements: VVDSmeasurements: VVDS VVDS-DeepVVDS-Deep 9000 spectroscopic redshifts, 9000 spectroscopic redshifts,
IAB=24IAB=24 0.7x0.7 deg², up to z~20.7x0.7 deg², up to z~2
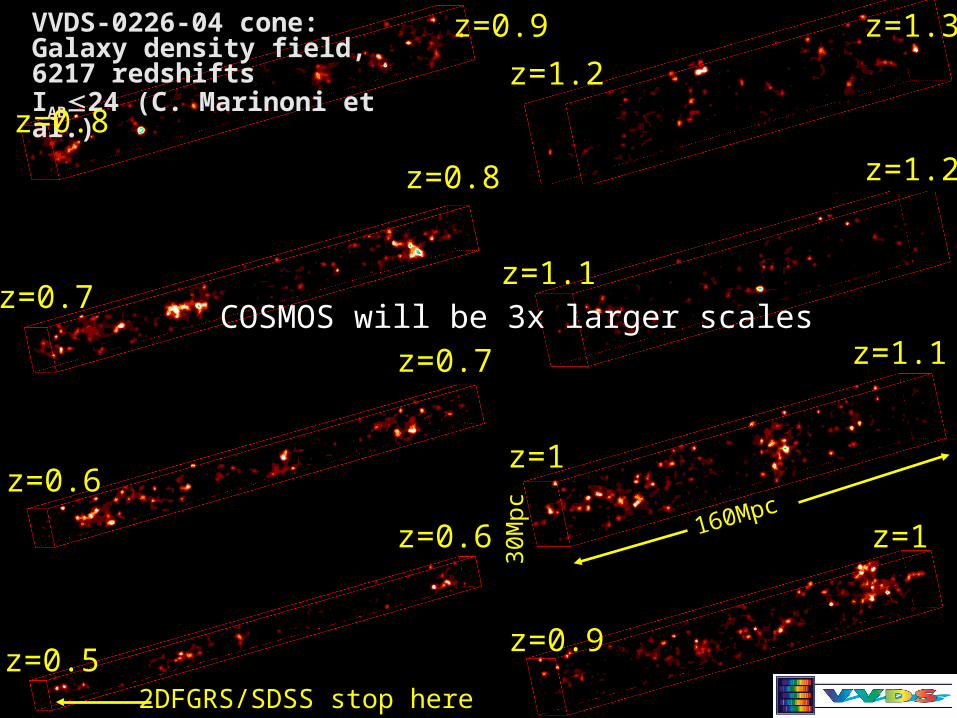
VVDS-0226-04 cone: Galaxy density field, 6217 redshiftsIAB24 (C. Marinoni et al.)
2DFGRS/SDSS stop herez=0.5
z=0.6
z=0.6
z=0.7
z=0.7
z=1.3
z=0.8
z=0.8
z=0.9
z=0.9
z=1
z=1
z=1.1
z=1.1
z=1.2
z=1.2
160Mpc30
Mpc
COSMOS will be 3x larger scales
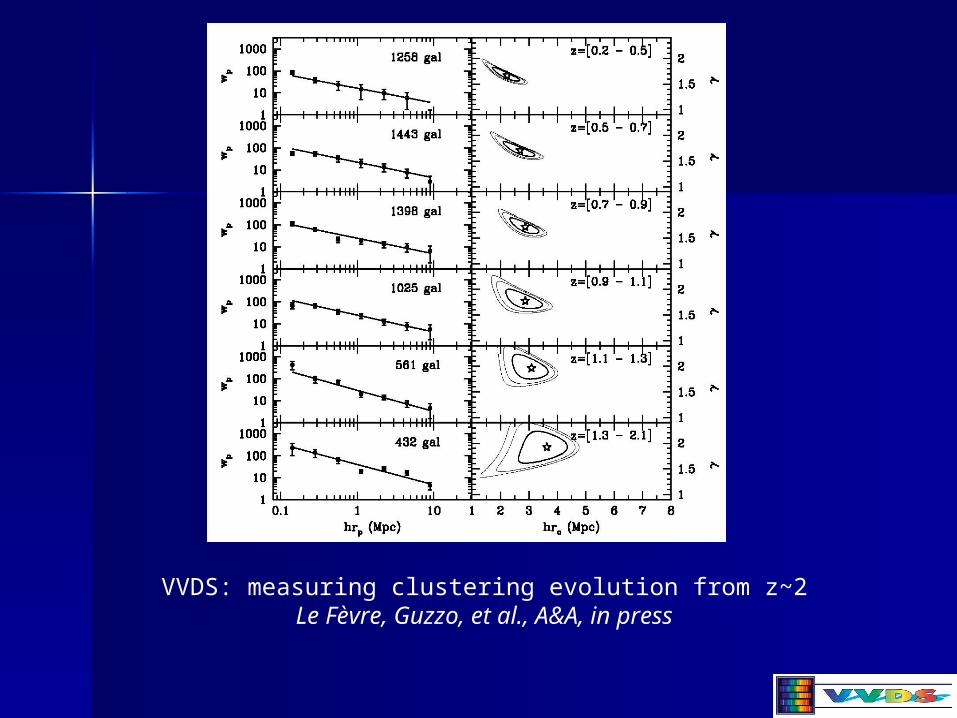
VVDS: measuring clustering evolution from z~2Le Fèvre, Guzzo, et al., A&A, in press
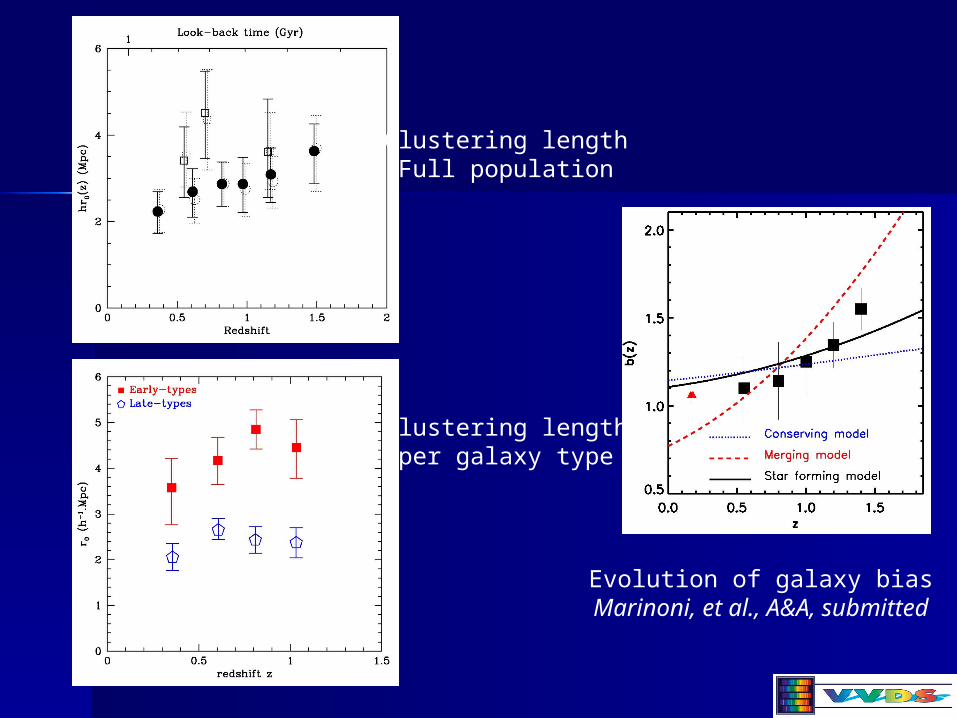
Evolution of galaxy biasMarinoni, et al., A&A, submitted
Clustering lengthFull population
Clustering lengthper galaxy type
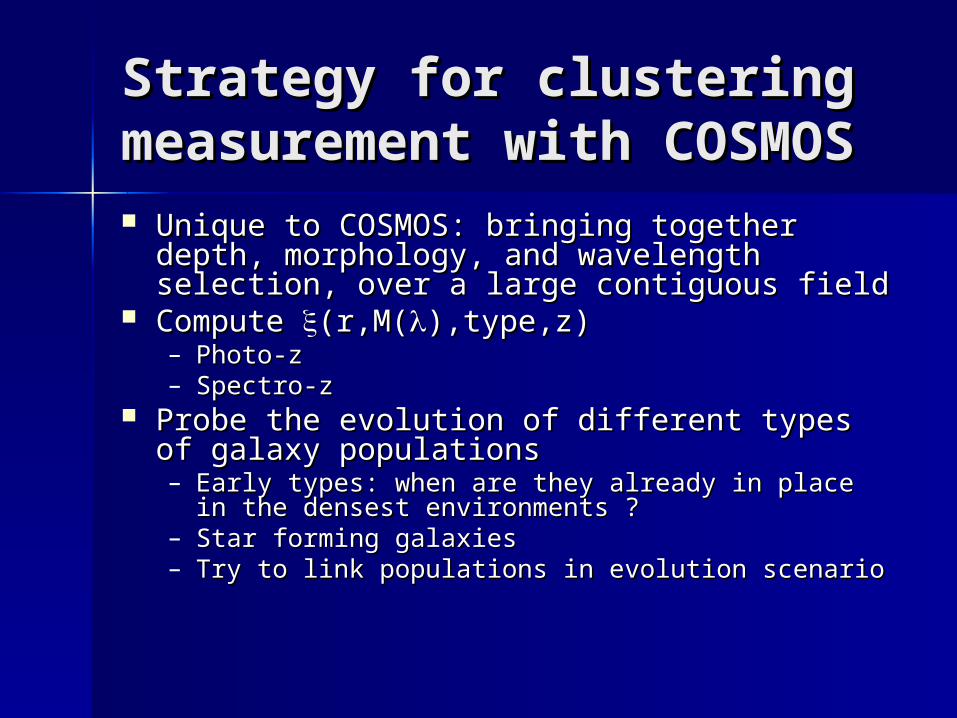
Strategy for clustering Strategy for clustering measurement with measurement with COSMOSCOSMOS Unique to COSMOS: bringing together depth, Unique to COSMOS: bringing together depth,
morphology, and wavelength selection, over morphology, and wavelength selection, over a large contiguous fielda large contiguous field
Compute Compute (r,M((r,M(),type,z)),type,z)– Photo-zPhoto-z– Spectro-zSpectro-z
Probe the evolution of different types of Probe the evolution of different types of galaxy populationsgalaxy populations– Early types: when are they already in place in the Early types: when are they already in place in the
densest environments ?densest environments ?– Star forming galaxiesStar forming galaxies– Try to link populations in evolution scenarioTry to link populations in evolution scenario

key parameter at high-key parameter at high-z: morphologyz: morphology Select large morphology-selected sub-Select large morphology-selected sub-
samplessamples– assume 500-1000 galaxies for a proper assume 500-1000 galaxies for a proper
calculation of wpcalculation of wp ACS-based ~3500A rest z~0.8:ACS-based ~3500A rest z~0.8:
– ~800,000 images: 1600 bins (z,type,M)~800,000 images: 1600 bins (z,type,M) NICMOS-based, ~1NICMOS-based, ~1m rest:m rest:
– ~20,000 images: 40 bins~20,000 images: 40 bins Need to train machine on eye classificationNeed to train machine on eye classification
– Reference sample need to be defined for Reference sample need to be defined for COSMOSCOSMOS

H-band NICMOS H-band NICMOS images: a very images: a very important datasetimportant dataset
H band improves H band improves photo-z for z>1photo-z for z>1
Compare ACS and Compare ACS and NICMOS NICMOS morphology morphology measurementsmeasurements– Understand Understand
differencesdifferences
On-going work: Lidia Tasca et al.Paper for ApJ 1st release
NICMOS tile
original GIM2D Model
Mask Residual

Clustering analysis of COSMOS data Clustering analysis of COSMOS data for 1st ApJ releasefor 1st ApJ release
Evolution of the correlation Evolution of the correlation function per morphological type:function per morphological type:– I band selected to z~1.2I band selected to z~1.2– H band selected to z~1.5H band selected to z~1.5– Photometric redshiftsPhotometric redshifts
Measurements at z~3-5 ?Measurements at z~3-5 ?– Need iteration on photometric Need iteration on photometric
catalogcatalogOn-going work: Baptiste Meneux et al.Paper for 1st ApJ release
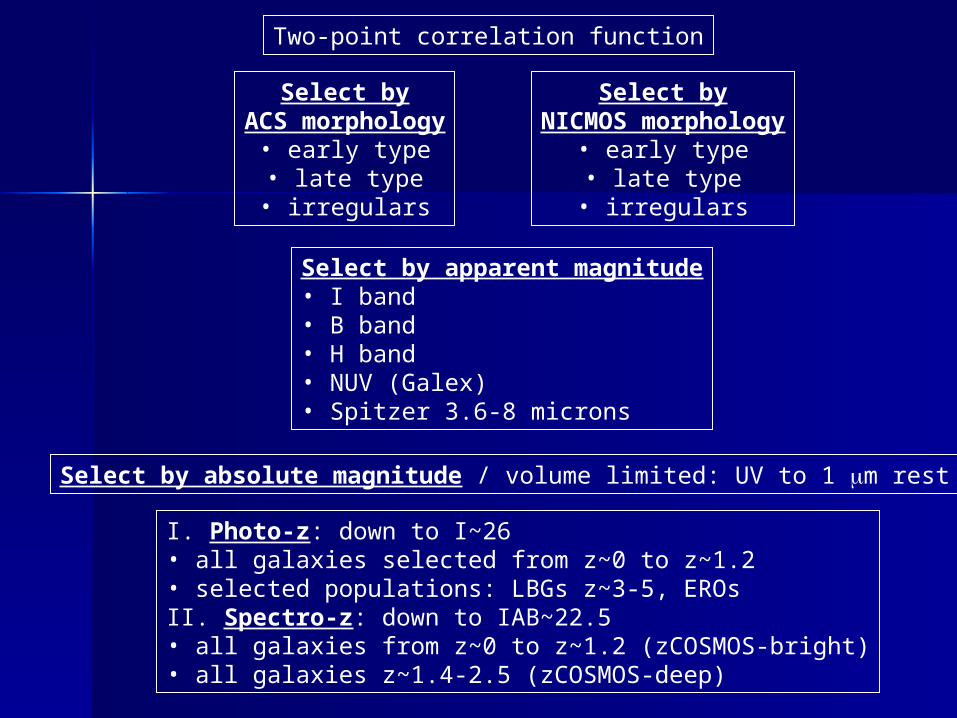
Select byACS morphology
• early type• late type• irregulars
Select byNICMOS morphology
• early type• late type• irregulars
Select by apparent magnitude• I band• B band• H band• NUV (Galex)• Spitzer 3.6-8 microns
Select by absolute magnitude / volume limited: UV to 1 m rest
Two-point correlation function
I. Photo-z: down to I~26• all galaxies selected from z~0 to z~1.2• selected populations: LBGs z~3-5, EROsII. Spectro-z: down to IAB~22.5• all galaxies from z~0 to z~1.2 (zCOSMOS-bright)• all galaxies z~1.4-2.5 (zCOSMOS-deep)
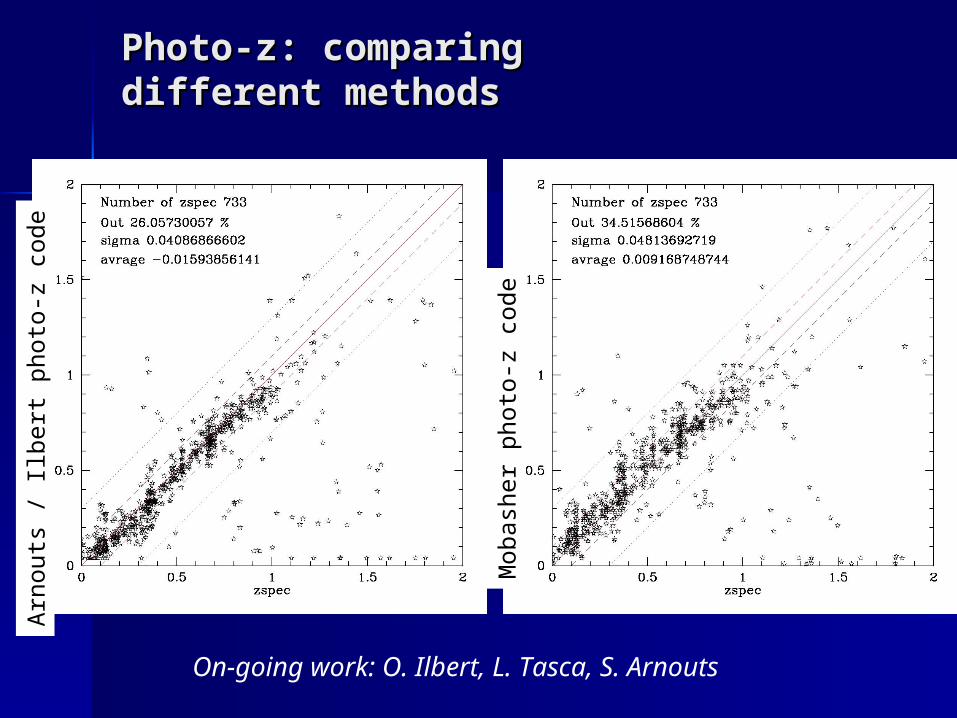
Photo-z: comparing Photo-z: comparing different methodsdifferent methods
On-going work: O. Ilbert, L. Tasca, S. Arnouts
Mobash
er
photo
-z c
ode
Arn
outs
/ Ilb
ert
photo
-z c
ode