Embed Size (px)
Citation preview

Measuring School Climate Using Existing Data Tools on Climate and Effectiveness to
Inform School Organizational Health
Rachel E. Durham Amie Bettencourt Faith Connolly
October 2014

Baltimore Education Research Consortium
BERC Executive Committee
Jennifer Bell-Ellwanger, Chief Accountability Officer, Baltimore City Public Schools
Diane Bell-McKoy, President and CEO, Associated Black Charities
Faith Connolly, Ph.D., Executive Director, Baltimore Education Research Consortium
Jacquelyn Duval-Harvey, Ph.D., Acting Commissioner for Youth and Families, Baltimore City Health Department
J. Howard Henderson, President and CEO, Greater Baltimore Urban League
Philip Leaf, Ph.D., Director, Center for the Prevention of Youth Violence, and Senior Associate Director, Johns Hopkins Urban Health Institute
Linda Chen, Chief Academic Officer, Baltimore City Public Schools
Glenda Prime, Ph.D., Chair, Department of Advanced Study, Leadership, and Policy, Morgan State University
Jonathon Rondeau, President & CEO, Family League of Baltimore City
Jane Sundius, Ph.D., Director, Education and Youth Development Program, Open Society Institute-Baltimore
Dr. Gregory Thornton , Ed.D., Chief Executive Officer, Baltimore City Public Schools
Without the assistance of numerous partners, this research would not have been possible. The authors extend their gratitude to Karen Webber-Ndour who was instrumental in ensuring this work was completed; Ryan Balch who provided technical expertise in understanding and analyzing the Student Survey on Teacher Practice, Michael Haugh, Megan Kenny, and Anne Lilly for providing important feedback and guidance throughout the project, and Michael Pih and Lawrence Reid for assistance in collecting and analyzing data.
The study was completed through the generous support of the Open Society Institute- Baltimore, The Jacob and Hilda Blaustein Foundation, and
The Aaron and Lillie Straus Foundation, and The Wright Family Foundation.

Baltimore Education Research Consortium
School Climate: Tools Schools Can Use i
Table of Contents
Executive Summary ........................................................................................................ v Background ..................................................................................................................... 1 Methodology ................................................................................................................... 3 Findings........................................................................................................................... 4
Climate Data Currently Collected ........................................................................... 4 Strengths and Limitations of the Data Tools ........................................................... 7 Relationships among Data Sources ....................................................................... 10
Summary and Recommendations ................................................................................. 19 References ..................................................................................................................... 22 Appendices .................................................................................................................... 23
Appendix A: A Climate Tool: The 12 Indicators of School Climate for All City Schools, 2012-13.................................................................. 24
Appendix B: National Center for School Climate: The 12 Dimensions
of School Climate Measured .............................................................. 25 Appendix C: The Climate Walk Tool ................................................................... 26 Appendix D: Baltimore City Schools School Effectiveness Framework ............. 26 Appendix E. Baltimore City Schools Instructional Framework ............................ 30 Appendix F: Instrument Item Correspondence with NSCC Climate
Domains and Organizational Health Tool ......................................... 28

Baltimore Education Research Consortium
School Climate: Tools Schools Can Use ii
List of Tables
Table 1. List of the National School Climate Center’s Domains and
Indicators ........................................................................................................ 2 Table 2. Instrument Administration Schedule and Use of Data Collected ................... 4 Table 3. Correlations between School Effectiveness Review and School
Survey of Staff and Students ........................................................................ 12 Table 4. Correlations between School Survey for Students and Staff and
the Student Survey on Teacher Practice ....................................................... 13 Table 5. Correlations between School Effectiveness Review and Student
Survey on Teacher Practice .......................................................................... 14 Table 6. Correlations between Suspensions, School Effectiveness Review,
and Student and Staff School Survey Responses ......................................... 15 Table 7. Correlations between Chronic Absence Rate and other Climate
Data .............................................................................................................. 17

Baltimore Education Research Consortium
School Climate: Tools Schools Can Use iii
List of Figures
Figure 1. A Climate Tool: The 5 Domains of School Climate for All City
Schools, 2012-13 ............................................................................................ v Figure 2. Coverage of City Schools’ Data Points for the National School
Climate Center Domains and Indicators ...................................................... 11

Baltimore Education Research Consortium
School Climate: Tools Schools Can Use iv
This page intentionally left blank.

Baltimore Education Research Consortium
School Climate: Tools Schools Can Use v
Measuring School Climate: Using Existing Data Tools on Climate and Effectiveness to Inform School Organizational Health
Rachel E. Durham, Amie Bettencourt, and Faith Connolly
Executive Summary
Despite—or perhaps due to—the lack of consensus on its definition, there is abundant interest in and research on school climate. Researchers have determined that improving school climate is one way to increase academic achievement, school safety, school completion, teacher retention, healthy social interactions, and student well-being (Cohen, 2010; Dynarski, Clarke, Cobb, Finn, Rumberger, & Smink, 2008). Baltimore City Schools understands the importance of school climate and deploys multiple tools every year to understand and describe it. This report follows up on a previous BERC report, Positive School Climate: What It Looks Like and How It Happens. In that report, examples of principal and school actions to improve school climate were highlighted and reviewed. At its conclusion, questions remained about how schools, principals, and district administrators measure school climate. What follows is an overview of the data currently being collected by City Schools related to school climate and a proposal for how these disparate data sources can be summarized to inform school organizational health. For this report, the multiple measures used by Baltimore City Schools (School Survey data from students and staff, Climate Walk data, School Effectiveness Review [SER], and the Student Survey on Teacher Practice [SSTP]) are aligned with the domains and indicators proposed by the National School Climate Center. Using data collected in 2012-13, the findings suggest that while each source addresses different school climate domains with varying emphasis, all instruments are strongly related to one another and yield broadly similar conclusions about a school. Given their alignment, it is possible to generate tools a school can use to make sense of the copious data and identify points where further supports and attention could produce meaningful change in a school’s overall climate and health. An example of such a tool is shown in Figure 1 (a more detailed version can be found in Appendix A). The Organizational Health Tool combines staff responses from the School Survey with student responses from the SSTP and aligns these with the five categories proposed by the National School Climate Center. These two data sources are highly correlated with reports from the School Effectiveness Reviews (SERs) and capture both adult perceptions of climate across the building as well as student perceptions of classroom climate and instruction. The validity of these measures is further supported by the connection between both attendance, suspensions and other school climate data. Baltimore City continues to struggle with attendance and high levels of chronic absence, and initiatives to improve attendance should include conversations about school climate. Manipulating school climate may offer a means to intervene and increase student engagement and attachment to school.

Baltimore Education Research Consortium
School Climate: Tools Schools Can Use vi
Figure 1. Organizational Health Tool for Schools and Districts
We anticipate that the Organizational Health tool can be a powerful way for schools to visualize their current climate meaningfully for strategic planning. It can identify specific areas of strength in a school and areas for improvement. While available only annually, it comports with the challenges to adjust school climate. Adjustment will not be accomplished in a few months, but will need sustained attention and improvement to optimize the impact for student success. An annual report of every school’s climate—as well as for the district as a whole—can provide a benchmark as the district and its schools undertake the difficult work of changing school climate in a profound way.

Baltimore Education Research Consortium
School Climate: Tools Schools Can Use 1
Measuring School Climate: Using Existing Data Tools on Climate and Effectiveness to Inform School Organizational Health
Rachel E. Durham, Amie Bettencourt, and Faith Connolly
Background
Previous Baltimore Education Research Consortium (BERC) reports have reviewed the role of school climate as a means for school administrators to use to improve outcomes (Smith, Connolly, & Pryseski, 2014). The Institute of Education Sciences (IES) advocates enhancing school climate as a strategy for dropout prevention, and the U.S. Department of Education recommends school climate reform as an evidence-based strategy to prevent violence. In fact, the U.S. Department of Education is investing in school climate improvement efforts as a fundamentally important school reform strategy (Jennings, 2009). Essentially, school climate captures how students, teachers, and parents view their school and is correlated with social, emotional, and academic outcomes (Arum, 2003; Bear, 2005; Pianta, 1999). Schools with positive school climate also enjoy fewer behavior problems, increased academic achievement, higher levels of student self-esteem, and greater overall commitment to school among the school community (Arum, 2003; Bear, 2005; Pianta, 1999). There is a growing body of work supporting the importance of climate in promoting academic achievement, school safety, dropout prevention, teacher retention, healthy social interactions, and well-being (Cohen, 2010; Dynarski, Clarke, Cobb, Finn, Rumberger, & Smink, 2008). Although there is no common definition of school climate, efforts to measure and manipulate climate have uncovered several common elements that are tightly tied to higher achievement and reported satisfaction with schooling among school staff and students. With the goal of synthesizing the research on climate and creating a unifying framework, the National School Climate Center (NSCC)1 offers school leaders a simplified typology of five domains, along with 12 specific indicators as shown in Table 1 (see also Appendix B for complete descriptions of each indicator). We use this typology as an organizing framework to examine the coverage and alignment of four tools Baltimore City Schools (City Schools) uses in its efforts to measure and improve school climate. The tools highlight different domains of school climate, and this analysis offers the first synthesis of these disparate efforts to examine their relative strengths and weaknesses and, most importantly, to ascertain the extent to which they identify enduring and persistent features of climate at individual schools. Improving the measurement of school climate in Baltimore City by integrating its existing data collection initiatives will help City Schools in its ongoing effort to monitor and improve the climate in its schools.
1 Retrieved May 2, 2014 from http://schoolclimate.org/programs/documents/dimensions_chart_pagebars.pdf

Baltimore Education Research Consortium
School Climate: Tools Schools Can Use 2
Table 1 List of the National School Climate Center’s Domains and Indicators
Domain Indicators
Safety Rules and Norms
Sense of Physical Safety Sense of Social-emotional Security
Teaching & Learning
Support for Learning Social and Civic Learning
Interpersonal Relationships
Respect for Diversity Social Support from Adults Social support among Students
Environment
School Connectedness and Engagement Physical Surroundings
Leadership/Staff Relations (“Staff Only” in NSCC model)
Leadership Professional Relationships
Increasingly, Baltimore City Schools is targeting its attention and resources on documenting and improving school climate. City Schools now collects a wealth of data on climate using several different instruments, which is an often-overlooked asset. These tools and information, if used holistically and collaboratively, can more accurately target attention and resources toward monitoring and professional development around organizational health, and ultimately, student well-being.

Baltimore Education Research Consortium
School Climate: Tools Schools Can Use 3
Methodology
This investigation was requested as a follow-up to a study BERC conducted on school climate. In that process, we identified four separate tools administered by different offices at the district, and which were being used for separate purposes. This analysis examines these tools to understand school climate from different angles and to determine how each, alone or in combination, can help move climate improvement work forward. This report is guided by the following research questions: 1) What data are being systematically collected by City Schools that can speak to school
climate, effectiveness, and organizational health?
2) What are the strengths and limitations of each data source?
3) How do the different data sources relate and correspond to each other? Data from four sources are featured in this report: 1) The School Survey data for SY 2012-13 were collected by the Office of Achievement and
Accountability and included individual-level likert responses from three constituencies -- students, school staff, and parents. Only student and staff survey responses are featured in this report.2
2) The School Effectiveness Review data for SY 2012-13, also collected by the Office of
Achievement and Accountability, represented 54 schools, and included summary scores between 1 and 4 to indicate effectiveness on each of 13 key actions (there was one additional key action for charter or operator-led schools).
3) Climate Walk data for 2012-13 were collected by School Network staff and are qualitative
reports about whether particular features of a school were observed during a school Climate Walk, along with open-ended comments about what was observed by the network staff member.
4) Student Surveys on Teacher Practice for 2012-13 were administered by staff in the Office of
Achievement and Accountability to students in grades 3 through 12, and included likert responses (ranging between 1 and 5 from “never” to “always”) to questions concerning classroom culture, student interaction, classroom management, and content delivery. Students complete the survey with respect to a single, specific teacher.
Historical and technical information about all of these sources were gathered during meetings and conversations with district office staff that occurred between September 2013 and June 2014.
A set of bivariate analyses revealed strong correspondence between three of the data sources, including two that are collected in all schools annually. These analyses were performed by
2 We did not incorporate parent responses because of uneven response rates across the district, as discussed further below.
Baltimore Education Research Consortium
School Climate: Tools Schools Can Use 4
grouping school level data collected from these three sources into corresponding NSCC domains and indicators, and then estimating statistical correlations between these domains. At the end of the report we propose an Organizational Health tool to synthesize and monitor these disparate but related sources of valuable information on school climate.
Findings
In this section, we provide more detail about the data City Schools currently collects, how the data are collected, and how they are being used. After a discussion of each source’s strengths and limitations, we present the results of a statistical analysis to show the extent to which disparate climate-related data yield consistent information about a school. Finally we provide implications and suggestions about how school climate data could be even better leveraged in efforts to understand and improve climate. School Climate Data Collected by City Schools City Schools currently collects four sources of climate data. Table 2 identifies each tool, how frequently it is administered, and its original intended use.
Table 2 Instrument Administration Schedule and Use of Data Collected
Tool Administration Intended Usage
School Survey Once every spring in all schools.
To provide summary data from parents, students, and staff of their perceptions on:
Administration Creativity & the Arts Family Involvement Student Grit Learning Climate Meaningfulness of Work Physical Environment School Resources Safety Teachers Satisfaction with the School.
Climate Walk The original goal was twice per year in each of 203 schools; in 2012-13, 75 schools were visited just once, and 21 were visited twice or more.
To provide a snapshot of a school’s climate. At the conclusions of the Climate Walk, the observer meets with a member of the school leadership team to review the findings and discuss the school’s overall efforts around climate.

Baltimore Education Research Consortium
School Climate: Tools Schools Can Use 5
Table 2 Instrument Administration Schedule and Use of Data Collected
Tool Administration Intended Usage
School Effectiveness Review (SER)
Approx. 60 schools per year, with the goal to have covered all schools by EOY 2014-15
To provide a detailed, “consistent, transparent” and comprehensive review, a “holistic snapshot” and ratings to inform the Key Actions within four broad domains of school effectiveness. It is explicitly not intended to report on compliance, specific teachers, or provide recommendations. ϯ
Student Survey on Teacher Practice (SSTP)
Once every spring for all teachers of 3rd-12th grade students.
To provide data on students’ perception of teacher’s classroom and instruction. In later years, these data will also be shared with principals, and considered for inclusion in the teacher’s annual evaluation.
ϯ “School Effectiveness Review Process.” Presented at the Office of Achievement and Accountability’s monthly JHU Research Sharing Lunch on March 6, 2014.
School Survey. The longest-used climate instrument in City Schools is the School Survey3. The Office of Achievement and Accountability (OAA) administers four versions of it every spring in all schools. There is a version for students in grades 3 through 5, a second for students in grades 6 through 12, a version for school staff, and one for parents. Response options range from 1 to 4 for “strongly disagree” to “strongly agree” and are aggregated for each school and reported publicly on City Schools’ website. For an example, visit http://www.baltimorecityschools.org/Page/24839. School Survey questions are intended to solicit perceptions along several dimensions. For students, questions are asked concerning their feelings about the physical and learning environment, support from peers, teachers, and staff, whether rules and punishments are fair, safety, and general satisfaction with their school. School staff are asked related questions, but additionally about whether their work is meaningful, their relationships with other staff, and how supportive the school’s leadership is of their efforts and input. Parents are asked about general satisfaction with their child’s school, and specifically the extent to which teachers and other staff show personal concern for their child, whether the school is adequately preparing their child for a career, and their satisfaction with parent communication and engagement efforts.
3 Public reporting of the School Survey extends back to SY 2004-05, but even that administration was a subsequent iteration of earlier efforts to understand high school culture, perhaps dating from as early as 1997 (Personal Communication, Martha A. Mac Iver on January 8, 2014).
Baltimore Education Research Consortium
School Climate: Tools Schools Can Use 6
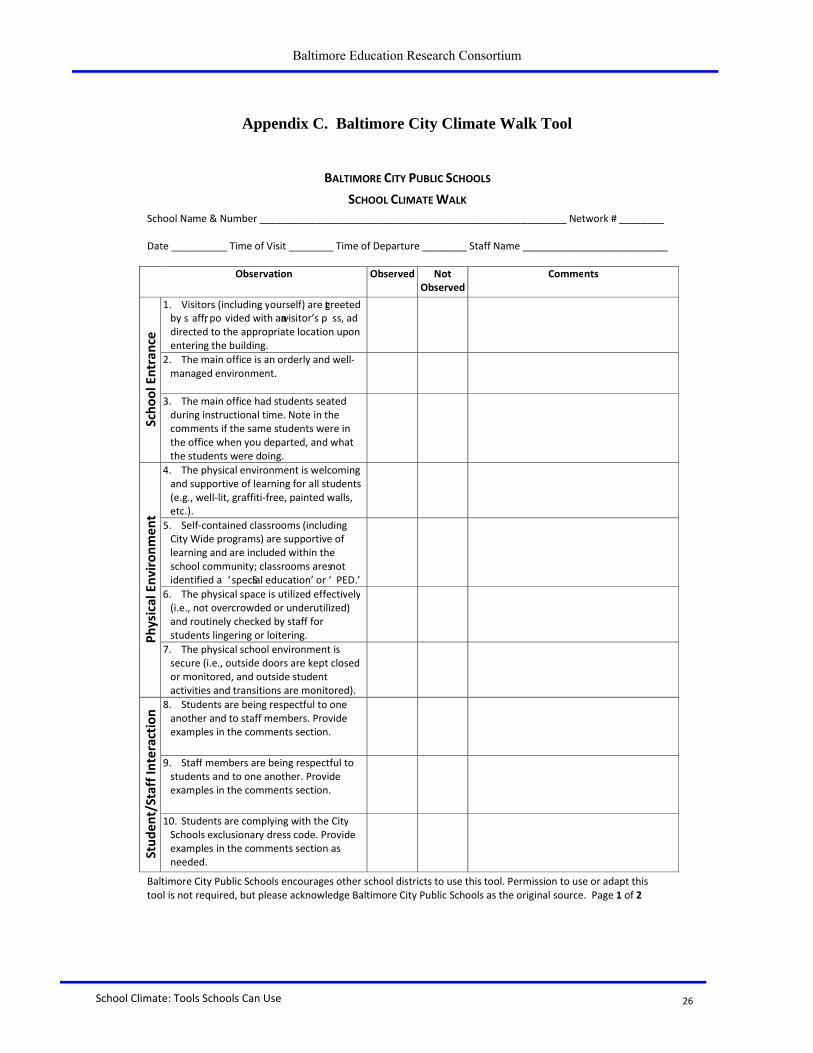
The Climate Walk. Starting in 2012-13 the Office of Student Support and Safety (OSSS) initiated “School Climate Walks.” The idea originated with the Executive Director of OSSS, who, as a former principal, arrived with a strong belief in the value of a school’s climate and its impact on learning. The Executive Director had an immediate desire to visit every school in the district to learn first-hand about each one, but such an effort is unrealistic in a district of over 200 schools. Instead, in cooperation with a team of Student Support Liaisons (who regularly visit all the schools grouped within their assigned district network as part of their responsibilities), a cross-functional team designed a two-page walk-through observation protocol to capture climate data for each school and held training for its implementation among network personnel. (See Appendix C for the original version of this instrument.) A benefit of using a walk-through protocol is that it can quickly capture consistent information in different schools, across standardized dimensions that are of interest to OSSS. The dimensions included on the walk-through protocol include the school entrance area, the physical environment, student and staff interactions, transitions to and from class, classrooms, and specific facilities (i.e., the cafeteria, the health suite, and the bathrooms). For each dimension, two to three specific ideal scenarios are stated, and the observer is instructed to mark ‘observed or ‘not observed’ for each item. For instance, within the dimension school entrance, item #1 states, “Visitors (including yourself) are greeted by staff, provided with a visitor’s pass, and directed to the appropriate location upon entering the building.” School Effectiveness Review (SER). In 2009-10 City Schools was awarded a grant for a pilot study of measuring school effectiveness. After using four schools to explore its feasibility, the following year school visit protocols were developed with the aim of aligning the review with School Performance Plan expectations and the city’s new Instructional Framework. In 2011-12, 24 schools were visited, followed by 55 more in 2012-13. The intention was to visit schools on a rolling basis with all schools having been covered by the end of 2014-15. For each key action, OAA staff review relevant documents submitted by the school, and over a two day visit conduct interviews or focus groups with staff, students, family members, community partners and school leaders, as well as perform detailed classroom observations on a random selection of classrooms. The data collected are then analyzed and using a pre-determined rubric, a discrete score for each key action is assigned. Scores range between 1 and 4, with 1=“Not Effective,” 2=“Developing”, 3=“Effective”, and 4=“Highly Effective”. Examples of climate-relevant key actions included in the SER include:
“Teachers establish a classroom environment in which teaching and learning can occur.” “The culture of the school reflects and embraces student, staff, and community.”
diversity.” “The school provides a safe and supportive learning environment for students, families,
teachers, and staff.” “The school cultivates and sustains open communication and decision-making
opportunities with families.”

Baltimore Education Research Consortium
School Climate: Tools Schools Can Use 7
At the conclusion of the school visit, the SER team leader holds a discussion with school leaders to highlight outcomes of the visit, share quantitative results of the classroom observations, and assist the school leadership team in writing an action plan based on the results of the SER. (See Appendix D for more detail about the SER framework and rubric.) Student Survey on Teacher Practice (SSTP). Researchers in the Office of Achievement and Accountability recently developed the SSTP, a questionnaire that asks students in grades 3-12 questions specific to a single teacher and his/her instruction, and the data are especially relevant to the Teaching and Learning domain of school climate. The SSTP was field tested in 2011-12 and implemented in all schools in 2012-13. Similar to the TRIPOD instrument developed at Harvard by Ron Ferguson (Ferguson, 2008), but explicitly aligned with City Schools’ Instructional Framework, the SSTP elicits responses from students to questions about their experiences in the classroom using a likert scale. Response options to these items are “Never”, “Sometimes”, “Often”, “Almost Always”, and “Always”, and results can be aggregated to the classroom or school level. Examples (and their intended aspect of classroom functioning) include:
“We are learning or working during the entire class” (the extent to which classroom time is used productively)
“My teacher tells the class when we are behaving well” (proactive classroom management)
“My teacher encourages us to ask questions in class” (how often the teacher uses various student-involvement techniques)
“My teacher treats students fairly” (whether a positive classroom culture has been established)
“Everybody knows what they should be doing in this class” (whether lessons and assignments are clearly explained)
“My teacher wants us to use our thinking skills, not just memorize things” (whether the lessons reflect academic press)
City Schools’ Instructional Framework specifies nine elements of effective instruction, (see Appendix E) which for correspondence with the SSTP were further collapsed into the following four domains:
1. Classroom Management, 2. Classroom Culture, 3. Content Delivery, and 4. Student Involvement.
The first two of these, Classroom Management and Classroom Culture, most directly impact the environment in which classroom learning takes place and can be considered indicators of classroom climate, while the remaining two, Content Delivery and Student Involvement, refer to more technical dimensions of instruction and are not included in the current analysis.
Baltimore Education Research Consortium
School Climate: Tools Schools Can Use 8
Strengths and Limitations of the Data Tools
School Survey
Strengths: The School Survey is unique among these tools in two ways. First, it is the most mature, validated and familiar of City Schools’ instruments. Second, it solicits information from multiple constituents – students, building staff, and families, so it gauges satisfaction in a way that can be triangulated to provide a perception of the school’s functioning from multiple perspectives. A great benefit is that it provides an overall picture of the school that weighs each individual’s response equally. These perceptions can, in turn, provide principals and district administrative staff clues about areas in which further efforts could improve school climate in a way that can increase parental involvement, raise student engagement and achievement, and attract and retain talented teachers and support staff. Limitations. Consistently getting a practical response rate has been challenging. The survey is administered to students during the school day, and as a result, student response rates have historically been among the least problematic. However, limiting administration to a paper survey taken only during the school day may result in a bias towards more engaged students, since chronically absent students are less likely to be represented. Staff response rates for 2012-13 averaged around 65% but varied by school, with nearly all schools having at least half of their staff participating, and a small handful having response rates lower than 40%. Parent response rates are especially problematic. In 2012-13, one-third of schools had fewer than 30 parent participants, although one-fifth of schools had 100 or more responding. Regardless, since parents may have multiple children enrolled in any school, calculating a response rate is challenging. An additional challenge is that too often schools do not use the data, which may leave families, students and staff unmotivated to spend their time and energy on participating if they do not perceive that meaningful action occurs as a result of their input.
Climate Walk
Strengths: The Climate Walk provides timely information that can be immediately communicated with school staff. Furthermore, the data gathered provide a unique opportunity for district and school staff to reflect on concrete phenomena and collaborate around ways to respond to their implications. It is unique in its goal of assessing climate via a physical, real-time appraisal of school events. A recent review of middle school climate instruments conducted by the WestEd (the Regional Education Laboratory for Western states) resulted in a list of existing tools that was exclusively composed of surveys (Voight and Hanson, 2012). The Climate Walk, in contrast to survey data, can yield logs about specific incidences as well as information about the overall health of a school. The data are qualitative, instantaneously actionable, and can help raise warning flags about potential underlying problems. Limitations: The original intention was to conduct a Climate Walk at least once each year in every Baltimore City school, with one or two follow-up Climate Walks for any school in which an initial visit pointed to challenges or inconsistencies. In practice, during 2012-13, about half of

Baltimore Education Research Consortium
School Climate: Tools Schools Can Use 9
City Schools were observed with the Climate Walk tool. The Climate Walk is fairly labor- and time-intensive, though the trade-off is the benefit of highly nuanced information about the school’s environment, as well as the opportunity it provides for network staff to work with school leaders around climate. The tool solicits information about the school from a single district official each time it is used and reflects the experiences, training, and pre-existing beliefs of just one staff member during a single visit. Typically, the same official visits the same set of schools during the year. As a result, there were instances where the observing official offered comments referring to earlier incidents not present during the current observation or simply reported existing knowledge about a school. So, while these administrators are highly knowledgeable about the schools they observe, unfortunately this arrangement can have the unintended effect of the observer recording comments based on earlier visits and knowledge about the school that do not necessarily reflect what was seen during a particular observation cycle. Climate Walk data from 2012-13 suggested that visits lasted from 50 minutes to over two hours, which may either reflect variation in school size, or inconsistency in implementation. Inconsistency across observers in how long each spends in the school could contribute to issues around the validity, quality and quantity of the information collected. If an observation is rushed then it is more likely to be done in a perfunctory way without the attention to detail that is a unique strength of collecting climate data in this manner.
School Effectiveness Review
Strengths: The SER process is extraordinarily comprehensive and takes into account school functioning at all levels, and features data collected from all constituencies, including community partners. The process takes several days to complete with additional time required to process and consolidate the data into the report that is provided to the school. The review provides a broad picture of organizational health that reflects governance, leadership, classroom processes, as well as individual perceptions. Although the SER is not a climate instrument per se, several key actions on the SER unquestionably address the school’s climate. The results offer an extremely in-depth inventory of the school’s climate assets and the areas in which concentrated effort would yield improvement. Limitations: Given that the SER entails a time-intensive, costly, comprehensive review of many school-level inputs, practices and outcomes, it cannot be viewed as a source for immediate, “timely” information. Moreover, conducting a review for all schools takes several years. Results are intended to be used in long-view school improvement efforts that require holistic, across-the-board action plans.
Student Survey on Teacher Practice
Strengths: The SSTP data are a valuable resource because they provide insight into the “black box” of the classroom, specifically students’ perspective on their classrooms and the habits of their teachers. Such data is often collected using classroom observation protocols; yet an observation only reflects the classroom at a single time point, observations are both time and cost

Baltimore Education Research Consortium
School Climate: Tools Schools Can Use 10
intensive, and they are subject to the perspectives of the one adult who visits that classroom. Student survey data reflect the perceptions of the intended impacted population (students) who spend time daily with their teachers. Student surveys are also more logistically economical (especially if they can be completed electronically), and are capable of providing not just one snapshot but perceptions about experiences over a longer time frame. As previously stated, the SSTP is new and is not yet being used as a formal evaluative tool by the district, nor was it designed to document school climate, but SSTP data can be used to provide teachers and principals with detailed classroom climate data that informs the relationship between student achievement and classroom dynamics. Research investigating the connection between student achievement and data collected using similar tools has demonstrated that such survey responses are strongly related to student outcomes. In other words, students are incredibly reliable reporters about their teachers and other classroom factors (c.f., Ferguson, 2012). Further, it would be hard to argue that effective, relevant, and engaging instruction does not weigh into a school’s overall climate. Classroom experiences are central features of school climate, since students spend the majority of their school day in the classroom. This means that a student’s overall perception of a school’s climate is heavily influenced by their classroom experiences. Limitations: In conversations with City Schools personnel, we have learned that the classroom is viewed as an especially protected field. In recent years and in light of an increased focus on teacher accountability, there has been a growing concern that teachers are at risk of being overburdened with classroom observations and scrutiny. Survey fatigue among students is an additional concern, and as a result the long-standing School Survey for students has been shortened by removing items that overlapped with the SSTP. Concerns about excessive classroom intrusion and taxing students with multiple questionnaires are reasonable and should not be discounted. But it is then crucial that all the data collected on these fronts are analyzed in a concerted and comprehensive way by the district, especially in the case of the SSTP, which includes items that migrated from the School Survey. Relationships among Climate Data Sources Having data on interrelated constructs of climate from multiple sources is beneficial, especially since all the tools City Schools is using can be construed as complementary parts of the same larger picture. Moreover, having multiple data sources provides an opportunity for validation, as we demonstrate below. Figure 2 shows how items from the Climate Walk, the student and teacher components of the School Survey, and the school climate-relevant items from the SER correspond to climate domains defined by NSCC. As is clear in Figure 2, the different instruments highlight different school climate domains. Whereas the Climate Walk concentrates more on Safety and the Environment and far less on Teaching and Learning, the SER and SSTP can compensate by weighing Teaching and Learning more heavily. By the same token, the Leadership/Staff Relations domain of school climate is captured not by the student version of the School Survey

Baltimore Education Research Consortium
School Climate: Tools Schools Can Use 11
(which has many items devoted to Relationships and the Environment) but rather by the SER and the staff version of the School Survey, as one might expect. If we believe that different measures of school climate obtained from disparate tools can help form a more complete picture of climate when used in combination, then we next need to understand how well the data each instrument provides correspond to that of the others. To answer this, we performed bivariate school-level analyses across different sources. However, since Climate Walk data are qualitative, and the instrument was intentionally designed to collect complementary non-numerical data, the Climate Walk data are not featured in this analysis. (See Appendix F for details about how NSCC domains/indicators correspond to City Schools instrument items.)
SER and School Survey Correspondence. Table 3 shows that, especially for staff School Survey results,4 there is a high level of agreement between responses to the School Survey items and comparable domains scaled from key action ratings from the SER. The implication is that
4 The correlations between staff and student responses for concordant domains on the School Survey were strong, ranging between .65 and .69.

Baltimore Education Research Consortium
School Climate: Tools Schools Can Use 12
disparate sources of information along these domains can offer broadly similar conclusions; for instance, SER scores for Environment are highly correlated (.71) with staff perceptions of Environment. Moreover, these correlations suggest that any one domain of climate is strongly related to all other domains, for example, SER scores for Environment are not only strongly related to staff perceptions of Environment, but also with staff perceptions of the other dimensions of climate. These findings highlight the fact that school climate is challenging to define, and one reason is that there are many interrelated elements of climate that are difficult to isolate and manipulate. This also implies, however, that improving one dimension of school climate can strongly affect all others.
Table 3 Correlations Between School Effectiveness Review and School Survey of Staff and Students
School Effectiveness Review
Safety Teaching
& Learning
Relationships
Environment
Leadership/Staff
Relations
Sch
ool
Sur
vey
– S
taff
Safety .56** .61** .52** .67** .70** Teaching & Learning
.57** .65** .52** .68** .75**
Relationships .57** .60** .52** .65** .73** Environment .58** .64** .52** .71** .74** Leadership/Staff Rel.
.52** .57** .46** .63** .70**
Sch
ool
Sur
vey
– S
tude
nts
(3rd
-5th
)
Safety .41* .45* .36* .53** .55** Teaching & Learning
.44* .44* .39* .57** .67**
Relationships .40* .41* .37* .54** .52* Environment .46* .45* .41* .59** .62**
Sch
ool
Sur
vey
– S
tude
nts
(6th
– 1
2th)
Safety .51* .58** .55** .59** .59** Teaching & Learning
.47* .58** .56** .63* .57*
Relationships .46* .56** .53** .59** .56** Environment .45* .54** .51* .56** .60**
** p<.001 * p <.05 Note: SER data for SY 2012-13 represent only 54 schools for which both SER and School Survey data were
available. SSTP and School Survey Correspondence. Next, to confirm that the dimensions of Classroom Management and Classroom Culture are related to other school climate measures collected across City Schools, we examined the relationship between School Survey responses of staff and students and students’ responses to the SSTP along the Classroom Management and Culture
Baltimore Education Research Consortium
School Climate: Tools Schools Can Use 13
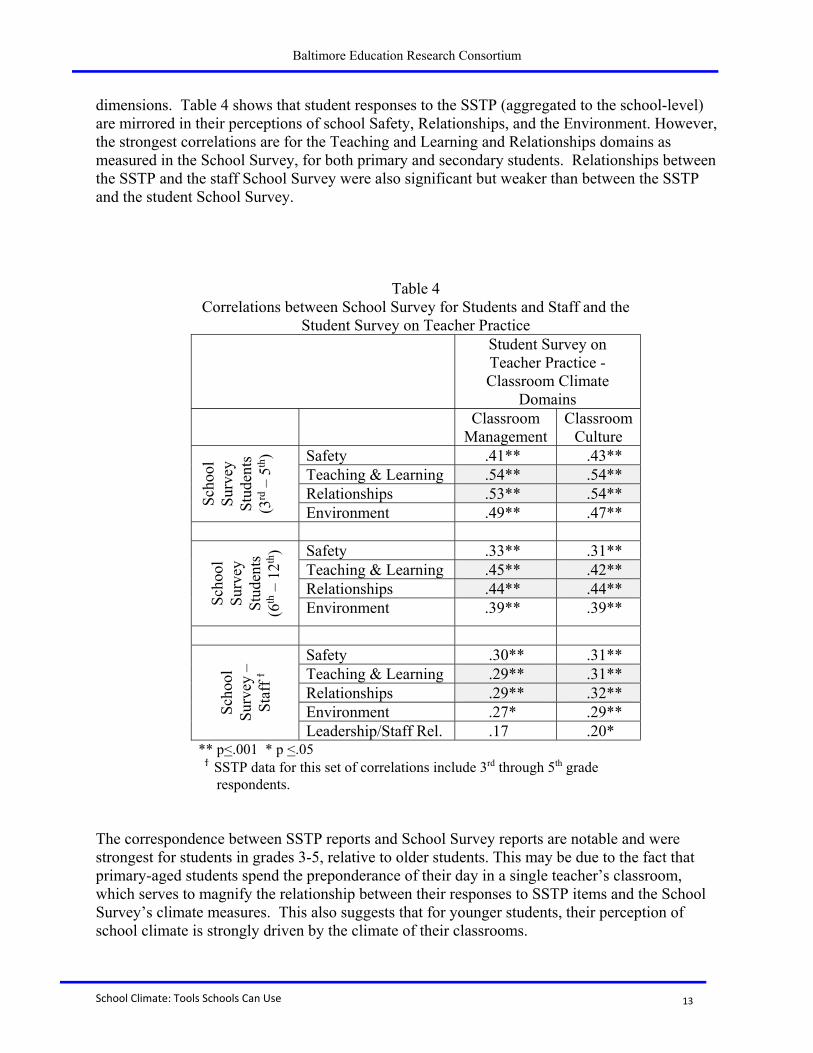
dimensions. Table 4 shows that student responses to the SSTP (aggregated to the school-level) are mirrored in their perceptions of school Safety, Relationships, and the Environment. However, the strongest correlations are for the Teaching and Learning and Relationships domains as measured in the School Survey, for both primary and secondary students. Relationships between the SSTP and the staff School Survey were also significant but weaker than between the SSTP and the student School Survey.
Table 4 Correlations between School Survey for Students and Staff and the
Student Survey on Teacher Practice Student Survey on
Teacher Practice - Classroom Climate
Domains Classroom
Management Classroom
Culture
Sch
ool
Sur
vey
Stu
dent
s (3
rd –
5th
) Safety .41** .43** Teaching & Learning .54** .54** Relationships .53** .54** Environment .49** .47**
Sch
ool
Sur
vey
Stu
dent
s (6
th –
12th
) Safety .33** .31** Teaching & Learning .45** .42** Relationships .44** .44** Environment .39** .39**
Sch
ool
Sur
vey
– S
taff
ϯ
Safety .30** .31** Teaching & Learning .29** .31** Relationships .29** .32** Environment .27* .29** Leadership/Staff Rel. .17 .20*
** p<.001 * p <.05 ϯ SSTP data for this set of correlations include 3rd through 5th grade
respondents. The correspondence between SSTP reports and School Survey reports are notable and were strongest for students in grades 3-5, relative to older students. This may be due to the fact that primary-aged students spend the preponderance of their day in a single teacher’s classroom, which serves to magnify the relationship between their responses to SSTP items and the School Survey’s climate measures. This also suggests that for younger students, their perception of school climate is strongly driven by the climate of their classrooms.

Baltimore Education Research Consortium
School Climate: Tools Schools Can Use 14
SSTP and SER Correspondence. We also performed an identical analysis of the relationship between Classroom Management and Culture (as measured with the SSTP) and the SER school climate items (see Table 5). We found fewer significant relationships between SER reported climate and classroom climate for students in grades 6-12, but fairly strong and significant relationships for students in grades 3-5. Again, this may suggest that younger students’ reports of the climate in their classrooms more closely reflect a school’s overall climate than among older students.
Table 5 Correlations between School Effectiveness Review and
Student Survey on Teacher Practice Student Survey on
Teacher Practice – Classroom Climate
Domains Classroom
ManagementClassroom
Culture 3rd - 5th Graders
Sch
ool
Eff
ecti
vene
ss
Rev
iew
Safety .56** .60** Teaching & Learning .44* .50* Relationships .54** .59** Environment .47* .46* Leadership/Staff Rel. .46* .58*
6th – 12th Graders
Sch
ool
Eff
ecti
vene
ss
Rev
iew
Safety .40* .27 Teaching & Learning .40* .24 Relationships .40* .31 Environment .39* .31 Leadership/Staff Rel. .38* .33
** p<.001 * p <.05
Other School Climate indicators In City Schools, both suspension and attendance data are considered important pieces of the bigger climate picture and are regularly analyzed by the district to gain insight into when a school may be struggling with climate issues that require additional supports. Suspensions and Climate. To demonstrate the relationship between suspensions and other climate measures collected by City Schools, in Table 6 we present correlations between several
Baltimore Education Research Consortium
School Climate: Tools Schools Can Use 15
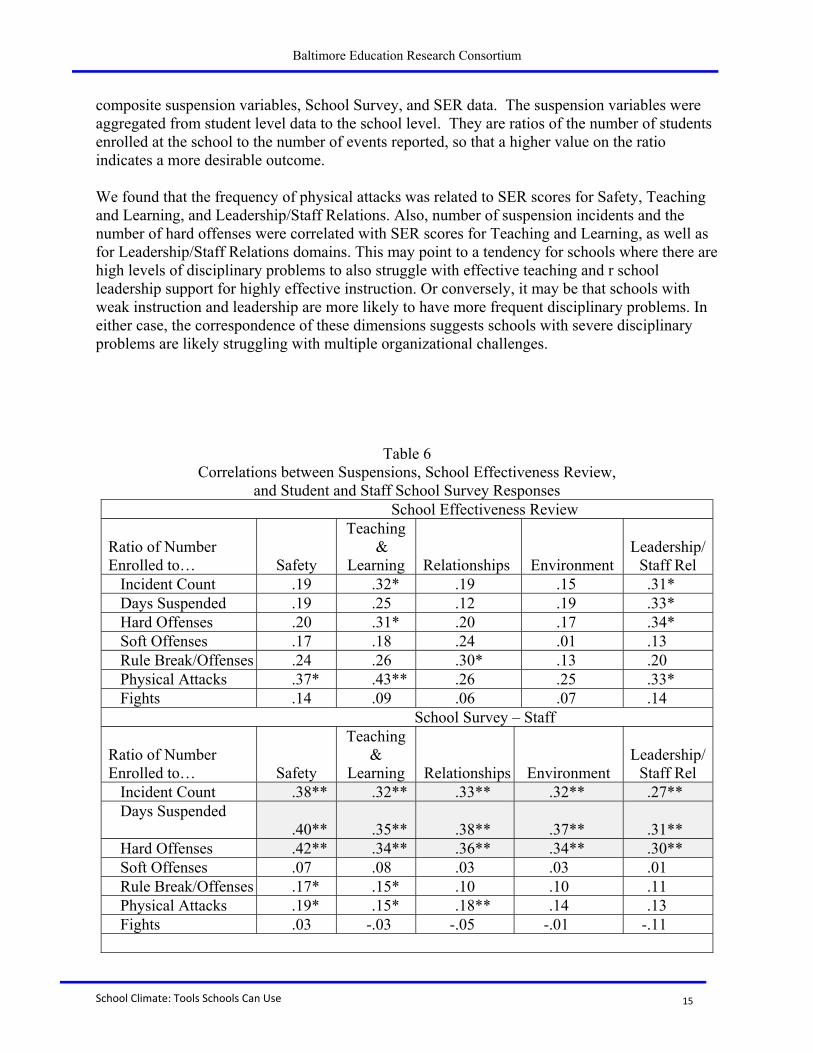
composite suspension variables, School Survey, and SER data. The suspension variables were aggregated from student level data to the school level. They are ratios of the number of students enrolled at the school to the number of events reported, so that a higher value on the ratio indicates a more desirable outcome. We found that the frequency of physical attacks was related to SER scores for Safety, Teaching and Learning, and Leadership/Staff Relations. Also, number of suspension incidents and the number of hard offenses were correlated with SER scores for Teaching and Learning, as well as for Leadership/Staff Relations domains. This may point to a tendency for schools where there are high levels of disciplinary problems to also struggle with effective teaching and r school leadership support for highly effective instruction. Or conversely, it may be that schools with weak instruction and leadership are more likely to have more frequent disciplinary problems. In either case, the correspondence of these dimensions suggests schools with severe disciplinary problems are likely struggling with multiple organizational challenges.
Table 6 Correlations between Suspensions, School Effectiveness Review,
and Student and Staff School Survey Responses School Effectiveness Review Ratio of Number Enrolled to…
Safety
Teaching &
Learning Relationships
Environment Leadership/
Staff Rel Incident Count .19 .32* .19 .15 .31* Days Suspended .19 .25 .12 .19 .33* Hard Offenses .20 .31* .20 .17 .34* Soft Offenses .17 .18 .24 .01 .13 Rule Break/Offenses .24 .26 .30* .13 .20 Physical Attacks .37* .43** .26 .25 .33* Fights .14 .09 .06 .07 .14 School Survey – Staff Ratio of Number Enrolled to…
Safety
Teaching &
Learning
Relationships
Environment Leadership/
Staff Rel Incident Count .38** .32** .33** .32** .27** Days Suspended
.40** .35**
.38**
.37**
.31**
Hard Offenses .42** .34** .36** .34** .30** Soft Offenses .07 .08 .03 .03 .01 Rule Break/Offenses .17* .15* .10 .10 .11 Physical Attacks .19* .15* .18** .14 .13 Fights .03 -.03 -.05 -.01 -.11

Baltimore Education Research Consortium
School Climate: Tools Schools Can Use 16
Table 6 Correlations between Suspensions, School Effectiveness Review,
and Student and Staff School Survey Responses School Survey – Students (6th-12th) Ratio of Number Enrolled to…
Safety
Teaching &
Learning
Relationships
Environment Leadership/
Staff Rel Incident Count .36** .35** .35** .35** -- Days Suspended .46** .40** .46** .44** -- Hard Offenses .37** .35** .36** .35** -- Soft Offenses -.01 .04 -.04 .01 -- Rule Break/Offenses .10 .10 .06 .05 -- Physical Attacks .15 .14 .17 .13 -- Fights -.01 -.05 -.05 -.03 -- ** p<.001 * p <.05 Note. Suspension variables were expressed as a ratio of number enrolled-to-incident, so that a higher value reflects a more desirable outcome. Thus, positive correlations express concordance between higher ratings and lower rates of suspensions.
Notably, we also found that staff responses to the School Survey were more strongly and consistently related to suspension events than either what SER measured or what students reported about their school’s climate on the School Survey. For instance, staff ratings of school Safety were significantly related to number of suspension incidents (.38), the total number of days missed across the school due to suspensions (.40), and to the frequency of hard offenses (.42); whereas the SER dimensions relating to Safety were only correlated with rates of physical attacks, which interestingly, were also significantly related to SER ratings for Teaching and Learning (.43). Staff perceptions about the Teaching and Learning environment, Interpersonal Relationships, and the Institutional Environment were also significantly related to suspensions. Further, among students, we found that the number of suspension incidents, the total number of days suspended across the school, and rate of hard offenses seemed to be reflected in student perceptions across all climate domains (we present results for secondary students only, but the same patterns were found for the perceptions of students in grades 3-5). Contrary to students, however, staff reports on Safety, Teaching/Learning, and Relationships were reflected in the frequency of physical attacks at the school that resulted in a suspension. Attendance and Climate. Next, we performed the same analysis but with attendance data to explore whether attendance problems in a school were reflected in its other climate data. We used the percent chronically absent and severely chronically absent by the end of the school year SY 2012-13. Chronic absence is defined as missing more than one-ninth of days on roll, or the equivalent of missing at least a month of school. Severe chronic absence is defined as missing at least two-ninths (or approximately two months) of the year. Compared to all other climate data collected in City Schools, chronic absence was most strongly related to students’ School Survey responses. Significant correlations ranged between .50 and .64

Baltimore Education Research Consortium
School Climate: Tools Schools Can Use 17
and appeared strongest between a school’s chronic absence rate and School Survey responses for 3rd through 5th grade students (see Table 7). As these data represent only one time point, we cannot determine whether low attendance damages perceptions of climate, or whether poor climate causes poor attendance. The most intuitive interpretation would be that students choose not to come to school when they find it to be an unsafe, uninviting, or outright hostile environment. Yet it is also possible that school-wide problematic attendance lowers student morale and damages perceptions about their school’s worth. Staff responses to the School Survey, too, were related to chronic absence levels at their schools, especially with respect to Safety, Teaching and Learning, and Environment.
Table 7 Correlations Between Chronic Absence Rate and Other Climate Data
% Chronically
Absent
% Severely Chronically
Absent
Sch
ool
Sur
vey
-S
tude
nts
(6th
–12
th) Safety -.20** -.09
Teaching & Learning -.38* -.26* Relationships -.15 -.06 Environment -.26* -.15
Sch
ool
Sur
vey
- S
tude
nts
(3rd
– 5
th) Safety -.54** -.51**
Teaching & Learning -.48** -.46** Relationships -.46** -.43** Environment -.46** -.44**
Sch
ool
Sur
vey
- S
taff
Safety -.38** -.27** Teaching & Learning -.35** -.23** Relationships -.29** -.17* Environment -.37** -.26** Leadership/Staff Rel -.21* -.12
Sch
ool
Eff
ecti
vene
ss
Rev
iew
Safety -.13 -.13 Teaching & Learning -.24 -.24 Relationships -.14 -.12 Environment -.26 -.26
Leadership/Staff Rel -.18 -.16
SS
TP
(3
rd-5
th)
Classroom Management
-.30** -.30**
Classroom Culture -.32** -.32**

Baltimore Education Research Consortium
School Climate: Tools Schools Can Use 18
Table 7 Correlations Between Chronic Absence Rate and Other Climate Data
% Chronically
Absent
% Severely Chronically
Absent
SS
TP
(6
th–1
2th)
Classroom Management
.09 .16
Classroom Culture .18* .24**
** p<.001 * p <.05 It was somewhat surprising that School Effectiveness Review scores were completely uncorrelated with school chronic absence rates. This may indicate that a school’s attendance record does not weigh heavily in the School Effectiveness Review scoring process, and may suggest that City Schools revisit their review process to determine if attendance is a potential missing component. We did not expect to find an inverse relationship between absences and students’ perceptions of classroom climate from the Student Survey of Teacher Practice. Specifically, although among 3rd - 5th grade students perceptions about the culture of their classrooms decrease as absences rise, for students in grades 6 – 12, the opposite was found. Though the relationship was relatively weak, it was significant: in schools with higher levels of chronic absence and severe chronic absence, classroom culture was rated more positively. One possible explanation could be that many schools serving grades 6-12 have fairly high levels of chronic absence, and the responses to the SSTP represent students with better attendance and more favorable perceptions of their teachers’ practices, as students who were absent on the day the SSTP was administered did not have an opportunity to complete the survey later. In other words, the SSTP may systematically fail to capture the views of absent students, which could have biased the average in an upward direction. City Schools may want to explore the feasibility of giving students additional opportunities to complete the SSTP, given this unexplained finding.

Baltimore Education Research Consortium
School Climate: Tools Schools Can Use 19
Summary and Recommendations In this report, we addressed three questions:
What data are being systematically collected by City Schools that can speak to school climate, effectiveness, and organizational health?
What are the strengths and limitations of each data source?
How do the different data sources relate and correspond to each other?
We identified four tools used by different departments in City Schools that collect data about school climate: the School Survey (which includes different versions), the Climate Walk, the School Effectiveness Review (SER), and the Student Survey on Teacher Practice (SSTP). No single tool provides a complete characterization of school climate on its own, and the tools differ in their scope, timeliness, and resource demands. These four tools offer an unprecedented wealth of data sources and techniques as schools work to provide a meaningful and safe environment for every student. One challenge, however, will be to integrate the four sources in a way that can provide actionable insights, since more data do not necessary lead to more knowledge. The lack of a consensus definition of school climate, as noted earlier, poses an additional challenge. While the NSCC offers five essential domains, the U.S. Department of Education emphasizes three: Safety, Engagement, and Environment5 (though it should be noted that Relationships is subsumed under their broader category of Engagement). Whether the additional NSCC domain of Teaching and Learning belongs within the broad definition of school climate is a point of debate (Thapa et al., 2013). According to researchers who study the relationship between classroom environments and student achievement, there are dimensions of student and teacher behavior in a classroom, specifically “emotional support” and “classroom organization”, that while not entirely independent from instructional methods, are directly related to student outcomes (Hamre and Pianta, 2005; Hamre, Pianta, Mashburn and Downer, 2007). In recognition of this fact, the Climate Walk tool included an item that addresses the classroom environment: “The classrooms are orderly and well-managed environments (i.e., the teacher is engaging with students and students are responding positively).” City Schools’ current definition of school climate, as stated in its 2014/2015 Code of Conduct -- “City Schools defines school climate as the elements in a school related to relationships, teaching and learning, physical environment and safety” -- implicitly acknowledges the important role of classroom experiences in students’ perceptions of climate. However, the current version of the School Survey includes items more vaguely connected to Teaching and Learning, without a specific emphasis on what a student’s classroom feels like. As a result, City Schools should consider using the SSTP data to inform conversations about the greater climate context of a school, even though it was not implemented for this purpose. As the correlational results demonstrated, students’ experiences of climate, especially young students in 5 See http://safesupportivelearning.ed.gov/

Baltimore Education Research Consortium
School Climate: Tools Schools Can Use 20
grades 3-5, are strongly tied to the daily climate created by their teachers in the classroom, particularly as it pertains to classroom management and classroom culture. This analysis revealed that many measures of school climate (but not the SER—see below) are strongly correlated with chronic absence. Although the order or full nature of the relationship is not clear, it is unambiguously the case that schools with positive reported measures of school climate—especially safety—have lower rates of chronic absence. This suggests that City Schools’ dual efforts to address school safety and student attendance are intimately related. As with safety and chronic absence, improving school climate will not come easily. Some climate-related issues are visible and easily addressed, but the real work of improving school climate addresses deep-seated issues. For example, school uniform violations can be a sign of student disengagement, but addressing a student’s clothing will not repair that student’s positive relationships with school staff or emerging detachment from school. Similarly, there is more to a positive school environment than up-to-date student work on the walls, and putting up student work does not itself make a school environment positive, even though student work displays can be a signal of a positive environment. Other examples of symptoms where fixes may not lead to real improvements in climate include signing into a visitor log or even students quietly conforming to school rules. Clearly, remedying such visible shortcomings is concrete and straightforward, so efforts to manipulate these particular levers can often be met with satisfying success (i.e., they are “easy wins”). While we agree that these are likely outward signs of a climate issue, correcting these problems does not by itself lead to the desired outcome of a school-wide positive climate. These problems should be seen as warning flags or symptoms, but they should not be final action points. Indeed, fixing outward signals of dysfunction may mislead us into believing that all is well when more substantive problems remain below the surface – problems that will undoubtedly take a toll on student motivation, engagement and achievement. Recommendations Examining all sources of data that shed light on school climate should assist school leaders in identifying meaningful strategies to address difficult, complex problems. Most of the climate data are collected by different divisions within OAA, but the Office of Student Support and Safety can add valuable data to the discussion. A more complete picture of school climate can emerge if we examine climate more holistically. SER scores concerning school climate are strongly correlated with the student School Survey but especially with the staff School Survey. Given that the School Survey is administered at all schools annually and the SER is conducted at approximately 60 schools per year, City Schools should examine ways to routinely leverage the School Survey data, for both students and staff, to stand in during non-SER years towards improving outcomes for children. We propose using the School Survey and the SSTP to create annual school climate reports; the SER can then be used strategically to provide more thorough examinations of schools on a rotating basis. Further, the district should continue to implement SSTP as a component school climate. It provides important data for two important school measures – classroom management and classroom culture.

Baltimore Education Research Consortium
School Climate: Tools Schools Can Use 21
The Climate Walk observation tool offers a unique, qualitative and more timely appraisal of the overall functioning of a school on any given day than what is ascertained by the School Survey, the SSTP or SER scores. Although collecting data with this tool is time and labor intensive, the opportunities the process offers for regular collaboration between district staff and school leaders is tremendous and should be pursued as often as is feasible. Its credibility with school principals relative to the existing surveys should also be evaluated. If principals feel that Climate Walks legitimately identify areas for improvement, then the Climate Walk tool would be even more valuable.
Surprisingly, scores on the SER climate domains were not correlated with school-level chronic absence rates. However, attendance data remain essential to the understanding of student engagement and their attachment to school, as attendance was strongly related to students’ perceptions of Teaching and Learning, the Environment, Relationships, and Safety. Conversations about attendance strategies need to consider all domains of school climate as important factors, and principals at schools with chronic absence problems must simultaneously consider ways to improve their school’s climate.
Suspension rates corresponded to perceptions gauged by the School Survey, among both students and staff. Suspension data should continue to be used as both a leading and lagging indicator of school improvement, but leaders should be cautious about what changing suspension rates mean. If a new principal institutes new disciplinary practices towards long term school improvement efforts, this could temporarily cause an increase in suspensions. Conversely, a drop in suspension rates could possibly indicate waning attention to disciplinary problems. Because of this ambiguity, it is essential to examine suspension data alongside other school climate data to gain more context.
Just as school climate appears to have multiple dimensions, it appears to have multiple implications, including for chronic absence. Understanding these dimensions will require a concerted effort across multiple offices at City Schools, not only to combine data but also to gain a refined understanding and to communicate that understanding to school staff in the hope of improving student outcomes. Continued collaboration between the Office of Student Support and Safety and the Office of Achievement and Accountability may help both gain new insights into school climate to inform policy and practice.
Use of a tool such as the Organization Health tool proposed in Appendix A will allow school staff and administrators to easily visualize and synthesize much of their school climate data. (See Appendix F.3 for technical details on the construction of this tool.) This tool incorporates staff responses to the School Survey and student responses to SSTEP questions addressing classroom culture and classroom management. This will serve as a starting point for conversations about school climate, and it can identify areas where changes in practice could have reverberating effects on all domains of climate. With so many data sources and domains of school climate, a data visualization tool will be essential. A single visual tool can integrate multiple data sources and dimensions in order to characterize school climate, including Safety, Teaching and Learning, Relationships, the Environment, and School Leadership, as well as their sub-dimensions.
Baltimore Education Research Consortium
School Climate: Tools Schools Can Use 22
References
Arum, R. (2003). Judging school discipline: the crisis of moral authority. Cambridge: Harvard University Press.
Bear, G. G. (with A. Cavalier & M. Maureen). (2005). Developing self-discipline and preventing and correcting misbehavior. Boston: Allyn & Bacon.
Cohen, J. & Geier, V.K. (2010). School Climate Research Summary: January 2010. New York, N.Y. Retrieved from: www.schoolclimate.org/climate/ research.php
Dynarski M., Clarke L., Cobb B., Finn J., Rumberger R.,Smink J. (2008). Dropout prevention: A practice guide (NCEE 2008–4025). Retrieved from: http://www.michigan.gov/documents/mde/IES_Dropout_Practice_Guide_293427_7.pdf
Ferguson, R. F. (2012). “Can Student Surveys Measure Teacher Quality?” The Phi Delta Kappan, 94(3): 24-28.
Ferguson, R. F. (2008). The TRIPOD Project Framework. Cambridge, MA: Harvard University.
Hamre, B. K.; Pianta, R. C.,; Mashburn, A. J., and Downer, J. T. (2007). “Building a Science of Classrooms: Application of the CLASS Framework in over 4,000 U.S. Early Childhood and Elementary Classrooms.” University of Virginia, Center for Advanced Study of Teaching and Learning.
Hamre, B. K. and Pianta, R. C. (2005). “Can Instructional and Emotional Support In the First-Grade Classroom Make a Difference for Children at Risk for School Failure?” Child Development 76(5): 949-67.
Jennings K. (2009). Federal education priorities and creating safe schools. Retrieved from http://www.nysut.org/files/ecb_jennings_federalpriorities.pdf.Pianta, R. C. (1999). Enhancing relationships between children and teachers. Washington, DC: American Psychological Association.
Smith, T. K.; Connolly, F.; Pryseski, C. (2014). Positive School Climate: What It Looks Like and How It Happens. Retrieved from http://baltimore-berc.org/wp-content/uploads/2014/02/SchoolClimateFeb2014.pdf.
Thapa, Amrit, Jonathan Cohen, Shawn Guffey, and Ann Higgins-D’Alessandro. 2013. “A Review of School Climate Research.” Review of Educational Research 83:319-56.
Voight, A. and Thomas H. (2012). Summary of Existing School Climate Instruments for Middle School. San Francisco: REL West at WestEd.

Baltimore Education Research Consortium
School Climate: Tools Schools Can Use 23
Appendix A. Organizational Health Tool for Schools and Districts

23 27
41
19 23 2419
44
13
3326
16
32
45
45
35
4754
38
45
51
4548
48
45
28
14
46
3022
43
11
36
22 2536
0%
50%
100%
All City Schools, 2012‐13
Do Not Agree Agree Strongly Agree
SafetyTeaching & Learning
Interpersonal Relationships
Institutional Environment
Leadership/Staff Relations

Baltimore Education Research Consortium
School Climate: Tools Schools Can Use 25
Appendix B. National School Climate Center Climate Domains
Baltimore Education Research Consortium
School Climate: Tools Schools Can Use 26
Appendix C. Baltimore City Climate Walk Tool
BALTIMORE CITY PUBLIC SCHOOLS
SCHOOL CLIMATE WALK
Baltimore City Public Schools encourages other school districts to use this tool. Permission to use or adapt this tool is not required, but please acknowledge Baltimore City Public Schools as the original source. Page 1 of 2
School Name & Number _______________________________________________________ Network # ________ Date __________ Time of Visit ________ Time of Departure ________ Staff Name __________________________
Observation
Observed NotObserved
Comments
School Entran
ce
1. Visitors (including yourself) are greetedby s
taff, pr o vided with a visitor’s pa ss, an d
directed to the appropriate location upon entering the building.
2. The main office is an orderly and well‐managed environment.
3. The main office had students seatedduring instructional time. Note in the comments if the same students were in the office when you departed, and what the students were doing.
Physical Environment
4. The physical environment is welcomingand supportive of learning for all students (e.g., well‐lit, graffiti‐free, painted walls, etc.).
5. Self‐contained classrooms (includingCity Wide programs) are supportive of learning and are included within the school community; classrooms are not identified a
s ‘ special education’ or ‘S PED.’
6. The physical space is utilized effectively(i.e., not overcrowded or underutilized) and routinely checked by staff for students lingering or loitering.
7. The physical school environment issecure (i.e., outside doors are kept closed or monitored, and outside student activities and transitions are monitored).
Studen
t/Staff Interaction 8. Students are being respectful to one
another and to staff members. Provide examples in the comments section.
9. Staff members are being respectful tostudents and to one another. Provide examples in the comments section.
10. Students are complying with the CitySchools exclusionary dress code. Provide examples in the comments section as needed.

Baltimore Education Research Consortium
School Climate: Tools Schools Can Use 27
BALTIMORE CITY PUBLIC SCHOOLS
SCHOOL CLIMATE WALK
Baltimore City Public Schools encourages other school districts to use this tool. Permission to use or adapt this tool is not required, but please acknowledge Baltimore City Public Schools as the original source. Page 2 of 2
School Name & Number _______________________________________________________ Network # ________
Date of Visit __________ Time of Visit ________ Time of Departure ________ Staff Name ___________________
Observation
Observed NotObserved
Comments
Tran
sitions
11. Transition times are of appropriatelength and are effectively monitored by school staff, including hall monitors. Describe in the comments section.
12. Movement during transitions is orderly(e.g., all students appear to be heading to class with minimal horseplay).
13. Students have a hall pass at times otherthan transition times, and students are actively checked for hall passes.
14. Support staff, teachers, and administrators are visible and engaging with students during transitions and at other times in the day.
Classrooms
15. The classrooms are orderly and well‐managed environments (i.e., the teacher is engaging with students and students are responding positively).
16. The hallways and/or classrooms includecurrent examples of student work, accolades, or recognition, as well as expectations of student behavior.
Other
17. If you are present at entry or dismissal,observe whether adults are actively supervising students. Note if students are left outside and alone during these times.
18. The Health Suite is easily accessible,utilized by students and observed Health Suite personnel engaging with students.
19. The bathrooms are an orderly environment (i.e., doors on stalls, appropriately stocked and no trash on the floor or students congregating in groups).
20. The cafeteria is clean, orderly, well‐managed and with appropriate student groupings (e.g., 1st graders are separated from 8th graders).

Baltimore Education Research Consortium
School Climate: Tools Schools Can Use 28
Appendix D. Baltimore City Schools School Effectiveness Framework
2012-2013 City Schools’ School Effectiveness Standards
Great schools, school leaders, and teachers start with domains – the qualities that City Schools believes
must be in place for all students to achieve at the highest possible levels. Four domains prevail at the
school level: highly effective instruction, talented people, engaged families and community, and strategic
leadership. Each of these domains closely aligns with domains held by City Schools for great school leaders
and great teachers6 and is observable in a set of key actions. Together, these domains, key actions, and
supporting descriptors form the City Schools’ School Effectiveness Standards.
The SER team uses the domains, key actions, and descriptors to analyze the relationship between people
and systems that support students in their learning. The domains, key actions, and descriptors assist the
SER team to guide evidence collection and report on school effectiveness.
DOMAINS OF EFFECTIVE SCHOOLS
Domain 1: Highly effective instruction
Key action 1.1: Teachers plan highly effective instruction. a) Teachers set growth goals based on students’ performance levels.
b) Teachers develop standards‐based units and long‐term plans using appropriate curriculum planning
documents (scope and sequence, pacing guides, etc.)
c) Teachers design daily lessons that meet learners’ unique needs.
d) Teachers design instruction that provides opportunities for students to develop critical thinking skills.
e) The school provides teachers access to school‐specific curriculum planning documents (scope and
sequence, pacing guides, etc.)
Key action 1.2: Teachers deliver highly effective instruction. a) Teachers use standards‐based lesson objectives and align learning activities and in‐class assessments
to the stated lesson objectives.
b) Teachers deliver content that is grade level appropriate.
c) Teachers communicate content clearly and accurately.
d) Teachers use multiple strategies and tasks to engage all students in rigorous work
e) Teachers use questioning to bring students to higher‐order thinking.
f) Teachers check for student understanding and/or mastery and, as necessary, make immediate
instructional adjustments.
g) Teachers provide students with opportunities to learn through a variety of instructional strategies,
including but not limited to: direct, whole group instruction; guided practice; small group or pair
learning; and independent practice.
h) Teachers facilitate student‐to‐student interaction and academic talk.
6 Domains for great school leaders are defined by the draft effectiveness standards for school leaders; domains for great teachers are defined by City Schools’ instructional framework. The School Effectiveness Standards will be revised during the summer of 2013 to reflect the greatest degree of alignment possible among all three sets of standards.

Baltimore Education Research Consortium
School Climate: Tools Schools Can Use 29
Key action 1.3: Teachers use multiple data sources to adjust practice. a) Teachers use multiple assessments to measure student progress, identify strengths and weaknesses,
and adjust practice accordingly
b) Teachers make immediate instructional adjustments when needed in response to data.
c) School leadership provides timely access to student data in a format that can be used to make
classroom level decisions.
d) School leadership ensures that teachers are prepared to analyze student assessment data, and/or
supports teachers in interpreting the results.
e) Teachers use data to identify unique student needs and assign them to support services,
interventions, or opportunities for acceleration.
Key action 1.4: School leadership supports highly effective instruction.
a) School leadership holds and promotes a clear instructional vision of high student achievement.
b) School leadership ensures that teachers engage in the planning of the curricula through oversight of
standards‐based units, modeling, and guiding decisions about pacing.
c) School leadership ensures the use of data to adjust practice through short‐term re‐teaching,
interventions, and long‐term planning.
Key action 1.5: Teachers establish a classroom environment in which teaching and learning can
occur. a) Teachers build a positive, learning‐focused classroom culture.
b) Teachers use and align resources to support activities that help students master standards.
c) Teachers organize the classroom space and materials to enhance student learning activities.
d) Teachers implement routines to maximize instructional time.
e) Teachers reinforce positive behavior, redirect off‐task behavior, and de‐escalate challenging
behavior.

Baltimore Education Research Consortium
School Climate: Tools Schools Can Use 30
Domain 2: Talented people
Key action 2.1: The school creates and implements systems to select, develop, and retain effective
teachers and staff whose skills and beliefs represent the diverse needs of all students.
a) School leadership has created and/or implemented an organizational and staffing structure that
meets the diverse needs of all students.
b) School leadership leverages a pipeline for teacher recruitment that includes partnerships with City
Schools’ central office, higher education institutions, and non‐profit organizations, as well as other
sources to identify candidates.
c) School leadership uses multiple measures to assess each candidate’s alignment with the skills
required for the position, as well as core beliefs held by the school community.
d) Staff members and other stakeholders participate in the selection, development, and retention of
effective teachers and staff.
e) School leadership has created mentoring and/or other induction programs to support teacher and
staff development.
f) School leadership acknowledges and celebrates the accomplishments of teachers and other staff
members.
Key action 2.2: The school has created and implemented systems to evaluate teachers and staff
against individual and school‐wide goals, provide interventions to those who are not meeting
expectations, and remove those who do not make reasonable improvement.
a) School leadership has implemented structures for formal feedback and evaluation aligned with
school‐wide goals and initiatives in order to increase the capacity of teachers and other staff.
b) School leadership provides formative feedback and guidance to teachers about the quality of
planning, teaching, and adjustment of practice.
c) School leadership sets school‐wide, team and individual professional development goals for teachers
and staff, and monitors progress toward these goals.
d) School leadership provides support and interventions for teachers and other staff, and when
necessary, makes difficult personnel decisions to improve student learning.
e) Teachers and other staff members are aware of performance expectations and strive to meet them
through responsiveness to feedback and participation in professional growth opportunities.

Baltimore Education Research Consortium
School Climate: Tools Schools Can Use 31
Domain 3: Engaged families and community
Key action 3.1: The school provides a safe and supportive learning environment for students,
families, teachers, and staff. a) The school community shares an understanding of, and commitment to, the school mission, vision,
and values, including a clear understanding of strategic goals and initiatives.
b) Students, staff, and families feel physically and emotionally safe at the school.
c) Students, staff, families, and community members participate in activities promoting the school’s
culture and climate.
d) The school recognizes and celebrates student success.
e) The school addresses the needs of students in social or emotional crisis.
f) School leadership, teachers and staff maintain a positive school culture.
Key action 3.2: The school cultivates and sustains open communication and decision‐making
opportunities with families about school events, policies, and the academic and social development
of their children. a) The school uses multiple strategies, languages and vehicles to regularly communicate information,
about progress toward school‐wide goals and initiatives.
b) The school uses multiple strategies to communicate information about school policies, events, and
the academic and social development of students to families and the community.
c) The school establishes regular structures for communication, which facilitate opportunities for
families and the community to participate in, or provide feedback on school‐wide decisions.
d) The school addresses families and community partners’ questions and concerns, and uses feedback
to improve the school.
e) Teachers and other staff members proactively cultivate and sustain relationships with families.
Key action 3.3: The culture of the school reflects and embraces student, staff, and community
diversity. a) School leadership, teachers, and staff build strong relationships with families and community
stakeholders from diverse backgrounds.
b) School leadership, teachers, and staff ensure that school‐wide communications take into account
the cultural and linguistic diversity of school stakeholders.
c) The school’s curricula and programs reflect a commitment to equity and an appreciation of
diversity, and consider cultural, linguistic and socioeconomic diversity.
d) The school’s data indicate that school staff is diverse in terms of gender, and/or race/ethnicity,
and/or teaching experience.

Baltimore Education Research Consortium
School Climate: Tools Schools Can Use 32
Domain 4: Strategic leadership
Key action 4.1: The school establishes growth goals that guide strategic planning, teaching, and
adjusting of practice to meet student needs.
a) School leadership and teachers establish rigorous goals for student learning, including measures
related to student achievement, student growth, and school improvement.
b) School leadership is guided by a cohesive action plan that is based on data related to student learning,
attendance, and behavior.
c) School leadership analyzes and uses data to make decisions about school‐wide programs and
resources and solicits feedback regarding the effectiveness of those programs.
d) School leadership, teachers and staff participate in regular analysis of data and adjustment of growth
goals.
e) Families, community members, teachers, and students (at the secondary level) participate in
initiatives to establish, implement and monitor progress of school‐wide goals.
Key action 4.2: The school allocates and deploys the resources of time, staff talent, and funding to
address the priorities of growth goals for student achievement.
a) Budget distributions and resource allocations support teaching and learning, including:
Sufficient staffing to support school‐wide programming and initiatives;
Core and supplemental materials to support the curricula;
Technology and other equipment to support administration, teaching, and learning.
b) School leadership leverages teacher and staff talent, expertise, and effectiveness by delegating
essential responsibilities and decisions to appropriate individuals.
c) Teachers and staff use time, talent, and funding to address the priorities of growth goals.
d) Families and community members, volunteer time, talent, and funding to address the priorities of
growth goals and provide resources to meet the needs of students and the school.
e) The school’s schedule maximizes time on student learning by minimizing school‐wide transitions or
other non‐academic programming.
Key action 4.3: The school provides regular opportunities for teachers and staff to engage in job
embedded, collaborative planning and adjustment of practice.
a) The school leadership facilitates purposeful collaborations that enhance school culture, instruction,
and student learning.
b) Teachers and staff work together on improving classroom practices through consistent
implementation of curricula, instruction, and assessment.
c) Teachers and staff participate in planning and implementation of school events and initiatives.

Baltimore Education Research Consortium
School Climate: Tools Schools Can Use 33
Key action 4.4: The school’s board of trustees (or operator) provides competent stewardship and
oversight of the school. (For schools that are overseen by an autonomous board of trustees or
operator). a) The governing board (and/or operator) maintains essential knowledge of the school, its focus on
preparing all students for success at the next level, and the progress of its students toward that end.
b) The governing board (and/or operator) provides strong oversight of the academic program (i.e., the school’s progress toward meeting school goals or goals articulated in the school’s contract with City Schools).
c) The governing board (and/or operator) provides strong financial oversight by monitoring the school’s financial records and ensuring that the school remains fiscally viable.
d) The governing board (and/or operator) ensures compliance with all local, state, and federal laws (including those pertaining to public disclosure), as well as its own bylaws and policies.
e) The governing board (and/or operator) maintains effective governance practices to ensure organizational viability, including the systematic selection and oversight of the school leader.

Baltimore Education Research Consortium
School Climate: Tools Schools Can Use 34
Performance Level Rubric
The SER team will use the following guidance to select a performance level for each key action. Note that the quality
standard for each performance level is based upon: the extent to which the SER team finds multiple types7 and
multiple sources8 of evidence related to the adoption and/or implementation of a practice or system AND the extent
to which the SER team finds evidence of high levels of adoption and/or implementation of a practice or system. The
SER team will also reflect on the Instructional Rubric and School Leadership Framework in their analysis prior to
assigning a rating for each key action.
Rating Performance Level Quality Standard
1 Not Effective Evidence indicates that the key action is not a practice or system that has been adopted and/or implemented at the school, or that the level of adoption/implementation does not improve the school’s effectiveness.
2 Developing Evidence indicates that the key action is a practice or system that is developing at the school, but that it has not yet been implemented at a level that has begun to improve the school’s effectiveness, OR that the impact of the key action on the effectiveness of the school cannot yet be determined.
3 Effective Evidence indicates that the key action is a practice or system that has been adopted at the school, and is implemented at a level that has begun to improve the school’s effectiveness.
4 Highly Effective Evidence indicates that the key action is a practice or system that has been fully adopted at the school, and is implemented at a level that has had a demonstrably positive impact on the school’s effectiveness.
7 “Multiple types of evidence” is defined as evidence collected from two or more of the following: document review, stakeholder focus groups and/or interviews; and classroom observations. 8 “Multiple sources of evidence” is defined as evidence collected from three or more stakeholder focus groups and/or interviews; two or more documents; and/or evidence that a descriptor was documented in 75% or more of lessons observed at the time of the visit.
Extent to which SER
Team Finds Multiple
Types and M
ultiple Sources of Evidence
Extent to which SER Team Finds Evidence of HighLevels of Adoption and/or Implementation
Evidence Relating to Strength of Adoption/Implementation
Key:
Not Effective:
Developing:
Effective:
Highly Effective

Baltimore Education Research Consortium
School Climate: Tools Schools Can Use 35
Appendix E. Baltimore City Schools Instructional Framework

Baltimore Education Research Consortium
School Climate: Tools Schools Can Use 36
Appendix F. Instrument Item Correspondence with NSCC Climate Domains and Organizational Health Tool
Appendix F.1 Staff and Student School Survey Items and Correspondence to
National School Climate Center Domains and Indicators
Domains Staff Survey Questions Student Survey Questions
Safety Learn3 learn7 learn11 learn19 parent3 parent4 safe2r safe5r safe6r safe7r safe11 resource10
Learn19 resource10 safe7r safe15r safe2r safe5r safe12 safe6r
Teaching & Learning
Creative6 resource5 resource7 resource9 resource10 satisfy1 teach1 teach5 teach9 learn7 learn18
Creative6 resource7 satisfy2 learn18 resource10
Interpersonal Relationships
Learn8 learn11 learn12 learn13 learn15 learn16 parent1 parent3 parent4 resource7 resource9 resource10 resource15 teach8 safe6r
Learn11 learn14 safe6r parent3 parent4 resource7 resource8 satisfy4
Institutional Environment
Creative5 learn5 learn13 learn14 meaning1 parent1 parent5 parent23 satisfy8 satisfy12 environ1 environ2r environ5 environ6 resource4 resource17 safe3r safe15r teach7
Creative5 learn14 parent1 satisfy7 satisfy8 satisfy11 satisfy12 value1 environ1 environ2r environ5 environ6 environ7r resource17 safe3r safe15r
Leadership/Staff Relationships
Creative6 learn14 learn17 learn19 resource1 resource2 resource15 resource16 resource19 teach1 teach2 satisfy6 meaning1 meaning2 meaning3 meaning4
None

Baltimore Education Research Consortium
School Climate: Tools Schools Can Use 37
Appendix F.2 Student Survey on Teacher Practice Items, School Effectiveness Review Key Actions, and Correspondence to National School Climate Center Domains
Domains Student Survey on Teacher Practice Questions
School Effectiveness Review Key Actions
Safety Q11 Q12 Q32 Q45 Q47 Q49 3.1
Teaching & Learning
Q6 Q11 Q13 Q15 Q16 Q18 Q19 Q23 Q27 Q30 Q33 Q46 Q50
1.1 1.2 1.5 3.1
Interpersonal Relationships
Q5 Q16 Q17 Q18 Q23 Q30 Q43 Q46
3.1 3.3
Institutional Environment
None 3.2 4.2
Leadership/Staff Relationships
None 1.4 2.1 3.1 4.1 4.3

Baltimore Education Research Consortium
School Climate: Tools Schools Can Use 38
Appendix F.3 Technical Notes on the Organizational Health Tool The Organizational Health Tool features the five NSCC domains of School Climate as well as their associated 12 indicators. For each domain or indicator, the question items as listed in Tables F.1 and F.2 above were collapsed and responses were recoded, specifically: School Survey – staff “Strongly disagree” and “disagree” were
collapsed into “Do Not Agree”; “agree” remained “Agree”; and “strongly agree” remained “Strongly Agree.” The percentage of responses were averaged for the school based on the number of respondents.
Student Survey on Teacher Practices “Never” and “sometimes” were collapsed into “Do Not Agree”; “often” was recoded into “agree”; and “almost always” and “always” were collapsed into “Strongly Agree”. The percentages for each were averaged for the school based on the number of respondents.
Organizational Health Tool - Domain or Indicator
Averaged according to the total number of items from both the School Survey and SSTP included within the NSCC domain or indicator), the percentage for each of “Do Not Agree”, “Agree”, and “Strongly Agree” were calculated for each school.