Embed Size (px)
Citation preview
This article was downloaded by: [University of Tennessee At Martin]On: 04 October 2014, At: 05:26Publisher: Taylor & FrancisInforma Ltd Registered in England and Wales Registered Number: 1072954 Registeredoffice: Mortimer House, 37-41 Mortimer Street, London W1T 3JH, UK
International Journal of GeographicalInformation SciencePublication details, including instructions for authors andsubscription information:http://www.tandfonline.com/loi/tgis20
Measuring rice paddy persistencespanning a century with Japan's oldesttopographic maps: georeferencing theRapid Survey Maps for GIS analysisD. S. Sprague a , N. Iwasaki a & S. Takahashi ba Ecological Management Unit , Ecosystems Research Group ,National Institute for Agro‐Environmental Sciences , Kannondai3‐1‐3 , Tsukuba, Ibaraki 305‐8604, Japanb Institute of History and Anthropology , University of Tsukuba ,Tennodai 1‐1‐1 , Tsukuba, Ibaraki 305‐8571, JapanPublished online: 31 Jan 2007.
To cite this article: D. S. Sprague , N. Iwasaki & S. Takahashi (2007) Measuring rice paddypersistence spanning a century with Japan's oldest topographic maps: georeferencing the RapidSurvey Maps for GIS analysis, International Journal of Geographical Information Science, 21:1,83-95, DOI: 10.1080/13658810600816433
To link to this article: http://dx.doi.org/10.1080/13658810600816433
PLEASE SCROLL DOWN FOR ARTICLE
Taylor & Francis makes every effort to ensure the accuracy of all the information (the“Content”) contained in the publications on our platform. However, Taylor & Francis,our agents, and our licensors make no representations or warranties whatsoever as tothe accuracy, completeness, or suitability for any purpose of the Content. Any opinionsand views expressed in this publication are the opinions and views of the authors,and are not the views of or endorsed by Taylor & Francis. The accuracy of the Contentshould not be relied upon and should be independently verified with primary sourcesof information. Taylor and Francis shall not be liable for any losses, actions, claims,proceedings, demands, costs, expenses, damages, and other liabilities whatsoever orhowsoever caused arising directly or indirectly in connection with, in relation to or arisingout of the use of the Content.
This article may be used for research, teaching, and private study purposes. Anysubstantial or systematic reproduction, redistribution, reselling, loan, sub-licensing,

systematic supply, or distribution in any form to anyone is expressly forbidden. Terms &Conditions of access and use can be found at http://www.tandfonline.com/page/terms-and-conditions
Dow
nloa
ded
by [
Uni
vers
ity o
f T
enne
ssee
At M
artin
] at
05:
26 0
4 O
ctob
er 2
014

Research Article
Measuring rice paddy persistence spanning a century with Japan’s oldesttopographic maps: georeferencing the Rapid Survey Maps for GIS
analysis
D. S. SPRAGUE*{, N. IWASAKI{ and S. TAKAHASHI{{Ecological Management Unit, Ecosystems Research Group, National Institute for
Agro-Environmental Sciences, Kannondai 3-1-3, Tsukuba, Ibaraki 305-8604, Japan
{Institute of History and Anthropology, University of Tsukuba, Tennodai 1-1-1,
Tsukuba, Ibaraki 305-8571, Japan
(Received 14 August 2005; in final form 2 March 2006 )
The Rapid Survey Maps, or Jinsoku Sokuzu, are the first series of topographic
maps covering a large region drawn by modern surveying methods in Japan.
These maps have no projection or map grid. To incorporate them into a
historical GIS, analysts need to identify valid ground control points to
georeference these maps, and identify features that are more likely to be
distorted than other features. We studied the internal distortion in Rapid Survey
Maps while carrying out an overlay analysis for rice paddies between them and a
modern land use map. An irregular overall pattern of distortion implied that
most were due to local surveying errors. In particular, long, thin rice paddy
branches were distorted, leading to mismatches between rice paddies in the older
maps with those in the newer map. This mismatch tended to exaggerate the area
of rice paddies lost to non-paddy land uses in the overlay analysis with a modern
land use map.
Keywords: Georeference; Historical map; Rapid Survey Maps; Rice paddy;
Japan
1. Introduction
Historical maps provide essential data for scholars studying land use change
(Gregory 2003, Roper 2003). Many geographers have taken up the challenge of
developing techniques to incorporate historical maps into geographical information
systems (GIS). Scholzel et al. (2002) developed an algorithm to georeference maps of
unknown projection to apply on historical vegetation maps covering Europe.
Leriche et al. (2004) assessed the reliability of coastal maps spanning more than a
century for their study on seagrass beds along the French Mediterranean coast.
To apply GIS analysis effectively with historical maps, researchers must assess the
amount and patterns of distortion found in older maps, and select methods to fit
these maps to modern map grids. One efficient way to achieve time depth in building
an historical GIS database is to find the earliest maps surveyed by modern surveying
methods that may be available in a study area. In this paper, we report on applying
GIS analysis to the Rapid Survey Maps, or Jinsoku Sokuzu, the first series of
*Corresponding author. Email: [email protected]
International Journal of Geographical Information Science
Vol. 21, No. 1, January 2007, 83–95
International Journal of Geographical Information ScienceISSN 1365-8816 print/ISSN 1362-3087 online # 2007 Taylor & Francis
http://www.tandf.co.uk/journalsDOI: 10.1080/13658810600816433
Dow
nloa
ded
by [
Uni
vers
ity o
f T
enne
ssee
At M
artin
] at
05:
26 0
4 O
ctob
er 2
014

topographic maps covering a large region drawn by plain table surveying in Japan
(Jinsoku Sokuzu Reprinting Committee 1991). The Japanese army carried out a
mapping project to rapidly survey the Kanto Plain, surrounding the capital city of
Tokyo, starting in the year 1880, or Meiji 13, the 13th Year of the reign of the
Emperor Meiji (1868–1921), and the same number of years after a new government
had set Japan on a path towards modernization. The project mapped an area
approximately 170 km east–west and 175 km north–south covering most of the
relatively flat areas of the Kanto Plain, and extending into hilly areas around the
edges of the plain (figure 1). Surveyed at 1/20,000 scale on Japanese paper, each map
depicts an area about 4 km wide and 5 km tall (figure 2). The original Rapid Survey
Maps finally became available to the public when the entire set was published in
1991 (Jinsoku Sokuzu Reprinting Committee 1991).
Figure 1. The Kanto Plain area surveyed by the Japanese army to produce the Rapid SurveyMaps.
84 D. S. Sprague et al.
Dow
nloa
ded
by [
Uni
vers
ity o
f T
enne
ssee
At M
artin
] at
05:
26 0
4 O
ctob
er 2
014

The Rapid Survey Maps are a major landmark in the history of cartography,
certainly for Japan, and for the world as well, as one of the earliest, large-scale
surveying projects carried out by a non-western nation. These colourfully drawn
maps have become a boon for historical geographers working in Japan. They depict
land use that existed just before industrialization and new transportation altered the
traditional forms of land uses, especially many rural landscape features, such as the
grassland commons and woodlands, as well as fields and rice paddies, lost already
by the time of subsequent maps (Inui 1992, Ogura 1996, Sprague 2003).
Geographers have attempted various techniques to quantitatively analyse land
use depicted in the Rapid Survey Maps. For example, Shirai (2002) carried out a
detailed study of woodlands found in northern Chiba Prefecture. He constructed a
Figure 2. Rapid Survey Map No. 260 of Ushiku Village, County of Kawachi, Land ofHitachi, the lower left map used in this study.
Rice paddy persistence 85
Dow
nloa
ded
by [
Uni
vers
ity o
f T
enne
ssee
At M
artin
] at
05:
26 0
4 O
ctob
er 2
014

1 km grid over the Rapid Survey Maps, ranked the major land uses by visual
inspection, and assigned each grid cell to the highest-ranking land use. Tsunekawa
and Besho (2003) focused on the woodlands of the Tama Hills to the west of Tokyo.
They faced the problem that the Rapid Survey Map does not mark all woodlands at
the species level. They based their GIS analysis on the locations of the species
markings where they existed in the maps. They digitized the markings as points,
drew a 100 m radius circle around each point, and traced changes in woodland
composition from a succession of topographic maps in those circles. Sprague et al.
(2000) digitized entire maps and georeferenced them to a modern map to calculate
the areas of major land uses, but they did not report the georeference method in
detail or attempt to measure the internal distortion of the maps, and did not carry
out multitemporal analysis with modern maps.
Whether or not Rapid Survey Maps can be georeferenced precisely to modern
maps is critical for geographers planning to apply GIS analysis to them, especially
for those planning multitemporal analysis. In this study, we analysed the persistence
of rice paddies from the 1880s to the 1980s in our study area in the northern Kanto
Plain with an overlay analysis of Rapid Survey Maps with a modern land use map.
As part of the study, we investigated whether Rapid Survey Maps had been
surveyed consistently enough that a simple georeference with four ground control
points (GCPs) was sufficient to match them to a modern map. We searched for valid
GCPs in Rapid Survey Maps, mapped the internal distortion remaining in the maps
after a four-point georeference, and measured the extent to which additional rubber
sheeting improved the results of the multitemporal overlay analysis of rice paddies.
2. Methods
2.1 Maps
The Rapid Survey Maps used in this analysis were four adjacent maps of southern
Ibaraki Prefecture in the northern Kanto Plain, numbered by the publisher, and
named here by the name of a village in each map, as follows: No. 152 Otto (surveyed
1883), No. 150 Arakawaoki (1883), No. 260 Ushiku (1881), and No. 258 Okami
(1881). These maps are within our study area for an on-going project on the history
of rural land use in the Kanto Plain. Each map had been surveyed independently by
its own team of surveyors, and we originally selected one map (Ushiku, figure 2) for
this project because it seemed to have been surveyed and annotated with great care.
The roads and paths demarcating land use units, including rice paddies, were
digitized. Rice paddies are colour-coded and clearly distinguishable from other land
uses.
The modern reference maps were 1/25,000 topographic maps of the Geographical
Survey Institute of the Japanese government in the universal transverse mercator
projection (UTM) projection (Zone 54) of the Tokyo datum commonly used by
Japanese topographic maps until recently (the datum for Japanese topographic
maps has changed recently to the JGD2000 datum). Two map sets, from 1974 and
2000, covering the study area were used: one issued in 1978 as the earliest set for this
area printed in the UTM projection, and the other set issued in 2000. The overlay
analysis intersected the Rapid Survey Maps over a vegetation map showing land use
in the early 1980s, issued at 1/50,000 scale in vector format in the same UTM
projection by the Japanese Ministry of Environment as one product of the 3rd
National Biodiversity Survey.
86 D. S. Sprague et al.
Dow
nloa
ded
by [
Uni
vers
ity o
f T
enne
ssee
At M
artin
] at
05:
26 0
4 O
ctob
er 2
014

2.2 Analysis
The Rapid Survey Maps have no map projection, and no indications of latitude or
longitude. Although most of the maps show triangulation points, none of these
triangulation points match those in modern topographic maps. At first sight, the maps
seem to be drawn very accurately. Many features, including rice paddies, correspond to
those found in the landscape today. This presented the possibility that the maps could
be georeferenced using features found in common between the 1880s and later maps.
We applied a two-step process to georeference Rapid Survey Maps to modern
topographic maps in the UTM projection commonly used by Japanese topographic
maps. In the principal step, for each map, we chose four locations as ground control
points (GCPs) in a Rapid Survey Map, and applied an affine transformation. We
chose candidate GCPs by examining maps to find roads and paths that existed in
both a Rapid Survey Map and a topographic map. Root mean square (RMS) error
was calculated for various combinations of four candidate GCPs to select the
combination of four GCPs with the lowest RMS error from among the candidate
GCPs. Ushiku and Okami share one GCP chosen in their overlapping edge. The
overlap is excluded in subsequent analysis. Otto and Arakawaoki did not have
overlapping edges.
In the secondary step, the principal step product was displayed over a modern
topographic map, and rubber sheeted to match more closely to a modern map. All
linear features in the maps were subject to the secondary step, but the subsequent
overlay analysis was carried out with the rice paddies only. The lengths of the links
(i.e. the distances moved) were used to analyse the degree of distortion in the Rapid
Survey Maps when compared to the modern maps. The rubber sheeting links were
classified according to whether they applied to rice paddy or roads unassociated
with rice paddy. Next, we created an overall distortion map, by applying the same
links to rubber sheet a regular point grid (50 m interval), to represent how features
would be adjusted by these links if the maps had been evenly filled with features. An
autocorrelation model calculated the range of influence for the rubber sheeting
process in each map from a semivariogram of the displacement distances of the
points comprising the distortion map.
Finally, we carried out the overlay analysis of the rice paddies in the Rapid Survey
Maps with rice paddies in the modern land use map. The analysis was carried out
twice, before and after the secondary georeferencing step. The results were
compared to determine whether the overlay results improved with rubber sheeting.
The GIS software used in this project were Arc/Info Workstation 9 and ArcGIS 9.
We used a two-step process for the following reasons. First, we explored the
possibility that the Rapid Survey Maps had been so well surveyed that they could be
precisely georeferenced with the minimum number of GCPs. Second, the four GCPs
with the lowest RMS error should result in the minimum amount of spatial
adjustment to allow analysis of the remaining distortion in the map after the
primary step. Third, the secondary step allowed us to quantify and map the pattern
of remaining distortion, and identify the features that tended to be more distorted
than others in relation to the modern topographic map.
3. Results
The study area in the 1880s was completely rural with a landscape composed of rice
paddies in the narrow river valleys, and dry fields, woodlands and grasslands on the
Rice paddy persistence 87
Dow
nloa
ded
by [
Uni
vers
ity o
f T
enne
ssee
At M
artin
] at
05:
26 0
4 O
ctob
er 2
014

uplands. Housing was concentrated in villages and small towns. There were no
motor roads or railways. By the 1980s, much of the study area had been
incorporated into the cities of Tsukuba, Tsuchiura, and Ushiku. Land use had
become a mixture of rural, suburban residential, and urban, while large facilities had
sprung up for schools, the armed forces, and the research institutes of Tsukuba
Science City. The roads and paths had been converted for motor use. New roads and
a railway crossed the landscape.
The Rapid Survey Maps depict a large number of roads and paths. Good
candidate GCPs were intersections or sharp curves of small roads found to exist in
both the Rapid Survey Maps and the modern topographic maps (figure 3). GCPs at
such locations, drawn as the intersection of thin lines, were both relatively precise
and replicable. We assumed that small, isolated roads were less likely to have been
moved in the time between the surveying of the Rapid Survey Maps and modern
maps. Some roads embedded in old villages were also less likely to have moved
because the farmhouse compounds were unlikely to have moved.
Several features were poor GCP candidates. Many temples and shrines appear in
the maps of both periods, but the buildings are either not depicted precisely or not
depicted at all. The shapes of towns, fields or rice paddies, when not bounded by
roads, were often not drawn clearly enough to be identified precisely in either the
older or modern maps. Some roads had been partially rebuilt, straightened, and
moved. The locations of larger modern roads were less precise because they were
drawn with multiple lines. Rivers and streams had often been rerouted, rebuilt, or
drawn with thick or multiple lines. No candidate GCPs remained in areas
completely rebuilt, such as new housing estates, business developments, and
compounds of large institutions, such as schools, factories, shopping malls, and
research institutes.
In general, the primary step showed that the plain table surveying had resulted in
a moderately good match between the older Rapid Survey Maps and the modern
Figure 3. Details of a Rapid Survey Map (Ushiku), left, and a corresponding moderntopographic map (issued 1978), right, with one GCP chosen from the intersection of smallrural roads used to georeference the Rapid Survey Map in the primary step.
88 D. S. Sprague et al.
Dow
nloa
ded
by [
Uni
vers
ity o
f T
enne
ssee
At M
artin
] at
05:
26 0
4 O
ctob
er 2
014

maps (table 1). The best apparent fit was for Ushiku, with an input RMS error of
0.003 inches. By contrast, an input RMS error of only 0.032 inches was achieved for
Otto. Average skew was a very low 0.0002 degrees, and less than 1 degree in each of
the four maps. Low rotation, under 1 degree for three maps, suggests that the
surveyors had oriented the maps close to true north, since magnetic declination is 6
degrees 50 minutes west according to modern maps, and 4 degrees 6 minutes west as
marked on the Rapid Survey Maps, but this rotation angle includes the correction
for the misalignment of the maps on the printed page or on the digitizer. The scale
factor, at an average of 510 (X direction) and 511 (Y direction), when 508 was
expected, indicates that the maps are slightly small for a 1/20,000 scale map, either as
surveyed or in this printed reproduction. Nevertheless, the fits appear quite exact for
rice paddies in the four maps as shown in figure 4.
Closer examination showed, however, that a large amount of distortion remained
in the maps. In particular, some of the long, thin branches of rice paddies were
obviously distorted after the primary step (figure 4). The RMS errors of the rubber
sheeting links indicate the amount of distortion found in the secondary step
(table 1). RMS errors of the links differed among maps, and also between links
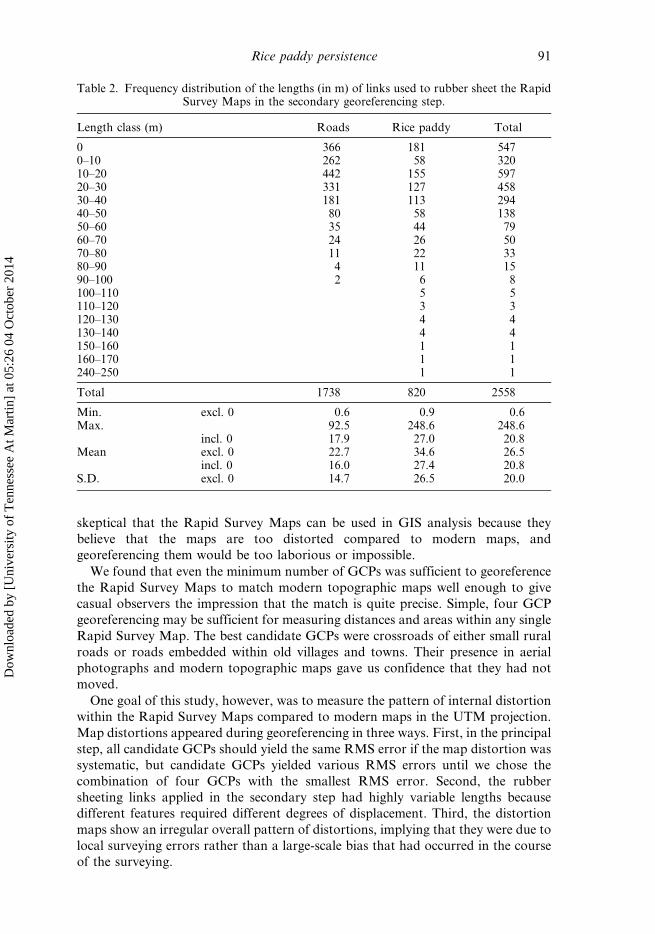
associated with roads and those of rice paddies. Of the 2558 links applied in the four
maps, 547 were identity links of length 0 used to hold down locations judged not to
need any further displacement (table 2). Excluding the identity links, rice paddy links
were on average 34.6 m long while those associated only with roads were 22.7 m
long. The longest link was 248.6 m for a rice paddy branch.
The distortion maps show that the four Rapid Survey Maps do not show
systematic distortion (figure 5). The maps reveal various degrees of irregular and
local distortions at different places, most notably around the tips of the rice paddy
branches. The degree of autocorrelation in the displacement distances of the points
in the distortion map showed that the range of influence resulting from the
secondary step was about 500 m (Otto 489.3 m, Arakawaoki 498.5 m, Ushiku
509.6 m, Okami 694.2 m, spherical model, lag set to 10 m, and number of lags set to
100).
The results differed between the overlay analyses carried out before and after the
secondary step for the land use fate of rice paddies (table 3). The areas most affected
Table 1. Affine transformation parameters for the four GCPs used in the primary step, andforward transformation RMS errors of the links used to rubber sheet each map in the
secondary georeferencing step.
Map name
AverageOtto Arakawaoki Ushiku Okami
Primary stepRMS error input (inch) 0.032 0.008 0.003 0.006 0.012
output (m) 16.346 4.006 1.674 3.043 5.925Scale X 512.419 509.783 509.262 510.074 510.182
Y 512.936 508.071 512.199 512.829 511.351Skew (degrees) 20.098 20.691 0.394 0.041 20.0002Rotation (degrees) 20.802 21.451 20.030 20.642 20.578
Secondary stepNumber of links 568 587 655 759 642.25RMS error X (m) 21.888 15.997 21.165 20.753 19.951
Y (m) 25.450 13.231 19.341 21.013 19.759
Rice paddy persistence 89
Dow
nloa
ded
by [
Uni
vers
ity o
f T
enne
ssee
At M
artin
] at
05:
26 0
4 O
ctob
er 2
014
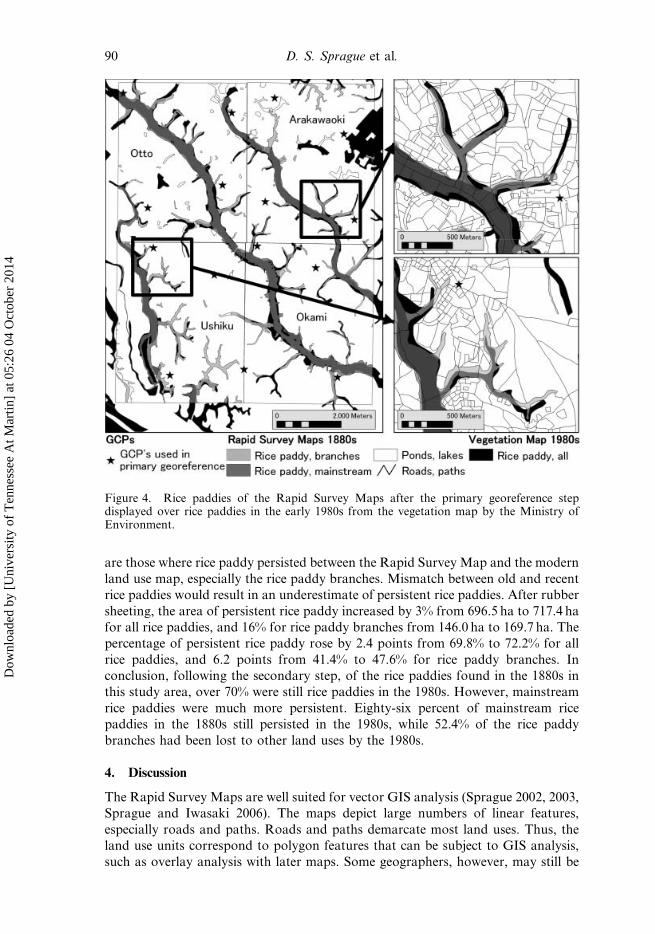
are those where rice paddy persisted between the Rapid Survey Map and the modern
land use map, especially the rice paddy branches. Mismatch between old and recent
rice paddies would result in an underestimate of persistent rice paddies. After rubber
sheeting, the area of persistent rice paddy increased by 3% from 696.5 ha to 717.4 ha
for all rice paddies, and 16% for rice paddy branches from 146.0 ha to 169.7 ha. The
percentage of persistent rice paddy rose by 2.4 points from 69.8% to 72.2% for all
rice paddies, and 6.2 points from 41.4% to 47.6% for rice paddy branches. In
conclusion, following the secondary step, of the rice paddies found in the 1880s in
this study area, over 70% were still rice paddies in the 1980s. However, mainstream
rice paddies were much more persistent. Eighty-six percent of mainstream rice
paddies in the 1880s still persisted in the 1980s, while 52.4% of the rice paddy
branches had been lost to other land uses by the 1980s.
4. Discussion
The Rapid Survey Maps are well suited for vector GIS analysis (Sprague 2002, 2003,
Sprague and Iwasaki 2006). The maps depict large numbers of linear features,
especially roads and paths. Roads and paths demarcate most land uses. Thus, the
land use units correspond to polygon features that can be subject to GIS analysis,
such as overlay analysis with later maps. Some geographers, however, may still be
Figure 4. Rice paddies of the Rapid Survey Maps after the primary georeference stepdisplayed over rice paddies in the early 1980s from the vegetation map by the Ministry ofEnvironment.
90 D. S. Sprague et al.
Dow
nloa
ded
by [
Uni
vers
ity o
f T
enne
ssee
At M
artin
] at
05:
26 0
4 O
ctob
er 2
014
skeptical that the Rapid Survey Maps can be used in GIS analysis because they
believe that the maps are too distorted compared to modern maps, and
georeferencing them would be too laborious or impossible.
We found that even the minimum number of GCPs was sufficient to georeference
the Rapid Survey Maps to match modern topographic maps well enough to give
casual observers the impression that the match is quite precise. Simple, four GCP
georeferencing may be sufficient for measuring distances and areas within any single
Rapid Survey Map. The best candidate GCPs were crossroads of either small rural
roads or roads embedded within old villages and towns. Their presence in aerial
photographs and modern topographic maps gave us confidence that they had not
moved.
One goal of this study, however, was to measure the pattern of internal distortion
within the Rapid Survey Maps compared to modern maps in the UTM projection.
Map distortions appeared during georeferencing in three ways. First, in the principal
step, all candidate GCPs should yield the same RMS error if the map distortion was
systematic, but candidate GCPs yielded various RMS errors until we chose the
combination of four GCPs with the smallest RMS error. Second, the rubber
sheeting links applied in the secondary step had highly variable lengths because
different features required different degrees of displacement. Third, the distortion
maps show an irregular overall pattern of distortions, implying that they were due to
local surveying errors rather than a large-scale bias that had occurred in the course
of the surveying.
Table 2. Frequency distribution of the lengths (in m) of links used to rubber sheet the RapidSurvey Maps in the secondary georeferencing step.
Length class (m) Roads Rice paddy Total
0 366 181 5470–10 262 58 32010–20 442 155 59720–30 331 127 45830–40 181 113 29440–50 80 58 13850–60 35 44 7960–70 24 26 5070–80 11 22 3380–90 4 11 1590–100 2 6 8100–110 5 5110–120 3 3120–130 4 4130–140 4 4150–160 1 1160–170 1 1240–250 1 1
Total 1738 820 2558
Min. excl. 0 0.6 0.9 0.6Max. 92.5 248.6 248.6
Meanincl. 0 17.9 27.0 20.8excl. 0 22.7 34.6 26.5
S.D.incl. 0 16.0 27.4 20.8excl. 0 14.7 26.5 20.0
Rice paddy persistence 91
Dow
nloa
ded
by [
Uni
vers
ity o
f T
enne
ssee
At M
artin
] at
05:
26 0
4 O
ctob
er 2
014
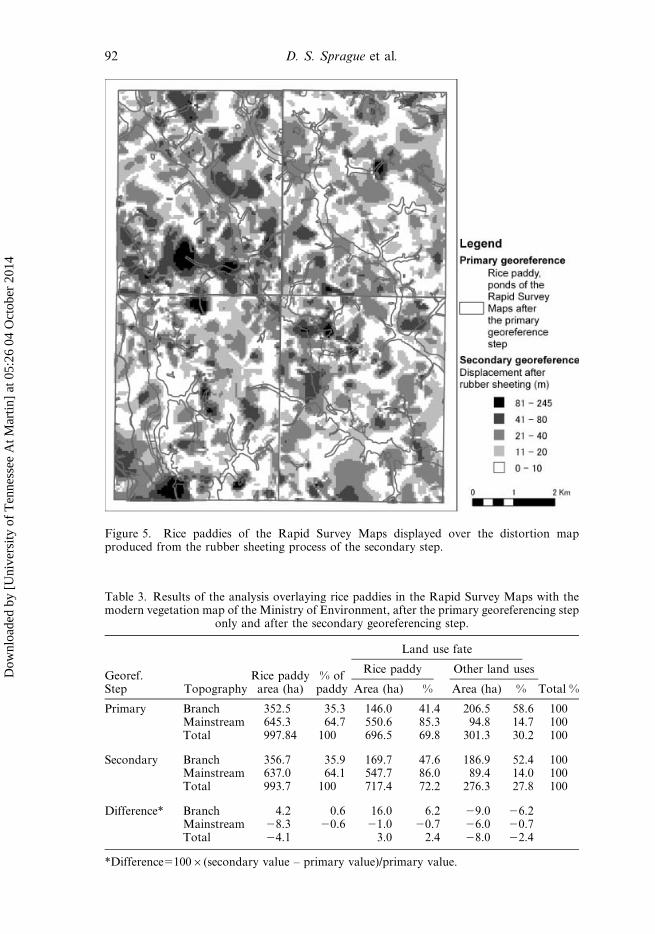
Figure 5. Rice paddies of the Rapid Survey Maps displayed over the distortion mapproduced from the rubber sheeting process of the secondary step.
Table 3. Results of the analysis overlaying rice paddies in the Rapid Survey Maps with themodern vegetation map of the Ministry of Environment, after the primary georeferencing step
only and after the secondary georeferencing step.
Georef.Step Topography
Rice paddyarea (ha)
% ofpaddy
Land use fate
Total %
Rice paddy Other land uses
Area (ha) % Area (ha) %
Primary Branch 352.5 35.3 146.0 41.4 206.5 58.6 100Mainstream 645.3 64.7 550.6 85.3 94.8 14.7 100Total 997.84 100 696.5 69.8 301.3 30.2 100
Secondary Branch 356.7 35.9 169.7 47.6 186.9 52.4 100Mainstream 637.0 64.1 547.7 86.0 89.4 14.0 100Total 993.7 100 717.4 72.2 276.3 27.8 100
Difference* Branch 4.2 0.6 16.0 6.2 29.0 26.2Mainstream 28.3 20.6 21.0 20.7 26.0 20.7Total 24.1 3.0 2.4 28.0 22.4
*Difference51006(secondary value – primary value)/primary value.
92 D. S. Sprague et al.
Dow
nloa
ded
by [
Uni
vers
ity o
f T
enne
ssee
At M
artin
] at
05:
26 0
4 O
ctob
er 2
014
The objective of the primary step was to apply a systematic transformation
resulting in a minimum amount of adjustment to a Rapid Survey Map. Note that
the four GCPs used in the primary step may not necessarily result in the best initial
overall fit. The four GCPs may have shown the smallest RMS error by coincidence
where the map distortion happened to produce the smallest RMS error in relation to
the same locations on the modern map. In theory, if the maps had been surveyed
systematically, then the GCPs with the lowest RMS error should be closest to the
‘correct’ locations. The Arc/Info user’s guide recommends maximum tolerable RMS
errors when georeferencing a map, 0.004 inches for highly accurate map data and
0.008 inches for maps requiring less accuracy (ESRI 1992). By these criteria, the map
of Ushiku achieved high accuracy, while those of Arakawaoki and Okami were
within acceptable limits of accuracy (table 1). The map for Otto had a higher RMS
error, but this was still the smallest error that we achieved from the GCPs that we
tried. In practice, the least spatial adjustment of the maps should result by using the
four GCPs with the lowest RMS error. The remaining distortion can be interpreted
as internal distortion that had to be found and corrected in the secondary step. By
contrast, georeferencing with a large number of candidate GCPs or applying a high-
order polynomial solution may produce the appearance of a better initial match.
However, these procedures may obscure the local distortion that existed at
particular GCP locations, or hide serious local mismatches that would not have
allowed us to identify the features that were most distorted in a Rapid Survey Map.
GCPs need to be selected carefully to avoid distorting the map any further, or
obscuring surveying errors that an analyst should be aware of. Thus, we suggest two
approaches to choosing GCPs for georeferencing the Rapid Survey Maps. The first
minimum-error approach is to select four GCPs with the lowest RMS error to apply
the minimum amount of adjustment, as we have done with an affine transformation
in this study. The second adjustive approach is to select reliable GCPs with extreme
care, using additional information from other maps, aerial photographs, or field
research, and allow these GCPs to adjust the map regardless of the RMS error. The
choice of method depends partly on RMS errors achieved by the two approaches.
There would be little meaning in distinguishing the minimum-error approach from
the adjustive approach, if the two result in the same RMS errors. Among the four
maps in this study, the georeference for Otto was, in effect closer to an adjustive
approach because of its relatively high RMS error in the primary step. In either
method, analysts should look for local surveying errors that may need to be
corrected further, while checking for the possibility that some features had, in fact,
moved between the 1880s and 1980s.
Some rice paddy branches showed large mismatches after the primary
georeferencing step. Rubber sheeting links for rice paddy branches were as much
as 249 m long. The actual rice paddies are topographically stable. They are built in
the bottom of narrow river valleys, often with steep slopes, and unlikely to have
moved enough to explain the mismatch following the principal step. We speculate
that the surveyors had traversed along the central stream and had not cross-checked
the measurements in these rice paddies because they are located in valley bottoms
with poor visibility to the surrounding landscape.
Overlay analysis carried out before and after the secondary step showed that
rubber sheeting improved the match of rice paddies. Over the four maps, the area of
rice paddies that persisted between the 1880s and 1980s rose by 3.3%. Some
researchers may consider this difference to be too small to justify the effort of rubber
Rice paddy persistence 93
Dow
nloa
ded
by [
Uni
vers
ity o
f T
enne
ssee
At M
artin
] at
05:
26 0
4 O
ctob
er 2
014

sheeting, and decide that principal georeferencing is sufficient for their study goals.
However, distortion is larger for paddy branches, and larger the further out on the
branches. Researchers focusing on the branches of rice paddies should georeference
their maps more carefully. For rice paddy branches, the area of persistent paddies
rose by 16% after secondary georeferencing; probably not a difference that can be
ignored in a study focused on them. Furthermore, the effect of mismatch is reduced
in this study because many branches had been lost by the 1980s. The mismatches will
be more apparent in overlay analyses with slightly earlier maps with larger areas of
persistent rice paddy branches.
Various fields of scholarship focus research on rice paddy branches, known as
yatsu, because they are considered to have great cultural and ecological value
(Moriyama 1997, Takeuchi 2003). Geographers remind the Japanese people that the
yatsu landscape, combining rice paddies with woodlands, grasslands, and villages, is
the rural landscape characteristic of the boundary region between plain and upland
of the Kanto Plain (Inui 1992). Ecologists point out that the yatsu landscapes
support the biodiversity characteristic of the rice paddy ecosystem with aquatic,
wooded, and open habitats arrayed in close proximity (Fujihara et al. 2005,
Matsuura et al. 2005). The loss of yatsu, as well as the loss of rice paddies in general,
is a serious research issue in Japan. The Rapid Survey Maps allow researchers to
trace the history of particular yatsu back to the 1880s. As the cropland producing
Japan’s staple food, rice paddies can be very persistent. In this study, 86% of
mainstream rice paddies had persisted from the 1880s to the 1980s. However, about
half of rice paddy branches had been lost by the 1980s and more continue to be lost
today. Thus, the mainstream rice paddies can give a misleading impression of long-
term rice paddy persistence. The yatsu are harder to observe, but their maintenance
can have broad effects on the character of the surrounding landscape as well as the
land they occupy. Careful GIS analysis of the Rapid Survey Maps will allow
geographers to correctly identify yatsu that persist, as well as accurately measure the
amount that has been lost from a century ago.
GIS analysts must take up the challenge to incorporate historical maps into
digital spatial analysis. Geographers of Japan should not hesitate to apply GIS
analysis to the Rapid Survey Maps. However, analysts need to georeference and
correct distortion for each map, and be ready to explain whether the distortions will
affect the results of their study or which parts of the map required the most
correction. We propose a procedure to georeference the Rapid Survey Maps in a
primary step applying a simple systematic transformation and a secondary step
addressing local and irregular distortions with rubber sheeting. The Rapid Survey
Maps have been surveyed well enough that primary georeferencing may be sufficient
for measuring areas and lengths in a single map. Secondary georeferencing may be
necessary for multitemporal analysis or the more precise edgematching of multiple
maps.
Acknowledgments
This study was funded by the National Institute for Agro-Environmental Sciences,
and the project titled ‘Developing technology for coexisting with nature within agro-
forest and aquatic watershed landscapes’ of the Japanese Ministry of Agriculture,
Forestry, and Fisheries. We thank many colleagues for their discussions and
suggestions on how the Rapid Survey Maps had been surveyed. We especially
appreciated the insights of H. Moriyama on the traditional rural landscape of
Japan, and the efforts of T. Goto in building the GIS database.
94 D. S. Sprague et al.
Dow
nloa
ded
by [
Uni
vers
ity o
f T
enne
ssee
At M
artin
] at
05:
26 0
4 O
ctob
er 2
014

ReferencesESRI, 1992, Arc/Info Data Model, Concepts, and Key Terms (Redlands: Environmental
Systems Research Institute).
FUJIHARA, M., HARA, K. and SHORT, K.M., 2005, Changes in landscape structure of ‘yatsu’
valleys: a typical Japanese urban fringe landscape. Landscape and Urban Planning, 70,
pp. 261–270.
GREGORY, I.N., 2003, A Place in History: A Guide to Using GIS in Historical Research
(Oxford: Oxbow Books).
INUI, T., 1992, The Plains Woodlands of the Kanto Plain (Tokyo: Kokon Shoin) (in Japanese).
JINSOKU SOKUZU REPRINTING COMMITTEE, 1991, Early Meiji Hand Coloured Kanto Survey
Maps (Tokyo: Kinokuniya) (in Japanese).
LERICHE, A., BOUDOURESQUE, C.-F., BERNARD, G., BONHOMME, P. and DENIS, J., 2004, A
one-century suite of seagrass bed maps: can we trust ancient maps? Estuarine Coastal
and Shelf Science, 59, pp. 353–362.
MATSUURA, T., YOKOHARI, M. and AZUMA, A., 2005, Identification of potential habitats of
gray-faced buzzard in Yatsu landscapes by using digital elevation model and digitized
vegetation data. Landscape and Urban Planning, 70, pp. 231–243.
MORIYAMA, H., 1997, What Does It Mean To Protect Rice Paddies? (Tokyo: Nobunkyo) (in
Japanese).
OGURA, J., 1996, Japanese Livelihoods As Seen From Vegetation—with the Focus on the Meiji
Era (Tokyo: Ozankaku) (in Japanese).
ROPER, C., 2003, Historical mapping is still under-valued and under-used. Cartographic
Journal, 40, pp. 131–134.
SCHOLZEL, C.A., HENSE, A., HUBL, P., KUHL, N. and LITT, T., 2002, Digitizing and geo-
referencing of botanical distribution maps. Journal of Biogeography, 29, pp. 851–856.
SHIRAI, Y., 2002, Firewood and charcoal production and land use in the western Shimosa
Upland during the second decade of the Meiji Period 1878–1887: an analysis of the
Jinsokusokuzu (Concise Chart) and Teisatsuroku (Scouting Report). Rekishi Chiri
[Historical Geography], 44, pp. 1–21 (in Japanese).
SPRAGUE, D.S., 2002, Historical mapping for biodiversity planning: searching the past to set
future goals. Landscape Planning and Horticulture, 2, pp. 218–222.
SPRAGUE, D.S., 2003, Function and spatial structure of grasslands in the Kanto Plain: did
plains grasslands exist? Grassland Science, 48, pp. 532–536 (in Japanese).
SPRAGUE, D.S., GOTO, T. and MORIYAMA, H., 2000, GIS analysis using the Rapid Survey
Map of traditional agricultural land use in the early Meiji Era. Landscape Research
Japan, 63, pp. 771–774 (in Japanese).
SPRAGUE, D.S. and IWASAKI, N., 2006, The Rapid Survey Maps: Japan’s first modern
topographic maps and the GIS analysis of historical land use in the Kanto Plain. In
International Research Symposium Proceedings, pp. 167–179 (Kyoto: International
Research Center for Japanese Studies).
TAKEUCHI, K., 2003, Satoyama landscapes as managed nature. In Satoyama: The Traditional
Rural Landscape of Japan, K. Takeuchi, R.D. Brown, I. Washitani, A. Tsunekawa
and M. Yokohari (Eds), pp. 9–16 (Tokyo: Springer-Verlag).
TSUNEKAWA, A. and BESSHO, T., 2003, Satoyama landscape transition in the Kanto Area. In
Satoyama: The Traditional Rural Landscape of Japan, K. Takeuchi, R.D. Brown, I.
Washitani, A. Tsunekawa and M. Yokohari (Eds), pp. 51–60 (Tokyo: Springer-
Verlag).
Rice paddy persistence 95
Dow
nloa
ded
by [
Uni
vers
ity o
f T
enne
ssee
At M
artin
] at
05:
26 0
4 O
ctob
er 2
014


