Embed Size (px)
Citation preview

Click to edit Master title style
with and
Measuring Rates, Ocean Liner Supply, and Transit Times in Ocean Markets

Click to edit Master title style Today’s Speakers
John Schnorf
Director, Business
Development
CHAINalytics
Matthew Harding
Principal, Transportation
CHAINalytics
Hayes Howard
CEO
President
Stacey Kapushy
Manager, Import/Export
Compliance &
International Freight
2

Click to edit Master title style Today’s Agenda
Opening Remarks and Chainalytics Overview
Chainalytics Benchmarking Solutions
Armstrong World Industries on Benchmarking Value
ComPair Data Solutions
Recap and Q&A
3

Click to edit Master title style
4
Who is Chainalytics?
Over 70 FTEs Worldwide
Strategic Growth Via Mergers & Acquisitions
Supply Chain Operations (Chainnovations)
Packaging Design and Optimization (Adalis Packaging
Solutions Group)
Our Clients
More Than 180 Unique Clients
14 of AMR’s Top 25 Supply Chains
57 Fortune 500 Companies
5 of Top 10 Retailers
7 of Top 10 Food & Beverage Manufacturers
5 of Top 10 CPG Companies
6 of Top 10 Forest, Paper and Packaging Companies
Our Experience
More Than 375 Engagements
TODAY
• 1st Named to “100 Great Supply Chain Partners”
List by SupplyChainBrain; Recognized for 8 Years
Running
• Launch of Model-Based Benchmarking
Consortium (MBBC)
• Named “Supply Chain Company of the Year” by
Metro Atlanta Chamber
2001
2002
2003
2004
2005
2006
2007
2009
2010
2011
• MBBC named “Top Supply Chain Innovation” by
Supply & Demand Chain Executive
• Named to ARC Advisory’s “10 Coolest Supply
Chain Boutiques” 2008
Our Genesis
• Market Lacked Proven, Focused Supply Chain
Analytics Competence
• “Best Analytical Minds in Supply Chain”
Empowering Fact-Based Decisions
Across Your Supply Chain
• Launch of Sales & Operations Variability Consortium
(S&OVC)
• Mike Kilgore named a “Pro to Know” by Supply &
Demand Chain Executive; Jeff Metersky (2006), Gary
Girotti (2007), Steve Ellet (2011), and Irv Grossman
(2011) also named Pros to Know
• Established Chainalytics India Private Limited in
Bangalore

Click to edit Master title style
Years
Quarters
Months
Weeks
Planning
Horizon
Value-Driven Supply Chain Decisions
Supply Chain Design
Packaging Optimization
Sales, Inventory & Operations Planning
Transportation Logistics Operations
Service Supply Chain
At what service level can we
profitably satisfy demand?
How should we transport
product through the supply
chain?
How much and where should inventory be
positioned in the supply chain?
Can we reduce our transport and logistics costs by improving cube
utilization?
Should our warehousing and material
operations be insourced
or outsourced?
When should we buy or make product to make the best use of our capacity?
What is the best flowpath?
How well do our current operations
mitigate repair and warranty
costs?
How can we increase
visibility to stakeholders?
Click to edit Master title style
HIGH TECH
6
Some of Our Clients
FOOD AND
BEVERAGE
RETAIL
COMMUNICATION
AND UTILITIES
HOME/OFFICE
DURABLES
HOME/OFFICE
NON-DURABLES
LSP Chemical/Process Auto/Industrial Packaging Healthcare
OTHER
INDUSTRIES
SERVED
Click to edit Master title style
Forecasting ocean freight cost is near impossible
Volatility reigns supreme in ocean markets
Down 25% one year, up 30-50% the next
No clear direction in the industry to rectify
Biggest challenges go beyond ocean transportation cost
Inventory implications, responsiveness, resilience
Landed cost, product pricing, time to market
For many – ocean rates impact global supply chain design implications
Insource vs. outsource
Domestic manufacturing vs. international
Ocean Rates and Business Landscape

Click to edit Master title style
What options exist in the market? How is supply changing, what
transit times are available?
How do differences in policy, choices and requirements, affect market position over the year?
How do outlook, contractual elements, procurement cycles,
technology differ among my peers?
Which specific trades, markets do I have a cost advantage, where to
focus improvement?
8
Chainalytics & ComPair Data
Strategic Insights Qualitative Assessment Tactical Rate Analysis Capacity and Transit
Time Market Analysis
Am I paying a fair price for transportation?
Ocean Model-based Benchmark Consortium Chainalytics $25B in proven benchmarking processes 91 Reported models delivered annually all modes Over 100 Trades supported in 2010 ComPair Data 114 Global Trade Routes 208 Ocean Carriers Measured 1636 Ocean Carrier Liner Services Tracked 4865 Vessels 807 Ports
Click to edit Master title style
9
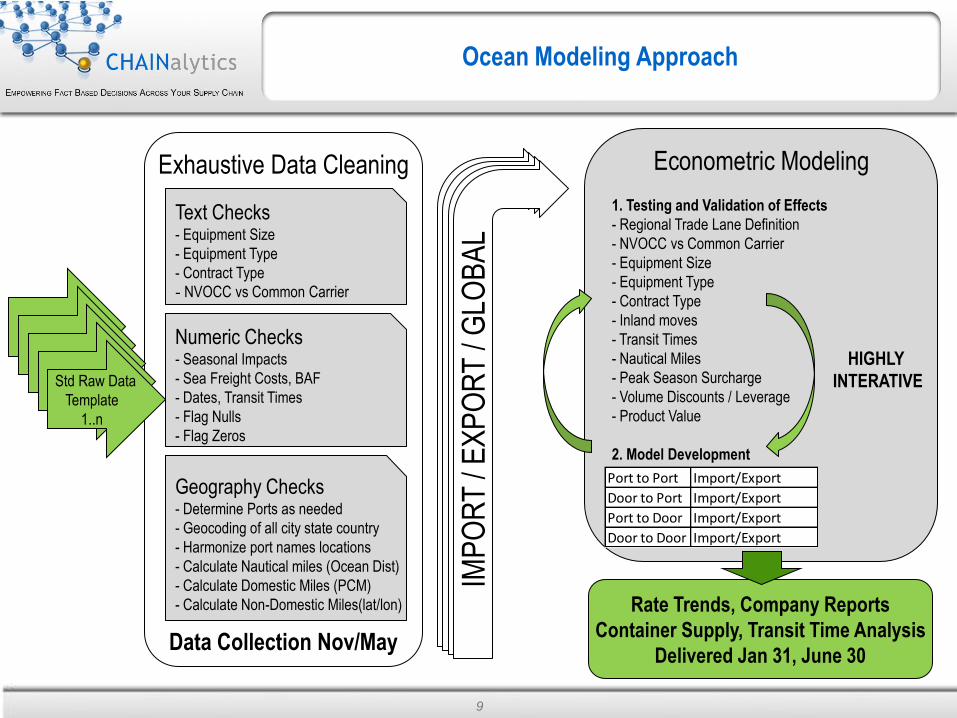
Ocean Modeling Approach
Exhaustive Data Cleaning
Data Collection Nov/May
Raw Data 1 Raw Data 1
Raw Data 1 Raw Data 1 Std Raw Data
Template
1..n
Text Checks - Equipment Size
- Equipment Type
- Contract Type
- NVOCC vs Common Carrier
Numeric Checks - Seasonal Impacts
- Sea Freight Costs, BAF
- Dates, Transit Times
- Flag Nulls
- Flag Zeros
Geography Checks - Determine Ports as needed
- Geocoding of all city state country
- Harmonize port names locations
- Calculate Nautical miles (Ocean Dist)
- Calculate Domestic Miles (PCM)
- Calculate Non-Domestic Miles(lat/lon)
ALL
MO
DE
S
Econometric Modeling
1. Testing and Validation of Effects
- Regional Trade Lane Definition
- NVOCC vs Common Carrier
- Equipment Size
- Equipment Type
- Contract Type
- Inland moves
- Transit Times
- Nautical Miles
- Peak Season Surcharge
- Volume Discounts / Leverage
- Product Value
2. Model Development
Rate Trends, Company Reports
Container Supply, Transit Time Analysis
Delivered Jan 31, June 30
ALL
MO
DE
S
ALL
MO
DE
S
IMP
OR
T /
EX
PO
RT
/ G
LOB
AL
Port to Port Import/Export
Door to Port Import/Export
Port to Door Import/Export
Door to Door Import/Export
HIGHLY
INTERATIVE

Click to edit Master title style Global Port Regions Supported - 2010 Model
NEUS
CARIBBEAN
MEDITERRANEAN
WEUR
NEUR
MIDDLE
EAST
BLKSEA
W AFRICA
E AFRICA
S AFRICA
AUS/NZ
INDIA
WSA BRAZ-URG-ARG
MEX-CENTAM
PACIFIC ONLY
S CHINA /TW
N
CHINA
JAPAN
KOREA
PHPINES
SE ASIA
SE ASIA
NWUS
SWUS SEUS

Click to edit Master title style
$0
$1,000
$2,000
$3,000
$4,000
$5,000
$6,000
$7,000
$8,000
25-
Au
g-0
9
14-
Oct
-09
03-D
ec-0
9
22-J
an-1
0
13-
Ma
r-1
0
02-M
ay-1
0
21-J
un-1
0
10-
Au
g-1
0
29-
Sep-
10
18-
No
v-1
0
South China to Long Beach
All South China to Long Beach
$0
$1,000
$2,000
$3,000
$4,000
$5,000
$6,000
$7,000
$8,000
25-
Au
g-0
9
14-
Oct
-09
03-D
ec-0
9
22-J
an-1
0
13-
Ma
r-1
0
02-M
ay-1
0
21-J
un-1
0
10-
Au
g-1
0
29-
Sep-
10
18-
No
v-1
0
South China to Long Beach
All South China to Long Beach
45FT
$0
$1,000
$2,000
$3,000
$4,000
$5,000
$6,000
$7,000
$8,000
25-
Au
g-0
9
14-
Oct
-09
03-D
ec-0
9
22-J
an-1
0
13-
Ma
r-1
0
02-M
ay-1
0
21-J
un-1
0
10-
Au
g-1
0
29-
Sep-
10
18-
No
v-1
0
South China to Long Beach
All South China to Long Beach
20FT
45FT
Demonstrating Econometric Modeling Tactical Rate Analysis
$0
$1,000
$2,000
$3,000
$4,000
$5,000
$6,000
$7,000
$8,000
25-
Au
g-0
9
14-
Oct
-09
03-D
ec-0
9
22-J
an-1
0
13-
Ma
r-1
0
02-M
ay-1
0
21-J
un-1
0
10-
Au
g-1
0
29-
Sep-
10
18-
No
v-1
0
South China to Long Beach
All South China to Long Beach
20FT
40FT HC
45FT
Additional Parameters INLAND MOVES
CARRIER vs. NVOCC
SPOT vs. CONTRACT
TIME PERIOD
VOLUME DISCOUNTS
PRODUCT VALUE
PEAK SEASON
ECONOMETRIC OUTPUT 40FT DRY CONTRACT CARRIER 2010Q3 3,033.00$
TEMP CONTROL ($/CONTAINER) 1,127.84$
20 FT ($/CONTAINER) (299.87)$
45 FT ($/CONTAINER) 378.38$
HIGH CUBE ($/CONTAINER) 77.60$
NVOCC ($/CONTAINER) 178.61$
SPOT MARKET ($/CONTAINER) 396.38$
VOLUME DISCOUNT ($/ANNUAL VOL) (0.34)$
2009 Q4 MARKET ADJUSTMENT ($/CONTAINER) (1,250.79)$
2010 Q1 MARKET ADJUSTMENT ($/CONTAINER) (935.79)$
2010 Q2 MARKET ADJUSTMENT ($/CONTAINER) (567.37)$
ORIGIN INLAND ($/MILE, >=250 MI) 0.99$
ORIGIN INLAND ($/CONTAINER, >250 MI) 337.85$
DEST INLAND LONG BEACH - CENTRAL US ($/MI) 0.74$
DEST INLAND LONG BEACH - SOUTH EAST US ($/MI) 0.91$
DEST INLAND LONG BEACH - NORTH EAST US ($/MI) 0.54$
------- ADJUSTMENTS --------
Click to edit Master title style
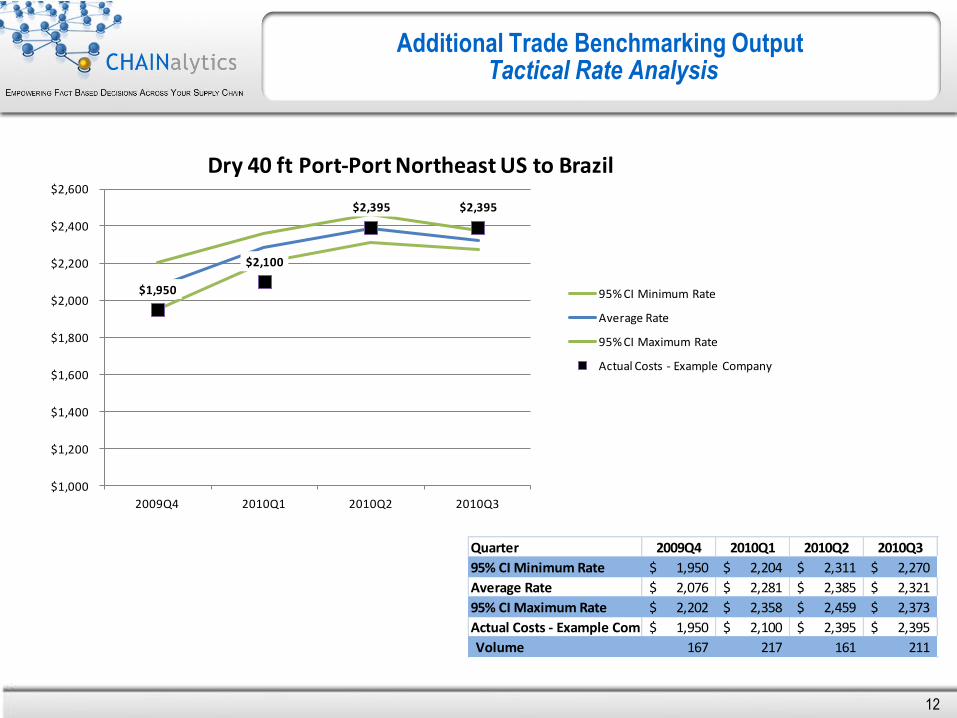
$1,950
$2,100
$2,395 $2,395
$1,000
$1,200
$1,400
$1,600
$1,800
$2,000
$2,200
$2,400
$2,600
2009Q4 2010Q1 2010Q2 2010Q3
Dry 40 ft Port-Port Northeast US to Brazil
95% CI Minimum Rate
Average Rate
95% CI Maximum Rate
Actual Costs - Example Company
Additional Trade Benchmarking Output Tactical Rate Analysis
Quarter 2009Q4 2010Q1 2010Q2 2010Q3
95% CI Minimum Rate 1,950$ 2,204$ 2,311$ 2,270$
Average Rate 2,076$ 2,281$ 2,385$ 2,321$
95% CI Maximum Rate 2,202$ 2,358$ 2,459$ 2,373$
Actual Costs - Example Company 1,950$ 2,100$ 2,395$ 2,395$
Volume 167 217 161 211
12

Click to edit Master title style Deliverables - Benchmark Reports
Tactical Rate Analysis
Total Shipment Volume 1,234 Containers
Reported Shipping Cost 3,245,655$
Percent Excluded (Volume) 10%
Percent Excluded (Spend) 13%
Outliers Not Modeled
SAMPLE REPORT - EXPORT
MBBC OCEAN Model
Model Based Benchmarking ConsortiumModel Run: December 2010
Total Shipment Volume 11,780 Containers
Estimated Market Cost 21,193,538$
Reported Shipping Cost 21,800,326$
Percent Above / Below Market 2.86% ABOVE
Value Above / Below Market 606,788$
Number of Containers Percent
Containers BELOW Market 3,168 26.9%
Containers ABOVE Market 8,612 73.1%
Value Percent
Actual Value BELOW Market 5,443,553 25.0%
Actual Value ABOVE Market 16,356,774 75.0%
Modeled Statistics
13
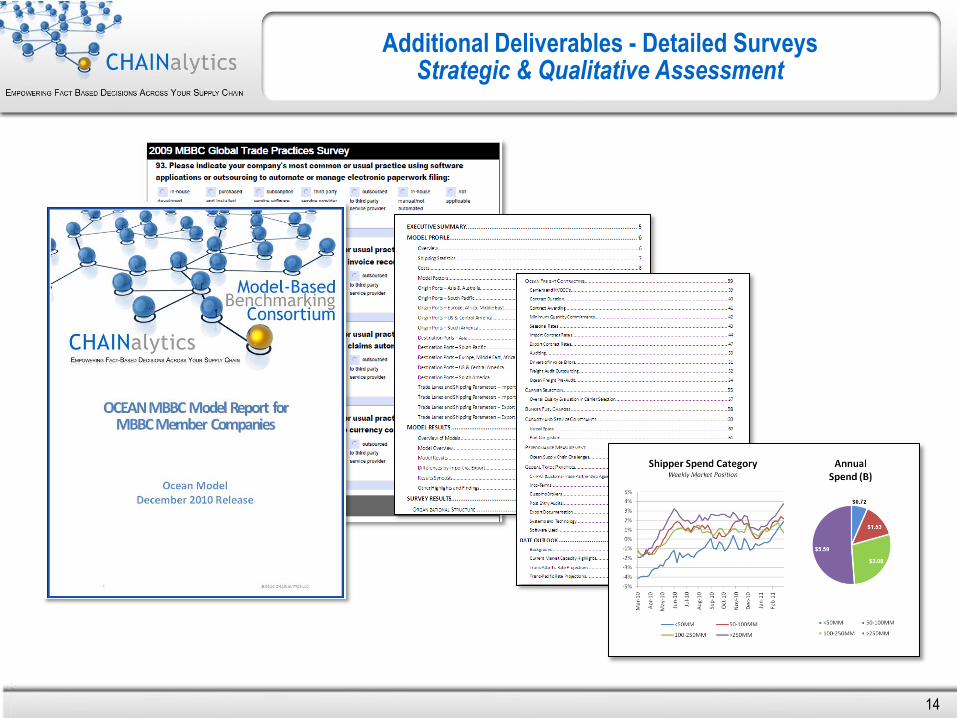
Click to edit Master title style Additional Deliverables - Detailed Surveys
Strategic & Qualitative Assessment
14

World Liner Supply Analytics
Global Schedule Integration
Hayes Howard
October 27, 2011

ComPair is an outgrowth of American Shipper magazine
Global and comprehensive coverage
Both service and voyage based approach to data
Focus on reliability and data integrity
Research driven rather than data driven
Researchers constantly update data and audit each service at least every 5 weeks
Historical tracking of services
Why is ComPair Data Unique?
16

World Line Supply Analytics
Capacity Analytics
Transit Analytics
Global Ocean Carrier Schedules
Integrate data into systems
Deployed on mobile devices
Web query tools
Mobile Applications
ComPair Data Tools
17

Query and Analysis
144 Trade Routes
208 Ocean Carriers
1686 Liner Services
4849 Vessels
807 Ports
Vessel Voyage Schedules
111 Trade Routes
131 Ocean Carriers
8191 Ocean Carrier Services
6180 Vessels
599 Ports
Global Data Scope
18

• Service rotation segmented by trade route
• Showing carriers offering space on each segment
• Vessels operating on service
• Vessel capacity: DWT, TEU, Reefer Plugs
• Draft, speed, owner, operator, flag, vessel deployment area
• Full service rotation detail
• Allocation estimates by trade route
• Vessel/Voyage schedule detail
Service Data Scope
19

Web query tools
Query multiple origins and destinations to see all service options at once
Compare transit times and days of departure and arrival
See which carriers share space on each service
Full rotation detail and vessel deployments
Complete port and terminal detail
Search services by port, port pair, carrier, alliance or vessel
ComPair Data Web Query Tools
www.ComPairData.com
20
World Liner Supply Capacity Analytics
Analyze ocean carrier service networks, capacities and vessel deployment strategies over time
10 analytical breakdowns including
Deployed capacity by trade route
Detail breakdown by service, alliance and carrier group
Complete vessel deployment detail back to January 2008
Market share by alliance and vessel operator
Capacity management analysis with estimated capacity allocation
WLSA Capacity Analytics
21

World Line Supply Transit Analytics
Port to port transit analysis by carrier
Country to country transit analysis by carrier
Rotation detail by service in port to port query
Sort of service by transit times with average weekly deployed capacity
Quarterly historical transit data to July 2007
WLSA Transit Analytics
22

Integrated Ocean Carrier Schedules
Daily data feed of vessel/voyage detail for all liner services by 131 carriers operating on 111 trade routes
Comprehensive coverage of all containerized services on each trade route
Ability to deploy competitive schedule data to sales people on mobile devices.
Ability for shippers to integrate schedule data with allocation and service contract detail to improve control and decision making over shipment routing
Integrated Ocean Schedules
23

24
Integrated Ocean Schedules Sample Deployment
24

Access to competitive service information and analysis improves rate negotiation position
Improved trade management
Immediate access to accurate capacity and deployment intelligence on a global basis
Ability to track carrier service network, deployment and capacity management strategies.
Improve profitability by exercising greater control of shipment routing
Return on Investment
25

APL said it moved 229,300 FEUs (40-foot equivalent units) in the four-week period ending Sept. 23. 5 percent more than in the same 2010 period but average revenue per FEU was $2,501 for the four-week period, 19 percent less than in the same period last year.
Drewry Shipping Consultants says "an excess of capacity on key routes, as well as poor discipline from carriers means that container shipping lines will not cover their cost of capital in 2011 and many will lose money once again.“
Erxin Yao, president of OOCL (USA), urged the shipping industry to pay more attention to pricing services profitably and fostering innovation rather than trying to hold onto market share.
26
A few words on Volatility….
Robert Kusiciel, vice president of inbound transportation for Wal-Mart said the container shipping industry should adopt his company's consistent low-price concept in order to reduce price and demand volatility.
Zhang Ye, president of the Shanghai Shipping Exchange, said his institution is seeking permission from Chinese authorities to open up its electronic platform for trading container freight rate derivatives to shippers and carriers around the world.
The U.S. Federal Maritime Commission has published a proposed rulemaking to amend its rules to provide common carriers and their customers with certainty and flexibility if they decide to use long-term contracts that adjust based on a freight rate index that reflects changes in market conditions.
27
A few words on Volatility….

Stacey Kapushy
Manager of Import/Export
Compliance & International Freight
October 27, 2011

Business Overview – Armstrong World Industries, Inc
Leading manufacturer of floors and ceilings for use in renovation and new
construction
• $2.8 billion in sales in 2010
• Based in Lancaster, PA
• Serving global customers from eight countries
• 33 manufacturing locations, 21 in the US
• Approximately 9,500 employees
• Product portfolio includes: acoustical ceiling systems, resilient flooring,
engineered & solid wood flooring, ceiling suspension & grid systems
29

Organizational Alignment
Stacey Kapushy
Manager of Import/Export Compliance &
International Freight
Responsibilities:
• International carrier negotiation
• Metrics and reporting
• Compliance with government agency
requirements
• Audit: freight cost and compliance
• Government program participation: ISA,
C-TPAT, PM Statement
• Utilization of FTZ
30
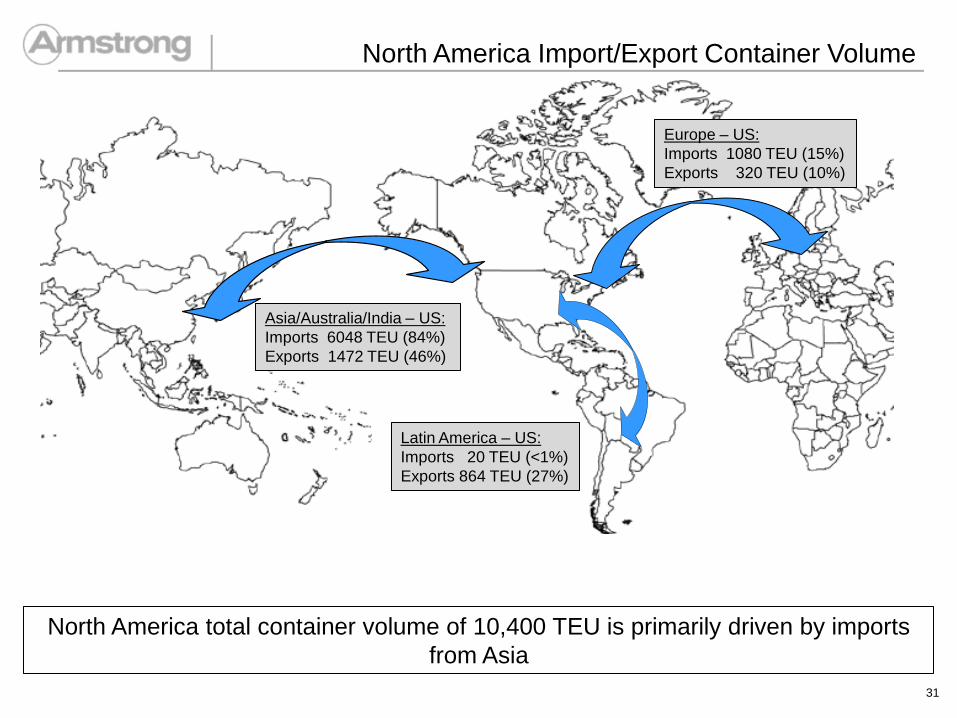
Asia/Australia/India – US:
Imports 6048 TEU (84%)
Exports 1472 TEU (46%)
Europe – US:
Imports 1080 TEU (15%)
Exports 320 TEU (10%)
Latin America – US:
Imports 20 TEU (<1%)
Exports 864 TEU (27%)
North America total container volume of 10,400 TEU is primarily driven by imports
from Asia
North America Import/Export Container Volume
31
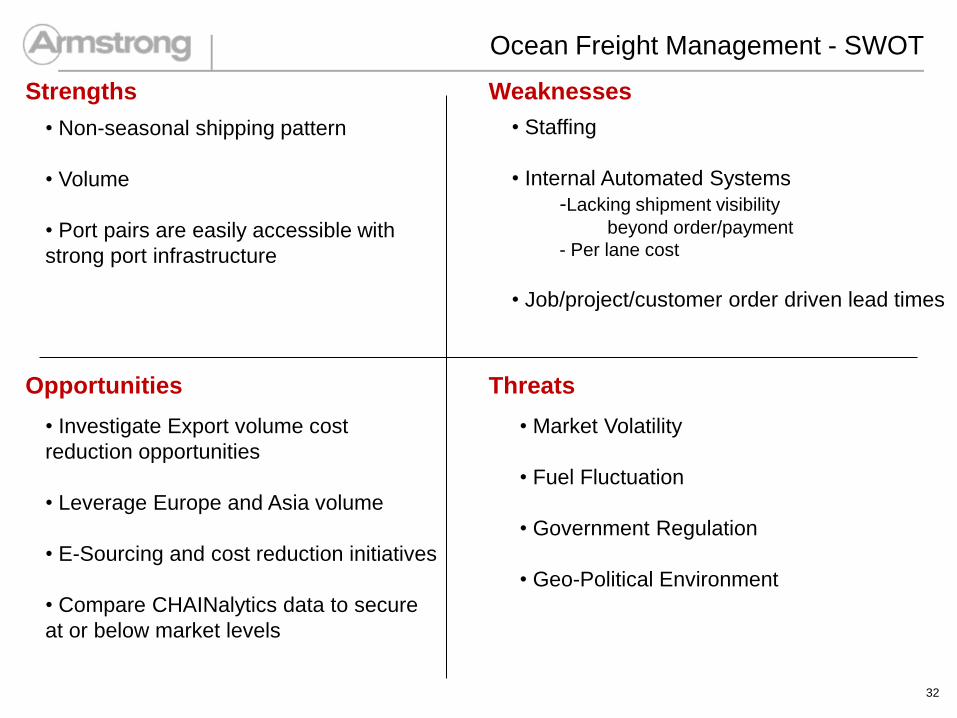
Ocean Freight Management - SWOT
Strengths Weaknesses
Opportunities Threats
• Non-seasonal shipping pattern
• Volume
• Port pairs are easily accessible with
strong port infrastructure
• Investigate Export volume cost
reduction opportunities
• Leverage Europe and Asia volume
• E-Sourcing and cost reduction initiatives
• Compare CHAINalytics data to secure
at or below market levels
• Staffing
• Internal Automated Systems
-Lacking shipment visibility
beyond order/payment
- Per lane cost
• Job/project/customer order driven lead times
• Market Volatility
• Fuel Fluctuation
• Government Regulation
• Geo-Political Environment
32
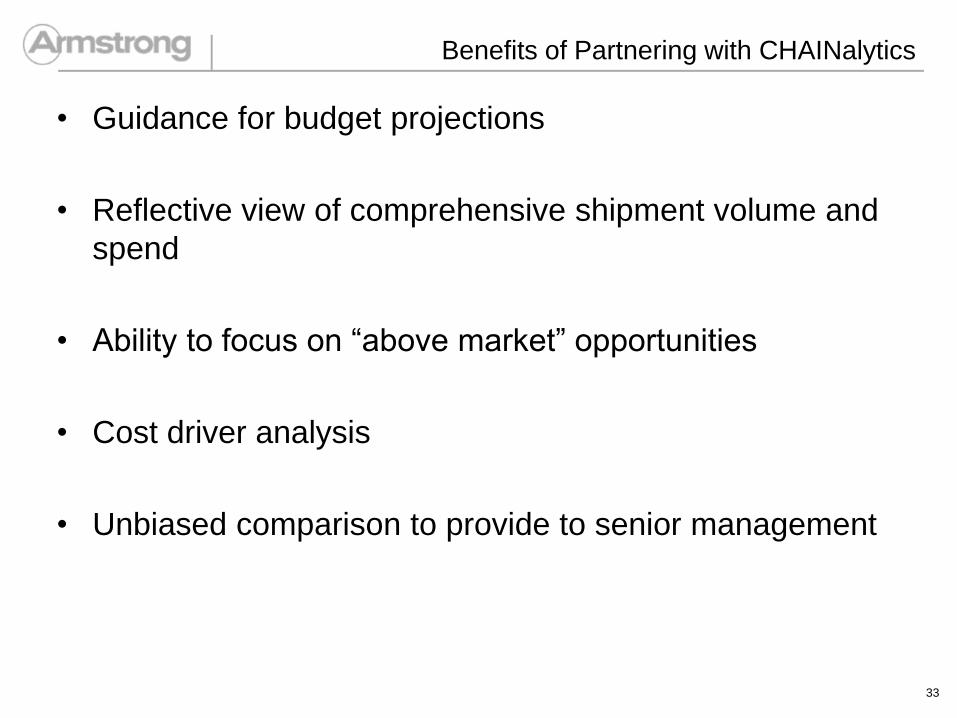
Benefits of Partnering with CHAINalytics
• Guidance for budget projections
• Reflective view of comprehensive shipment volume and
spend
• Ability to focus on “above market” opportunities
• Cost driver analysis
• Unbiased comparison to provide to senior management
33

Click to edit Master title style Thank you for attending!
John B. Schnorf Director, Business Development
Chainalytics LLC
2500 Cumberland Parkway, Suite 550
Atlanta, GA 30339
Office: 678-384-3577
CHAINalytics
Hayes H Howard CEO
American Shipper/ComPair Data
200 West Forsyth Street, Suite 1000
Jacksonville, FL 32202
Direct: (904) 355-8217
Q&A Session


![Catalog 410: Travels, Vacations, & Destinations · 2020-05-19 · 13. [Ocean Vacations] 1950s Ocean Liner United States Lines Stationery & Envelopes & Postcards. The United States](https://img.dokumen.tips/doc/110x75/5f0fdd987e708231d44645b2/catalog-410-travels-vacations-2020-05-19-13-ocean-vacations-1950s.jpg)