Embed Size (px)
Citation preview
MEASURING PRODUCTIVITY IN HEALTHCARE:
AN ANALYSIS OF THE LITERATURE Louise Sheiner and Anna Malinovskaya
Hutchins Center on Fiscal and Monetary Policy at Brookings
INTRODUCTION
Measured productivity growth in the health care industry has generally been well below that of the economy as a whole. Many analysts attribute this low productivity growth to measurement problems. They argue that most of the productivity growth in health care has come in the form of improved quality rather than lower cost. Furthermore, they argue that many of the innovations that have reduced costs and increased productivity—such as moving from inpatient to outpatient care—are not captured in the standard measures. Others, however, believe that even when properly measured, productivity growth in the health sector is low because it is a service sector that has limited scope for efficiency improvements (Baumol’s “cost disease” argument). The Affordable Care Act (ACA) has renewed attention on health care productivity because of changes it made to Medicare. In particular, under the ACA, the legislated payment updates for hospitals and other non-physician providers are determined by the difference between the growth in input costs (wages, rents, etc.) and the ten-year average increase in economy-wide multifactor productivity (MFP). If MFP in health care equals that of the economy as a whole, then this formula will update payments so as to cover the increased cost necessary to provide the same services over time. If, however, MFP in the health care sector is below that of the economy as a whole, then the payment updates will be insufficient to cover costs and providers will suffer increasing financial losses over time when treating Medicare patients, possibly limiting Medicare patients’ access to quality health care.
The authors thank Anne Hall, Ralph Bradley, Glenn Follette, David Wessel and especially Abe Dunn and Marshall Reinsdorf for extremely helpful conversations. All errors are, of course, their own.
May 2016at BROOKINGS
2MEASURING PRODUCTIVITY IN HEALTHCARE: AN ANALYSIS OF THE LITERATURE
I. TRADITIONAL MEASURES OF PRODUCTIVITY IN HEALTHCARE
There are several distinct productivity concepts. Labor productivity growth measures the increase in output per worker over time. Labor productivity can improve because of more educated workers, technological improvements or increased investment in other inputs—like capital (for example, a new computer). Multifactor productivity growth measures the increase in output over time that is achievable with the same set of inputs—same amount of labor, capital, energy, etc. Increases in MFP represent improvements in technology—with the same set of inputs, the economy figures out how to produce more. MFP is defined as a residual: it is the increase in output that cannot be explained by changes in inputs. MFP = Growth rate of real output – growth rate of inputs*input shares
The traditional approach to measuring health care productivity typically defines output as spending on health goods and services—e.g., drugs, hospital services, physicians’ services— deflated by an appropriate price index to get a measure of real output over time. Table 1 summarizes the results from studies of health care productivity using this traditional approach. On average, MFP growth in health care has been found to be smaller than economy-wide MFP or even negative. Using expenditure data and deflators from the Bureau of Economic Analysis, Triplett and Bosworth (2004) found negative productivity growth in U.S. medical care in 1987-2001, at a rate of about 1 percent per year, about the same rate of MFP growth found by Harper et al (2010) for 1987-2006. Cylus and Dickensheets (2007) measured productivity growth for hospitals; they used net revenue for hospitals deflated by the producer price index for hospitals as their measure of output. They found that the 10-year moving average of growth in hospital MFP for the 10-year period ending in 2005 was 0.3 to 0.6 percent, depending on the method used to measure hospital inputs. Over each of the 10-year periods ending in 1990-2005, the estimated average hospital MFP was less than one-half of average economy-wide MFP. Spitalnic et al. (2016) updated Cylus and Dickensheets’ study by extending the period of study to 2013. Their results were quite similar. They calculated that, over the period 1990-2013, the average growth rate of hospital MFP was between 0.1 percent and 0.6 percent, compared to the average growth of private non-farm business MFP of 1 percent.
Fisher (2007) estimated MFP of physicians’ offices and found wide variation over time: MFP rose at an average rate of 1.5 percent per year from 1982 to 1992, fell -0.6 percent per year on average from 1993 to 2000, and increased 1.7 percent per year from 2001 to 2004. Over the period as a whole, physician MFP was about the same as economy-wide MFP. Other measures of MFP have focused on measuring labor productivity instead of MFP. Chansky et al (2015), for example, find that labor productivity growth in hospitals averaged just ½ percent per year between 1993 and 2012, well below the 2¼ percent overall labor productivity in the United States over this time period. Studies of health care productivity in Canada, for example by Sharpe et al (2007), have also found very weak productivity growth.

3
Tab
le 1
: Ser
vice
-bas
ed P
rodu
ctiv
ity M
easu
res w
ithou
t Qua
lity
Adj
ustm
ent
Se
rvic
e M
easu
re
Tim
e pe
riod
A
nnua
l Pro
duct
ivity
/Pri
ce
Gro
wth
U
nite
d St
ates
Trip
lett
and
Bos
wor
th (2
004)
A
ll M
FP
1987
-199
5 -1
.5%
19
95-2
001
-0.4
%
Cyl
us a
nd D
icke
nshe
ets (
2007
) H
ospi
tals
M
FP
2001
-200
5 0.
1 to
1.0
%.
Spita
lnic
, Hef
fler,
Dic
kens
heet
s, an
d K
nigh
t (20
16)
Hos
pita
ls
MFP
19
90-2
013
0.1%
to 0
.6%
.
Har
per,
Kha
ndrik
a, K
inos
hita
, and
R
osen
thal
(201
0)
All
MFP
19
87-2
006
-.7%
: A
mbu
lato
ry C
are
-.9
% :
Hos
pita
ls a
nd N
ursi
ng
Hom
es
Cha
nsky
, Gar
ner,
and
Rai
chou
dhar
y (2
015)
H
ospi
tals
La
bor P
rodu
ctiv
ity
1993
-201
2 0.
5%
Fish
er (2
007)
Ph
ysic
ian
Off
ices
M
FP
1983
-199
2 1
.5%
. 19
93-2
000
-0.6
%.
2001
-200
4 1
.7%
. In
tern
atio
nal
Shar
pe, B
radl
ey, a
nd M
essi
nger
(200
7)
All
- Can
ada
Labo
r Pro
duct
ivity
19
87-2
006
-0.6
9%
All
excl
udin
g H
ospi
tals
- C
anad
a M
FP
1994
-200
3 -2
.9%
to -3
.8%
Gu
and
Li (2
015)
N
ursi
ng H
omes
- C
anad
aLa
bor P
rodu
ctiv
ity
1984
-200
9 0.
2%
Ngh
iem
, Coe
lli, a
nd B
arbe
r (20
11)
Hos
pita
ls -
Aus
tralia
M
FP
1997
-200
4 1.
60%
SHEINER & MALINOVSKAYA

4
In sum, multiple studies that measure productivity growth at the service level using standard price deflators have found weak or negative productivity growth in health care, with the Fisher’s study on physicians being a notable exception.
II. PROBLEMS WITH TRADITIONAL MEASURES OF PRODUCTIVITY GROWTH
Traditional measures of productivity growth define health care output as the nominal expenditures on health care by service providers (hospitals, physicians, etc.) deflated by a price index for health care. In theory, this should yield a measure of units of output over time. However, if the price of health care is mismeasured, then so too will be the output and productivity measures. Thus, any problems with measuring prices of health care mean problems for measuring productivity.
Two main problems have been identified in the measurement of the price of health care, both discussed in detail below. One is in identifying the appropriate good. In the traditional approach, the good is the health care service or good actually purchased: a doctor’s appointment, a hospital stay, a prescription. But, as noted by Triplett (2011), these purchases are better viewed as intermediate inputs into the production of what the consumer truly wants – better health. By viewing services in different categories as different goods, rather than as inputs in the production of one good, cost savings arising from substitution of one input for another are not taken into account.
The second problem in constructing price indexes for medical care is that the nature of the good is changing. In particular, medical care outcomes have tended to improve over time. Measures of prices that don’t capture these increases in quality will overstate price growth in health care and understate productivity growth.1
III. DISEASED-BASED APPROACHES TO MEASURING HEALTH CARE QUANTITIES AND PRICES
There has been a large push toward redefining the health sector’s output as disease treatments, rather than as medical goods and services. This was the approach advocated by the National Academies Committee on National Statistics (Schultze and Mackie (2002)). As a result, the Bureau of Economic Analysis has introduced Health Satellite Accounts that account for health spending on a disease basis and the BLS has introduced experimental disease-based price indexes (Dunn et al(2015b); Bradley et al (2015); OECD (2001); Schreyer and Mas (2013); Schreyer (2010)).2
1 One interesting question is which industry’s productivity growth is being understated. For example, if a new cancer drug is invented that improves outcomes, then the productivity growth is in the pharmaceutical industry, not the hospital that administers the drug. For hospital productivity, both outputs (health) and inputs (quality-adjusted drugs) would be underestimated, though hospital MFP would not be. But, as discussed below, for the purposes of the sustainability of the ACA cuts, this distinction is unimportant.2 BEA provides annual price indexes for 15 broad disease categories for 2000-2010/2012, whereas BLS provides monthly price indexes for 19 disease categories for 1999-2015.
MEASURING PRODUCTIVITY IN HEALTHCARE: AN ANALYSIS OF THE LITERATURE

5
Box 1 summarizes the various methods that have been used to implement diseased-based approaches.
Moving to a disease-based index (often referred to as Medical Care Expenditure index, or MCE index) does not affect nominal expenditures on health care, but it can affect how prices are measured. Under the disease-based approach, the medical service being purchased is a treatment for a particular disease. Thus, spending increases over time either because disease prevalence increases—that is, the quantity of treatment increases (for example, rates of diabetes are increasing)–or because the average cost to treat someone with diabetes is increasing. The latter measure is viewed as the “price” of a diabetes treatment.
Disease-based price indexes can evolve quite differently from traditional service-based price indexes (SPIs) that measure the price of a fixed basket of medical services. One advantage of the disease-based approach is that it captures shifts between providers. For example, improvements in technology mean that numerous treatments that used to require a hospital stay can now be provided at a lower cost in an outpatient setting. The traditional approach to measuring health care prices, which uses the change in prices for a fixed bundle of medical services—such as an hour of physician’s time or a hospital stay—would miss the effects of this shift in treatment methods on the price of health care. But, in theory, a treatment-based approach aggregates all spending for a particular disease—regardless of where or by whom it is provided—and hence would count the substitution of lower-cost outpatient care of higher-cost inpatient care as a price reduction.3
On the other hand, increases in the intensity of services used to treat diseases—for example, more doctor visits per episode—would increase the average cost of treating a disease and would show up as a price increase in the treatment-based approach. But it would show up as an increase in the quantity of health care services—not the price—in a service-based approach.
Table 2 summarizes the studies that have been done using the disease-based approach. The last column of Table 2 compares the disease-based price indexes with more traditional service price indexes (SPIs). Dunn et al (2015b) compare disease-based price indexes with the official price indexes for medical care used in the National Income and Product Accounts (NIPA), which are themselves based on the Bureau of Labor Statistics Producer Price Indexes. They find that price increases using the disease-based approach are, on average, higher than the official price indexes for medical care over the 2000-2010 period. Similarly, Aizcorbe and Highfill (2015) found that, from
3 One problem with using a disease-based approach is that not all spending can be allocated to diseases. One cannot attribute spending on preventative health services, for example, to a disease. In addition, the information required to attribute spending to a disease is often not available. For example, prescription drug data don’t include any codes for diagnoses. Dunn et al (2015b) were able to allocate about 80 percent of health spending into disease categories, and an additional 6 percent into a category called preventative medicine.
SHEINER & MALINOVSKAYA

6MEASURING PRODUCTIVITY IN HEALTHCARE: AN ANALYSIS OF THE LITERATURE
Tab
le 2
: Dis
ease
-bas
ed e
xpen
ditu
re in
dex
stud
ies
Sour
ce
Tim
e pe
riod
D
ata
sour
ce
Exc
ess o
f ser
vice
pri
ce in
dex
over
di
seas
e-ba
sed
pric
e
(ave
rage
ann
ual g
row
th r
ate)
Dun
n, R
ittm
uelle
r, an
d W
hitm
ire (2
015)
20
01-2
010
Med
ical
Exp
endi
ture
s Pan
el S
urve
y an
d C
omm
erci
al C
laim
s dat
a -0
.9%
- 1.
3% (E
xces
s of P
CE
Hea
lth D
efla
tor
over
dis
ease
-bas
ed p
rice)
B
radl
ey, H
unja
n, a
nd R
ozen
tal (
2015
) 19
99-2
014
Med
ical
Exp
endi
ture
s Pan
el S
urve
y 0.
5%
Dun
n, L
iebm
an, a
nd S
hapi
ro (2
015)
20
03-2
007
Com
mer
cial
cla
ims d
ata
from
M
arke
tSca
n R
esea
rch
Dat
abas
e (T
ruve
n H
ealth
) 0.
4%
Aiz
corb
e an
d H
ighf
ill (2
015)
19
80-8
7 19
87-9
6 19
96-2
006
Nat
iona
l Med
ical
Car
e U
tiliz
atio
n an
d Ex
pend
iture
Sur
vey,
Nat
iona
l Med
ical
Ex
pend
iture
Sur
vey,
Med
ical
Ex
pend
iture
Pan
el S
urve
ys
– 0.
3%
3.5%
–
2.6%
Dun
n, L
iebm
an, R
ittm
uelle
r, an
d Sh
apiro
(2
014)
20
03-2
007
Com
mer
cial
cla
ims d
ata
from
M
arke
tSca
n R
esea
rch
Dat
abas
e (T
ruve
n H
ealth
) N
ot re
porte
d
Hal
l (20
14)
2001
-200
9 M
edic
are
Cur
rent
Ben
efic
iary
Sur
vey
Not
repo
rted
Hal
l and
Hig
hfill
(201
3a)
2001
-200
5 M
edic
are
Cur
rent
Ben
efic
iary
Sur
vey
0.1%
to –
0.4
%
Hal
l and
Hig
hfill
(201
3b)
2001
‐200
9 M
edic
are
Cur
rent
Ben
efic
iary
Sur
vey
and
the
Med
ical
Exp
endi
ture
Pan
el
Surv
ey
Not
repo
rted
Bra
dley
(201
3)
2004
-201
0 M
edic
al E
xpen
ditu
res P
anel
Sur
vey
and
BLS
CPI
pro
duct
ion
data
1.
1% to
1.2
%
Dun
n, L
iebm
an, P
ack
and
Shap
iro (2
013)
20
03-2
007
Mar
ketS
can
Com
mer
cial
Cla
ims a
nd
Enco
unte
rs D
atab
ase
0.
7%
Aiz
corb
e an
d N
esto
riak
(201
1)
2003
-200
5 C
laim
s fro
m th
e Ph
arm
etric
s, In
c.
2.4%
Song
, Mar
der,
Hou
chen
s, C
onkl
in, a
nd
Bra
dley
(200
9)
1999
-200
2
Mar
ketS
can
Com
mer
cial
Cla
ims a
nd
Enco
unte
rs D
atab
ase
and
the
Med
icar
e Su
pple
men
tal a
nd
Coo
rdin
atio
n of
Ben
efits
Dat
abas
e
5.8%
to 1
2.7%
Aiz
corb
e an
d N
esto
riak
(200
8)
2003
-200
5 C
laim
s fro
m th
e Ph
arm
etric
s, In
c.
1.7%
Shap
iro, S
hapi
ro, a
nd W
ilcox
(200
1)
1969
-199
4 C
onsu
mer
Pric
e In
dex
for C
atar
act
Surg
ery
5.1
%

7SHEINER & MALINOVSKAYA
1996-2006, using the Medical Expenditure Panel Survey and other sources, the disease-based price indexes rose 5.3 percent per year, much faster than the 2.7 percent rise in the official NIPA price index.
On the other hand, Bradley (2013) finds that, for the period 2004 to 2010, health care inflation using a disease-based approach averaged about 1 percent below the official measures of health care inflation published by the Bureau of Labor Statistics.A number of earlier studies had also concluded that disease-based price indexes generally show lower medical inflation than service-based prices, including Song et al (2009), Aizcorbe and Nestoriak (2011), and Dunn et al (2013). Dunn et al (2015a) attribute this discrepancy to differences in the way the traditional service-price indexes are defined: The official price indexes tend to price a fixed basket of procedures (e.g., an X-ray or an MRI) whereas the service-based price indexes used in much of the literature price encounters (a physician visit, a hospital stay). Increases in the intensity of medical services that raise the cost of encounters are called price increases in the encounter-based approach used by researchers but not in the procedure-based approach used in the official price statistics.
Whether an increase in intensity of service used should be viewed as part of the price or not depends on whether that increased use was valuable. If the increase in intensity represents better medical care, then it should clearly be viewed as an increase in quality, not price. Advocates of disease-based prices recognize that calling all such increases in spending as price inflation isn’t accurate. They note, however, that because the quality of health care can only be measured on a treatment-by-treatment basis, a treatment-based approach is a necessary first step in deriving quality-adjusted health care price index.
IV. ADJUSTING HEALTH CARE FOR CHANGES IN QUALITY
The second major problem with measuring the price of health care is that health care is a rapidly evolving industry with changes in treatments and quality over time. Increases in spending over time that are associated with improved outcomes should not be viewed as increases in prices, but as changes in the nature of the good. There are two elements involved in adjusting for quality. First, one needs to be able to define quality and measure it. Second, one needs to decide how to incorporate that measurement into the price index or, equivalently, into the measure of real output.4
IV.A. Measuring Health Care Quality Hall (2015) reviews the various methods currently used to measure the quality of health care. One approach is to track outcomes. Researchers who have measured quality through outcomes
4 Because real output is defined as nominal output over the price, an adjustment to real output, given nominal output, also implies an adjustment to the price, and vice versa.

8MEASURING PRODUCTIVITY IN HEALTHCARE: AN ANALYSIS OF THE LITERATURE
have defined quality improvements by changes in life expectancy (Cutler et al (1998, 2001, 2006), Howard et al (2010), Rosen, et al (2007), Romley et al (2015)); and in disability-adjusted life years (Highfill and Bernstein (2014)).
Others have used less direct measures to measure quality. For example, Lakdawalla et al (2015) rely on the medical literature to assess changes in expected life expectancy arising from new therapies for colorectal cancer and multiple myeloma. Berndt et al (2002) use expert opinions on the likelihood of remission as the measure of quality when assessing treatments for depression. Eggleston et al (2011) use the change in modifiable cardiovascular risk for diabetes as the quality metric, a measure that examines modifiable patient conditions, like glycated hemoglobin levels, that are associated with risks of cardiac events.
Another approach is to focus on inputs, without any direct measure of actual or even expected outcomes. This is the approach currently used by the BLS in their quality adjustment for hospital producer price indexes for treatment of heart attack, heart failure, pneumonia, and surgery (Hospital Quality Valuation Team (2008)). Their quality adjustment defines quality by hospital performance on metrics included in the Centers for Medicare and Medicaid Services (CMS) Hospital Compare database. These metrics are, in general, based on hospital inputs, not outcomes.5 For example, the metrics for heart failure include whether patients were given ACE inhibitors when indicated and whether they were given discharge instructions and smoking cessation advice. Similarly, the BLS adjusts prices of nursing home services by the level of nurse staffing (BLS, Quality Adjustment (2014)).
As Hall (2015) notes, improved measurement of outcomes will be necessary if health expenditures are ever to be fully quality adjusted; many health care issues are not life-threatening and therefore focusing on mortality reductions will leave most quality improvements unmeasured. Similarly, focusing on adherence to guidelines or best practices, such as whether patients are given discharge instructions, might capture some aspects of quality but may end up disregarding the most valuable improvements. Even if adhering to guidelines would improve important outcomes like mortality and disability, it is likely that much of the improvement in treatment would have been disseminated before becoming part of official guidelines, as these tend to lag best practices (Porter and Teisberg, (2004)).
IV.B. Incorporating Quality Changes Into Price Indexes and Measures of Productivity
The second issue is how changes in quality, once they have been agreed upon and measured, should be incorporated into price indexes. Table 3 provides a summary of the literature that has attempted to quality-adjust measures of health care prices and output. Three major approaches have been used. As we discuss below, these three measures can yield very different results, even
5 However, recently CMS has added a number of outcomes based measures, including complication rates for hip and knee replacements, and 30-day death and readmission rates following surgery.

9SHEINER & MALINOVSKAYA
though, under certain conditions, they are identical.
• The Cost-of-Living Approach: Cutler et al (1998, 2001) calculate a “cost of living index” (COLI) for heart attack treatment that adjusts the overall price level for the value of the improved life expectancy arising out of improved treatments. This method has also been used by Eggleston et al (2011) and Eggleston et al (2009) for diabetes treatment, Ladkawalla et al (2015) for multiple myeloma and colorectal cancer, and by Constant et al (2006) for cancer treatment in Canada.
• The “Redefine the Good” Approach: Romley et al (2015) adjust for quality by redefining the health care good. Rather than using the number of interventions as a measure of the quantity of health care, they measure the number of successful interventions. As health quality improves, more interventions are successful (by saving more lives or diminishing symptoms, for example) and so real quantities increase more rapidly than nominal spending using standard price deflators.
• The Cost of Quality Improvement Approach: BLS adjusts the hospital producer price index for changes in quality by subtracting an estimate of the cost of the quality improvement from its price (Hospital Valuation Team (2008)). This approach is often used in comparing goods that change over time—for example, if a table top changes from pine to oak, the price is adjusted down to reflect the higher cost of oak (BLS, Quality Adjustment (2014))—but it is the only case that we know of where it has been used for health care.
The Cost-of-Living Approach
As noted by Bradley et al (2015), the ideal Cost of Living Index measures the relative cost of obtaining the same level of utility at different points in time. Under this definition of a COLI, improvements in health care that increase life expectancy or reduce disability should be valued at their monetary worth. Typically, this is measured by the changes in income required to buy the same good as in the previous period (for a Laspeyres price index) at the new prices. But when the quality of the good changes this is no longer appropriate.
Instead, Cutler et al (1998, 2001) calculate a price index by using a direct measure of the amount of income one could take away in period t to have the same utility as in period t-1. Define NBt as the net benefit that one receives from the increase in health spending between time t-1 and t. It is equal to the value of the additional health received less the cost. Then, assuming that all other prices stay fixed, the percentage change in the COLI between time t-1 and t, ∆𝐶𝐶𝐶𝐶𝐶𝐶𝐶𝐶 , is simply:
∆𝐶𝐶𝐶𝐶𝐶𝐶𝐶𝐶 = −𝑁𝑁𝑁𝑁𝑡𝑡
𝑌𝑌𝑡𝑡
As a simple example, assume that in period 1 income is $100 and health spending is $10. Then in period 2, health spending increases to $15 but the value to the person of that additional $5 in health

10MEASURING PRODUCTIVITY IN HEALTHCARE: AN ANALYSIS OF THE LITERATURE
Tab
le 3
: Rel
evan
t stu
dies
that
impl
emen
ted
a qu
ality
adj
ustm
ent
A
utho
rs
Serv
ice
type
T
ime
peri
od
Dis
ease
/ co
nditi
on
Qua
lity
mea
sure
Q
ualit
y ad
just
men
t ap
proa
ch
Find
ings
Uni
ted
Stat
es
How
ard,
Bac
h, B
ernd
t, an
d C
onti
(201
5)
drug
s 19
95-2
013
Can
cer
Incr
ease
d lif
e ex
pect
ancy
R
edef
ine
the
Goo
d La
unch
pric
es p
er y
ear o
f life
exp
ecta
ncy
incr
ease
d by
10%
per
yea
r.
Rom
ley,
Gol
dman
, and
Soo
d (2
015)
ho
spita
ls
2002
-201
1 H
eart
atta
ck, h
eart
failu
re,
and
pneu
mon
ia
Succ
essf
ul in
terv
entio
ns
Red
efin
ing
the
Goo
d Th
e ra
tes o
f ann
ual p
rodu
ctiv
ity g
row
th w
ere
0.78
per
cent
for h
eart
atta
ck, 0
.62
perc
ent f
or
hear
t fai
lure
, and
1.9
0 pe
rcen
t for
pne
umon
ia
Lakd
awal
la, S
hafri
n, L
ucar
elli,
N
icho
lson
, et a
l. (2
015)
dr
ugs
1998
-200
9 C
olor
ecta
l can
cer a
nd
mul
tiple
mye
lom
a Li
fe e
xpec
tanc
y
CO
LI
For C
olor
ecta
l can
cer,
cost
s inc
reas
ed b
y $3
4,49
3 (2
014
pric
es),
but q
ualit
y ad
just
ed c
osts
incr
ease
d on
ly b
y $1
,377
. For
mul
tiple
m
yelo
ma,
cos
ts of
car
e in
crea
sed
by $
72,9
37,
but q
ualit
y ad
just
ed c
osts
fell
by $
67,8
63.
Hig
hfill
and
Ber
nste
in (2
014)
m
ixed
19
87-2
010
Thirt
y ch
roni
c co
nditi
ons
DA
LYs g
aine
d C
OLI
Th
e ne
t val
ue w
as p
ositi
ve fo
r tw
elve
of t
he 3
0 di
seas
es.
Dun
n (2
012)
dr
ugs
1996
-200
5 C
ondi
tions
for w
hich
ant
i-ch
oles
tero
l dru
gs a
re u
sed
Cha
nges
in th
e co
mpe
nsat
ing
varia
tion
deriv
ed fr
om th
e es
timat
ed d
eman
d m
odel
C
OLI
Th
e av
erag
e pr
ice
does
not
cha
nge
but t
he
cons
tant
-qua
lity
pric
e in
dex
drop
s by
27
perc
ent.
Eggl
esto
n, S
hah,
Sm
ith,
Ber
ndt,
and
New
hous
e (2
011)
m
ixed
19
99-2
009
Dia
bete
s Li
fe e
xpec
tanc
y C
OLI
Q
ualit
y ad
just
ed p
rices
unc
hang
ed.
Eggl
esto
n, S
hah,
Sm
ith, e
t al.
(200
9)
mix
ed
1997
-200
5 D
iabe
tes
Life
exp
ecta
ncy
CO
LI
The
net v
alue
was
$10
,911
per
pat
ient
.
Luca
relli
and
Nic
holso
n (2
009)
dr
ugs
1993
-200
5 C
olor
ecta
l can
cer
Life
exp
ecta
ncy
and
QA
LYs
CO
LI
Pric
e in
dex
flat.
Hos
pita
l Qua
lity
Val
uatio
n Te
am (2
008)
ho
spita
ls
H
eart
atta
ck, h
eart
failu
re,
pneu
mon
ia, s
urge
ry
Com
posi
te q
ualit
y ut
iliza
tion
scor
es fo
r hos
pita
ls a
t the
DR
G
leve
l
Cos
t of Q
ualit
y Im
prov
emen
t Li
ttle
effe
ct o
n pr
ices
.
Fran
k, B
ernd
t, B
usch
, and
Le
hman
(200
4)
mix
ed
1994
-200
0 Sc
hizo
phre
nia
Indi
cato
rs fo
r var
ious
trea
tmen
t re
gim
ens
Cos
t of Q
ualit
y Im
prov
emen
t C
osts
incr
ease
d 0.
5% p
er y
ear b
ut q
ualit
y-ad
juste
d co
sts f
ell 5
.5%
per
yea
r. B
ernd
t, B
ir, B
usch
, Fr
ank,
and
Nor
man
de (2
002)
m
ixed
19
91–1
996
Dep
ress
ion
Prob
abili
ty o
f rem
issi
on
Red
efin
e th
e G
ood
Pric
e in
dex
fell
1.66
% to
2.1
3% p
er y
ear.
Cut
ler,
McC
lella
n, N
ewho
use,
an
d R
emle
r (20
01)
hosp
itals
19
83/4
- 19
94
Hea
rt at
tack
Li
fe e
xpec
tanc
y C
OLI
Q
ualit
y-ad
juste
d pr
ices
dec
lined
1.5
%-1
.7%
per
ye
ar.b
Bus
ch, B
ernd
t, an
d Fr
ank
(200
1)
mix
ed
1991
-199
6 M
enta
l hea
lth c
ondi
tions
Tr
eatm
ent r
egim
ens r
anke
d fo
r th
eir e
ffect
iven
ess
Red
efin
e th
e G
ood
The
qual
ity-a
djus
ted
inde
x de
clin
ed 2
.7 p
erce
nt
per y
ear u
nadj
uste
d pr
ices
rose
2.6
per
cent
per
ye
ar.
UK
U
K O
ffice
for N
atio
nal
Stat
istic
s (20
15)
mix
ed
2002
-201
2 A
ll In
crea
sed
surv
ival
rate
R
edef
ine
the
Goo
d Th
e qu
ality
adj
ustm
ent f
acto
r add
s 0.5
per
cent
pe
r yea
r on
aver
age
to o
utpu
t gro
wth
.
Cas
telli
, Daw
son,
Gra
velle
, et
al. (
2007
) ho
spita
ls
1997
-200
4 A
ll Li
fe e
xpec
tanc
y an
d ch
ange
in
wai
ting
times
R
edef
ine
the
Goo
d M
FP g
row
th w
as -.
87%
per
yea
r with
qua
lity
adju
stmen
t and
-1.1
1% p
er y
ear w
ithou
t.
Can
ada
Con
stan
t, B
enda
, Aris
te, a
nd
Mal
lory
(200
6)
hosp
itals
19
95- 2
002
Lung
, bre
ast,
pros
tate
and
co
lore
ctal
can
cer
Life
exp
ecta
ncy
CO
LI
The
SPI r
ose
at 1
.9%
ann
ually
but
the
CO
LI fe
ll by
2.6
% a
nnua
lly.
Mul
tiple
cou
ntri
es
O’M
ahon
y, H
uttl,
Mas
, et a
l. (2
014)
m
ixed
20
03-2
009
Incr
ease
d su
rviv
al ra
tes,
heal
th
gain
from
hos
pita
l sta
y, c
hang
e in
w
aitin
g tim
es, a
nd a
mea
sure
of
patie
nt e
xper
ienc
e of
serv
ices
* O
utpu
t gro
wth
is h
ighe
st in
the
UK
follo
wed
by
Ger
man
y.

11
spending is $10. Then, the person is better off by $5. This is equivalent to a 5 percent ($5/$100) reduction in overall prices, which would increase the person’s buying power by the same $5.
Using this method to investigate the COLI for heart attack treatment, Cutler et al (2001) found that, between 1984 and 1994, life expectancy for heart attack victims increased by about 1 year, at an increased cost of about $7,000. They calculate that, if the value of an additional life year is $25,000 (a reasonable mid-point from the literature for elderly people), then, properly measured, the price of heart attacks actually declined.6
Although the literature has generally missed this point, it is important to note that these COLIs should not be viewed as quality-adjusted health spending deflators. Rather, they are akin to the changes to the aggregate deflator (say, the GDP deflator) that arise because of improvements in health technology. To convert these to health deflators, one would divide the measured change in prices by the income share of health. For example, in the simple example above, the share of health spending in year t-1 is 10 percent of income. To get a 5 percent reduction in the GDP deflator, health prices would have to be viewed as having decreased 50 percent. Assuming that no other prices increased, then a 50 percent reduction in health prices with a 10 percent weight on health prices in income would produce an overall inflation rate of -5 percent, or a real income gain of $5.
As shown in Box 2, the COLI approach is equivalent to one in which the quality-adjusted price is equal to the actual price less the utility value (in monetary terms) of the quality improvement. Applying this method to the data in Cutler et al (2001), we find that the quality-adjusted price of heart attack treatment fell by about 14 percent per year between 1984 and 1994. These calculations are shown in Table 4.
The “Redefine the Good” Approach
A second way to adjust for quality is to redefine the good. People do not want health treatments because they enjoy them, but because they achieve results. Thus, one can define the good that is purchased as a “successful treatment” and think about the costs of unsuccessful treatment as simply raising the price of successful treatments. (This approach would be most reasonable if people simply repeated treatments until they worked.) Similarly, one could think of the good being purchased as additional years of life or additional years of disability-free life, and calculate the cost of that good over time.
Romley et al (2015) use this methodology to study productivity growth in the hospital treatment of
6 Cutler et al (2001) compute an overall decline in the cost of living arising out of improved heart attack treatment of 1.5 percent per year. However, as shown in Box 2, this shouldn’t be viewed as the decline in the price of heart attack treatment. Furthermore, this calculation is done only for heart attack victims and uses the present value of 5 years of income, so it is hard to compare it to overall price deflators or price deflators for heart attacks.
SHEINER & MALINOVSKAYA

12MEASURING PRODUCTIVITY IN HEALTHCARE: AN ANALYSIS OF THE LITERATURE
Tab
le 4
: Cal
cula
ting
the
Hea
lth P
rice
Def
lato
r u
sing
dat
a fr
om C
utle
r, M
cCle
llan,
New
hous
e, a
nd R
emle
r, 2
001.
No
Qua
lity
Adj
ustm
ent
C
OLI
Met
hod
R
edef
ine
the
Goo
d
Yea
r
Life
exp
ecta
ncy
follo
win
g Tr
eatm
ent
(Mon
ths)
Tr
eatm
ent
Cos
t
Una
djus
ted
Hea
lth P
rice
Infla
tion
Val
uatio
n of
A
dditi
onal
Life
(@
$25,
000
per L
ife
Yea
r)
Qua
lity
Adj
uste
d H
ealth
Pric
e In
flatio
n
Cos
t/Yea
r Life
Ex
pect
ancy
Pr
ice
Inde
x
19
84
60
$11,
483
$2,2
97
19
85
60
$12,
066
5%
$0
5%
$2
,413
5%
19
86
61
$12,
395
3%
$2,0
83
-15%
$2,4
38
1%
1987
62
$1
2,67
3
2%
$4
,167
-1
5%
$2
,453
1%
19
88
64
$13,
123
4%
$8,3
33
-29%
$2,4
61
0%
1989
66
$1
3,58
8
4%
$1
2,50
0 -2
8%
$2
,471
0%
19
90
68
$14,
186
4%
$16,
667
-26%
$2,5
03
1%
1991
69
$1
5,29
3
8%
$1
8,75
0 -7
%
$2
,660
6%
19
92
70
$16,
867
10
%
$2
0,83
3 -3
%
$2
,891
9%
19
93
72
$17,
581
4%
$25,
000
-20%
$2,9
30
1%
1994
72
$1
8,16
5
3%
$2
5,00
0 3%
$3,0
28
3%
19
84-1
994
4.
7%
-14.
4%
2.8%

13SHEINER & MALINOVSKAYA
three diagnoses: heart attack, heart failure, and pneumonia. For each condition, they define quality- adjusted output as the number of patients who survived at least thirty days beyond their admission and did not have an unplanned readmission within thirty days of discharge.7 They find that, without any adjustments for quality or patient severity, productivity growth for these three diagnoses between 2002 and 2011 was negative; however, when using the number of successful treatments as the measure of output, rather than the number of treatments overall, and adjusting for patient severity, hospital productivity growth was positive for all three diagnoses, averaging 0.8 percent for heart attack, 0.6 percent for heart failure, and 1.9 percent for pneumonia.
Of course, exactly how one redefines the good can have large effects on measured prices and productivity. For example, in their baseline case, Romley et al (2015) define quality-adjusted output as the number of treatments in which the patient survived 30 days without a readmission; they also show estimates when the good is defined by 14-day survival and one-year survival. Measured productivity growth doesn’t vary much across these three different definitions of the good for pneumonia, but it does for both heart attack and heart failure. For example, when using a 14-day survival period as the good in heart attack treatment, measured productivity growth is less than ½ percent per year; when using one-year survival as the definition of a successful treatment, measured productivity growth is 1¾ percent per year.
The Cost of Quality Improvement Approach
A third approach to quality-adjusting health care when constructing a price deflator is to subtract from the price in period t the costs of any quality improvements that were made to the product since the previous period. For example, if the price of a hospital stay increased by 10 percent in a particular year, but half of that increase represented the cost incurred by the hospital for improving quality, then the quality-adjusted price increase under this approach would be just 5 percent. The idea behind this approach is that it measures changes in the cost of producing the “old” good, rather than the new higher-quality one. This is the method that BLS has adopted to incorporate quality adjustments into the quality-adjusted hospital and nursing home PPIs discussed above (BLS, Hospital Quality Valuation Team (2008); BLS, Quality Adjustment (2014)).
One significant drawback to this approach is the general lack of data on the costs of improving quality.8 Thus, any attempt to use this approach necessarily relies on strong assumptions relating inputs to outcomes—that is, strong assumptions about the health production function. As noted above, the BLS uses performance on Hospital Compare to measure quality. Because they have
7 Rather than adjusting the price of hospital output to compute the quantity, they measure the quantity of output directly. The quality-adjusted price can be backed out by computing the ratio of nominal to real hospital expenditures.8 But see Frank et al (2004) for a study of treatment of mental health where the costs of treatment improvements are known.

14MEASURING PRODUCTIVITY IN HEALTHCARE: AN ANALYSIS OF THE LITERATURE
no data on the costs of improving quality, they assume that an x percent change in quality (where quality is the average of each of their Hospital Compare measures) represents an x percentage increase in costs. For example, if quality increases by 1 percent, they assume that costs likewise increased by 1 percent, and subtract this increment from the price change.9 As shown in Box 3, under this linearity assumption (and only under this linearity assumption), the Redefine the Good approach and the Cost of Quality Improvement approach are essentially the same.
A Comparison of Methods
Figure 1: Budget Constraints and Optimal Health Consumption
Although each of these three methods seems reasonable, they can produce very different results. This can be demonstrated using the heart attack data from Cutler et al (2001). As discussed above, using the COLI approach with these data, the price of heart attack treatment fell by about 14 percent a year from 1984 to 1994. What if we instead used the Redefine the Good approach with life expectancy post heart-attack as the good? In 1984, heart attack treatment cost $11,483 (1991 dollars), and life expectancy following it was 5 years. Thus, in 1984, the cost per year of life expectancy following a heart attack was $2,297. By 1994, the cost of a heart attack treatment had increased to $18,165 (1991 dollars), but life expectancy was 6 years, for an average cost per year of $3,027. Using this Redefine the Good method, the real price of health care increased 2.8 percent per year—much less than the 4.7 percent annual rise in the unadjusted treatment price, but still a much faster rate of growth than found using the COLI method of quality adjustment. Table 4 calculates the deflators for the COLI and Redefine the Good methods year by year.
9 The BLS does not include the mark-up of prices over costs in making this quality adjustment. One could argue that this approach inadequately compensates for quality changes because it allows the markup on the quality improvement to be viewed as an increase in the price.
A: Interior Solution is Optimal B: Technology Limits Health; Corner Solution is Optimal

15SHEINER & MALINOVSKAYA
What accounts for this dramatic difference in the results using the two approaches? The basic difference is that the Redefine the Good method doesn’t account for the fact that the marginal value of a year of life is much greater than its marginal cost. For most products that we purchase, we can purchase as much as we want of them at market price. Thus, marginal value and marginal cost are equated. But, in health care, technology limits how much we can buy. Doubling spending on heart attack treatments in 1984 would not have doubled life expectancy.
Figure 1 uses simple budget constraints and indifference curves to explain.10 Assume there are two goods, years of life and all other consumption. The budget constraint shows all the potential combinations of years of life and other consumption a person can afford. Assume that, as in the heart attack treatment, the price per year of life increases over time while the price of other consumption is unchanged. This is shown as an inward shift of the budget constraint.
Figure 1, Panel A shows a budget constraint when consumers are at interior solutions: They are just indifferent between an extra year of life and the extra consumption of other goods they could have if they were to forego that extra year. In this case, an increase in the cost per year of life would make them worse off, and the Redefine the Good method would yield virtually the same result as the COLI method. Note that, for this figure to apply, consumers would have to be indifferent between an extra year of life and the extra consumption that could be financed with it. But that is not the case: most measures of the value of an additional year of life far exceed the cost. That is, if patients could have doubled spending and doubled years of life following heart attack treatment, they would have been much better off. Thus, consumers are often at corner solutions when it comes to health: they would like to buy more health at current prices, but medical technology isn’t capable of delivering it.
This situation is shown in Figure 1, Panel B. Note that the years of life expectancy possible are capped. The optimal consumption mix in the first period, given the constraint, is shown by point A. In period 2, technology has improved so that more years of life are possible, although the incremental cost for that additional year is higher than previously: the price per year of life has increased. Nonetheless, people are better off and move to a higher indifference curve. In period 2, one would have to take away income for people to have the same utility that they had in period 1. The COLI measure captures this improvement in welfare. A quality adjustment that simply measures the price of an additional year of life expectancy does not. V. HEALTHCARE PRODUCTIVITY AND THE ACA PROVIDER CUTS
The Affordable Care Act changed the way hospitals and most non-physicians’ payments are calculated. Under the legislation prevailing before the ACA, annual updates to payments were set equal to the increase in input costs. For example, if wages and other costs increased 4 percent,
10 Think of these as societal budget constraints. More resources spent on health care necessitate fewer resources spent on other consumption goods.

16MEASURING PRODUCTIVITY IN HEALTHCARE: AN ANALYSIS OF THE LITERATURE
so too would the amount that Medicare paid.11 The ACA changed this formula, so that payment updates are now equal to input price growth less the ten-year average of economy-wide MFP. If wages and other input costs in the health sector increase at the same pace as in the overall economy, then the ACA payment updates will be about equal to economy-wide inflation. If health sector productivity growth is the same as overall productivity growth, then providers will be able to continue to provide a constant quality of care even under this new payment formula. V.A. The ACA and Historical Healthcare Productivity
Some worry that, because measured health care productivity in the health sector has been so low, this indicates that the ACA provider cuts will not be sustainable. For example, the Office of the Actuary at CMS assumes that “based on the historical evidence of health sector productivity gains, the labor-intensive nature of health care services, and presumed limits on the extent of current excess costs and waste that could be removed from the system, actual health provider productivity is very unlikely to achieve improvements equal to the economy as a whole over sustained periods” (Shatto and Clemens (2015)). However, the papers summarized in Table 3 clearly suggest that health care productivity has been underestimated. In virtually all areas that have been examined, the quality of health care has been improving. After adjusting for changes in quality, the price of health care services may not have increased relative to the price of non-health services.
From the perspective of the sustainability of the ACA cuts, a key question is: Can health care providers provide a constant quality of health care under the ACA payment system?12 Methods of quality adjustment like the COLI that rely on the utility value of incremental health spending are not well suited to answer this question, because they don’t shed any light on how much health care could be produced if health expenditures had not increased. In other words, they tell us whether past increases in spending have been “worth it”, but they don’t tell us if this year the providers could provide the same quality of care as last year using fewer resources.
The Redefine the Good approach can shed light on this question. Figure 2 again uses the simple budget constraint. In period 1, with income of Y, consumption is C1 and the quantity of health is H1. The relative price of health care is measured by the slope of the line between Y and point A: it measures how much consumption of non-health must be given up to purchase a unit of health. (So, a steeper slope means less consumption must be given up, meaning the price of health is lower.) In period 2, consumption falls to C2—health spending has increased, crowding out non-health consumption.
11 In practice, Congress often adjusted these updates downward, so that the actual payment updates were often much lower than input price growth. See Technical Review Panel (2012).12 A related but separate question is: How will the rise in Medicare payments compare to the increase in provider payments made by private insurers? If Medicare payments under the ACA are just sufficient to keep quality constant over time—because economic-wide productivity is equal to health-care productivity, for example—but are rising less quickly than private insurance payments, then the ACA cuts could still make Medicare patients relatively unattractive. For some thoughts on this issue, see Sheiner (2015).

17SHEINER & MALINOVSKAYA
Figure 2: Health Price Comparisons with and without Redefine the Good Quality Adjustment
Assume that, without an adjustment for quality, the quantity of health hasn’t increased—people are still getting the same number of doctor’s appointments, the same number of surgeries, etc. The traditional measure of health prices would find that we are at point B—same health care and less non-health care consumption. The relative price of health care would appear to have increased. Under this scenario, the only way to afford the same quantity of health services in the second period as in the first—H1—is to increase health spending and lower non-health consumption.
But this may be misleading. Assume that the quality of health care has increased so that, on a quality-adjusted basis, the quantity of health care services actually has increased to H2. Then, the relative price of health care has not increased. In this case, it would be possible to have the same level of health spending in period 2 as in period 1 while still maintaining consumption at C1. (And, if the real quantity of health services was even higher than H2, then the relative price of health services would have declined, implying that with updates just equal to inflation, the quality of health services could increase over time.)
Budget Constraints and MFP
How does this relate to the question of MFP? If the price of achieving a reduction in health care has fallen, that can be either because (1) health-sector MFP has increased, that is, the health system has figured out how to use a given set of inputs more efficiently, or (2) the real price of inputs has decreased, that is, MFP has increased in medical devices, pharmaceuticals, or other inputs.13
13 If the increased quality of health care output is solely attributable to an increase in the quality of the inputs, then the understatement of MFP is in the inputs, not in the hospital sector, because hospital MFP is equal to the percent increase in real outputs less percent increase in real inputs.
18MEASURING PRODUCTIVITY IN HEALTHCARE: AN ANALYSIS OF THE LITERATURE
In either case, the available evidence on the mismeasurement of health care quality suggests the ACA cuts would be more sustainable than is suggested by looking at unadjusted hospital output. If hospital MFP is at least as high as economy-wide MFP, then hospitals will be able to provide a constant quality output even given the ACA cuts. If the underestimate of MFP is in the mismeasurement of inputs, then that means that the growth in input costs is overstated, and, by using these overstated input costs as the basis for the Medicare payment update, Medicare is paying more than enough to maintain a constant level of quality. In either case, spending is increasing because quality is increasing, and slower growth in spending would be sufficient to maintain constant quality.
V.B. Potential for the ACA to Lead to Increased Productivity growth in Healthcare
In addition to the question of the mismeasurement of past productivity, there is a question about future productivity in health care. Many analysts believe that there is much that can be done to improve the efficiency of health care; they believe that our health system does not produce the maximum benefit given its level of inputs (Chandra and Skinner (2012)). Thus, the potential may exist to improve health care productivity beyond what we have observed in the past, at least for a time. An oft-cited statistic is that about one-third of health spending in the United States is wasteful. (Blumenthal et al (2013)). Health care reforms that lead to a reduction in waste would improve productivity—if properly measured.
The ACA contains a multitude of provisions that are aimed at closing the gap between actual health care productivity and potential health care productivity. These include the Hospital Readmissions Reduction and the Hospital-Acquired Condition Reduction programs, which penalize hospitals for excess rates of readmissions and hospital-acquired conditions, respectively; the Hospital Value-Based Purchasing program, under which Medicare pays hospitals according to their performance on a set of quality measures, encompassing both inputs (clinical processes), outputs (outcomes and patient experience of care) and efficiency (costs); the Shared Savings Program for Accountable Care Organizations, which allows groups of providers who meet quality standards and reduce costs to share in the cost savings; the Bundled Payments for Care Improvement Initiative, which provides a single payment for an episode of care to be shared among multiple service providers (including hospital, physician, post-acute, etc.); and the Medicare Advantage Quality Bonus program, which pays Medicare Advantage Plans more if they meet quality standards. In addition, the recently enacted Medicare Access and CHIP Reauthorization Act of 2015 (MACRA)—the legislation that repealed the Sustainable Growth Rate formula for physician payments— will establish a merit-based incentive payment system that will tie payments more closely to measures of performance (Anderson et al (2015)).
The ACA also created the Center for Medicare and Medicaid Innovation to develop and test value-based alternative payment methods, and granted the HHS secretary the authority to adopt innovations found to save money and improve quality for use throughout the Medicare program. Thus, looking forward, new payment models are likely to be implemented. By 2019, HHS expects

19SHEINER & MALINOVSKAYA
90 percent of traditional Medicare provider payments to be tied to quality or value (U.S. Department of Health and Human Services (2015)).
It remains to be seen how effective these innovations will be. Research to date has shown some limited increases in productivity arising from these new payment models (Anderson et al (2015), GAO (2015)). But the programs are still quite new, and it is likely too early to tell what effects they might have over the longer run.
What are the implications of these potential productivity improvements for the sustainability of the ACA cuts? From the perspective of traditional Medicare payment methods, it is not clear. A reduction in readmissions, for example, while improving the overall quality of health care and reducing Medicare expenditures, may not lower the resources required for any given hospital stay. However, an Accountable Care Organization that is paid a fixed payment per beneficiary—rather than on a fee-for-service basis—would be able to provide higher quality care for less money if these reforms are successful, thus making the ACA cuts consistent with continued improvements in health care quality and thus, more likely to be economically and politically sustainable. More generally, to the extent the ACA payment reforms lead to higher quality at lower cost, they will free up resources that could be used to boost provider payments in traditional fee-for-service Medicare if necessary.
VI. SUMMARY
Traditional measures of productivity growth in the health sector most likely understate it, because they don’t adjust prices for substitution from higher to lower cost inputs and because they don’t take account of changes in quality over time. There are a number of different methods to take quality into account. From a welfare perspective, one that measures the changes in the value of health care seems most appropriate. But from the perspective of the sustainability of the ACA provider cuts, measures that calculate cost per unit of quality-adjusted health care seem preferable. The evidence to date suggests that adjusting health care expenditures for changes in quality leads to a significant reduction in the rise in health prices over time, and, indeed, these prices may even have declined relative to other prices.
In addition, there are reasons to suspect that the Affordable Care Act will lead to improvements in the efficiency of the health care sector beyond what occurred in the past. In particular, payments are moving steadily away from paying on the basis of the quantity of services delivered toward paying for the quality and cost-effectiveness of delivered services. To the extent these innovations are successful, they will help boost health care productivity and allow the quality of the health care provided to Medicare beneficiaries to continue to increase over time.

20SHEINER & MALINOVSKAYA
BOX 1: METHODS OF IMPLEMENTING DISEASE-BASED PRICES
There are two main tasks in implementing the disease-based approach – aggregation and attribution (National Research Council (2010)). At the aggregation step, a classification scheme establishing disease categories is selected. At the attribution step, total health care spending is allocated among the disease categories.
Most studies use the International Classification of Diseases at the aggregation step. The ICD-9 includes 17 broad disease categories, including one which is “symptoms, signs, and ill-defined conditions.” As Triplett (2011) points out, preventive care and some nursing home care generally cannot be attributed to a chapter of the ICD, but most other care fits well into this system.There are three conceptually different approaches to attributing spending (Rosen and Cutler (2009)).
In the encounter-based approach, a person’s health care spending associated with a particular encounter (or visit) is assigned to the diagnosis listed on a medical claim. If there are multiple diagnoses, the primary diagnosis is usually selected. Thus, co-morbidities are ignored. Also, some portion of health care spending will remain unallocated if it has no associated claims or diagnosis codes. This attribution is done for all medical claims for all people until all claims with diagnosis codes are assigned to disease categories. Aggregation of encounters across people makes it difficult to link health care spending to health outcomes that are at the person level.
In the episode-based approach, an episode of care associated with treatment of a disease is defined and all care during the episode is attributed to the disease. For chronic conditions an episode of care is usually set at one year. This approach is often implemented with commercial grouper software which groups all of a patient’s claims associated with a given diagnosis over a set time period. Commercial groupers differ in their input data, the number of disease categories they produce, the way they identify severity, and the way they define “clean” periods marking a transition between episodes. The major issues are co-morbidities, linking data across providers, defining episodes for chronic conditions, and allocating all spending into disease categories.
In the person-based approach, an individual’s total health care spending over a pre-defined time period is attributed to a set of diseases that the person has, not just the primary diagnosis on a claim. The individuals are categorized based on similar demographic and clinical characteristics (there is grouper software for this purpose as well). An individual’s total health care spending over a period is regressed on indicators for the presence of all medical conditions. The assumption is that co-morbidities have independent effects on spending. This person-based approach can be linked to health outcomes, and although spending that is not tied to a listed diagnosis can still be allocated, it may be difficult to allocate disease spending back across different services.

21MEASURING PRODUCTIVITY IN HEALTHCARE: AN ANALYSIS OF THE LITERATURE
BOX 2: CONVERTING COLIs INTO HEALTH PRICE DEFLATORS
• Start with a disease-based approach that calls the average cost of treatment the price. • Then the change in price, ΔP, is just equal to the change in the cost of heart attack treatments
between period 1 and period 2, ΔC.• Let ΔV be the increase in value to heart attack victims from health care improvements between
periods 1 and 2. • Denote average income by Y.• Let s be the share of the population that experiences a heart attack each year. • Let α be the income share of heart attack treatment in the economy in period 1, which is equal
to the share of the population with a heart attack, s, times the cost of a heart attack treatment, divided by income.
𝛼𝛼 = 𝑠𝑠𝐶𝐶1
𝑌𝑌 = 𝑠𝑠𝑃𝑃1𝑌𝑌
• Denote ΔCOLI as the change in the overall price deflator and as the quality-adjusted price of heart attacks in period 2.
Then,
• The per capita net benefit that society receives from the improvement in health, NB, is just the change in value less the change in cost, multiplied by the share of the population affected: 𝑁𝑁𝑁𝑁 = 𝑠𝑠(𝛥𝛥𝛥𝛥 – 𝛥𝛥𝛥𝛥) = 𝑠𝑠(𝛥𝛥𝛥𝛥 – 𝛥𝛥𝑃𝑃)
• The change in the COLI is the loss of income in period 2 that would leave people as well off as in period 1. This is the change in the overall price deflator and is equal to:
∆𝐶𝐶𝐶𝐶𝐶𝐶𝐶𝐶 = −𝑁𝑁𝑁𝑁
𝑌𝑌 = −𝑠𝑠(𝛥𝛥𝛥𝛥 – 𝛥𝛥𝛥𝛥)𝑌𝑌
• To convert this into a price deflator for heart attack treatment, assume that all other prices remain constant. Then, using period 1 shares, we need the change in heart attack treatment prices multiplied by the share of heart attacks in the economy to equal the overall change in the COLI. Define as quality adjusted price of heart attack treatment in period 2.
𝛼𝛼 ( �̂�𝑃2 − 𝑃𝑃1
𝑃𝑃1) = −𝑠𝑠(𝛥𝛥𝛥𝛥 – 𝛥𝛥𝑃𝑃)
𝑌𝑌
• The price deflator for health, then, is just the change in the COLI divided by the share of health expenditures in income. Calculations continue on next page →
22SHEINER & MALINOVSKAYA
BOX 2: CONVERTING COLIs INTO HEALTH PRICE DEFLATORS (CONT’D)
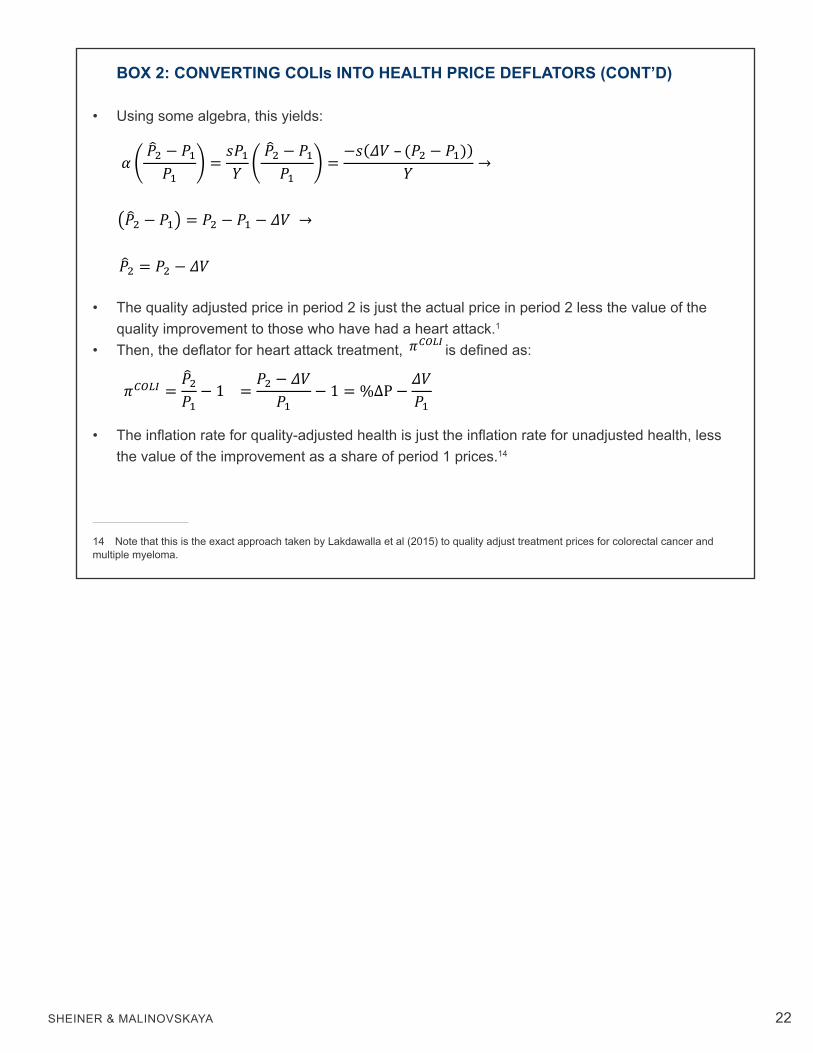
• Using some algebra, this yields: 𝛼𝛼 ( �̂�𝑃2 − 𝑃𝑃1
𝑃𝑃1) = 𝑠𝑠𝑃𝑃1
𝑌𝑌 ( �̂�𝑃2 − 𝑃𝑃1𝑃𝑃1
) = −𝑠𝑠(𝛥𝛥𝛥𝛥 – (𝑃𝑃2 − 𝑃𝑃1))𝑌𝑌 →
�̂�𝑃2 = 𝑃𝑃2 − 𝛥𝛥𝛥𝛥
• The quality adjusted price in period 2 is just the actual price in period 2 less the value of the quality improvement to those who have had a heart attack.1
• Then, the deflator for heart attack treatment, 𝜋𝜋𝐶𝐶𝐶𝐶𝐶𝐶𝐶𝐶 is defined as:
𝜋𝜋𝐶𝐶𝐶𝐶𝐶𝐶𝐶𝐶 = �̂�𝑃2𝑃𝑃1− 1 = 𝑃𝑃2 − 𝛥𝛥𝛥𝛥
𝑃𝑃1− 1 = %∆P − 𝛥𝛥𝛥𝛥
𝑃𝑃1
• The inflation rate for quality-adjusted health is just the inflation rate for unadjusted health, less the value of the improvement as a share of period 1 prices.14
14 Note that this is the exact approach taken by Lakdawalla et al (2015) to quality adjust treatment prices for colorectal cancer and multiple myeloma.
(�̂�𝑃2 − 𝑃𝑃1) = 𝑃𝑃2 − 𝑃𝑃1 − 𝛥𝛥𝛥𝛥 →

23MEASURING PRODUCTIVITY IN HEALTHCARE: AN ANALYSIS OF THE LITERATURE
BOX 3: COMPARING THE REDEFINE THE GOOD APPROACH WITH THE COST OF QUALITY IMPROVEMENT APPROACH
• Assume that the quality measure is probability of survival after treatment, λ. • Let 𝑃𝑃2 be the unadjusted and �̂�𝑃2 be the quality-adjusted price of treatment in period 2.• Let Q be the quantity of treatments (successful or not).• Define the quality-adjusted inflation rate, πadj, as the percentage change in quality adjusted
prices. The Redefine the Good approach to quality adjustment is as follows:
• Define the quality adjusted price as nominal spending per successful treatment:
• Quality-adjusted price inflation is then equal to the percent change in unadjusted prices less the percent change in the success rate.
𝜋𝜋𝑎𝑎𝑎𝑎𝑎𝑎 = �̂�𝑃2
�̂�𝑃1− 1 ≅ %∆P − %∆λ
The Cost of Quality Improvement approach used by BLA adjusts prices as follows: • Let C(Δλ) be the cost of producing the increase in survival between periods 1 and 2. • Then, the quality adjusted price in period 2 is defined as:
• Quality-adjusted price inflation is then just unadjusted price inflation less the ratio of the cost of the improvement to the price in period 1.
𝜋𝜋𝑎𝑎𝑎𝑎𝑎𝑎 = �̂�𝑃2
�̂�𝑃1− 1 = %∆P − C(∆λ)
𝑃𝑃1
• The Cost of Quality Improvement approach is equivalent to the Redefine the Good Approach if the percentage increase in price due to the cost of any improvements is equal to the percentage change in treatments.
C(∆λ)𝑃𝑃1
= %∆λ
Calculations continue on next page →
�̂�𝑃2 = 𝑃𝑃2𝑄𝑄2λ2𝑄𝑄2
= 𝑃𝑃2λ2
�̂�𝑃1 = 𝑃𝑃1𝑄𝑄1λ1𝑄𝑄1
= 𝑃𝑃1λ1
�̂�𝑃2 = 𝑃𝑃2 − C(∆λ)

24
BOX 3: COMPARING THE REDEFINE THE GOOD APPROACH WITH THE COST OF QUALITY IMPROVEMENT APPROACH (CONT’D)
• Under the assumption used to estimate the cost of improvement by BLS, this is almost but not quite true. The main difference is that BLS only adjusts for the change in cost associated with the improvements, and not the change in price. Because they assume that there is markup of prices over costs, m, this leads to the following result:
C(∆λ) = %∆λ ∗ 𝐶𝐶1 = %∆λ ∗ 𝑚𝑚𝑃𝑃1 • The BLS Cost method is equivalent to the Redefine the Good method, except for the effect of
the markup.
𝜋𝜋𝑎𝑎𝑎𝑎𝑎𝑎 = %∆P − C(∆λ)𝑃𝑃1
= %∆P −𝑚𝑚%∆λ
• An alternative specification (where one adjusts prices for both the cost of the improvements and the markup on that cost) would make these two methods identical.
SHEINER & MALINOVSKAYA

25
REFERENCES
Aizcorbe, Ana, and Nicole Nestoriak. 2008. Importance of Pricing the Bundle of Treatments. http://204.14.133.132/papers/pdf/wp2008-04_bundle_treatments_paper.pdf
Aizcorbe, Ana, and Nicole Nestoriak. 2011. “Changing Mix of Medical Care Services: Stylized Facts and Implications for Price Indexes.” Journal of Health Economics, 30 (3): 568-74. DOI: 10.1016/j.jhealeco.2011.04.002
Aizcorbe, Ana, Ralph Bradley, Ryan Greenaway-McGrevy, Brad Herauf, Richard Kane, Eli Liebman, Sara Pack, Lyubov Rozental, and others. 2013. Alternative Price Indexes for Medical Care: Evidence from the MEPS Survey. https://www.bea.gov/papers/pdf/MEPS_Draft_012011.pdf
Aizcorbe, Ana and Tina Highfill. 2015. “Medical Care Expenditure Indexes for the US, 1980-2006.” Bureau of Economic Analysis. http://www.bea.gov/papers/pdf/medical-care-expenditure- indexes-for-the-us-1980-2006.pdf
Anderson, Gerard, Karen David, Stuart Guterman. 2015. Medicare Payment Reform: Aligning Incentives for Better Care, The Commonwealth Fund, June. http://www.commonwealthfund. org/publications/issue-briefs/2015/jun/medicare-payment-reform-aligning-incentives
Berndt, Ernst R., Anupa Bir, Susan H. Busch, Richard G. Frank, and Sharon-Lise T. Normand. 2002. “The Medical Treatment of Depression, 1991–1996: Productive Inefficiency, Expected Outcome Variations, and Price Indexes.” Journal of Health Economics, 21 (3): 373-96. DOI: 10.1016/S0167-6296(01)00132-1
Blumenthal, David, Kristof Stremikis, and David Cutler. 2013. “Health Care Spending - A Giant Slain or Sleeping?” New England Journal of Medicine, 369: 2551-2557. DOI: 10.1056/NEJMhpr1310415
Bradley, Ralph, Elaine Cardenas, Daniel H. Ginsburg, Lyubov Rozental and Frankie Velez. 2010. “Producing disease-based price indexes.” Monthly Labor Review, 133(2): 20-28. http://www.bls.gov/opub/mlr/2010/02/art2full.pdf
Bradley, Ralph, 2013. “Feasible methods to estimate disease based price indexes.” Journal of Health Economics, 32(3): 504-514. DOI: 10.1016/j.jhealeco.2013.01.005
Bradley, Ralph, Jaspreet Hunjan, and Lyubov Rozental. 2015. “Experimental Disease Based Price Indexes.” http://www.bls.gov/pir/journal/rb03.pdf
Bureau of Labor Statistics. 2014. Quality Adjustment in the Producer Price Index. U.S. Department of
MEASURING PRODUCTIVITY IN HEALTHCARE: AN ANALYSIS OF THE LITERATURE

26
Labor. http://www.bls.gov/ppi/qualityadjustment.pdf
Busch, Susan H., Ernst R. Berndt, and Richard G. Frank. 2001. “Creating Price Indexes for Measuring Productivity in Mental Health Care.” In Forum for Health Economics & Policy, 4(1): 1558-9544. DOI: 10.2202/1558-9544.1025
Castelli, Adriana, Diane Dawson, Hugh Gravelle, Rowena Jacobs, Paul Kind, Pete Loveridge, Stephen Martin, et al. 2007. “A New Approach to Measuring Health System Output and Productivity.” National Institute Economic Review, 200(1): 105-17. DOI: 10.1177/0027950107080395
Chandra, Amitabh, and Jonathan Skinner. 2012. “Technology Growth and Expenditure Growth in Health Care.” Journal of Economic Literature 50(3), 645-580. DOI: 10.1257/jel.50.3.645
Chansky, Brian, Corby Garner, and Ronjoy Raichoudhary. 2015. “New Measure of Labor Productivity for Private Community Hospitals: 1993–2012.” Monthly Labor Review 2015. U.S. Department of Labor. Bureau of Labor Statistics. http://www.bls.gov/opub/mlr/2015/article/new-measure-of- labor-productivity-for-private-community-hospitals-1993-2012.htm
Constant Alexandra, Marie-Chantal Benda, Ruolz Ariste, and Charles D.Mallory. 2006. “Is the Price of Cancer Treatment Falling?” Health Canada, Strategic Policy Branch, Applied Research and Analysis Directorate. http://www.academia.edu/3852652/IS_THE_PRICE_OF_CANCER_ TREATMENT_FALLING
Cutler, David M. and Elizabeth Richardson. 1998. “The Value of Health: 1970-1990.” American Economic Review, 88(2): 97-100. http://www.jstor.org/stable/116900
Cutler, David M., Mark B. McClellan, Joseph P. Newhouse, and Dahlia K. Remler. 2001. “Pricing Heart Attack Treatments.” In Medical Care Output and Productivity, edited by David M. Cutler and Ernst R. Berndt, 305-362. Studies in Income and Wealth. Chicago, IL: University of Chicago Press. http://www.nber.org/chapters/c7634
Cutler, David M., Allison B. Rosen, and Sandeep Vijan. 2006. “The Value of Medical Spending in the United States, 1960–2000.” New England Journal of Medicine, 355(9): 920-27. DOI: 10.1056/NEJMsa054744
Cylus, Jonathan D. and Bridget A. Dickensheets. 2007. “Hospital Multifactor Productivity: A Presentation and Analysis of Two Methodologies.” Health Care Financing Review, 29(2): 49- 64. https://www.cms.gov/Research-Statistics-Data-and-Systems/Research/ HealthCareFinancingReview/downloads/07-08winterpg49.pdf
SHEINER & MALINOVSKAYA

27
Dunn, Abe. 2012. “Drug Innovations and Welfare Measures Computed from Market Demand: The Case of Anti-Cholesterol Drugs.” American Economic Journal: Applied Economics, 4(3): 167-89. DOI: 10.1257/app.4.3.167
Dunn, Abe, Eli Liebman, Sarah Pack, and Adam H. Shapiro. 2013. “Medical Care Price Indexes for Patients with Employer‐Provided Insurance: Nationally Representative Estimates from MarketScan Data.” Health Services Research, 48(3): 1173-1190. DOI: 10.1111/1475-6773.12008
Dunn, Abe, Eli Liebman, Lindsey Rittmueller, and Adam H. Shapiro. 2014. “Defining disease episodes and the effects on the components of expenditure growth.” In Health & Healthcare in America: From Economics to Policy. Ashecon. http://bea.gov/papers/pdf/definingdisease.pdf
Dunn, Abe, Eli Liebman, and Adam H. Shapiro. 2015a. “Implications of Utilization Shifts on Medical- care Price Measurement.” Health Economics, 24(5): 539-557. DOI: 10.1002/hec.3036
Dunn, Abe, Lindsey Rittmueller, and Bryn Whitmire. 2015b. “Introducing the New BEA Health Care Satellite Account.” Survey of Current Business, 95(1). http://meps.s-3.com/mepsweb/about_ meps/workshop_details/cfact_seminar_abstract_022315.pdf
Eggleston, Karen N., Nilay D. Shah, Steven A. Smith, Amy E. Wagie, Arthur R. Williams, Jerome H. Grossman, Ernst R. Berndt, Kirsten H. Long, Ritesh Banerjee, and Joseph P. Newhouse. 2009. “The Net Value of Health Care for Patients With Type 2 Diabetes, 1997 to 2005.” Annals of Internal Medicine, 151(6): 386-393. DOI: 10.7326/0003-4819-151-6-200909150-00003
Eggleston, Karen N., Nilay D. Shah, Steven A. Smith, Ernst R. Berndt, and Joseph P. Newhouse. 2011. “Quality Adjustment for Health Care Spending on Chronic Disease: Evidence from Diabetes Treatment, 1999–2009.” American Economic Review, 101(3): 206-11. DOI: 10.1257/aer.101.3.206
Fisher, Charles. 2007. “Multifactor Productivity in Physicians’ Offices: An Exploratory Analysis.” Health Care Financing Review, 29(2): 15-32. https://www.cms.gov/Research-Statistics-Data-and- Systems/Research/HealthCareFinancingReview/Downloads/07-08Winterpg15.pdf
Frank, Richard G., Ernst R. Berndt, Alisa B Busch, and Anthony F. Lehman. 2004. “Quality-Constant ‘prices’ for the Ongoing Treatment of Schizophrenia: An Exploratory Study.” The Quarterly Review of Economics and Finance, 44(3): 390-409. DOI: 10.1016/j.qref.2004.05.003
Government Accountability Office, “Hospital Value-Based Purchasing,” October 2015. United States Government Accountability Office GAO-16-9.
MEASURING PRODUCTIVITY IN HEALTHCARE: AN ANALYSIS OF THE LITERATURE

28
Gu, Wulong and Jiang Li. 2015. “Productivity in Residential Care Facilities in Canada, 1984-2009.” International Productivity Monitor, 29: 18-37. http://www.csls.ca/ipm/29/guandli.pdf
Hall, Anne E., and Tina Highfill. 2013a. “A regression-based medical care expenditure index for Medicare beneficiaries.” US Bureau of Economic Analysis Working Paper. Washington, DC. http://www.bea.gov/papers/pdf/a_regression_base_medical_care_expenditure_index_for_ medicare.pdf
Hall, Anne E., and Tina Highfill. 2013a. “A regression-based medical care expenditure index for Medicare beneficiaries.” US Bureau of Economic Analysis Working Paper. Washington, DC. http://www.bea.gov/papers/pdf/a_regression_base_medical_care_expenditure_index_for_ medicare.pdf
Hall, Anne E., and Tina Highfill. 2013b. “Calculating Disease-Based Medical Care Expenditure Indexes for Medicare Beneficiaries: A Comparison of Method and Data Choices.” National Bureau of Economic Research Working Paper. http://www.nber.org/papers/w19720
Hall, Anne E. 2014. “Estimating Regression-Based Medical Care Expenditure Indexes for Medicare Advantage Enrollees.” U.S. Bureau of Economic Analysis Working Paper. Washington, DC. https://www.bea.gov/papers/pdf/mcbs_privplan11_14.pdf
Hall, Anne E. 2015. “Adjusting the Measurement of the Output of the Medical Sector for Quality: A Review of the Literature.” U.S. Bureau of Economic Analysis Working Paper. https://www.bea.gov/papers/pdf/hall_hcsa_quality10_15.pdf
Harper, Michael J., Bhavani Khandrika, Randal Kinoshita, and Steven Rosenthal. 2010. “Nonmanufacturing Industry Contributions to Multifactor Productivity, 1987–2006.” Monthly Labor Review 2010. U.S. Department of Labor. Bureau of Labor Statistics. http://www.bls.gov/ opub/mlr/2010/06/art2full.pdf Highfill, Tina and Elizabeth Bernstein. 2014. “Using Disability Adjusted Life Years to Value the Treatment of Thirty Chronic Conditions in the US from 1987-2010.” IARIW 33rd General Conference. https://www.bea.gov/papers/pdf/highfill_bernstein_2014_dalysall.pdf
Hospital Quality Valuation Team. 2008. Proposal for Adjusting the General Hospital Producer Price Index for Quality Change. U.S. Department of Labor. Bureau of Labor Statistics. http://conference.nber.org/confer/2008/si2008/PRCR/murphy2.pdf
Howard, David H., John Kauh, and Joseph Lipscomb. 2010. “The Value of New Chemotherapeutic
SHEINER & MALINOVSKAYA

29
Agents for Metastatic Colorectal Cancer.” Archives of Internal Medicine, 170(6): 537-42. DOI: 10.1001/archinternmed.2010.36
Howard, David H., Peter B. Bach, Ernst R. Berndt, and Rena M. Conti. 2015. “Pricing in the Market for Anticancer Drugs.” National Bureau of Economic Research Working Paper. http://www.nber.org/papers/w20867
Lakdawalla, Darius, Jason Shafrin, Claudio Lucarelli, Sean Nicholson, Zeba M. Khan, and Tomas J. Philipson. 2015. “Quality-Adjusted Cost Of Care: A Meaningful Way To Measure Growth In Innovation Cost Versus The Value Of Health Gains.” Health Affairs, 34(4): 555-61. DOI: 10.1377/hlthaff.2014.0639
Lucarelli, Claudio, and Sean Nicholson. 2009. “A Quality-Adjusted Price Index for Colorectal Cancer Drugs.” National Bureau of Economic Research Working Paper. http://www.nber.org/papers/w15174
Nghiem, Son, Tim Coelli, and Scott Barber. 2011. “Sources of Productivity Growth in Health Services: A Case Study of Queensland Public Hospitals.” Economic Analysis & Policy, 41(1): 37-48. DOI: 10.1016/S0313-5926(11)50003-7 O’Mahony, Mary, Antonia Huttl, Matilde Mas, Agnes Nagy, Erika Schulz, and Lucy Stokes. 2014. “Output and Productivity Growth in the Healthcare Sector: A Study of Four European Countries.” IARIW 33rd General Conference. https://www.diw.de/documents/ vortragsdokumente/220/diw_01.c.479436.de/v_2014_mahony_output_iariw.pdf
National Research Council. 2010. Accounting for Health and Health Care: Approaches to Measuring the Sources and Costs of Their Improvement. Panel to Advance a Research Program on the Design of National Health Accounts, Committee on National Statistics, Division of Behavioral and Social Sciences and Education. Washington, D.C.: National Academies Press. http://www.nap.edu/catalog/12938
OECD. 2001. Measuring Productivity: OECD Manual. https://www.oecd.org/std/productivity- stats/2352458.pdf
Porter, Michael E. and Elizabeth Teisberg. 2004. “Redefining Competition in Health Care.” Harvard Business Review. https://hbr.org/2004/06/redefining-competition-in-health-care
Romley, John A., Dana P. Goldman, and Neeraj Sood. 2015. “US Hospitals Experienced Substantial Productivity Growth During 2002–11.” Health Affairs, 34(3): 10-1377. DOI: 10.1377/hlthaff.2014.0587
MEASURING PRODUCTIVITY IN HEALTHCARE: AN ANALYSIS OF THE LITERATURE

30SHEINER & MALINOVSKAYA
Rosen, Allison B., David M. Cutler, Douglas M. Norton, Hsou M. Hu, and Sandeep Vijan. 2007. “The Value Of Coronary Heart Disease Care For The Elderly: 1987-2002.” Health Affairs, 26(1): 111-23. DOI: 10.1377/hlthaff.26.1.111
Rosen, Allison B., and David M. Cutler. 2009. “Challenges in Building Disease-Based National Health Accounts.” Medical Care, 47 (Supplement): S7–13. DOI: 10.1097/MLR.0b013e3181a23e12
Schreyer, Paul. 2010. “Towards Measuring the Volume Output of Education and Health Services.” OECD Statistics Working Papers 2010/02. http://www.oecd-ilibrary.org/economics/towards- measuring-the-volume-output-of-education-and-health-services_5kmd34g1zk9x-en
Schreyer, Paul, and Matilde Mas. 2013. “Measuring Health Services in the National Accounts: An International Perspective.” In Measuring and Modeling Health Care Costs. University of Chicago Press. http://www.nber.org/chapters/c13116.pdf
Schultze, Charles and Christopher Mackie, ed. 2002. At What Price?: Conceptualizing and Measuring Cost-of-Living and Price Indexes. Washington, D.C.: National Academies Press. http://www.nap.edu/catalog/10131
Shapiro, Irving, Matthew D. Shapiro, and David Wilcox. 2001. “Measuring the value of Cataract Surgery.” In Medical Care Output and Productivity, edited by David M. Cutler and Ernst R. Berndt, 411-438. Studies in Income and Wealth. Chicago, IL: University of Chicago Press. http://www.nber.org/chapters/c7636.pdf
Sharpe, Andrew, Celeste Bradley, and Hans Messinger. 2007. “The Measurement of Output and Productivity in the Health Care Sector in Canada: An Overview.” Centre for the Study of Living Standards Report 2007-06. http://www.csls.ca/reports/csls2007-06.PDF
Shatto, John D., and M. Kent Clemens. 2015. “Projected Medicare Expenditures under an Illustrative Scenario with Alternative Payment Updates to Medicare Providers.” Office of the Actuary. Centers for Medicare and Medicaid Services. https://www.cms.gov/Research-Statistics- Data-and-Systems/Statistics-Trends-and-Reports/ReportsTrustFunds/Downloads/ 2015TRAlternativeScenario.pdf
Sheiner, Louise. 2015. “ACA Sustainability, Productivity Growth and the Complex Relationship between Medicare and Private Provider Payments”, presentation at the Altarum Institute Symposium New Dimensions on Sustainable U.S. Health Spending. http://altarum.org/sites/default/files/uploaded-related-files/Sheiner%20Presentation.pdf
Song, Xue, William D. Marder, Robert Houchens, Jonathan E. Conklin, and Ralph Bradley. 2009. “Can

31
A Disease-Based Price Index Improve the Estimation of the Medical Consumer Price Index?” In Price Index Concepts and Measurement, edited by W. Erwin Diewert, John S. Greenlees and Charles R. Hulten. University of Chicago Press. http://www.nber.org/chapters/c5083.pdf
Spitalnic, Paul, Stephen Heffler, Bridget Dickensheets, and Mollie Knight. 2016. Hospital Multifactor Productivity: An Updated Presentation of Two Methodologies. Department of Health and Human Services. Center for Medicare & Medicaid Services. Office of the Actuary. https://www.cms.gov/Research-Statistics-Data-and-Systems/Statistics-Trends-and-Reports/ ReportsTrustFunds/Downloads/ProductivityMemo2016.pdf
Technical Review Panel on the Medicare Trustees Reports. 2012. “Review of Assumptions and Methods of the Medicare Trustees’ Financial Projections.” https://www.cms.gov/ Research-Statistics-Data-and-Systems/Statistics-Trends-and-Reports/ReportsTrustFunds/ TechnicalPanelReports.html
Triplett, Jack E., and Barry P. Bosworth. 2004. “Output and Productivity in Other Services.” In Productivity in the U.S. Services Sector, 256-273. Washington, DC: Brookings Institution Press. http://www.jstor.org/stable/10.7864/j.ctt12879w8
Triplett, Jack E. 2011. “Health System Productivity.” Oxford Handbook of Health Economics. Oxford University Press: New York, 707-32. DOI: 10.1093/oxfordhb/9780199238828.013.0030
UK Office for National Statistics. 2015. Public Service Productivity Estimates: Healthcare, 2012. http://webarchive.nationalarchives.gov.uk/20160105160709/http://www.ons.gov.uk/ons/ dcp171766_393405.pdf
U.S. Department of Health and Human Services. 2015. Better, Smarter, Healthier: In historic announcement, HHS sets clear goals and timeline for shifting Medicare reimbursements from volume to value. http://www.hhs.gov/about/news/2015/01/26/better-smarter-healthier-in- historic-announcement-hhs-sets-clear-goals-and-timeline-for-shifting-medicare- reimbursements-from-volume-to-value.html
MEASURING PRODUCTIVITY IN HEALTHCARE: AN ANALYSIS OF THE LITERATURE


![[Productivity World] Productivity Conference 2015 "พัฒนาภาคอุตสาหกรรมไทยให้ทันต่อการเปลี่ยนแปลงตามแนวทางการจัดการอนาคต"](https://img.dokumen.tips/doc/110x75/58a8149d1a28ab4d148b45b9/productivity-world-productivity-conference-2015-.jpg)