Embed Size (px)
Citation preview

MEASURING PROCESS QUALITY
ON AN ORDINAL SCALE BASIS
E. Bashkansky, T.GadrichIndustrial Engineering & Management Department
E.GodikSoftware Engineering Department

3
PROCESS QUALITY
Gap Action
ProcessQuality Control
Target Measure

5
Ordinal Variables in Quality Engineering
Quality sort Customer satisfaction grade Vendor’s priority Customer importance (QFD) Failure severity Internet page rank Vote result (pro, abstain, contra) the power of linkage (QFD) …
Traditional approach: assigning arbitrary numerical values to the different categories of the ordinal variable
8
Quality variable having three levels of quality
Traditional Approach
Quality
level
Assigned value
H 9
M 3
L 1
Quality
level
Assigned value
H 3
M 2
L 1
“H” – High Quality “M” – Medium Quality “L” – Low Quality
H > M > L
Scale A Scale B

9
Traditional Approach - Average
Sample HLL
According to A latent scale the average equals 1.67 positioning the average between Low and Medium quality
According to B latent scale the average equals 3.67 positioning the average between Medium and High quailty

11
Study’s Purpose
Estimation the quality of a stable process without assigning any numerical values to the ordinal variables.

12
MedianHHHHHHMMMLLLL
Advantage: Simple
Natural Measure for the Ordered Samples
Disadvantage: Robust
HHHMLLL MMMMLLL

19
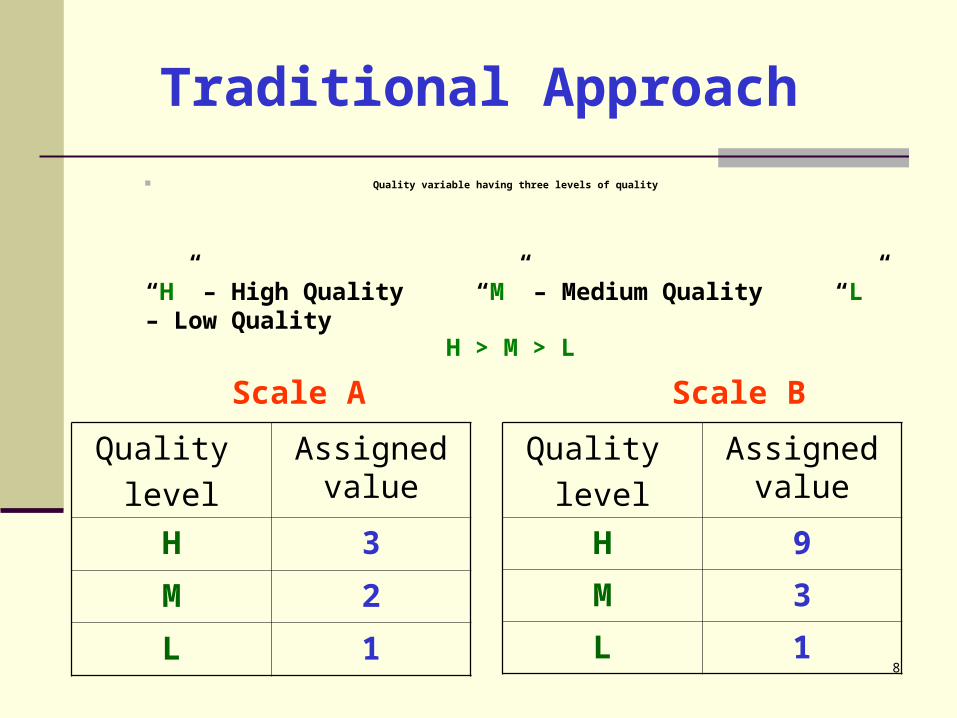
Quality measure of a given sample
Equals to the relative position of the given sample in a quality ladder that is built for a samples of the same size.
20
The Rational of a Quality Ladder
Q -------- HH…H
--------
--------
-------- quality represented by a sample
--------
--------
--------
--------
--------
-------- LL…L
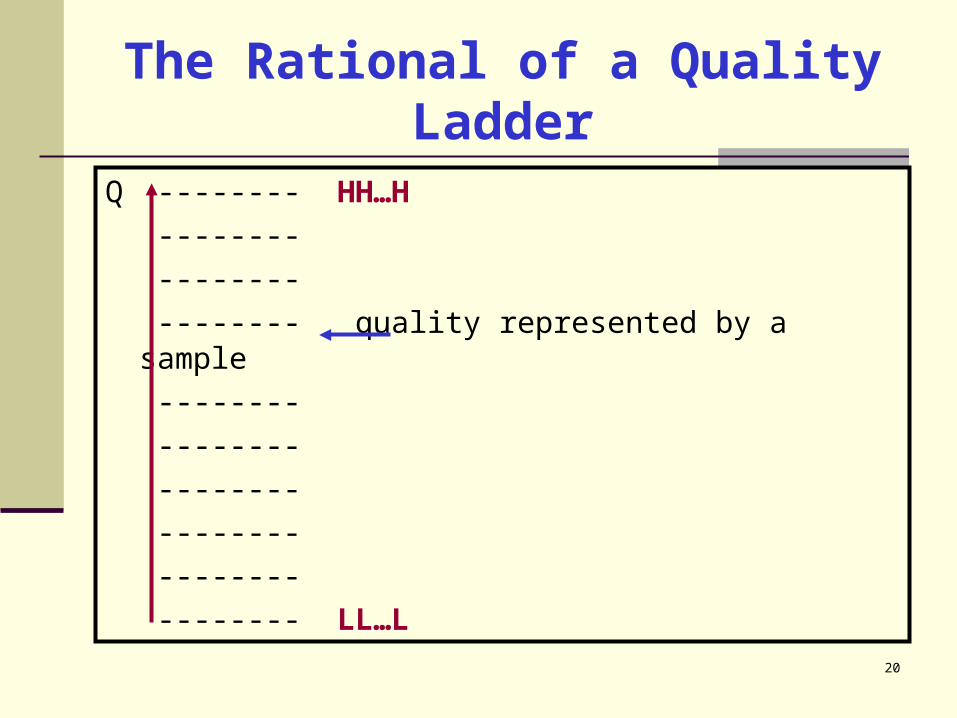
21
Various possible quality ladders for a sample n=2
HH
HM
MM
HL
ML
LL
HH HM
HL
MM
ML LL
HH
HM
HL=MM
ML
LL

23
F-function(Cumulative distribution function – CDF)
Define: Pi = proportion of products belonging to i - th quality level.
FL = PL ;
FM = PL + PM ;
FH = PL + PM + PH =1

29
Graphical presentation of a different sample using F-space
R={LLLLL}
S={HHHHH}
T={MMMMM}
O={HHMLL}
P={HMMLL{
Q={HMMML}

31
Ordinal dispersion
Blair, J., & Lacy, M. G. (2000)
2)5.0(
)1(,
iMLi
i FF
VAR
32
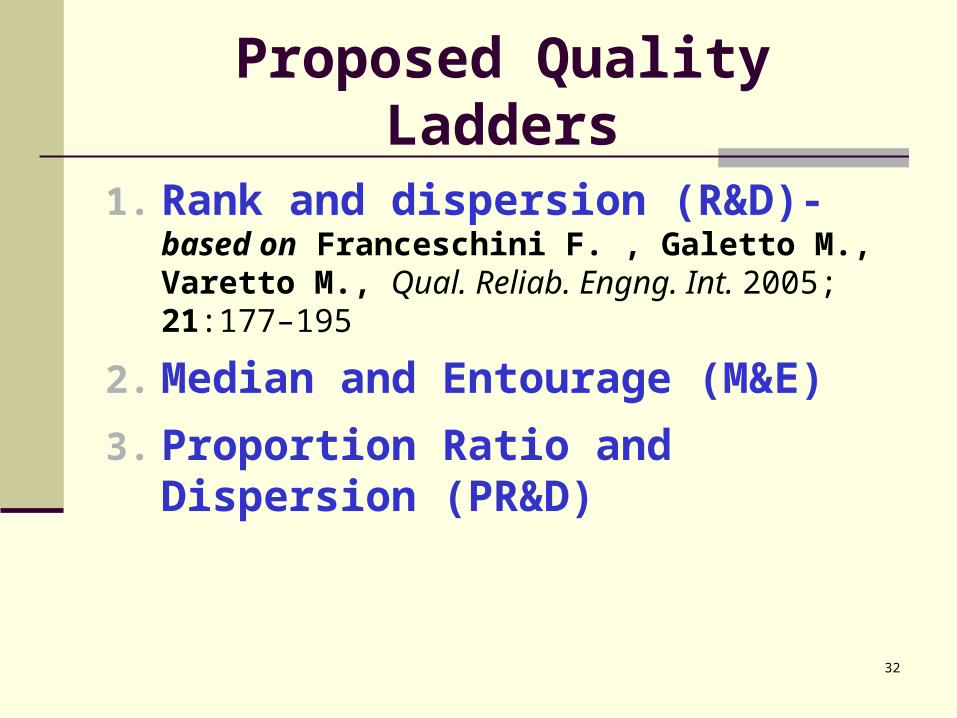
Proposed Quality Ladders
1. Rank and dispersion (R&D)- based on Franceschini F. , Galetto M., Varetto M., Qual. Reliab. Engng. Int. 2005; 21:177–195
2. Median and Entourage (M&E)
3. Proportion Ratio and Dispersion (PR&D)

33
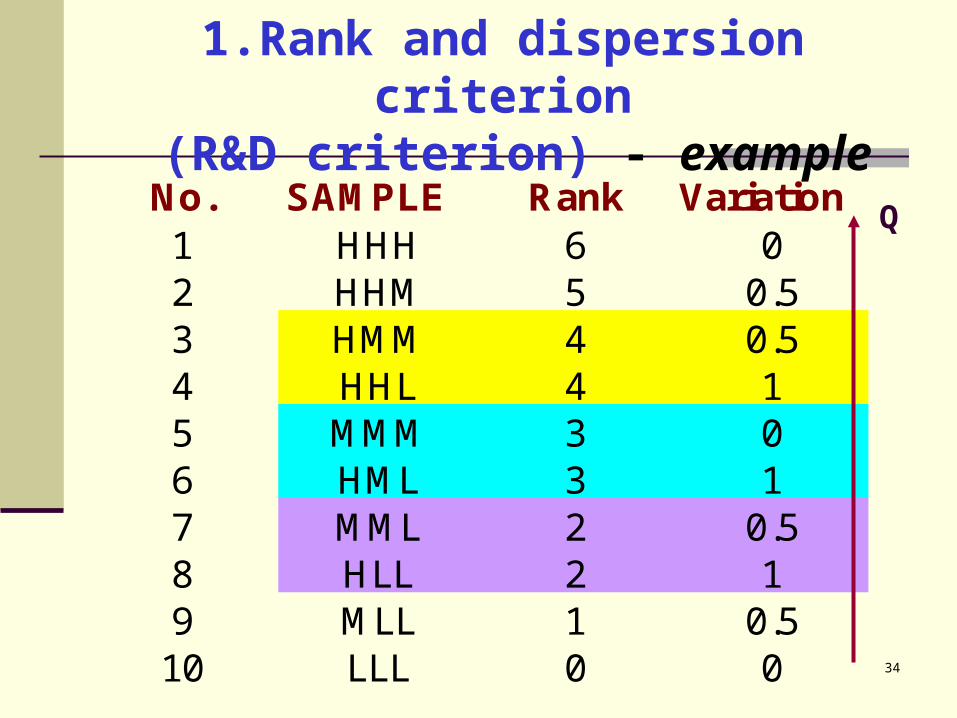
1.Rank and dispersion criterion (R&D criterion)
The algorithm has two stages:
First stage sorts the samples in ascending order according to their ranks value .
Rank value = 0*(# L) + 1*(# M) + 2*(# H)
Second stage orders samples belonging to the same rank class according to their dispersion values in descending order. The ordered sample having larger dispersion is located at a lower position in the quality ladder.
Disadvantage
34
1.Rank and dispersion criterion (R&D criterion) - example
No. SAMPLE Rank Variation1 HHH 6 02 HHM 5 0.53 HMM 4 0.54 HHL 4 15 MMM 3 06 HML 3 17 MML 2 0.58 HLL 2 19 MLL 1 0.510 LLL 0 0
Q
36
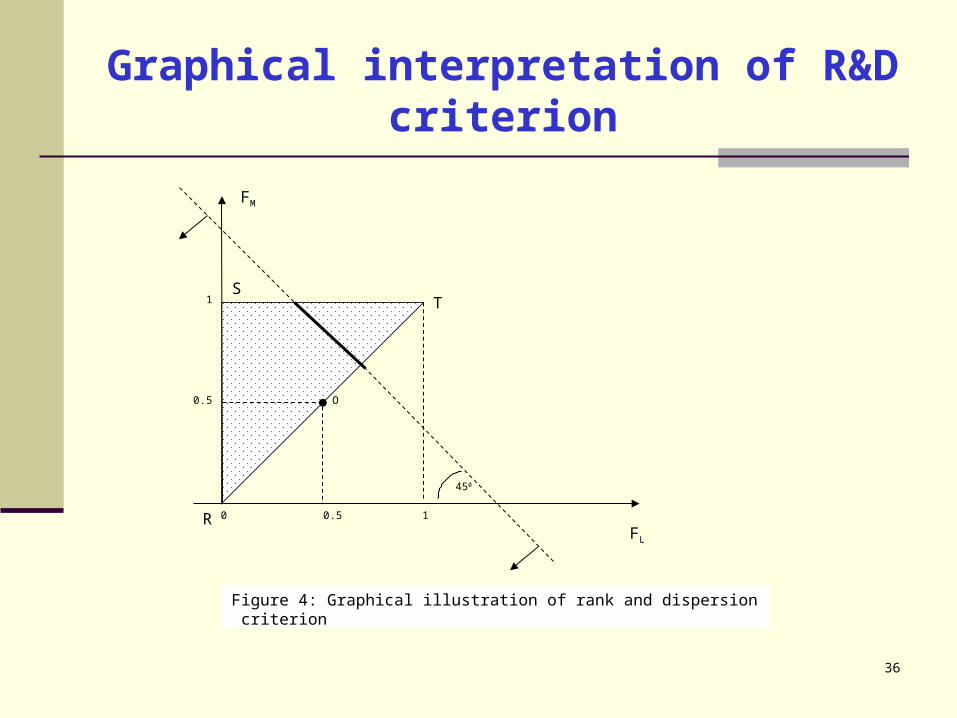
Graphical interpretation of R&D criterion
FL
1
TS
R
O
450
Figure 4: Graphical illustration of rank and dispersion criterion
1
0.5
0.5
0
FM
38
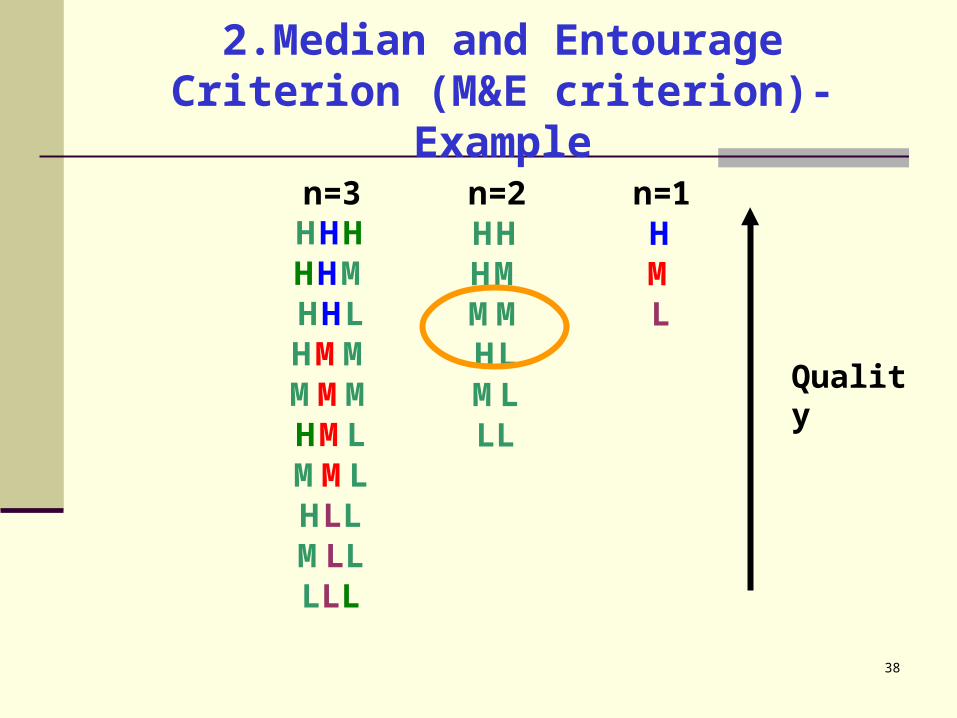
2.Median and Entourage Criterion (M&E criterion)-Example
n=3 n=2 n=1HHH HH HHHM HM MHHL MM LHMM HLMMM MLHML LLMMLHLLMLLLLL
Quality

40
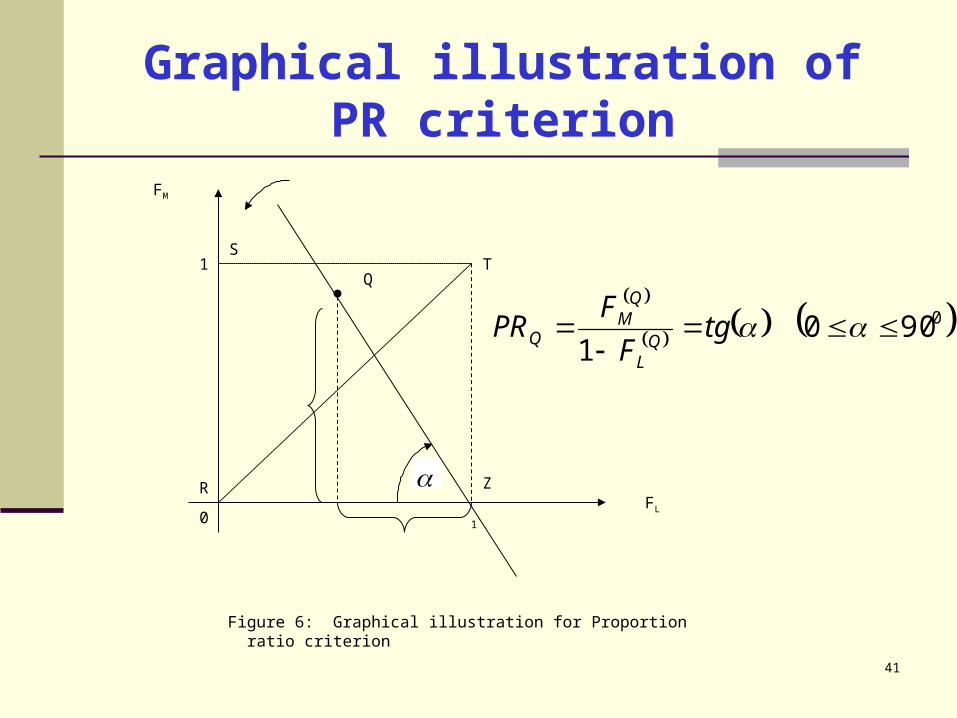
3.Proportion Ratio and Dispersion criterion (PR&D) - first stage
Define the proportion ratio (PR) as:
As the quality of the sample increases, the value of PR decreases, and vice versa.
So, first, samples are arranged according to their decreasing PR values.
PR
F
F
PP
PPPR
L
M
HM
ML 01
41
Graphical illustration of PR criterion
FL
FM
Figure 6: Graphical illustration for Proportion ratio criterion
TS
R
1
Z
0
1Q
09001
tgF
FPR
QL
QM
Q

43
Comparison between various criterions for a sample size n=3
No. R&D M&E PR&D1 HHH HHH HHH2 HHM HHM HHM3 HMM HHL HHL4 HHL HMM HMM5 MMM MMM MMM6 HML HML HML7 MML MML MML8 HLL HLL HLL9 MLL MLL MLL10 LLL LLL LLL
47
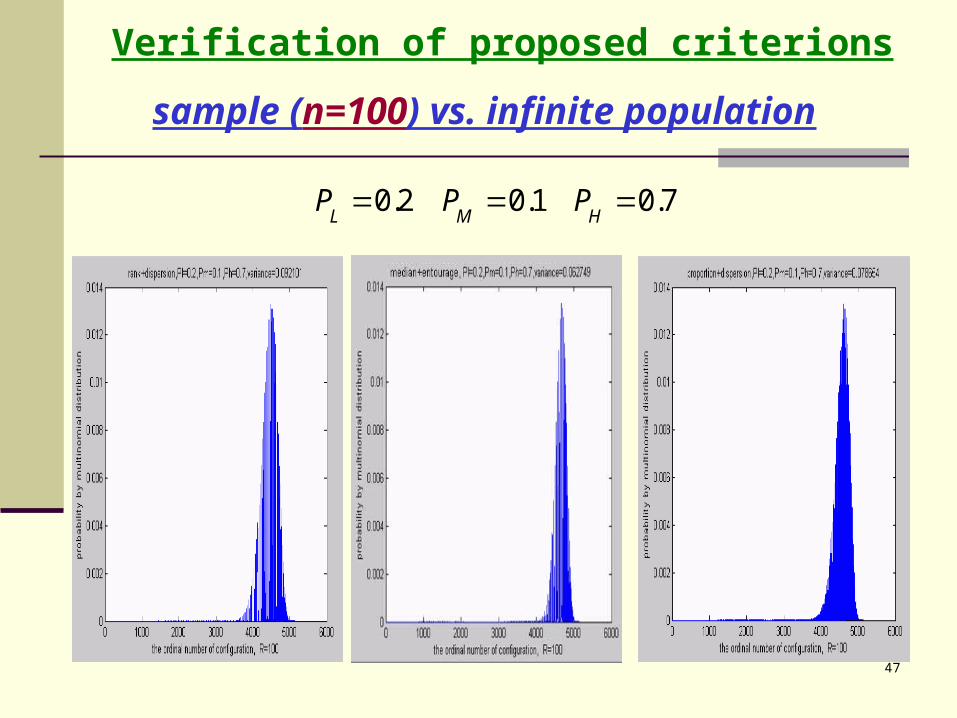
Verification of proposed criterions
sample (n=100) vs. infinite population
7.01.02.0 HMLPPP

48
Verification of proposed criterions
sample (n=100) vs. infinite population
5.02.03.0 HMLPPP
49
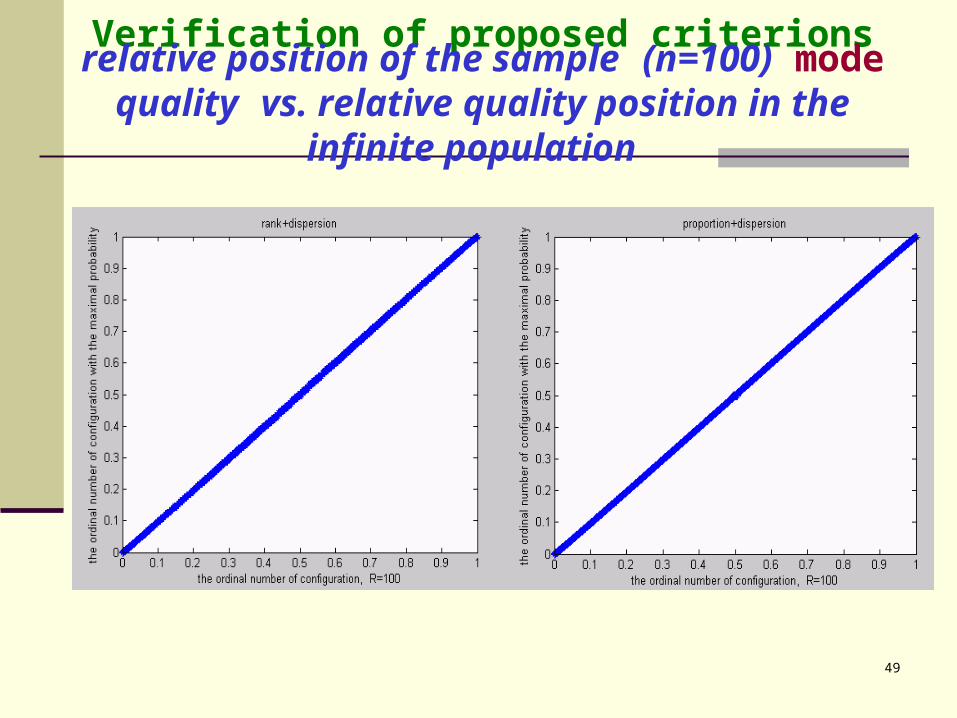
Verification of proposed criterionsrelative position of the sample (n=100) mode quality vs. relative quality position in the infinite population

50
Verification of proposed criterionsrelative position of the sample ( n=10 ) mode quality vs.
relative quality position in the finite ( N=100 ) population
51
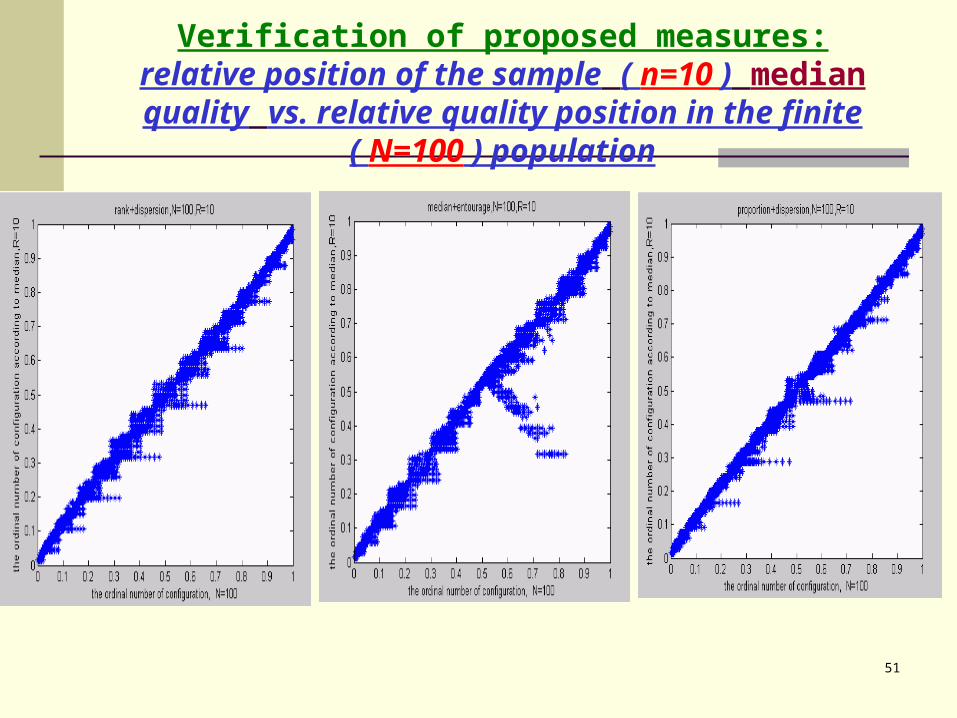
Verification of proposed measures:relative position of the sample ( n=10 ) median quality vs. relative quality position in the finite ( N=100 ) population

53
Thank You