Embed Size (px)
Citation preview

413
12Chapter
Measuring Performance of 3GPP LTE Terminals and Small Base Stations in Reverberation Chambers
M. Andersson, A. Wolfgang, C. Orlenius, and J. Carlsson
Contents12.1 Introduction ..........................................................................................414
12.1.1 Test Chambers for Terminals and Base Stations with Small Antennas ...............................................................416
12.1.2 Brief Background on Reverberation Chambers .......................41712.1.3. Standardization of Measurements in Reverberation
Chambers ................................................................................41912.1.4 Chapter Outline ......................................................................419
12.2 Basic Properties of Reverberation Chambers......................................... 42012.2.1 Basic Measurements—Reflection and Transmission
Coefficients ............................................................................ 423.12.2.2 Transmission Level and Calibration ........................................42512.2.3. Accuracy and Number of Independent Samples ..................... 42612.2.4 Research Activities on Reverberation Chambers .....................42712.2.5 Benchmarking of Reverberation with Anechoic Chambers .... 43.0
AU7210.indb 413 3/3/09 1:52:51 PM
© 2009 by Taylor & Francis Group, LLC

414 ◾ Long Term Evolution: 3GPP LTE Radio and Cellular Technology
12.1 IntroductionMultipath fading has for many years been a problem for mobile communication engineers, to be overcome by designing systems that have sufficient signal-to-noise ratio (SNR) or signal-to-interference ratio (SIR) margins. The fading is caused by multiple reflections in walls and ceilings (indoors) or cars and buildings (outdoors) that add constructively or destructively at the location of the terminal or base sta-tion antennas. The global system for mobile communications (GSM) and third generation (3.G) both require fading margins of 20–3.0 dB to provide good voice quality at most locations in the cell [1]. The 3.rd Generation Partnership Project (3.GPP) long term evolution (LTE) and, to some extent, evolved HSPA (high-speed packet access) and WiMAX (worldwide interoperability for microwave access) will use a completely different approach to multipath fading. Instead of being some-thing to be combated to provide robust voice communication everywhere in the cell, the fading conditions will be used to increase the bit rate for data communi-cation for single users or increase the system throughput in order to increase the overall spectral efficiency [2].
A key technology to provide this flexibility at reasonable costs in 3.GPP LTE systems is multiantenna solutions at the terminal or base station [3.,4]. The mul-tiantenna configuration can be used to increase the SNR and SIR using beam forming or different antenna diversity algorithms or utilized for higher throughput using partially uncorrelated transmission channels if multiple antennas are used at both base station and terminal—that is, MIMO (multiple input, multiple output) antennas. The use of more advanced antennas at the terminal and base station has been considered also for GSM and 3.G for many years [5] but has not led to large
12.3. Calibration of the Reverberation Chamber ............................................43.212.3..1 Measurement of Antenna Efficiency ....................................... 43.412.3..2 Measurement of Total Radiated Power ....................................43.512.3..3. Measurement of Total Isotropic Sensitivity .............................43.712.3..4 Measurement of Average Fading Sensitivity ............................43.912.3..5 Measuring Antenna Diversity Gain ........................................44112.3..6 Measuring MIMO Capacity .................................................. 44412.3..7 Measuring System Throughput ...............................................445
12.4 New Tests for LTE-and-Beyond Systems in the Reverberation Chamber...............................................................44912.4.1 Link-Level Measurements .......................................................45012.4.2 Single-Cell System-Level Measurements .................................45212.4.3. Multicell System-Level Measurements ....................................453.
12.5 Summary ...............................................................................................454References .........................................................................................................455
AU7210.indb 414 3/3/09 1:52:51 PM
© 2009 by Taylor & Francis Group, LLC

Measuring Performance of 3GPP LTE Terminals ◾ 415
deployments of terminals or base stations with advanced multiantenna solutions. One of the main reasons is the big difference in the required data rates between mobile broadband services such as 3.GPP LTE compared to mobile telephony. In 3.GPP LTE the bit rate in the down- and uplinks will be directly dependent on the available SNR/SIR received at the terminal from the base station and vice versa. In a GSM system, the SNR/SIR just has to be above a certain threshold value for the service to work. Even if there is a 20-dB extra link margin available—for example, due to smart antenna solutions—the bit rate will always be the same 9.6 kb/s in the up- and downlinks. Of course, the coverage will be better, but that does not affect the majority of users in urban areas and affects only a few users in rural areas.
The business case for advanced antennas to extend the coverage for a few users in rural areas has, in most cases, not been good enough for the extra cost of using advanced antenna solutions. The business case for higher throughput and bet-ter spectral efficiency for all users is much better. For the new mobile broadband systems—HSPA, WIMAX, and 3.GPP LTE—extra SNR or SIR can be used in discrete steps to increase the bit rate through higher modulation rates (e.g., going from QPSK (quadrature phase shift keying) to 16 QAM (quadrature amplitude modulation) or 64 QAM) or reduced coding. Alternatively, the system capacity can be increased by adding more users with the same bit rate using narrower or fewer channels. Just as a few users in rural areas today discover that some mobile phones work and some do not work (often depending on how well the antennas have been implemented in the phones), all users of 3.GPP LTE terminals will experience dif-ferent up- and downlink speeds with different terminals at the same location in both urban and rural areas. The implementation of the antenna solutions will thus immediately affect the user perception, and good single- or multiantenna solutions will be a significant competitive advantage for 3.GPP LTE terminal and base station antenna developers and manufacturers.
One of the main challenges facing the antenna engineer choosing an antenna configuration is how to reach a design with good performance and how to verify this performance in a reasonable time and at a reasonable cost. One of the differ-ences of small antennas compared to large antennas is that they are much harder to model accurately with software. This is mainly because large antennas normally are used in an open environment without any neighboring objects to disturb the antenna function. Small antennas, on the other hand, are usually integrated in a chassis containing materials that absorb radiation or in different ways disturb the antenna function. Furthermore, in a mobile phone, there are a number of antennas that all affect each other.
For small antennas, in a single- or multiantenna configuration, the most important parameter is the antenna efficiency [6] (i.e., the parameter that directly influences how much of the transmitter power is radiated into space or how much of the radiation incident on the antenna reaches the receiver). By optimizing the antenna function directly to as high antenna efficiency as possible to influence
AU7210.indb 415 3/3/09 1:52:51 PM
© 2009 by Taylor & Francis Group, LLC

416 ◾ Long Term Evolution: 3GPP LTE Radio and Cellular Technology
such important parameters as coverage, battery lifetime, and bit rate in the up- and downlinks. For small antennas, this optimization is very hard to do accurately with software, but it is easy with measurements. Because most of the small antennas should have high efficiency over a number of frequency channels and sometimes over several frequency bands, there is a need for a large number of measurements during development and evaluation of wireless products.
12.1.1 Test Chambers for Terminals and Base Stations with Small Antennas
Despite their common usage, the traditional test instruments for measuring the antenna efficiency of small antennas or the total radiated power (TRP) and total isotropic sensitivity (TIS) of wireless devices with small antennas (i.e., anechoic chambers) have never been a suitable method for wireless devices to be used in a multipath environment because there are no reflections in an anechoic chamber. Anechoic chambers were originally developed to measure radar antennas during the Second World War. The method is very suitable for large antennas, which, in addition to radar antennas, can be antennas for microwave links, satellite antennas, etc. These antennas have in common that they are used in an environment with few or no reflections—so-called line-of-sight (LOS) conditions. Still, people who developed small antennas had no other choice than using anechoic chambers for characterizing them because no alternative measurement chambers were available. The anechoic chamber technology has continually been improved by using (e.g., near field probe measurements) multiprobe measurements to speed up measure-ment time. However, devices with small antennas are mainly used indoors or in urban environments where there are multiple paths, which are very different envi-ronments from those found in anechoic chambers.
A multipath environment is much easier to emulate in a reverberation chamber. The reverberation chamber is also a reference environment—a reflective reference environment with Rayleigh statistics that is much more suitable for devices with small antennas than the anechoic reference environment. The reverberation cham-ber has the advantages that it can be made much smaller and that the measurements can be performed much faster than in an anechoic chambers. Another very large advantage, especially important for 3.GPP LTE, is the possibility to make direct measurements in the reflective (Rayleigh) reference environment of diversity gain and MIMO capacity for products with multiple antennas. The alternative “drive test” has several drawbacks:
unreliable (one can never be sure to drive exactly the same route and through ◾the same environment more than once);expensive (one needs to make simultaneous measurements for each of the ◾multiple antennas in the terminal as well as for a reference antenna); andtime consuming. ◾
AU7210.indb 416 3/3/09 1:52:51 PM
© 2009 by Taylor & Francis Group, LLC

Measuring Performance of 3GPP LTE Terminals ◾ 417
We will see in this chapter that, for the first time ever, the reverberation chamber makes it possible to do repeatable system throughput tests in a reflective environ-ment as well as completely new tests of importance for 3.GPP LTE technologies—for example, multiuser MIMO (MU-MIMO) and scheduling tests that are mainly only simulated in software today. System throughput tests could, as time passes, become more important for designers of 3.GPP LTE terminals and small base sta-tions than the traditional TRP and TIS tests done in anechoic or reverberation chambers because they show the actual performance in the downlink and uplink in a Rayleigh environment.
12.1.2 Brief Background on Reverberation ChambersFor about 3.0 years, reverberation chambers (or mode-stirred chambers) have been used to test how much electrical devices radiate (normally referred to as electro-magnetic compatibility [EMC] measurements) to avoid interference with other electrical devices [7]. The reverberation chamber is usually a metal-box cavity, with different sizes in its three dimensions and with some type of mode-stirrer mecha-nism. When one excites one or several antennas in the chamber at a suitable fre-quency, a number of standing wave modes will be generated. By placing the device under test (DUT) in the cavity, one makes sure that all the radiation generated stays in the cavity. By changing the boundary conditions for the modes in the cav-ity using a movable metal plate (often in the form of a propeller), it is possible to ensure that the radiated power can be detected regardless of the direction in which it is sent. Traditional reverberation chambers for EMC usually have an accuracy of not better than 3. dB in standard deviation (STD). This is much too high an uncertainty to measure antenna efficiency, radiated power, or receiver sensitivity, although it is quite sufficient for EMC measurements.
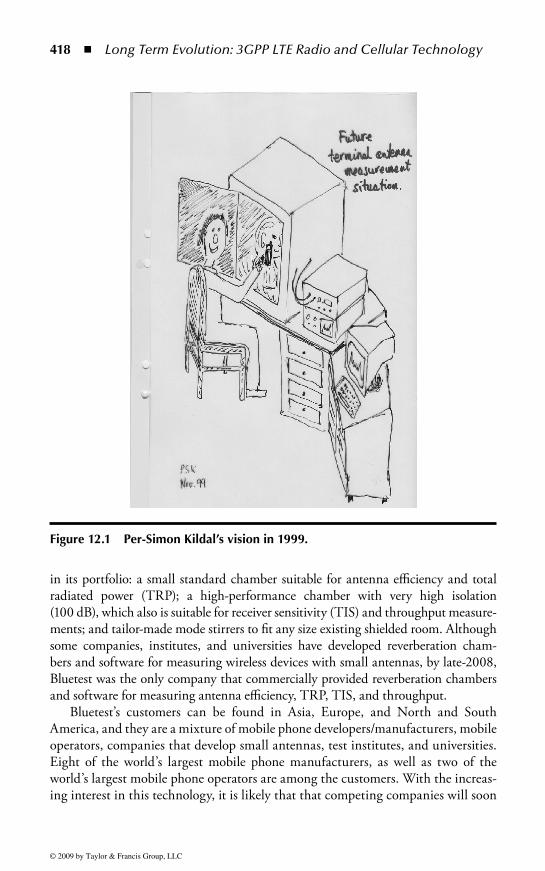
At the end of the 1990s, Professor Per-Simon Kildal at the antenna group at Chalmers University of Technology, Gothenburg, Sweden, had an idea of how to improve the accuracy of reverberation chambers so that they could be used to mea-sure antenna efficiency, radiated power, and receiver sensitivity of small antennas and wireless terminals with small antennas [8]. The origin of the idea was the com-prehension that the traditional way of measuring antennas in anechoic chambers was not at all suited for small antennas or wireless terminals with small antennas (e.g., mobile phones) because they are normally used in environments with multiple paths (i.e., indoors or in urban areas). It also opened up the possibility to develop a very small test chamber that the antenna engineer could use at his desk (see Figure 12.1).
The vision of a very small measurement facility that would give future antenna engineers the possibility to design antennas at their desks led to the creation of the company Bluetest AB in 2000 [9]. Bluetest AB and Chalmers University of Technology worked very closely together for many years to develop and gradually improve the reverberation chamber technology. Today, Bluetest has three products
AU7210.indb 417 3/3/09 1:52:51 PM
© 2009 by Taylor & Francis Group, LLC
418 ◾ Long Term Evolution: 3GPP LTE Radio and Cellular Technology
in its portfolio: a small standard chamber suitable for antenna efficiency and total radiated power (TRP); a high-performance chamber with very high isolation (100 dB), which also is suitable for receiver sensitivity (TIS) and throughput measure-ments; and tailor-made mode stirrers to fit any size existing shielded room. Although some companies, institutes, and universities have developed reverberation cham-bers and software for measuring wireless devices with small antennas, by late-2008, Bluetest was the only company that commercially provided reverberation chambers and software for measuring antenna efficiency, TRP, TIS, and throughput.
Bluetest’s customers can be found in Asia, Europe, and North and South America, and they are a mixture of mobile phone developers/manufacturers, mobile operators, companies that develop small antennas, test institutes, and universities. Eight of the world’s largest mobile phone manufacturers, as well as two of the world’s largest mobile phone operators are among the customers. With the increas-ing interest in this technology, it is likely that that competing companies will soon
Figure 12.1 Per-Simon Kildal’s vision in 1999.
AU7210.indb 418 3/3/09 1:52:52 PM
© 2009 by Taylor & Francis Group, LLC

Measuring Performance of 3GPP LTE Terminals ◾ 419
be supplying similar solutions. It is our belief that, in a few years, reverberation chambers will be the preferred test method for fast development and evaluation of wireless devices with small antennas.
12.1.3 Standardization of Measurements in Reverberation Chambers
One of the first organizations to use measurements in reverberation chambers for their quality standard of mobile phones TCO ’01 was TCO Development [10]. They regularly publish TCP (telephone communication power) measurements of mobile phones made in Bluetest’s reverberation chambers at their website (www.mobilelabelling.com) [11]. TCP is the average transmitted power over five commu-nication channels within one GSM or 3.G band. Mobile phones with high TCP and low SAR (specific absorption rate), are recommended by TCO Development.
The 3.GPP has included measurements of UMTS (universal mobile telecom-munications system) terminals in reverberation chambers in the 3.GPP TR 25.914 V7.0.0. technical report [12] as an alternative to measurements in anechoic cham-bers. In this report, basic parameters of reverberation chambers for measurements of the radio performance of a 3.G terminal are described. The calibration of rever-beration chambers and the measurement method are described in some detail.
CTIA (formerly Cellular Telephone Industries Association, now CTIA—The Wireless Organization [13.]) has, since late 2007, worked to standardize measure-ments of TRP and TIS in reverberation chambers. Traditionally, all CTIA stan-dards for measurements of TRP and TIS of various wireless systems have been specified in anechoic chambers. Measurements of TRP and TIS of mobile terminals in anechoic chambers are described in reference 14. The new standard for TRP and TIS measurements in reverberation chambers is scheduled to be ready in 2009.
In mid-2008, no standards existed to measure MIMO capacity, diversity gain, or system throughput for wireless devices; this includes the effects of multiantenna solutions, which can be significant in a reflective environment. The reverberation chamber is a very good candidate for a suitable reflective reference environment, where repeatable tests of these parameters can be done rapidly and with good accuracy.
12.1.4 Chapter OutlineThis chapter will use a hands-on approach and start by reviewing basic properties of reverberation chambers and giving an overview of ongoing research and benchmark-ing activities. It will then describe how to calibrate reverberation chambers and how they are used to measure antenna efficiency, TRP, and TIS—important parameters for all wireless devices with small antennas, including 3.GPP LTE terminals and small base stations. It will also describe how, using a multiport network analyzer,
AU7210.indb 419 3/3/09 1:52:53 PM
© 2009 by Taylor & Francis Group, LLC

420 ◾ Long Term Evolution: 3GPP LTE Radio and Cellular Technology
diversity gain and MIMO capacity can be measured directly in the Rayleigh envi-ronment in about 1 minute, compared to hours or more using other technolo-gies. The first repeatable system throughput measurements in a reflective reference environment (i.e., the reverberation chamber) will be described. The chapter will end by describing several new ways of measuring 3.GPP LTE parameters and tech-nologies mainly simulated in software today because real-life measurements (e.g., drives tests) are too complicated and time consuming. However, many of these parameters, such as MU-MIMO, opportunistic scheduling, and multibase station handover, should be easy to measure in the reverberation chamber.
12.2 Basic Properties of Reverberation ChambersThe reverberation chamber [7] has been used for EMC testing of radiated emis-sions and immunity for about three decades. It is basically a metal cavity that is sufficiently large to support many resonant modes, and it is provided with means to stir the modes so that a statistical field variation appears. It has been shown that the reverberation chamber represents a multipath environment similar to what we find in urban and indoor environments. Therefore, during recent years it has been developed as an accurate instrument for measuring desired radiation properties for small antennas as well as active mobile terminals designed for use in environments with multipath propagation.
When a signal is transmitted from a base station to a mobile terminal in a com-plex environment, the signal will take different wave paths because large, smooth objects between the antennas will cause reflections, edges on objects will cause dif-fraction, and small irregular objects will cause scattering of the waves originating from the transmitting antenna. The wave contributions via these paths will add at the receiver, and, because their complex amplitudes (i.e., amplitudes and phases) are independent, they may add up constructively or destructively, or anything else between these two extremes. The wave paths and the complex amplitudes will also change in time, due to the moving of the terminal or objects in the environment, and therefore the received signal will vary with time. This is referred to as fading.
The multipath environment at the receiver can be characterized by several inde-pendent plane waves. The independence means that amplitudes, phases, and polar-izations, as well as the angles of arrival (AoA), are arbitrary to each other. If an LOS signal is absent and the number of incoming waves is large enough (typically a few hundreds), the in-phase and quadrature components of the received complex signal become normally distributed. This means that their associated magnitudes get a Rayleigh distribution, the power gets an exponential distribution, and the phases get a normal distribution over 2p. This is a direct result of the central limit theorem. In the left part of Figure 12.2 is shown an example of a Rayleigh signal as a function of time. We see that the signal level varies by more than 25 dB. Another way to illustrate the Rayleigh fading is to plot the cumulative (probability) density
AU7210.indb 420 3/3/09 1:52:53 PM
© 2009 by Taylor & Francis Group, LLC

Measuring Performance of 3GPP LTE Terminals ◾ 421
function (CDF), as shown in the right part of Figure 12.2. The plot shows the cumulative probability of signal amplitudes in decibels, where the reference level is defined as the total received power divided by the number of samples (i.e., the aver-age received power). As an example, we can see that the probability of having dips deeper than –20 dB is about 1%.
In a real environment, we might have a certain AoA distribution in both the elevation and azimuth planes. However, it is natural to assume that the mobile terminal can be arbitrarily oriented relative to directions in the horizontal plane, which means that the azimuth angle is uniformly distributed. We can also assume that the terminal has a preferred or most probable orientation relative to the verti-cal axis and, in addition, common environments (in particular, outdoor) have a larger probability of waves coming in from close-to-horizontal directions rather than close-to-vertical directions. Therefore, we might need an elevation distribu-tion function to describe real multipath environments. Real environments nor-mally also have a larger content of vertical polarization than horizontal because most base station antennas are vertically polarized. In propagation literature, this is characterized by cross-polar power discrimination (XPD) [1].
Because both the AoA distribution and XPD are different in different real environments, the performance of antennas and mobile terminals depends on where they are used or measured. This means that results from measurements in one environment cannot easily be transferred to another. Instead of measuring in real environments, it could be advantageous to do measurements in a reference environment with well-defined properties that gives repeatable results. One such reference environment is the isotropic environment, which has uniformly distrib-uted polarization as well as a uniform AoA distribution over the whole sphere.
Time (s) –30 –20 –10 0 10
10–3
10–2
10–1
100
eoreticalRayleigh distribution
Simulated
Normalized Signal Amplitude (dB) 0.5 1 1.5 2 2.5 3 3.5 0
–25
–20
–15
–10
–5
0
5
dB
Figure 12.2 Example of a fading signal (left) and its CDF function (right). The sig-nal levels are presented in decibels after being normalized to the time-averaged power.
AU7210.indb 421 3/3/09 1:52:53 PM
© 2009 by Taylor & Francis Group, LLC

422 ◾ Long Term Evolution: 3GPP LTE Radio and Cellular Technology
The reverberation chamber emulates such an isotropic environment. The isotropic reference environment has no counterpart in reality, but still it could be representa-tive because any environment will appear isotropic if the mobile terminal is used with arbitrary orientation in the environment.
The basic measurement setup in a reverberation chamber that is used for cali-bration as well as for measuring passive antenna performance is shown in the left part of Figure 12.3..
The reverberation chamber is large in terms of the wavelength at the frequency of operation, which means that several modes are excited. It can be shown that each mode in a rectangular cavity can be expressed as eight plane waves [15] and that the directions of arrival of these plane waves are uniformly distributed over the unit sphere, if enough modes are excited. By stirring the modes, the set of incoming plane waves seen by an antenna in the chamber will change, as will how they com-bine to the received signal. The result is a signal that is fading. When the stirring is done properly, the resulting environment in the chamber will represent an isotropic multipath environment (i.e., the desired reference environment mentioned earlier). The key is the mode stirring, which can be done in different ways. The chamber shown in Figure 12.3. has the following stirring capabilities:
Mechanical stirring is done by means of two metal plates that can be moved ◾along a complete wall and along the ceiling by step motors. The larger the volume is that the stirrers cover, the better.In platform stirring [16], the antenna or mobile terminal under test is placed ◾on a rotatable platform that moves the device under test to different posi-tions in steps. This stirring method is very effective, in particular in small chambers.
NetworkAnalyzer
1
D EF
C
BA
Switch
2
Figure 12.3 Drawing (left) and photo (right) of the Bluetest standard reverbera-tion chamber, shown with open door. The drawing shows the setup for measuring MIMO system capacity, and the photo shows the setup for measuring radiated power of a mobile phone close to the head phantom. The chamber size shown allows for use down to 850 MHz with 25 MHz frequency stirring.
AU7210.indb 422 3/3/09 1:52:55 PM
© 2009 by Taylor & Francis Group, LLC

Measuring Performance of 3GPP LTE Terminals ◾ 423
In polarization stirring [17], the transmissions between the device under ◾test and each of three orthogonal wall-mounted antennas are measured successively. Thus, a good polarization balance is achieved.
An additional, very effective stirring method is referred to as frequency stirring. This corresponds to averaging the measured quantity over a frequency band and is done during the processing of measured results.
12.2.1 Basic Measurements—Reflection and Transmission Coefficients
Figure 12.4 shows how the reflection S11 and the transmission S12 between two antennas inside the chamber are measured. From physics it can be argued that S11 of the antenna under test must consist of two contributions: one the S a
11 from the antenna itself, as if it were located in free space, and the other S c
11 due to the chamber; thus:
S S Sa c
11 11 11= + (12.1)
The S a11 contribution is deterministic, whereas S c
11 is random as a result of the mode stirring in the chamber. If the number of independent values of S c
11 is large enough, it must get a complex Gaussian distribution with a zero mean. Therefore, it is possible to determine S a
11 by complex averaging the measured S11 over all stirrer positions [18]:
SM
S Sa11 11 11
1= =∑stirrerpos
(12.2)
S11 S22
S21
S12
Excitation antenna
AUT
–1 0 1–1
0
1
Real
Imag
inar
y
Deterministic part
Figure 12.4 Example of measured S-parameters of two antennas in a reverbera-tion chamber as a result of mode stirring and illustration of the deterministic and random contributions to them.
AU7210.indb 423 3/3/09 1:52:58 PM
© 2009 by Taylor & Francis Group, LLC

424 ◾ Long Term Evolution: 3GPP LTE Radio and Cellular Technology
Using the same argument, the transmission coefficient S21 must also consist of two parts: one deterministic S d
11 the same as in free space, and another statistic part S c
11 due to the chamber; that is,
S S Sd c
21 21 21= + (12.3.)
The deterministic part S d11 in Equation (12.3.) represents the direct coupling
between the transmitting and receiving antennas in the chamber; because we would like the chamber to provide an isotropic reference environment with Rayleigh fad-ing, it should be as low as possible. The direct coupling is given by the free space transmission formula, also known as Friis transmission formula (see, for example, Kildal [19]):
Sr
G Gdt r21
22
4=
λπ
(12.4)
where r is the distance between the antennas, l is the wavelength, and Gt and Gr are the realized gains of the two antennas, respectively, in the direction of the opposite antenna. From Equation (12.4) it can be understood that the main lobes of the antennas should not point toward each other. If the direct coupling, S d
11, is much smaller than the chamber contribution, S c
11, to the total transmission, S21, the chamber provides a Rayleigh fading environment. Effective methods to reduce the direct coupling include platform stirring, polarization stirring, and using fixed antennas that have nulls in the direction of the antenna under test (AUT).
The transmission between two antennas in free space is governed by the Friis transmission formula (12.4). The corresponding formula for transmission between two antennas in a reverberation chamber is described by Hill’s transmis-sion formula [20], which is valid under the assumptions that the direct coupling is negligible and that the chamber is large with many modes excited. We choose to refer to Hill’s formula as the chamber transfer function and to present it in the following form:
G SPP
c e eVf fchamber
c r
t
rad rad= = =21
23.
1 22 216π D
(12.5)
wheref is the frequency;c is the speed of light;V is the chamber volume;erad1 and erad2 are the total radiation efficiencies (i.e., including mismatch) of the
two antennas; andDf is the average mode bandwidth.
AU7210.indb 424 3/3/09 1:53:00 PM
© 2009 by Taylor & Francis Group, LLC

Measuring Performance of 3GPP LTE Terminals ◾ 425
The mode bandwidth Df consists of four additive contributions due to losses in the walls, leakage through apertures and slots, antennas in the chamber, and absorbing objects in the chamber:
D D D Df f f fwallallwalls
leakageallslots
antenna= + +∑ ∑aallantennas
objectall lossyobjects
f∑ ∑+ D
(12.6)
with
D D Df AV
c ff
cV
fc e
wall leakage antenna= = =23. 4
13.ρ
πησπ
, , rradobject aVf
f cV16 22 2π π
σ, D =
(12.7)
whereV is the chamber volume;h is the free space impedance;A is the area of conducting surfaces (chamber walls, plate stirrers, etc.) with
surface resistance r;sl is the leakage cross-section of apertures and slots; andsa is the absorption cross-section of absorbing objects.
The total mode bandwidth, Df, for practical chambers can be very different, corresponding to Q-values between 3.0 and several thousands (Q = f/Df ). When measuring active terminals, it is important that Df is larger than the modulation bandwidth; otherwise, measurement errors might appear.
12.2.2 Transmission Level and CalibrationIn practice, a measurement of radiation efficiency, radiated power, or receiver sensitivity is based on first determining the chamber transfer function given by Equation (12.5) by using a reference antenna with known radiation efficiency erad2. Because we would like to have the same mode bandwidth, Df, during the calibration as well as during the actual measurement of the AUT, it is important that the AUT is present in the chamber with its port terminated in a matched load during the calibration. The actual measure-ment will then be done by terminating the reference antenna in a matched load and measuring the transmission to the AUT. The ratio between the average transfer func-tions for these two cases will be equal to the ratio between the radiation efficiency of the reference antenna and the AUT. The radiation efficiency erad1 of the fixed antenna does not need to be known because it will be the same for both measurements. See specific sections that follow for detailed calibration and efficiency measurement procedures.
It is also possible to calibrate the chamber without having the AUT in the chamber. For this case, the reference antenna should be removed when the AUT
AU7210.indb 425 3/3/09 1:53:01 PM
© 2009 by Taylor & Francis Group, LLC

426 ◾ Long Term Evolution: 3GPP LTE Radio and Cellular Technology
is measured. This is a simplified procedure with the advantage that we can use the same calibration when measuring several AUTs. In particular, this procedure is simpler when measuring many active terminals. It should be noted that this simpli-fied method only works if the chamber is loaded so much that the reference antenna and AUT do not represent any significant contribution to the mode bandwidth Df of the chamber. If this is not the case, the results of the measurements may be wrong because the chamber transfer function will not have a linear dependence on erad of the reference antenna and the AUT. This may in particular happen if the reference antenna or the AUT is made of materials that absorb radiation and thereby increase the mode bandwidth even when the antenna ports are open or short-circuited.
If we remove the free space mismatch efficiencies from Equation (12.5), we get an average chamber transfer function that varies more slowly with frequency. This can then be frequency stirred for better accuracy without losing resolution due to variations in the mismatch efficiency. The free space input reflection coefficients of the two antennas can be obtained by complex averaging of the S11 and S22, as given by Equation (12.2), and the mismatch-corrected chamber transfer function is defined by
GN
S
S Schamber
c
N
=−( ) −( )∑1
1 121
2
112
222| | | |
(12.8)
where N is the number of stirrer positions and | |S c21
2 is given by Equation (12.5).
12.2.3 Accuracy and Number of Independent SamplesIn order to perform accurate measurements in the reverberation chamber, we need the chamber transfer function (12.5) to be proportional to the radiation efficiency independently of which antenna or terminal we measure. This is possible only if the mode stirring creates enough independent samples. The S21 samples are, for sufficient independent samples, complex normally distributed. Then the relative accuracy by which we can estimate Gchamber has a standard deviation of [21]
σ = 1/ Nind (12.9)
where Nind is the number of independent samples. This means that we need Nind = 100 for an accuracy of ±10% (i.e., ± 0.5 dB). The number of independent samples is determined primarily by the mode density in the chamber (i.e., by the number of modes per megahertz). This is, to a good approximation, given by the classical formula
∂ ∂ =N f Vf cemod / /2 3.8π (12.10)
AU7210.indb 426 3/3/09 1:53:02 PM
© 2009 by Taylor & Francis Group, LLC

Measuring Performance of 3GPP LTE Terminals ◾ 427
The number of independent samples is proportional to the mode density, but the proportionality constant is not known because it depends on chamber load-ing, mode stirring methods, mechanical stirrer shapes, and the shape of the cham-ber. A preliminary experimental study has been performed [22], but more work is required to get unique and simple conclusions. However, we can preliminarily state the following relation between the mode density and the number of independent samples:
N N f f Bind e≤ ∂ ∂ +8[ / ]( )mod D (12.11)
where B is the bandwidth of the frequency stirring. The factor 8 is due to plat-form stirring and is based on empirical experience as well as physical reasoning. It is clear from Equations (12.9) and (12.11) that the accuracy in a given chamber can be controlled by Df and B. However, it should be noted that other effects are coming in when the loading is very large, so some care must be taken. Still, we have experienced a good Rayleigh distribution with many independent samples in a heavily loaded chamber with Q as low as 3.0 [23.]. The problem with frequency stirring B is that the frequency resolution becomes worse. For antenna measure-ments, this means that we cannot resolve variations in the radiation efficiency that are faster than B. In practice, the resolution is somewhat better by using the mis-match-corrected chamber transfer function (12.8) before power averaging because mismatch efficiencies normally vary more quickly with frequency than efficiencies due to ohmic losses.
12.2.4 Research Activities on Reverberation ChambersThe reverberation chamber has been used for more than 20 years for EMC mea-surements like electromagnetic susceptibility and emissions, as described in the overview article by Bäckström, Lundén, and Kildal [7]. Its basic theories are well understood due to several papers by D. Hill at the National Institute of Standards and Technology (NIST) in Boulder, Colorado [20,25,26]. The main EMC appli-cation has been to generate high field strength for susceptibility testing. During the last 7 years, Kildal’s antenna group at Chalmers University of Technology has developed the reverberation chamber into a more accurate instrument for measur-ing the characteristics of desired radiation of small antennas and active mobile terminals—in particular when these are intended for use in multipath environ-ments with Rayleigh fading, such as for wireless/mobile communications in urban or indoor environments.
The reverberation chamber was known to create Rayleigh fading when the modes were stirred [24] by mechanical movement of plates or shaped wires (mechani-cal stirrers). Kildal’s group showed that the modes represent plane waves with an omnidirectional distribution of directions of incidence [15]. Thus, the reverberation
AU7210.indb 427 3/3/09 1:53:02 PM
© 2009 by Taylor & Francis Group, LLC

428 ◾ Long Term Evolution: 3GPP LTE Radio and Cellular Technology
chamber corresponds to an isotropic multipath environment with uniform eleva-tion distribution of the angles of arrival. Real environments may be more complex, with a certain polarization imbalance and an elevation distribution, but the uni-form isotropic environment is an excellent, well-defined reference environment, making it possible to characterize the antennas and terminals in terms of classi-cal antenna quantities such as radiation efficiency and radiated power. Therefore, the goal was to improve the isotropy. In particular, a polarization imbalance was detected and removed by using three orthogonal wall antennas [17].
The accuracy of the measurements increases with the number of modes that are excited (i.e., with the mode density). This generates a certain lowest frequency of operation for specified measurement accuracy. Kildal’s group found that the accuracy could be considerably improved by making use of a new stirring method, referred to as platform stirring [16]. When this stirring method was used, the radia-tion efficiency of small antennas and radiated power of mobile terminals could be measured with an accuracy of 0.5-dB RMS (root mean square) [27] in a small reverberation chamber. This was carefully validated by comparison with measure-ments in anechoic chambers [28] and larger reverberation chambers [27].
The reverberation chamber generates a Rayleigh distribution. Therefore, the chamber is particularly well suited for characterizing antenna and terminal functions specific for such environments, as described in Kildal and Rosengren [29]. Actually, the radiation patterns play no role in such environments because many interfering waves contribute to a statistical wave channel. The characterizing parameter is, for single-port antennas, the classical radiation efficiency, including contributions from mismatch, ohmic losses in nonperfect materials of the antenna and terminal itself, and losses in nearby objects such as a user’s hand or head. It is important to note that these quantities will be the same as when they were measured in a “free space” environment like an anechoic chamber. Even the antenna impedance mea-sured in the reverberation chamber will appear the same as when it is measured in free space, after the processing of the complex S-parameters acquired over all stirrer positions [18]. Future terminals will, to higher degree, make use of antenna diversity to remove the problems of fading dips where the terminal may not work (i.e., outage), and the corresponding diversity gain (or, in other terms, reduction in outage probability) can directly be measured by reverberation chamber tests when evaluating the multiport antennas themselves [3.0,3.1] and when diversity is imple-mented in active mobile terminals [3.2].
The future mobile communication systems could make use of multiport anten-nas with even more advanced functions than antenna diversity for both uplink and downlink (i.e., MIMO antenna systems). MIMO antenna systems are character-ized in terms of the maximum available capacity, which also can be measured in the reverberation chamber [29,3.3.]. In order to characterize both diversity and MIMO systems correctly, complete equivalent circuits of antennas are needed on reception (see Section 2.5 in Kildal [19]).
AU7210.indb 428 3/3/09 1:53:03 PM
© 2009 by Taylor & Francis Group, LLC

Measuring Performance of 3GPP LTE Terminals ◾ 429
Mobile terminals were initially characterized only on transmit, whereas in the last few years the receive function has gained more attention. This is characterized by the input signal level giving a certain specified bit error rate (BER) or frame error rate (FER) for code division multiple access (CDMA) systems. When averaged over directions in the radiation pattern, the limiting static signal level is referred to as the total isotropic sensitivity (TIS). An alternative in reverberation chambers is to measure BER/FER during continuous fading to determine what Kildal’s group refers to as average fading sensitivity (AFS) [3.4]. The AFS can also be used to deter-mine the TIS because there seems to be a fixed, system-specific relation between the two values. The AFS is a more realistic performance parameter than TIS and can be measured much faster.
The reverberation chamber needs further development, in particular in relation to controlling bandwidth and improving accuracy. The latter is needed in order to allow measurements of terminals for some wideband mobile communication systems. Therefore, in a research project we have developed a numerical model of the chamber to study accuracy in loaded chambers. The focus was not on detailed modeling of a specific real chamber but, rather, on defining a simplified numerical chamber that can be simulated much more efficiently and thereby is more conve-nient for studying fundamental properties of mode stirring and loading [3.5,3.6]. This work was supported by experimental work on chamber loading [23.] and stud-ies of Hill’s formulas for how loading affects the Q and average mode bandwidth [3.7]. At the moment, no one else in the world is able to do such extensive computa-tions on reverberation chambers.
The reverberation chamber group at FOI in Sweden has recently conducted important studies related to stirrer efficiencies and accuracy [3.8,3.9]. Over the past years, the reverberation chamber group at NIST has started to do studies of wireless measurements in reverberation chambers as well [40]. Other groups are also taking up research on wireless measurements in reverberation chambers, such as the group at the University of Naples [41]. One PhD student from the group in Naples has recently spent 3. months at Chalmers doing research together with Kildal’s group. The interest in the reverberation chamber measurement technology has spread worldwide. Several leading world mobile phone and wireless systems companies are today using Bluetest reverberation chambers for measuring antennas, radiated power, or receiver sensitivity when developing wireless terminals.
The main interest of most university groups using reverberation chambers is that the chamber can be used to measure diversity gain and capacity of multi-port antennas. We have coauthored one journal article [42] and several conference papers about such diversity antenna characterization.
CTIA—The Wireless Organization—an international nonprofit member-ship organization founded in 1984 that represents all sectors of wireless commu-nications (cellular, personal communication services, and enhanced specialized mobile radio)—has started standardization of reverberation chambers for wireless
AU7210.indb 429 3/3/09 1:53:03 PM
© 2009 by Taylor & Francis Group, LLC

430 ◾ Long Term Evolution: 3GPP LTE Radio and Cellular Technology
measurements and has invited Bluetest AB to participate as a guest member. The main objective has been to develop initially good calibration procedures, and Bluetest has received an initial acceptance for the approach that it is using, which is the best that can be done at the moment. NIST is also in the CTIA Reverberation Chamber Subgroup and supports the Bluetest approach, which is natural because both research groups are based on the same fundamental papers by Hill [20,25,26].
12.2.5 Benchmarking of Reverberation with Anechoic Chambers
During the first years of development of the reverberation chamber into an accu-rate instrument for antenna and terminal measurements, it was found that the accuracy could be considerably improved by making use of new stirring methods, referred to as platform stirring [16] and polarization stirring [17]. Using these stir-ring methods, the radiation efficiency of small antennas and radiated power of mobile terminals could be measured with an accuracy of 0.5-dB RMS [27] in a small reverberation chamber. This was carefully validated by comparison with mea-surements in anechoic chambers [28] and larger reverberation [27]. More recently, several reverberation chambers of different sizes participated in a round-robin test within the framework of ACE (European Antenna Center of Excellence) [43.]. The basic idea was to collect data from different test facilities around Europe for pas-sive as well as active test devices and to compare the results. The focus was on the most popular frequency bands typically used in mobile communications systems. In total, 12 organizations participated in the measurement campaign and 5 used reverberation chambers. In order to guarantee comparable results, only one test kit was sent around (see Figure 12.5).
In order to define simple and repeatable test cases for the round robin, passive antennas consisting of half-wavelength dipoles for 900-, 1800-, and 2400-MHz bands and a slot antenna for the 5.2-GHz band were used. In order to account for losses in objects close to the terminal antenna (e.g., resembling the head of a mobile phone user), the test fixture consisted of a lossy cylinder and an adjustable antenna mount (Figure 12.5). The cylinder contains a lossy liquid and is sealed so that all participants measure under the same conditions. The distance between the antenna and the cylinder can be adjusted, so the radiation efficiency can be varied. The distance can accurately be read on a scale on the antenna mount so that repeat-ability is guaranteed. All antennas are measured for free space conditions as well as at different distances from the lossy cylinder using the fixture.
In order to measure diversity gain, the same fixture can be used, but in this case with two dipoles mounted. As active devices, a triple-band GSM phone, a WCDMA phone, and a small active device for the 1.785-GHz band were used. The phones are standard phones equipped with special software that makes them radiate at full power. The channel can be set by using the key pad, so the phones
AU7210.indb 430 3/3/09 1:53:03 PM
© 2009 by Taylor & Francis Group, LLC

Measuring Performance of 3GPP LTE Terminals ◾ 431
are usable even without a base station emulator. It is therefore possible to measure them at test facilities that do not have such emulators. Both phones have an external antenna connector so that the output power delivered directly from the transmit amplifier can be measured before and after the radiated power measurements. This is done in order to ensure that changes in battery power do not affect measured results and to ensure that nothing has happened to the phones during the course of the round robin.
For both the phones and the small active device, the total radiated power is measured for free space conditions and when the phone is located in a talk posi-tion close to a head phantom. The same types of phones are used for the receiver sensitivity measurements. For this case, the phones are standard phones with the original software, and it is therefore necessary to use a base station emulator. These measurements are also done for free space conditions and for a talk position with the phone close to a head phantom.
The round robin was organized in such a way that the participants would not know which organizations had already performed their measurements, in order to guarantee that no one had access to results beforehand. The participants used differ-ent measurement methods, including three-dimensional radiation pattern integra-tion in fully anechoic chambers, spherical near-field methods, a random positioner system, and reverberation chambers. The results from the measurement campaign show that the reverberation chamber gives accurate and repeatable results for pas-sive antenna parameters as well as active terminal parameters such as total radiated power and total isotropic sensitivity. Results can be found in the journal article by
Figure 12.5 Test kit used in the round-robin campaign, together with suitcase used for shipping.
AU7210.indb 431 3/3/09 1:53:04 PM
© 2009 by Taylor & Francis Group, LLC

432 ◾ Long Term Evolution: 3GPP LTE Radio and Cellular Technology
Carlsson [44], the conference articles [45–48], and the final ACE report, which can be found via the ACE website [43.].
12.3 Calibration of the Reverberation ChamberThe main parameter to calibrate in a reverberation chamber is the average power transmission over a complete stirrer sequence. This will be determined by the amount of loss present in the chamber cavity (as described in the preceding sec-tions), so it is of great importance to keep the same power-absorbing objects in the chamber during the calibration measurement as when the measurement of the actual test unit is performed.
For the calibration measurement, a reference antenna with known radiation efficiency must be used. Dipole antennas are convenient for this because of their predictable efficiency and low gain. For broadband measurements, antennas with higher bandwidth are preferred. An example of a broadband antenna suitable for use as a reference antenna in reverberation chamber measurements is the discone antenna. The reference antenna is preferably mounted on a low-loss dielectric stand to avoid reduction of the radiation efficiency of the reference antenna. The reference antenna must also be placed in the chamber in such a way that it is far enough from any walls, mode stirrers, chamber loading, or other object so that the environment for the reference antenna, taken over the complete stirring sequence, resembles a free space environment. For low-gain antennas, like dipoles, the free space condi-tion is achieved by keeping the reference antenna a distance of half a wavelength from any reflecting object (such as metallic walls and stirrers) and 70% of a wave-length from any absorbing object (such as a head phantom).
The procedure presented here is based on using a vector network analyzer (VNA). The instrument is configured so that port 1 is connected to the fixed-mea-surement antenna and port 2 to the reference antenna (see example in Figure 12.6). The procedure can be performed in the following steps:
1. Place all objects that will be used in the test measurement inside the chamber.
2. Place the reference antenna in the chamber, keeping the distance from other objects as described before.
3.. Calibrate the network analyzer with a full two-port calibration so that transmission between the antenna ports of the fixed-measurement antenna and the reference antenna can be measured accurately.
4. Connect the antennas and measure S11, S22, and either S21 or S12 for each of the mode-stirrer positions defined in the stirrer sequence.
5. Calculate the average power transfer function and antenna mismatches as described next.
AU7210.indb 432 3/3/09 1:53:04 PM
© 2009 by Taylor & Francis Group, LLC

Measuring Performance of 3GPP LTE Terminals ◾ 433
Calculate the mismatch correction parameter for the fixed-measurement antenna by taking a complex average of the measured S11 samples:
SN
S nn
N
11 111
1==
∑ ( )
(12.12)
where N is the total number of measured samples, and n is the sample index. Equation (12.12) will give a reflection value equivalent to the free space reflection of the antenna because the complex averaging will cancel chamber reflections, as described in the basic measurements section earlier.
The corresponding power correction factor Rfix (i.e., the power lost due to reflec-tions on the antenna port) can then be calculated as
R Sfix = −1 11
2| | (12.13.)
Equivalently, the free space mismatch and power correction coefficient for the reference antenna can be calculated by the following equations:
SN
S nn
N
22 221
1==
∑ ( )
(12.14)
R Sref = −1 22
2
(12.15)
Reference antenna
Modestirrer/tuner
Reverberation ChamberFixed-measurement antenna
VNA calibration points
Vector network analyzer
Port 2Port 1
Figure 12.6 Schematic setup for calibration measurements in the reverberation chamber.
AU7210.indb 433 3/3/09 1:53:06 PM
© 2009 by Taylor & Francis Group, LLC

434 ◾ Long Term Evolution: 3GPP LTE Radio and Cellular Technology
The reference transfer function Gref represents the average net power transmis-sion in the chamber (i.e., corrected for mismatch on both transmit and receive antenna), as well as radiation efficiency of the reference antenna. Calculate the reference transfer function by the following equation:
G NS n
R Rref
nN
fix ref ref
=∑
⋅=
111 21
2| ( )|
η
(12.16)
where href is the radiation efficiency of the reference antenna, and N, n, Rfix, and Rref are as defined before. Note that Gref can be conveniently used to determine the quality factor or, equivalently, the average mode bandwidth of the cavity, as shown in Equation (12.5). The application of the calibration on measurement data is shown next for each specific measurement case.
12.3.1 Measurement of Antenna EfficiencyRadiation efficiency is an important parameter for all different types of antennas. For electrically small antennas used in various multipath scattering environments, it is, in fact, the dominating factor for the antenna performance. Classically, radia-tion efficiency is defined as the radiated power from an antenna structure divided by the power delivered to the antenna [19] (i.e., a measure of the loss in the antenna structure itself). In this text, the term total radiation efficiency is used to describe the efficiency of an antenna including its mismatch loss. Total radiation efficiency is thus defined as the radiated power from an antenna structure divided by the total available power at the antenna port.
A basic property of the reverberation chamber is that the average received power of an antenna, taken over a complete stirrer sequence, is proportional to the total radiation efficiency of the antenna. Radiation efficiency can therefore be measured by a relative measurement, where the average received power for the test antenna is compared to the average received power for a reference antenna with known radia-tion efficiency.
The radiation efficiency measurement procedure is similar to the calibration mea-surement procedure described earlier and can be summarized in the following steps:
1. Perform the calibration measurement procedure as described in the previ-ous section, including the calculations of mismatch and reference transfer function.
2. Replace the reference antenna with the test antenna and repeat the measure-ment procedure (i.e., sample S11, S21, and S22) for each stirrer position. If the fixed-measurement antenna is the same as in the calibration measurement, there is no need to remeasure S11, and only S21 and S22 need to be samples.
3.. Calculate the antenna mismatch and radiation efficiency for the test antenna as described in the following.
AU7210.indb 434 3/3/09 1:53:07 PM
© 2009 by Taylor & Francis Group, LLC

Measuring Performance of 3GPP LTE Terminals ◾ 435
Equivalently to the calculations for the preceding reference transfer function, the test antenna mismatch, mismatch power correction, and average transfer func-tion are calculated as shown in the following equations:
SN
S ntest testn
N
22 221
1, , ( )=
=∑
(12.17)
R Stest test= −1 22
2| |, (12.18)
GS n
R RtestN n
N
fix test
=∑ =
11 21
2| ( )|
(12.19)
The radiation efficiency is then directly given by
η =GG
test
ref (12.20)
and the total radiation efficiency is given by
η ηtot testtest
reftestS
GG
R= ⋅ − = ⋅( | | ),1 222
(12.21)
12.3.2 Measurement of Total Radiated PowerFor active test units, the TRP is determined by the power output from the ampli-fier and the radiation efficiency of the antenna. The TRP is therefore often used as a performance parameter, especially when a cabled connection to the antenna port is difficult. The following description is based on measurements of user equipment (UE) but can be modified to measurements of any kind of equipment by using the appropriate instrumentation.
The TRP measurement procedure is similar to the radiation efficiency proce-dure described earlier; the main difference is that the network analyzer is replaced by a base station simulator and power meter. The base station simulator is used to establish and maintain a connection to the UE and control its traffic channel and output power. The power meter is used to sample the transmitted power and could be a spectrum analyzer, base station simulator with integrated power meter, or a regular power meter—whichever is most suitable in the specific measurement case. Figure 12.7 shows the schematic setup for TRP measurements.
Handheld units are often tested in simulated-use position (e.g., with a head or hand phantom in the close vicinity of the test unit). The reverberation
AU7210.indb 435 3/3/09 1:53:08 PM
© 2009 by Taylor & Francis Group, LLC

436 ◾ Long Term Evolution: 3GPP LTE Radio and Cellular Technology
chamber is very suitable for simulated-use testing due to the simple positioning of test units. In a reverberation chamber, the statistical field uniformity makes it possible to place the test object/antenna in any position and orientation in the chamber, as long as it is far enough from any other object not to give a reduction of the antenna’s radiation efficiency. As described in the calibration procedure earlier, a distance of half of a wavelength from walls and other reflecting objects and 70% of a wavelength from power-absorbing objects is enough for low-gain antennas. This is also true for the combination of a test unit and a head phan-tom, for example; this means that as long as the combination of the two is placed far enough from other objects in the chamber, the effective radiation efficiency that will determine the TRP value is the efficiency of the test unit and the head phantom combined, in the specific relative position they are placed. Note that when head or hand phantoms are used, these objects must also be present in the
Base stationsimulator
Fixed-measurement antenna
Base stationsimulator
Test unit
Power meter
Fixed-measurement antenna
Reverberation Chamber
Reverberation Chamber
(a)
(b)
Mode stirrer/tuner
Modestirrer/tuner
Test unit
Same path for up- and downlink
Separated up- and downlink paths
Figure 12.7 Schematic setups for TRP measurements. Alternative b, with the same up- and downlink paths, can also be used for sensitivity measurements.
AU7210.indb 436 3/3/09 1:53:10 PM
© 2009 by Taylor & Francis Group, LLC

Measuring Performance of 3GPP LTE Terminals ◾ 437
chamber during the calibration, as described in the calibration measurement section previously.
The TRP measurement is performed in the following steps:
1. Perform the calibration measurement procedure as described in the previ-ous section, including the calculations of mismatch and reference transfer function.
2. Measure the transmission loss of the cable connecting the power meter to the fixed-measurement antenna.
3.. Page the test unit and put it to radiate with maximum output power on the traffic channel of interest.
4. Place the unit in the chamber. In the case of simulated-use testing, place the unit in the intended position relative to the tissue-simulating object (e.g., head or hand phantom).
5. Use the power meter to sample the transmitted power in each position of the mode stirrers.
6. Calculate the TRP value by taking an average of all power samples and applying the calibration as described next.
As in the radiation efficiency measurement, the TRP of the test unit is propor-tional to the average transferred power in the chamber. Through the calibration measurement, the average power transmission in the chamber is known, and there-fore the TRP can be calculated with the following equation:
TRPN
P n G R Tn
N
ref fix cable==
∑1
1
( )
(12.22)
whereP(n) is the power samples in stirrer position n;N is the total number of stirrer positions;Tcable is the transmission in the cable connecting the power meter to the fixed-
measurement antenna; andGref and Rfix are as defined in the calibration section before.
Note that the summation is done on decimal power values, even though the results are normally presented in decibels of measured power (dBm) units.
12.3.3 Measurement of Total Isotropic SensitivityTotal isotropic sensitivity is a common way of characterizing an active unit at downlink frequencies. The TIS measurement procedure is standardized by the CTIA organization [14] and an equivalent parameter with measurement procedure;
AU7210.indb 437 3/3/09 1:53:10 PM
© 2009 by Taylor & Francis Group, LLC

438 ◾ Long Term Evolution: 3GPP LTE Radio and Cellular Technology
however, under the name “total radiated sensitivity” (TRS), is standardized by the 3.GPP organization. TIS can be measured in a reverberation chamber by the pro-cedure described here. Instrumentation and setup are similar to the TRP measure-ment case described earlier and shown in Figure 12.7b.
Simplified, the TIS parameter is equal to the conducted sensitivity of the test unit’s receiver degraded by the radiation efficiency of the antenna to which it is connected. In reality, the TIS parameter will also be affected by any interference guided to the receiver by the mechanical structure (including the antenna) of the test unit.
TIS is measured under static signal conditions (i.e., mode stirrers are kept still at each sample point) and the idea is to measure sensitivity due to noise impairment only. Due to the multiple reflections in the reverberation chamber, a delay spread of the incoming signals to the receiver will occur; this can be an added effect to the BER. In cases where the impairment due to signal replicas is unwanted, the actual effect of the delay spread in the present case can be tested prior to the TIS measurement. The test consists of putting the test unit in the chamber, setting up a loopback connection with the base station simulator, and then starting a BER measurement while the output powers of the test unit and base station simulator are both high enough to avoid bit errors due to low SNR. If the BER is zero in this setup, the effect of delay spread is negligible.
The TIS procedure is based on searching for the lowest base station simulator output power in each position of the mode stirrers that gives a BER better than the specified target BER level. The procedure can be done in the following steps:
1. Perform the calibration measurement procedure as described in the cali-bration measurement section, including the calculations of mismatch and reference transfer function.
2. Measure the transmission loss of the cable connecting the base station sim-ulator to the fixed-measurement antenna.
3.. Page the test unit, direct it to the traffic channel of interest, and put it in loopback mode to enable BER measurement.
4. Place the test unit in the chamber. In the case of simulated-use testing, place the unit in the intended position relative to the tissue-simulating object (e.g., head or hand phantom).
5. Set the base station simulator to a specific output power and perform a BER measurement.
6. Increase or decrease the base station output power as needed and repeat step 5 until the lowest output power is found that gives a BER better than the specified target BER.
7. Repeat steps 5 and 6 for each position of the mode stirrers. 8. Calculate the TIS value as described next.
AU7210.indb 438 3/3/09 1:53:11 PM
© 2009 by Taylor & Francis Group, LLC

Measuring Performance of 3GPP LTE Terminals ◾ 439
The TIS parameter is calculated by the following equation:
TISN P n
G R TBSSn
N
ref fix cable=
=
−
∑1 1
1
1
( )
(12.23.)
wherePBSS(n) is the output power from the base station simulator when this is adjusted
to give the specified BER in the test unit for position n of the mode stirrers;
N is the total number of stirrer positions;Tcable is the transmission in the cable connecting the base station simulator to the
fixed-measurement antenna; andGref and Rfix are as defined in the calibration section.
The advantage of the TIS parameter is that it is well defined and commonly used, and the relation to the radiation efficiency of the test unit’s antenna is intuitive. However, TIS measurements are inherently time consuming due to the large number of BER measurements that have to be done during the measure-ment sequence. The fact that TIS is a static measurement and does not include any fading performance can also be considered a disadvantage because the actual TIS performance is not reflected in a real-use performance. This means that units that are optimized for TIS may not be the units that perform best in a real scenario.
12.3.4 Measurement of Average Fading SensitivityAverage fading sensitivity is defined as the lowest average available power during a fading sequence for which the test units have an average BER better than a specified BER limit. As opposed to TIS measurements, AFS is measured under real-time fad-ing conditions. This means that the mode stirrers are continuously moved during the measurement sequence, while the output power of the base station simulator is fixed. By doing this, the test unit will effectively experience a signal varying with Rayleigh distributed amplitudes.
Due to the multiple reflections in the reverberation chamber and the constantly moving stirrers, it is important to have control of the time domain properties of the channel created in the chamber, which may have an effect on the measured BER. This effect may be wanted or unwanted, depending on the specific test situa-tion. For measurements where only noise impairment is considered, it is important to test that there are no irreducible bit errors present (e.g., by a similar procedure as mentioned in the TIS section). It is worth noting that, for AFS measurements
AU7210.indb 439 3/3/09 1:53:11 PM
© 2009 by Taylor & Francis Group, LLC

440 ◾ Long Term Evolution: 3GPP LTE Radio and Cellular Technology
where SNR is the limiting factor, TIS can be derived from the AFS value because there is a theoretical connection between the two values.
The instrumentation and setup for AFS measurements are the same as for the TIS measurements. The procedure can be performed in the following way:
1. Perform the calibration measurement procedure as described in the cali-bration measurement section, including the calculations of mismatch and reference transfer function.
2. Measure the transmission loss of the cable connecting the base station sim-ulator to the fixed-measurement antenna.
3.. Page the test unit, direct it to the traffic channel of interest, and put it in loopback mode to enable BER measurement.
4. Place the test unit in the chamber. In the case of simulated-use testing, place the unit in the intended position relative to the tissue-simulating object (e.g., head or hand phantom).
5. Set the base station simulator to a specific output power. The output power of the base station simulator will determine the average power available for the test unit during the measurement.
6. Put the mode stirrers in a constant movement mode and perform a BER measurement during the sequence. Adjust the number of bits tested so that the BER measurement spans the full mode-stirrer sequence.
7. Increase or decrease the base station output power as needed and repeat steps 5 and 6 until the lowest base station output power is found that gives a BER better than the specified target BER. This specific output power is denoted PBS,lim.
The AFS value is then found by applying the calibration correction data as in the following equation:
AFSP
G R TBS
ref fix cable
= ,lim
(12.24)
Alternatively, step 7 in the previous procedure can be replaced by performing steps 5 and 6 for a number of predefined output powers for the base station simula-tor. This will give a relation between available power and BER for the test unit; by interpolating the data points, the lowest average power needed for a BER better than the specified target limit can be determined.
Among the advantages of AFS measurements are the potential for very fast sensitivity measurements and that the fading property of the measurement gives the possibility to test in a wide range of real-time conditions. The possibility to test in actual fading conditions is very important for modern, multiantenna systems where, for example, the effect of diversity will only show up in such a test.
AU7210.indb 440 3/3/09 1:53:11 PM
© 2009 by Taylor & Francis Group, LLC

Measuring Performance of 3GPP LTE Terminals ◾ 441
12.3.5 Measuring Antenna Diversity GainDiversity is a technique based on the use of more than one antenna that experiences different fading. By choosing or combining the signals of two different antennas, it is possibly to gain more than 10 dB of diversity gain in the worst fading dips appear-ing typically 1% of the time [49]. With additional antennas, even higher diversity gains are possible [50]. It is possible to measure diversity gain with drive tests (i.e., driving or walking with multiple antenna configurations through a fading environ-ment). The problem when one wants to optimize the antenna configuration is that the fading in real environments is always changing and it is not possible to know if the results depend on changes in the environment or changes in the antenna con-figuration. It is also possible to measure diversity gain by measuring each antenna in the antenna configuration separately in an anechoic chamber. After the measure-ments, by using software it is possible to add any type of fading and then estimate the diversity gain [51]. This takes a relatively long time, on the order of 1–2 hours in total. A very efficient alternative is to use the repeatable Rayleigh distribution available in the reverberation chamber. The antenna configuration is positioned in the reverberation chamber, as shown in Figure 12.8.
If possible, a multiport network analyzer is used to measure amplitude and phase of the different antennas in the antenna configuration and the three fixed antennas in the reverberation chamber S1j. For a diversity antenna with two branches, S12 and S13. are measured simultaneously. Both these antenna branches will show a certain probability to have fading below a certain level, usually referred to as the cumula-tive distribution function (CDF). By choosing the best of the measured S12 and S13. at every point in time, one gets a CDF that is called selection combining. It is, of course, possible to use the S12 and S13. to get the CDF of any diversity scheme (e.g.,
Networkanalyzer
1 2
Switch
3
Figure 12.8 Left: drawing of the standard-sized Bluetest reverberation chamber, shown with open door. The drawing shows a setup for measuring diversity gain with a multiport network analyzer. Right: photo of 900-MHz dipoles used in the tests.
AU7210.indb 441 3/3/09 1:53:13 PM
© 2009 by Taylor & Francis Group, LLC

442 ◾ Long Term Evolution: 3GPP LTE Radio and Cellular Technology
maximum ratio combining [MRC]) because both amplitude and phase have been measured. However, in this section we use selection combining.
By taking the difference between the CDF for either S12 or S13. and the CDF for selection combining, it is possible to estimate the “apparent” diversity gain (i.e., how much it is possible to gain in the deepest fading dips), normally at a probability level of 1%, by choosing the best antenna. The most relevant value, though, should be how much one gains in comparison to using an ideal antenna (i.e., to compare the CDF for a single antenna with 100% antenna efficiency with the CDF for selec-tion combining). This is the “effective” diversity gain [3.0]. If one compares with the CDF for a real antenna (i.e., with losses), this is the “actual” diversity gain.
For antenna configurations with large mutual coupling, such as two dipoles moved very close to each other, antenna efficiency will become very low, so what may look like a very good diversity gain (i.e., “apparent” diversity gain) is in reality compared to using just a single antenna that is not at all very good. In Figure 12.9 below one can see that at 11-mm distance between two 900-MHz dipoles, the “effective” diversity gain is only 1.5 dB at the 1% probability level. In this example, more than 90% of the time the diversity configuration will lose signal strength compared to just using a single antenna. In the case of using dipoles, the “effective” and “actual” diversity gains are very similar because a dipole typically has an antenna efficiency of about 95%.
The measurements in Figure 12.9 take only 1 minute to perform in the Bluetest high-performance chamber using a multiport network analyzer. In addition to the
Cum
ulat
ive P
roba
bilit
y
–10–20Relative Received Power (dB)
50 mm Dipole Spacing
Branch 1Branch 2ReferenceSelection comb.
–3010–3
10–2
10–1
100
0
Cum
ulat
ive P
roba
bilit
y
–10–20Relative Received Power (dB)
–3010–3
10–2
10–1
100
0
11 mm Dipole Spacing
Branch 1Branch 2ReferenceSelection comb.
Figure 12.9 “Apparent” and “effective” diversity gain for two parallel dipoles at distances of 11 and 50 mm at 900 MHz. The dashed line corresponds to the fad-ing of a single dipole normalized to 100% efficiency. The distance between the dashed line and the line for selection combining are the “effective” diversity gain, here shown with an arrow. The distance between one of the antenna branches and the line for selection combining is the “apparent” diversity gain.
AU7210.indb 442 3/3/09 1:53:14 PM
© 2009 by Taylor & Francis Group, LLC

Measuring Performance of 3GPP LTE Terminals ◾ 443
“apparent” and “effective” diversity gain, one obtains the radiation efficiency of each antenna as well as the correlation of each. Table 12.1 shows these param-eters for 10 different antenna configurations (i.e., with two dipoles at five different relative angles to each other and at a distance of 15 and 3.0 mm from each other, respectively).
In Table 12.1, we can clearly see that although the apparent diversity gain is relatively high for all configurations, the reduced antenna efficiency makes the effective diversity gain much smaller, especially at close distance or small relative angles. It is also interesting to note that although the correlation between the diver-sity antennas is high only when they are parallel, the effective diversity gain is still affected by mutual coupling at relative angles of 45° and less.
The traditional ways of measuring diversity gain using drive tests or anechoic chambers with software channel modeling are expensive and time consuming. The time spent to measure or estimate the diversity gain can easily be hours. The diver-sity measurements presented in this section have been made in 1 minute—one to two orders of magnitude faster. This kind of measurement speed will allow antenna designers of diversity antennas to work in completely new ways. They will be able to make small changes in the antenna positions or design and more or less imme-diately get feedback of whether or not there has been improvement. In a few years, it will be hard to imagine designing diversity antennas any other way. Companies with reverberation chambers almost always use this method only when designing or evaluating diversity gain.
Table 12.1 Apparent Diversity Gain, Radiation Efficiency, and Effective Diversity Gain at 1% CDF as a Function of Relative Polarization Angle and Distance between Two Dipoles
Relative Angle (deg.)
Distance (mm)
Effective Diversity Gain (dB)
Apparent Diversity Gain (dB)
Radiation Efficiency
(dB) Correlation
0 15 3 8.0 −4.2 0.6330 15 6.5 10.8 −2.5 0.1545 15 7.8 9.4 −1.3 0.0960 15 9 9.8 −0.6 0.1290 15 9.6 9.8 −0.3 0.1
0 30 5.8 10.1 −3.2 0.2130 30 8 9.9 −1.4 0.0245 30 8.1 8.8 −0.9 0.0360 30 9.2 9.7 −0.4 0.0790 30 9.9 10.9 −0.3 0.08
Note: At a relative angle of 0°, the dipoles are parallel, and at a relative angle of 90°, they are
perpendicular.
AU7210.indb 443 3/3/09 1:53:14 PM
© 2009 by Taylor & Francis Group, LLC

444 ◾ Long Term Evolution: 3GPP LTE Radio and Cellular Technology
12.3.6 Measuring MIMO CapacityA necessary condition for MIMO antennas to provide higher throughput is that the antennas be relatively uncorrelated—the more so, the better. The communication must also take place in a fading environment, so that the different propagation paths are relatively uncorrelated. The more fading that occurs, the better. Furthermore, the most important parameter for good MIMO performance is that the antennas used have high antenna efficiency [29]. We saw in the preceding diversity case that the antenna efficiency is decreased when antennas are in close proximity. In the reverberation chamber, it is possible to measure what the propagation paths in a Rayleigh fading environment look like between the MIMO antennas and the three fixed wall antennas (i.e., the channel matrix H). If the matrix is known, it is pos-sible to calculate the throughput capacity with Shannon’s capacity formula:
C SNR= +log (det ( ( / ) *))2 3.I HM (12.25)
With a multiport network analyzer, such a measurement can be performed in only 1 minute in the Bluetest high-performance chamber. It is the same measure-ment as described in the section on diversity gain, but the postprocessing of the S parameters is different. If one does not have a multiport network analyzer or if the MIMO antenna consists of more antenna branches than one has ports, fast MIMO measurements can still be taken by measuring the MIMO channel columns of the H matrix one by one. Figure 12.10 shows an example of a MIMO antenna with six branches.
In this case, one starts by connecting one of the antenna ports of the test antenna to the network analyzer and the other ports and the reference antenna are
Switch
Networkanalyzer
D
C
BA
E
F1 2
Figure 12.10 Setup for measuring a six-element MIMO antenna.
AU7210.indb 444 3/3/09 1:53:16 PM
© 2009 by Taylor & Francis Group, LLC

Measuring Performance of 3GPP LTE Terminals ◾ 445
terminated in 50 Ω. The S parameters between the connected port in the MIMO configuration and each of the fixed wall-mounted antennas, used for polarization stirring, are measured for all positions of the platform and mechanical stirrers and all frequency points. The measurement procedure is then repeated for every antenna port, using exactly the same platform and stirrer positions. Thus, the field inside the chamber is exactly the same when measuring every port. The complex transmission coefficients S21 between the connected port and each of the fixed wall antennas, as well as the reflection coefficients S11 of each wall antenna and S22 of the test object ports, are stored for every stirrer position and frequency point.
Finally, we connect the reference antenna to the network analyzer and perform the same measurements. In a small chamber, it is advantageous to use frequency stirring (averaging) to improve accuracy. In such cases, we correct the complex samples of S21 with mismatch factors due to both S11 and S22 before frequency stirring, as explained in Kildal and Carlsson [52, Equation 1]. We also normalize the corrected S21 samples to a reference level corresponding to 100% radiation effi-ciency. This is obtained from the corrected S21 samples measured for the reference antenna and its known radiation efficiency. We refer to these corrected and normal-ized samples of S21 as normalized S21 values. The normalized S21 values can now be used to calculate the MIMO capacity as described previously.
12.3.7 Measuring System ThroughputMultiantenna solutions at the terminal or base stations will be key technologies in 3.GPP LTE to ensure high throughput and low delays to users also at the cell edge. There are no accepted or well-known standards today to measure system through-put of multiantenna solutions. One of the reasons for this is that established stan-dards use measurements in anechoic chambers, where the effect of multiantenna solutions is not directly measurable. It is clearly seen from drive tests that multian-tenna solutions do provide significant improvements of throughput in an environ-ment with rich scattering (i.e., indoors or in urban areas) compared to SISO (single input, single output) solutions.
The problem with drive tests, however, is that most of the time they give dif-ferent results because the environment is under constant change. It is therefore normally not possible to compare the performance of two different multiantenna devices because they will show different throughput results in different environ-ments and at different times. Thus, there is a need for a repeatable testing method-ology to check the throughput of multiantenna devices in an environment with rich scattering. This environment should preferably have rich scattering that is repeat-able as well as isolated from outside interference that may affect the measurements. The reverberation chamber fulfills these requirements. It is a shielded room (often with better than 100-dB isolation), with a repeatable fading environment follow-ing a Rayleigh distribution (see Figure 12.11), similar to the distribution in real indoor or urban environments. Objects in the reverberation chamber located more
AU7210.indb 445 3/3/09 1:53:16 PM
© 2009 by Taylor & Francis Group, LLC

446 ◾ Long Term Evolution: 3GPP LTE Radio and Cellular Technology
than 0.5 wavelength from each other will experience independent fading. By plac-ing a multiantenna base station and multiantenna terminal inside the chamber a few wavelengths apart, it is possible to measure the throughput in the uplink and downlink in a repeatable way.
To test that this works in praxis, Bluetest, together with Sony Ericsson [53.], per-formed a project [54], briefly described later, within the Swedish Chase (Chalmers Antenna Systems VINN Excellence Center) program [55]. A MIMO WLAN router and laptop were used to test throughput. WLAN devices were used because it was difficult to find prototype 3.GPP LTE base stations and terminals in 2008. WLAN has some of the same properties (e.g., orthogonal frequency division mul-tiplexing [OFDM], 20-MHz bandwidth, and support for multiantenna solutions [802.11n]) as 3.GPP LTE, and the results should therefore be relevant for designers of 3.GPP LTE equipment. The setup for the throughput measurements is shown in Figure 12.12. The WLAN router under test was a D-Link RangeBooster N 650 wireless router (model DIR-63.5) with operation restricted to the 2.4-GHz ISM band. The laptop used was equipped with a D-Link RangeBooster N USB adapter (model DWA-142), which is a two-antenna 802.11n draft-compliant WLAN client. The main software used for the throughput measurements was Iperf—open source
Figure 12.11 Simulation of the field in a reverberation chamber. It is Rayleigh distributed. This is similar to the distribution found in office environments and urban areas.
AU7210.indb 446 3/3/09 1:53:17 PM
© 2009 by Taylor & Francis Group, LLC

Measuring Performance of 3GPP LTE Terminals ◾ 447
software developed by the National Laboratory for Applied Network Research of the United States [56] that can create TCP and UDP data streams and measure network throughput—allowing modification of various parameters for network testing.
The first measurements were done to verify the repeatability of the reverbera-tion chamber. The measurements were performed over a 90-s continuous stirring sequence with sampling frequency of two samples per second. This was found to be long enough for a 95% confidence interval for a sample average smaller than 2 Mb/s. Figure 12.13. shows nine consecutive measurements of three channels with good repeatability. This is the first time, as far as we know, that repeatable throughput with this small spread in the results was performed in a rich scattering environment.
Head Phantom
Routerpowercable
ROUTER + standWLAN linkto measure
LAPTOP with USBadapter + turntable + stand
DIRECTIONOF DATA FLOW
Ethernetcable
Laptoppowercable
CONTROL LAPTOP
Figure 12.12 Sketch and pictures of measurement setup.
AU7210.indb 447 3/3/09 1:53:18 PM
© 2009 by Taylor & Francis Group, LLC

448 ◾ Long Term Evolution: 3GPP LTE Radio and Cellular Technology
Having shown that it is possible to do measurements with good repeatability, the next step was to compare a MIMO 802.11n configuration with a standard SISO 802.11g configuration. The throughput in the 802.11n MIMO 3. × 2 con-figurations was compared with the 802.11g mode of the router. For both operation modes, the modulation format was set to the most complex implemented—for 802.11n MCS 15 with 20-MHz bandwidth, 13.0 Mb/s rate medium access control (MAC) data, and for 802.11g, 54 Mb/s physical link rate. Three measurements were taken and averaged for each of the frequency channels.
The results are shown in Figure 12.14 and show how 802.11n with MIMO dra-matically improves the throughput compared to 802.11g, which uses only SISO. This means an absolute increase of at least 25 Mb/s and represents on average nearly three times the throughput offered in the older standard. It was also possible to
# of Measurements
TCP
Thro
ughp
ut (M
bps)
Repeatability of Continuous Sequences
9876543210.005.00
10.0015.0020.0025.0030.0035.0040.0045.0050.00
CH13 contCH6 contCH2 cont
Figure 12.13 Nine consecutive measurements showing good repeatability.
5 10Channel #
Aver
age D
ownl
ink
TCP
Thro
ughp
ut (M
bps)
Comparison of WLAN Standards
00.0
10.0
20.0
30.0
40.0
50.0
60.0
15
802.11 n802.11 g
Figure 12.14 Comparison of WLAN standards.
AU7210.indb 448 3/3/09 1:53:19 PM
© 2009 by Taylor & Francis Group, LLC

Measuring Performance of 3GPP LTE Terminals ◾ 449
see effects of removing or attenuating one or two antennas at the router. For more information about this, as well as how different types of antennas affected the throughput, see Olano et al. [57].
A new setup for active measurements of throughput of MIMO systems in the reverberation chamber has been described. The chosen communication standard was WLAN 802.11n, which was the first communication standard to commer-cialize devices implementing MIMO. WLAN has traditionally been a computer networking standard and, compared to cell phone standards, presents some special features regarding its operation and characterization. However, we believe that the results shown for WLAN are very encouraging and that the method used will be of great benefit to designers of 3.GPP terminals as well as small indoor 3.GPP LTE base stations. The measurements are fast and easy to set up, and can save much time and reduce uncertainties in comparison with current field tests. They offer more reli-able assessment on the performance than measurements in other shielded chambers without stirring mechanisms and measurements in channel emulators.
12.4 New Tests for LTE-and-Beyond Systems in the Reverberation Chamber
In contrast to existing second- and third-generation systems, LTE-and-beyond sys-tems are designed to exploit the spatial domain of the channel to a higher degree than what is done today. The spatial domain of the channel is exploited by using multiple antennas at the receiver and the transmitter. In LTE, multiple antennas are used for diversity, beam forming, spatial multiplexing, and interference suppres-sion. The network decides the way in which the multiple antennas are used [58].
For equalization of the frequency-selective channel in the downlink, LTE-and-beyond systems are mostly based on OFDM-like transceiver structures. In addi-tion to combating—and in effect exploiting—the frequency-selective nature of the channel, OFDM-like schemes allow for a flexible spectrum allocation by the base station to different mobile users.
The channel relevant for evaluating such a system, which exploits the frequency as well as the spatial domain of the channel, is the channel transfer function (CTF) h(t, f, q). It is a function of time t, the frequency f, and the incident angle of the signal q. It can be written as [59]
h t f C f h t f C fR T( , , ) ( , ) ( , , ) ( , ),θ θ θ θ= (12.26)
where CR and CT are the complex valued antenna responses of the receive and transmit antennas, respectively. It can be seen that not only the physical channel h itself but also the antenna response influence the link and therefore system-level performance. Taking into account the antenna at the mobile terminal becomes particularly important if the antenna operates in close vicinity to other objects,
AU7210.indb 449 3/3/09 1:53:20 PM
© 2009 by Taylor & Francis Group, LLC

450 ◾ Long Term Evolution: 3GPP LTE Radio and Cellular Technology
such as the hand of a mobile terminal user, which affects not only the antenna response but also the matching of the antenna. For beyond-LTE systems, including the antenna in transceiver performance evaluation may become even more impor-tant as the spectrum used by systems increases and potentially is scattered over multiple bands as identified for IMT-Advanced systems on the WRC-2007. In such systems, antennas become more suboptimal because only one antenna might be used for multiple frequency bands.
Having identified the need for system/link measurements including the antennas, different setups for such measurements are presented next. All these setups are based on measuring the throughput of wireless links as described ear-lier. The result is that if parameters, components or algorithms are optimized, the effect on throughput is directly visible. Alternatively, these throughput measure-ments might be replaced with BER measurements for a fixed throughput. The choice of measuring BER or throughput will ultimately depend on the problem investigated.
Note that the different possible setups described in this section have not been used for performing measurements yet. However, the throughput measurements described in the previous section open up a completely new set of measurement set-ups, which are particularly interesting in the context of LTE- and- beyond systems. A selection of such possible setups is described in this section.
The remainder of this section is organized as follows. In the first subsection, link-level measurements (i.e., measurements focusing on the communication between a single terminal and a base station) are discussed. These measurements are devel-oped further in the subsequent section, where setups involving multiple mobile terminals are considered. The multiple terminal setup mimics a communication cell in a cellular system. The final step is then to include multiple base stations in the measurements, which is termed system measurements.
12.4.1 Link-Level MeasurementsAlthough many traditional measurement environments, such as an anechoic cham-ber, are not capable of accounting for time, frequency, and space variations of the channel, the reverberation chamber is capable of providing such a test environment [8]. It is therefore suitable for measuring transceivers using multiple antenna tech-niques in combination with OFDM in a repeatable environment.
Measurement setup. If a base station equipped with small antennas operating in a rich scattering environment is considered, the measurement setup for a MIMO-OFDM link would look like that described in the earlier section on throughput measurements. However, in order to test systems at their limits (i.e., very low SNR), it might be necessary to introduce additional path loss between the base station and the terminal. This can be done by directly connecting attenuators at the base station and terminal antenna ports or, alternatively, by a setup using two connected
AU7210.indb 450 3/3/09 1:53:20 PM
© 2009 by Taylor & Francis Group, LLC

Measuring Performance of 3GPP LTE Terminals ◾ 451
reverberation chambers, as illustrated in Figure 12.15. In this setup, the mobile ter-minal is placed in the left chamber, which is equipped with a turntable and stirrers on the wall as described previously. The chamber on the right-hand side hosts the base station (antennas).
Both chambers are connected to each other via pickup antennas in each cham-ber, which are connected through a transmission line [5]. Rather than using only
MS BS
AbsorbersDelay
Delay
Delay
Delay
Delay
Delay
Figure 12.15 Two-chamber setup, where a mobile station (MS) is placed in the left chamber and the base station (BS) is placed in the right chamber. Both cham-bers are connected via transmission lines with different delays and attenuators to manipulate the frequency-selective behavior of the channel. The right cham-ber additionally uses absorbers to manipulate the angular spread of the channel. Note that the number of pickup antennas connecting the two chambers needs to be sufficiently high in order not to limit the rank of the MIMO channel.
Figure 12.16 Two base station setups with handover region. Note that cells are based on receiver power rather than on geometry. In the handover area, the aver-age power received by a mobile from two different base stations is approximately the same. This corresponds to the uniform average power distribution over the area in the reverberation chamber. Note that the handover area or cell edge in a communication system is not defined by geometry but rather by signal power levels.
AU7210.indb 451 3/3/09 1:53:21 PM
© 2009 by Taylor & Francis Group, LLC

452 ◾ Long Term Evolution: 3GPP LTE Radio and Cellular Technology
transmission lines, one might in addition use attenuators and, potentially, elements introducing a propagation delay. If the delay elements impose a different propaga-tion delay in different transmission lines, the channel becomes frequency selective, similar to the classical power delay profile known from channel modeling. By con-trolling the delays and attenuators in the cables, the frequency selectiveness of the channel can be easily controlled without modifying the chamber.
Depending on the loading of a chamber and whether it is equipped with some absorbing material, the different pickup antennas might even be used to control the angular spread of the signal. Note that the number of these pickup antennas used needs to be sufficiently large in order not to limit the rank of the channel between the two chambers.
In the described two-chamber setup, a complete transceiver, from digital algo-rithm to antennas, can be optimized and the performance of different setups can be evaluated using, for example, link throughput or BER as an optimization criteria. The measurements will be independent of the transceiver implementation. This allows us to characterize systems with, for example, integrated antenna and LNA designs, which are difficult to measure in current setups.
Of particular interest in link-level measurements in the LTE context are mea-surements with channel state information at the transmitter that can be used for link adaptation. In this case, the performance of power allocation on the OFDM or MIMO subchannels created through precoding, adaptive coding, and modulation can be evaluated. In contrast to other measurement environments, such as those created in drive tests, the performance of MIMO systems using spatial multiplex-ing can be investigated in a repeatable environment.
12.4.2 Single-Cell System-Level MeasurementsAlthough the link-level tests discussed in the previous section allow for design-ing antennas and for optimizing transceiver designs, these measurements say little about the performance of the overall system. The link-level measurements, however, can be taken a step further towards system-level measurements by using multiple terminals in the chamber in conjunction with one base station connected to the chamber or placed inside the chamber. With such a setup, multiple access technolo-gies such as OFDMA or MU-MIMO, including the associated scheduling, can be evaluated and the performance of different scheduling algorithms can be measured. Again, OFDMA and spatial division medium access (SDMA)/MU-MIMO rely on a space- and frequency-selective channel, respectively, which can be provided by the reverberation chamber.
Because scheduling algorithms generally also need a channel, which evolves over time, it can be desirable to move the stirrers in the chamber as well as the plat-form during the measurements. This channel evolution over time, however, needs to be sufficiently slow to allow SDMA/MU-MIMO to function. In a chamber of reasonable size, it might be possible to place numerous mobile terminals because
AU7210.indb 452 3/3/09 1:53:21 PM
© 2009 by Taylor & Francis Group, LLC

Measuring Performance of 3GPP LTE Terminals ◾ 453
they already experience independent fading, if the distance between them is larger than lambda-half.
Measurement setup. For the single-cell measurements, a base station is con-nected to the chamber (or, if it is small, potentially placed inside the chamber). In addition, mobile terminals are added, with spacing between them of at least half a wavelength to ensure independent fading. In the next step, communication is established between the mobile terminals and the base station and throughput measurements of all terminals in parallel are started. Then the platform and stirrers are moved slowly.
Depending on the objective of the measurements, a different number of ter-minals may be required. For the investigation of SDMA or MU-MIMO, it can be sufficient to use only two terminals and force them to operate on the same frequen-cy–time resource block so that they need to be separated in space using MIMO techniques. If, however, scheduling algorithms are to be evaluated, the number of mobile terminals needs to be large in comparison to the number of available frequency–time slots because the quality of a scheduling algorithm shows best at a high system load. The results of these measurements are the individual throughputs of each terminal. They can be used not only to analyze sum-throughput in this artificial cell but also to investigate, for example, the fairness characteristics of the scheduling algorithm.
12.4.3 Multicell System-Level MeasurementsRather than connecting only a single base station to a reverberation chamber, it is also possible to connect more than one base station. This setup can be used to inves-tigate the performance of the system when the terminal is moving in the handover area, as indicated in Figure 12.16.
If two base stations with identical output powers are connected to a reverbera-tion chamber, the average received power from the two base stations at the terminal is also identical. The environment in the chamber therefore corresponds to exactly the handover region between two base stations. To change this, attenuators can be used to adjust the powers of the base stations connected to the chamber and, by that, “move” closer to one of the base stations. In the extreme, these attenuators might even be made time variant. Alternatively to using attenuators, it would also be possible to use a cylinder filled with lossy material and move it over the termi-nal in order to create fading on a slower timescale, which should trigger handover between two base stations.
With such a setup, it is possible to simulate handover scenarios from one base to another. Such a handover decision should not be made on the basis of short-term fading but, rather, of average power levels. The short-term fading in this case would be created by the chamber. In addition to the base station/system algorithms, this setup will allow for evaluating the performance of the interference rejection at the terminal. If connected to one base station, the other base station creates interference
AU7210.indb 453 3/3/09 1:53:22 PM
© 2009 by Taylor & Francis Group, LLC
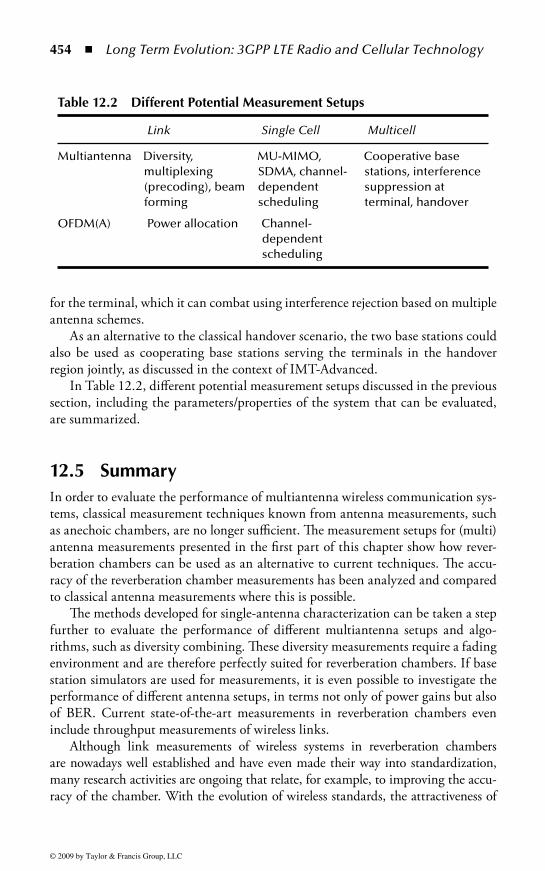
454 ◾ Long Term Evolution: 3GPP LTE Radio and Cellular Technology
for the terminal, which it can combat using interference rejection based on multiple antenna schemes.
As an alternative to the classical handover scenario, the two base stations could also be used as cooperating base stations serving the terminals in the handover region jointly, as discussed in the context of IMT-Advanced.
In Table 12.2, different potential measurement setups discussed in the previous section, including the parameters/properties of the system that can be evaluated, are summarized.
12.5 SummaryIn order to evaluate the performance of multiantenna wireless communication sys-tems, classical measurement techniques known from antenna measurements, such as anechoic chambers, are no longer sufficient. The measurement setups for (multi) antenna measurements presented in the first part of this chapter show how rever-beration chambers can be used as an alternative to current techniques. The accu-racy of the reverberation chamber measurements has been analyzed and compared to classical antenna measurements where this is possible.
The methods developed for single-antenna characterization can be taken a step further to evaluate the performance of different multiantenna setups and algo-rithms, such as diversity combining. These diversity measurements require a fading environment and are therefore perfectly suited for reverberation chambers. If base station simulators are used for measurements, it is even possible to investigate the performance of different antenna setups, in terms not only of power gains but also of BER. Current state-of-the-art measurements in reverberation chambers even include throughput measurements of wireless links.
Although link measurements of wireless systems in reverberation chambers are nowadays well established and have even made their way into standardization, many research activities are ongoing that relate, for example, to improving the accu-racy of the chamber. With the evolution of wireless standards, the attractiveness of
Table 12.2 Different Potential Measurement Setups
Link Single Cell Multicell
Multiantenna Diversity, multiplexing (precoding), beam forming
MU-MIMO, SDMA, channel-dependent scheduling
Cooperative base stations, interference suppression at terminal, handover
OFDM(A) Power allocation Channel-dependent scheduling
AU7210.indb 454 3/3/09 1:53:22 PM
© 2009 by Taylor & Francis Group, LLC
Measuring Performance of 3GPP LTE Terminals ◾ 455
reverberation chambers for link/system evaluation increases. Possible extensions of existing measurement techniques with a focus on LTE-and-beyond systems were pre-sented at the end of this chapter. A lot of potential for further development lies par-ticularly in manipulating the channel in the reverberation chamber to a larger extent and using the chamber for multiple terminal and multiple base station setups.
References 1. Vaughan, R., J. B. Andersen, and P. C. Clarricoats. 2003.. Channels, propagation and
antennas for mobile communications electromagnetic waves. Series 50, Institute of Electrical Engineers.
2. http://www.3.gpp.org/Highlights/LTE/lte.htm 3.. Andersson, M., C. Orlenius, and M. Franzén. 2007. Measuring the impact of mul-
tiple terminal antennas on the bit rate of mobile broadband systems using reverbera-tion chambers. International Workshop on Antenna Technology (iWAT07), Cambridge, UK, pp. 3.68–3.71.
4. Andersson, M. et al. 2006. Antennas with fast beam steering for high spectral effi-ciency in broadband cellular systems. Proceedings of the 9th European Conference on Wireless Technology, Manchester, England, September 2006.
5. El Zooghby, A. 2005. Smart antenna engineering. Mobile communications series. Norwood, MA: Artech House Inc.
6. Wolfgang, J., C. Carlsson, C. Orlenius, and P.-S. Kildal. 2003.. Improved procedure for measuring efficiency of small antennas in reverberation chambers. IEEE AP-S International Symposium, Columbus, OH, June 2003..
7. Bäckström, M., O. Lundén, and P.-S. Kildal, Reverberation chambers for EMC sus-ceptibility and emission analyses. Review of Radio Science 1999–2002, (19): 429–452.
8. Kildal, P.-S. 2007. Overview of 6 years’ R&D on characterizing wireless devices in Rayleigh fading using reverberation chambers. International Workshop on Antenna Technology (iWAT07), Cambridge, UK, 2007, pp. 162–165.
9. http://www.bluetest.se/ 10. http://www.tcodevelopment.com/ 11. http://www.mobilelabelling.com/ 12. Annex E. 2006. Alternative measurement technologies: Reverberation chamber
method, 3.rd Generation Partnership Project: Technical specification group radio access network; measurements of radio performances for UMTS terminals in speech mode, 3.GPP TR 25.914 V7.0.0 (2006–06).
13.. http://www.ctia.org/ 14. Test plan for mobile station over the air performance CTIA certification, rev. 2.2.
November 2006. 15. Rosengren, K., and P.-S. Kildal. 2001. Study of distributions of modes and plane
waves in reverberation chambers for characterization of antennas in multipath envi-ronment. Microwave and Optical Technology Letters 3.0 (20): 3.86–3.91.
16. Rosengren, K., P.-S. Kildal, C. Carlsson, and J. Carlsson. 2001. Characterization of antennas for mobile and wireless terminals in reverberation chambers: Improved accuracy by platform stirring. Microwave and Optical Technology Letters 3.0 (20): 3.91–3.97.
AU7210.indb 455 3/3/09 1:53:22 PM
© 2009 by Taylor & Francis Group, LLC

456 ◾ Long Term Evolution: 3GPP LTE Radio and Cellular Technology
17. Kildal, P.-S., and C. Carlsson. 2002. Detection of a polarization imbalance in rever-beration chambers and how to remove it by polarization stirring when measuring antenna efficiencies. Microwave and Optical Technology Letters 3.4 (2): 145–149.
18. Kildal, P.-S., C. Carlsson, and J. Yang. 2002. Measurement of free space impedances of small antennas in reverberation chambers. Microwave and Optical Technology Letters 3.2 (2): 112–115.
19. Kildal, P.-S. 2000. Foundations of antennas—A unified approach. Sweden: Studentlitteratur.
20. Hill, D. A., M. T. Ma, A. R. Ondrejka, B. F. Riddle, M. L. Crawford, and R. T. Johnk. 1994. Aperture excitation of electrically large, lossy cavities. IEEE Transactions on Electromagnetic Compatibility 3.6 (3.): 169–178.
21. Ludwig, A. C. 1976. Mutual coupling, gain and directivity of an array of two identi-cal antennas. IEEE Transactions on Antennas Propagation November: 83.7–841.
22. Marzari, E. 2004. Physical and statistical models for estimating the number of inde-pendent samples in the Chalmers reverberation chamber. Master’s thesis, Chalmers University, Goteberg, Sweden.
23.. Orlenius, C., M. Franzen, P.-S. Kildal, and U. Carlberg. 2006. Investigation of heav-ily loaded reverberation chamber for testing of wideband wireless units. IEEE AP-S International Symposium, Albuquerque, NM, July 2006.
24. Kostas, J. G., and B. Boverie. 1991. Statistical model for a mode-stirred chamber. IEEE Transactions on Electromagnetic Compatibility 3.3. (4): 3.66–3.70.
25. Hill, D. A. 1999. Linear dipole response in a reverberation chamber. IEEE Transactions on Electromagnetic Compatibility 41 (4): 3.65–3.68.
26. Hill, D. A. 1994. Electronic mode stirring for reverberation chambers. IEEE Transactions on Electromagnetic Compatibility 3.6 (4): 294–299.
27. Kildal, P.-S., and C. Carlsson (C. Orlenius). 2002. TCP of 20 mobile phones mea-sured in reverberation chamber: Procedure, results, uncertainty and validation. Available from Bluetest AB, www.bluetest.se, Feb. 2002.
28. Serafimov, N., P.-S. Kildal, and T. Bolin. 2002. Comparison between radiation efficiencies of phone antennas and radiated power of mobile phones measured in anechoic chambers and reverberation chamber. IEEE AP-S International Symposium, San Antonio, TX, June.
29. Kildal, P.-S., and K. Rosengren. 2004. Correlation and capacity of MIMO sys-tems and mutual coupling, radiation efficiency and diversity gain of their antennas: Simulations and measurements in reverberation chamber. IEEE Communications Magazine 42 (12): 102–112.
3.0. Kildal, P.-S., K. Rosengren, J. Byun, and J. Lee. 2002. Definition of effective diver-sity gain and how to measure it in a reverberation chamber. Microwave and Optical Technology Letters 3.4 (1): 56–59.
3.1. Kildal, P.-S., and K. Rosengren. 2003.. Electromagnetic analysis of effective and appar-ent diversity gain of two parallel dipoles. IEEE Antennas and Wireless Propagation Letters 2 (1): 9–13..
3.2. Bourhis, R., C. Orlenius, G. Nilsson, S. Jinstrand, and P.-S. Kildal. 2004. Measurements of realized diversity gain of active DECT phones and base stations in a reverberation chamber. IEEE AP-S International Symposium, Monterey, CA, June 2004.
AU7210.indb 456 3/3/09 1:53:22 PM
© 2009 by Taylor & Francis Group, LLC

Measuring Performance of 3GPP LTE Terminals ◾ 457
3.3.. Rosengren, K., and P.-S. Kildal. 2005. Radiation efficiency, correlation, diversity gain, and capacity of a six monopole antenna array for a MIMO system: Theory, simulation and measurement in reverberation chamber. Proceedings IEEE, Microwave Antennas Propagation 152 (1): 7–16. See also Erratum published in August 2006.
3.4. Orlenius, C., P.-S. Kildal, and G. Poilasne. 2005. Measurements of total isotropic sensitivity and average fading sensitivity of CDMA phones in reverberation cham-ber. IEEE AP-S International Symposium, Washington, D.C., July 3.–8.
3.5. Carlberg, U., P.-S. Kildal, and J. Carlsson. 2005. Study of antennas in reverberation chamber using method of moments with cavity Green’s function calculated by Ewald summation. IEEE Transactions on Electromagnetic Compatibility 47 (4): 805–814.
3.6. Karlsson, K., J. Carlsson, and P.-S. Kildal. 2006. Reverberation chamber for antenna measurements: Modeling using method of moments, spectral domain techniques, and asymptote extraction. IEEE Transactions on Antennas and Propagation 54 (11), Part 1: 3.106–3.113..
3.7. Carlberg, U., P.-S. Kildal, A. Wolfgang, O. Sotoudeh, and C. Orlenius. 2004. Calculated and measured absorption cross-sections of lossy objects in reverberation chamber. IEEE Transactions on Electromagnetic Compatibility 46 (2): 146–154.
3.8. Wellander, N., O. Lundén, and M. Bäckström. 2006. Design parameters for efficient stirring of reverberation chambers. Proceedings of IEEE EMC Society International Symposium 2: 263.–268.
3.9. Wellander, N., O. Lundén, and M. Bäckström. 2007. Experimental investigation and mathematical modeling of design parameters for efficient stirrers in mode-stirred reverberation chambers. IEEE Transactions on Electromagnetic Compatibility 49 (1): 94–103..
40. Holloway, C. L., D. A. Hill, J. M. Ladbury, P. F. Wilson, G. Koepke, and J. Coder. 2006. On the use of reverberation chambers to simulate a Rician radio environment for the testing of wireless devices. IEEE Transactions on Antennas and Propagation 54 (11), Part 1: 3.167−3.177.
41. Ferrara, G., M. Migliaccio, and A. Sorrentino, 2007. Characterization of GSM non-line-of-sight propagation channels generated in a reverberating chamber by using bit error rates. IEEE Transactions on Electromagnetic Compatibility 49 (3.): 467−473..
42. Diallo, A., P. Le Thuc, C. Luxey, R. Staraj, G., Kossiavas, M. Franzén, and P.-S. Kildal. 2007. Diversity characterization of optimized two-antenna systems for UMTS handsets. EURASIP Journal on Wireless Communication and Networking, Hindawi Publishing Corporation, 2007.
43.. ACE—Antenna Centre of Excellence: http://www.ist-ace.org 44. Carlsson, J. 2007. Benchmarking for measurement facilities for small antennas
and active terminals within ACE—Results and experience from the first two years. Frequenz, Journal of RF-Engineering and Telecommunications 61 (3.–4/2007, 59–62).
45. Carlsson, J. 2004. Benchmarking of small terminal antenna measurement facilities. Proceedings of the JINA Conference, Nice, France, 2004.
46. Carlsson, J., and P.-S. Kildal. 2005. Round robin test of active and passive small termi-nal antennas. Proceedings of the LAPC 2005 Conference, Loughborough, UK, April 4–6, 2005.
47. Carlsson, J. 2005. Benchmarking of facilities for small terminal antenna measure-ments. Proceedings of the AP-S, Washington, D.C., 2005.
AU7210.indb 457 3/3/09 1:53:22 PM
© 2009 by Taylor & Francis Group, LLC

458 ◾ Long Term Evolution: 3GPP LTE Radio and Cellular Technology
48. Carlsson, J. 2005. Benchmarking of facilities for measuring small mobile termi-nals and their antennas: Results of a round robin test in ACE. Proceedings of the ICEcom2005 Conference, Dubrovnik, Croatia, 2005.
49. Andersson, M., C. Orlenius, and M. Franzen. 2007. Very fast measurements of effec-tive polarization diversity gain in a reverberation chamber. EuCAP 2007, Edinburgh, UK.
50. Diallo, A., C. Luxey, P. Le Thuc, R. Staraj, G. Kossiavas, M. Franzén, and P.-S. Kildal. 2007. Evaluation of the performance of several four-antenna systems in a reverberation chamber. International Workshop on Antenna Technology (iWAT07), Cambridge, UK, pp. 166–169.
51. Bolin, T., A. Derneryd, G. Kristensson, V. Plicanic, and Z. Ying. 2005. Two-antenna receive diversity performance in indoor environment. Electronic Letters 41, (22): 1205–1206.
52. Kildal, P.-S., and C. Carlsson. 2002. TCP of 20 mobile phones measured in rever-beration chamber—Procedure, results, uncertainty and validation. Bluetest AB report, Feb 2002.
53.. http://www.sonyericsson.com/ 54. Olano, N. 2008. WLAN MIMO terminal test in reverberation chamber. Master’s
thesis at the Antenna Group, Department of Signals and Systems, Chalmers University of Technology, Göteborg, Sweden.
55. http://www.chalmers.se/s2/cha-en/chase 56. Iperf Version 2.0.2. Distributed applications support team of the National Laboratory
for Applied Network Research of the United States of America: http://dast.nlanr.net/ Projects/Iperf/#whatis
57. Olano, N., C. Orlenius, K. Ishimiya, and Z. Ying. 2008. WLAN MIMO through-put test in reverberation chamber. Accepted at IEEE AP-S International Symposium, San Diego, CA, 2008.
58. Dahlman, E., S. Parkvall, J. Sköld, and P. Beming. 2007. 3.G evolution—HSPA and LTE for mobile broadband. New York: Academic Press.
59. 3.GPP TR 25.996 V6.1.0. September 2003.. Spatial channel model for multiple input multiple output (MIMO) simulations [online].
Links 1. The TCO developments homepage: http://www.tcodevelopment.com/ 2. Link to Bluetest: http://www.bluetest.se/ 3.. Link to CTIA: http://www.ctia.org/ 4. Link to Chase: http://www.chalmers.se/s2/cha-en/chase
AU7210.indb 458 3/3/09 1:53:22 PM
© 2009 by Taylor & Francis Group, LLC