Embed Size (px)
Citation preview

MEASURING PEACE
Camilla Schippa, DirectorInstitute for Economics and Peace
#PeaceIndex@GlobPeaceIndex

INSTITUTE FOR ECONOMICS AND PEACE
The Institute for Economics and Peace is an independent,
not-for-profit, think tank dedicated to building a greater
understanding of the key drivers and measures of peace and
to identifying the economic benefits that increased
peacefulness can deliver.
Sydney, New York, Mexico City
“
”

IEP’s RESEARCH AGENDA
Four major research pillars:
Measuring peace
Economics and peace
Positive peace
Risk and peace
Research consulting:
Relevant to core research, generate revenue

DEFINING AND MEASURING PEACE
NEGATIVE PEACE
• Absence of direct
violence
• Absence of fear of
violence
GLOBAL PEACE INDEX
National Peace Indices
POSITIVE PEACE
Attitudes, institutions
and structures which
when strengthened,
lead to a more
peaceful society.
POSITIVE PEACE INDEX
Positive Peace Report

THE GLOBAL PEACE INDEX
Now in its ninth year
Ranks 162 countries
According to their relative states of peace
Using 23 indicators weighted on a 1-5 scale
A mix of qualitative and quantitative
indicators measuring internal and external
peace
Sourced from various organizations
including IISS, SIPRI, UCDP, UNHCR,
UNODC.

IEP• Defines philosophical approach
• Develops 5 indicators
Expert Panel
• Decides indicators, sets weights
• Reviews Index results
EIU• Develops 8 qualitative indicators, country
analysts estimate missing data points
INDEPENDENT PROCESS
Methodological
review

INDICATORS
6 measures of ongoing domestic and international conflict
including: intensity of organised internal conflicts, relations with
neighbouring countries and number of deaths from conflict
10 measures of societal safety and security
including: number of refugees and IDPs, impact of terrorism,
homicide and incarceration rates
7 measures of militarization
including: military expenditure, number of armed service
personnel, ease of access to small weapons

INSERT 2015 MAP
GLOBAL PEACE INDEX 2015
www.visionofhumanity.org

2015 GPI HIGHLIGHTS
The average level of country peacefulness has remained
the same since last year
However, 81 countries became more peaceful while 78countries deteriorated
Deterioration primarily driven by increases in:
Deaths from internal conflicts
Terrorist activity
UN peacekeeping funding
Counteracting these falls were improvements in:
Homicide rate
External conflicts fought
Political instability
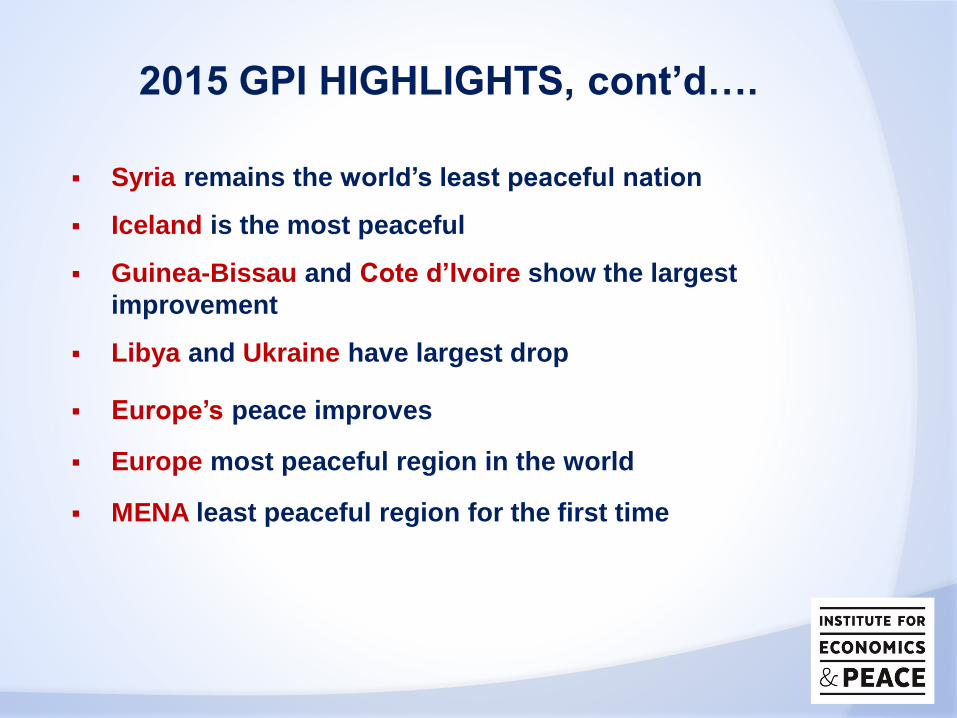
2015 GPI HIGHLIGHTS, cont’d….
Syria remains the world’s least peaceful nation
Iceland is the most peaceful
Guinea-Bissau and Cote d’Ivoire show the largest
improvement
Libya and Ukraine have largest drop
Europe’s peace improves
Europe most peaceful region in the world
MENA least peaceful region for the first time

EIGHT-YEAR TRENDS IN PEACE
Since 2008 the world has recorded a 2.4% deterioration in peace
Safety and Security score – 3.85% deterioration
Militarisation Score – 2.42% improvement
Ongoing Conflict Score – 0.86% deterioration
Deaths from internal conflict and impact of terrorism largest
deteriorations
76 countries improved, 86 countries deteriorated
Greatest deterioration in the MENA and Central America and
Caribbean regions

GLOBAL PEACE INEQUALITY2 billion people live in the bottom 20 countries compared to 500
million in the most peaceful

URBANIZATION AND PEACEGlobal urban population is expected to grow by 2.5 billion people by 2050.
1.9 billion will be in the countries that have low levels of peacefulness.

INDICATOR CHANGESTwo GPI indicators have improved by more than 5% over the last eight years.
Violent Demonstrations
Perceptions of Criminality
External Conflict
UN Peacekeeping
Impact of Terrorism
Internal Conflict Deaths
Refugees & IDPs
0.80
0.85
0.90
0.95
1.00
1.05
1.10
1.15
1.20
2008 2009 2010 2011 2012 2013 2014 2015
Rela
tive A
vera
ge
In
dic
ato
r C
ha
ng
e
Sin
ce (2
008 t
o 2
015)
Source: IEP

DEATHS FROM TERRORISMDeaths from terrorism increased between 2003-2008. Then plateaued for
2009-2011 but have increased again since 2012.
0
5,000
10,000
15,000
20,000
25,000
30,000
35,000
2002 2004 2006 2008 2010 2012 2014
De
ath
s fr
om
Te
rro
rism
Sources: START GTD, IEP

TOTAL REFUGEES AND IDPS, 2004-2013The number of internally displaced people increased by 60% from 2004 to 2013
Source: UNHCR
-
10
20
30
40
50
60
2004 2005 2006 2007 2008 2009 2010 2011 2012 2013 2014
Mil
lio
ns
of
Peo
ple
Refugees and Asylum Seekers
IDPS protected/assisted by UNHCR

Geocoded, 140,000+ incidents, 14 year time series
Combination of machine coding and expert coding
Measures loss of life, injuries, property damage, perpetrator, weapons
used, success rate
GLOBAL TERRORISM INDEX

1970-2013 - 50% of incidents claim no lives
STATISTICAL PROPERTIES OF TERRORISM
Large attacks are black
swans
Terrorism as a tactic of
sustained mass destruction
is mostly ineffective
Armed conflict much more
devastating

TERRORISM MORE OFTEN HAPPENS
DURING MAJOR CONFLICT
In the 28% - 90% of
attacks occurred in
countries which
score poorly in
social cohesion and
state sponsored
terror


Indicator Measure Source
Homicide Homicide rate per 100,000 peopleSESNSP (cases being
investigated by the State
Prosecution Authorities)
Violent crime Violent crime rate per 100,000 people SESNSP
Weapons crime Weapons crime rate per 100,000 people SESNSP
IncarcerationNumber of people sent to prison per year, per 100,000
peopleNational Institute of Statistics and
Geography (INEGI)
Police fundingFederal Government funding to States for the Public
Security Contribution Fund per 100,000 peopleSecretaria de Hacienda y Crédito
Publico (SHCP)
Organized crimeThe number of extortions, drug-trade related crimes,
organized crime offenses, and kidnapping per 100,000SESNSP
Efficiency of the
justice systemProportion of convictions for homicide to total
homicidesINEGI
MEXICO PEACE INDEX
Seven indicators

IEP defines violence containment spending as economic activity
that is related to the consequences or prevention of violence where
the violence is directed against people or property.
GLOBAL COST OF VIOLENCE
o Fifteen dimensions measured
o Individual estimates for 162 countries
o Conservative estimate
o Only includes direct costs
o Allows cost benefit analysis

Increase of 15.3% from 2008
GLOBAL COST OF VIOLENCE
Estimated to be US$14.3 trillion

GLOBAL COST OF VIOLENCE, 2008-2015
$12.4 $12.4
$13.4
$13.7 $13.7
$14.2 $14.3
$11.0
$11.5
$12.0
$12.5
$13.0
$13.5
$14.0
$14.5
2008 2009 2010 2011 2012 2013 2014
Tota
l Vio
len
ce C
on
tain
me
nt
Exp
en
dit
ure
$U
SP
PP
(Tr
illio
ns)
Due to the decrease in global peace, the economic impact of violence to the
world economy increased by US$2 trillion between 2008 and 2014
Source: IEP

VIOLENCE CONTAINMENT IS
LARGER THAN…
$0
$1,000
$2,000
$3,000
$4,000
$5,000
$6,000
$7,000
$8,000
$9,000
$10,000
World Airlines Industry World Tourism Sector World Agriculture Sector World Economic Impactof Violence Containment
US
$ B
illio
n

GLOBAL VIOLENCE CONTAINMENT Composition of Global Violence Containment, 2014 (US$ Billion PPP 2014)
Source: IEP

WHAT CREATES PEACE?
New empiric approach to building peace
Reframes the study of peace towards what works
Positive Peace is the “attitudes, institutions and structures” that
create and sustain peaceful societies
Positive Peace is also a measure societal resilience
Positive Peace creates an environment that leads to many other
positive outcomes

“The attitudes, institutions and structures that sustain a peaceful society”
Analysed over 8,500 variables covering:
Macro-economy
Social relations and attitudes
Economic and social development
Economic and social integration
The functioning and structure of government
External relations
POSITIVE PEACE

FACTORS OF POSITIVE PEACEThe attitudes, institutions and structures that sustain a peaceful society
Positive Peace has the
following
characteristics:
• systemic and complex
• preventative and slow
moving
• informal and formal
• underpins resilience
and non-violence
• virtuous or vicious

THE POSITIVE PEACE INDEX
Ranks 162 countries – 99.6% of global population
Using 24 indicators weighted on a 1-5 scale
3 indicators for each of the eight Positive Peace pillars
Weighting according to strength of correlation
Empiric in construction

Positive Peace Index Indicators
INSERT MAP
POSITIVE PEACE INDEX 2013

RISK AND RESILIENCEStrong link between violence and positive peace
DenmarkSwedenIceland
CanadaGermany United KingdomFrance
United States of America
PortugalChile South KoreaItaly
Uruguay Greece IsraelCosta RicaQatarCroatia
MalaysiaBahrainOmanArgentina Macedonia (FYR)
South AfricaBrazilGhana MexicoPeruGeorgiaMongolia ThailandKazakhstanJordan ColombiaTurkey
Saudi Arabia UkraineVietnamIndonesia RussiaChina
Ecuador Algeria PhilippinesSenegalIndia
EgyptTanzaniaBelarusZambia MaliCambodia SyriaMadagascar Bangladesh RwandaNepal UgandaLaos IranLiberiaSierra Leone Mauritania EthiopiaHaiti Pakistan
YemenDRC
0
20
40
60
80
100
120
140
0 20 40 60 80 100 120 140
PO
SITI
VE
PEA
CE
IND
EX R
AN
K 2
01
0
GLOBAL PEACE INDEX RANK 2014

WEAK POSITIVE PEACE = GREATER VULNERABILITY
Big fallers with
positive peace
deficits:
• Syria
• Rwanda
• Madagascar
• Egypt
Source: IEP

IEP RISK COMPARISONProminent fragility measures compared to IEP risk models
for 2008 to 2014.
Largest
Falls
2008-2013
Change in
GPI Score
World Bank
as Fragile in
2008
Failed
States
Index 2008
State
Fragility
Index 2008
IEP
Models
Syria -70% No Yes No Yes
Libya -39% No No No Yes
Rwanda -31% No No No Yes
Madagascar -27% Yes No No Yes
Oman -23% No No No Yes
Tunisia -21% No No No Yes
Cote d'Ivoire -19% No Yes No Yes
Yemen -18% No Yes No Yes
Mexico -18% No No No No
Bahrain -17% No No No Yes
Identified 1/10 3/10 0/10 9/10

VIRTUOUS CYCLE OF PEACE

See how a country performs on the Global Peace Index
Compare two or more countries
See changes in peace over time
Show the world according to one of the 23 indicators
Download the report, infographics and media release
INTERACTIVE MAPS

@GlobPeaceIndex


![[Ms. Schippa] What We Can Learn From Measuring Peace](https://img.dokumen.tips/doc/110x75/555a974bd8b42a3e268b49e0/ms-schippa-what-we-can-learn-from-measuring-peace.jpg)


