Embed Size (px)
Citation preview

144
Measuring Organizational Leanness Using Fuzzy Approach
Seyed Mahmod Zanjirchi, Hossein Sayyadi Tooranlo and Leili Zeidabadi Nejad
Economics, Management and Accounting Faculty
Yazd University, Iran
Abstract
To develop a methodology for measuring leanness degree in manufacturing companies using fuzzy logic.
Design/methodology/approach- evaluation methods based on human perceptions; make this kind of measuring
unreliable. Considering the deficiency, this research develop an approach based on linguistic variables and fuzzy
numbers for measuring organizational leanness, and finally use the method for measuring a manufacturing
organization`s leanness. The method developed is usable simply by practitioners and make more precise approximate
for leanness and then better improvement path for them. Using this method help practitioners to evaluate leanness more
precise than other methods presented by now and develop applied solutions to move toward organizational leanness
effectively. This is a new method based on fuzzy logic for measuring organizational leanness using human perceptions.
Keywords Lean production, Lean indexes, Measuring, Fuzzy logic.
1. Introduction One of the widest spread assertions about production is ending period of mass production era and substitution of novel
forms like flexible allocation instead. Waste management or lean production is a new phase of production, take mass
and craft production benefits altogether. This method is based on multi-skill workers as well as automatic and flexible
machines. In this method we try to reduce production space, investment on tools, engineering work time, and stagnant
inventory to half and make our attention to zero defects and zero inventory. In the lean production method, producers
desire in reducing resource consumption. In this method, work force, capital invested in machinery purchasing and
installation, space required for production, in progress products, materials, and products’ inventories and engineering
and design personnel are reduced to half. Therefore, designing and building preiod as well as distribution and selling of
a product would be halved, and this is just the main goal of lean production (Womack et al. 1990). After lean production
introduction in 1970s, many books and articles have been published regarding various aspects of leanness which show
the effect of this paradigm on the world of production and operations. orienting management research toward lean
concepts, lot of attempts devoted to development of a tool to measure organizational leanness, since in order to have
any kind of analysis, planning and then control (that from main elements of management), having a well-founded and
structured style for evaluation of concepts is inevitable (Sink and Tuttle, 1989). In this regard, various styles are
proposed by researchers for measuring organizational leanness, like methods according to logical concept of hierarchal
process which are developed for organizations’ comparison from view point of leanness (Agarwal et al., 2006). In this
process, Pairwise comparisons are used to assess organizations’ leanness capability. However, most researches use
integrated index for measuring organizational leanness, that is sum of simple or weighted items’ scores (Kojima and
Kaplinsky, 2004; Rivera and Chen, 2007; Shah and Ward, 2007).
Cited methods are simple and comprehensible, but since occasionally some of the lean indexes are ambiguous and have
unclear definition, and in some cases there is no enough evidence for assessment, or even experts do not have enough
ability to assess the indexes meaningfully, ambiguity and vagueness is hidden in the essence of lean assessment
methods. Therefore, using indexes to score lean capabilities has two limitations:
1. These techniques do not take in to account ambiguity and multiple probabilities related to the one person`s
perception and judgment about a number.
2. Estimator`s choice, preferences and Subjective judgments have prominent effect on these methods.
Therefore, using fuzzy logic and linguistic variables, may render a more exact assessment about the degree of
organizations’ leanness (Karwowski and Mital, 1986). Many of lean scales, when encounter with ambiguities and
multiple probabilities, are explained subjectively by linguistic variables. By using fuzzy concepts, estimators can use
linguistic variables as common lexical words and in order to assess the indexes and then link each linguistic variables to
a fuzzy membership function. Since fuzzy logic do not impose any assumptions about independence, integrity, or
monopoly of evidences, it makes it possible to use ambiguous boundaries in the definitions (Machacha and
Proceedings of the 2010 International Conference on Industrial Engineering and Operations Management
Dhaka, Bangladesh, January 9 – 10, 2010

145
Bhattacharya, 2000) and moreover it make possible to use qualitative data in measuring and assessment studies
appropriately using this approach, in this paper a model based on fuzzy logic has been developed, to prepare a proper tool
for measuring an organization’s leanness. In this approach, performance and preference weights of various lean capabilities
have been evaluated and expressed as linguistic variables by the experts. Then, appropriate fuzzy numbers for expression
of linguistic variables are defined and by performing fuzzy calculation operations, “fuzzy leanness index” (FLI) is attained.
Finally, FLI is matched to a proper linguistic variable and therefore lean level is expressed as linguistic variables. The
paper is organized as follows: In part 2 fuzzy logic and lean production literature are reviewed in details. Part 3 is
dedicated to the research algorithm and methodology. In part 4, developed method in the previous stages is employed to
assess an organization’s leanness as a case study, and finally the last part covers the discussion and conclusion.
2. Literature Review 2.1. Lean production
Two revolutions occurred in the production arena in 20th
century. The first revolution was set by Henry Ford and Alfred
Sloan after World War I which led to termination of craft production era the advent of mass production. The second
revolution was set by Taiichi Ohno at Toyota Company which caused creation of lean production method. In 1945, Eiji
Toyoda, founder of Toyota Company, in accompany with Kiichiro Toyoda and TaiiChi Ohno started to study Ford
production system. They inspire from Ford mass production system in order to modify it to Toyota and Japan’s needs
that led to design and accomplishment of Toyota’s production system named as “Just in time Production” (Wada,
2004). In 1988, the word “lean” was firstly used by Krafcik to describe Toyota production system (Krafcik, 1988).
However, the wide-spread use of this word postponed until 1990 when a book entitled as “The machine that changed
the world” was published (Womack et al., 1990). The book was compiled by Womack, Jones and Roos from MIT
University through research. They introduced lean production as a combination of Ford traditional production model
and social control model at Japanese production environment.
From the year 2000 up to now, a lot of experimental papers (Shah and Ward, 2003) and books with different
orientations are being written about lean production. Although, these researches enriched the literature of production
system, did not provide a unique and adaptive definition for lean production (Hopp and Spearman, 2004; De Treville
and Antonakis, 2006). In continuation, appropriate scales are defined through investigation of leanness conceptual and
operational definitions and used methods for measuring the lean scale at the literature. Shah and Ward (2007) pointed
out that three main problems exist in defining lean measures: The first problem is that some concepts are changing
through passing of time. For example preventive maintenance regarded as one of the important dimensions of Just in
time production (Sakakibara et al., 1993) but now is considered as an independent construct (McKone and Weiss, 1999).
The second problem is that similar items are used to operationalize highly different concepts and finally, the third
problem is opposite to the second one, in such a manner that different items are used to operationalize a single concept.
Measures for evaluating concepts are derived from definitions of those concepts in literature. Therefore, we first try to
investigate the discussed definition for leanness and present an appropriate definition for it. According to different
researchers, definition of lean production is trapped in a halo of ambiguity. Existing two approaches about lean
production caused this ambiguity to be exacerbated. The first approach is a philosophical one in relation to the
guidelines and lean goals (Womack and Jones, 1996; Spear and Bowen, 1999); the second approach, however, is a
executive and experimental one comprised of a collection of managerial practices, tools or techniques which might be
seen directly (Shah and Ward, 2003; Li et al., 2005). Such a difference may not necessarily cause inconformity;
however, it affects conceptual transparency of this domain.
Through a comprehensive study of presented researches and by mixing the mentioned elements in these definitions,
Shah and Ward (2007) give the following comprehensive definition for leanness: “Lean production is an integrated
socio-technical system whose main objective is to eliminate waste by concurrently reducing or minimizing supplier,
customer, and internal variability”. Wacker (2004) suggests that a conceptual definition should show evidence of clarity,
communicability, consistency, parsimony, differentiability, inclusivity, and exclusivity. This definition meets these
criteria and can be used as a lean definition in the present research. Different researchers, consider various dimensions
and parts for presented concepts in lean production’s definition. Simons and Zokaie (2005) consider lean production
philosophy based on waste elimination and searching for perfection and Kaizen; moreover they define lean production
strategy as lean stock, smooth production flow, workers training, encourage workers to participate and giving suggestion,
quality circles, long range relations with suppliers, preventive maintenance policy, and commitment to continuous
improvement. Kojima and Kaplinsky (2004) believe that lean production is measurable in three parts: flexibility,
continuous improvement, and quality. Sancheze and Perez (2000) measured leanness on the base of following criteria:
inventory turnover, lead time, and percentage of productive procedures documented in the organization. However, three

146
general parts, Just in Time production, total quality management, and total productivity management are referred by many
researchers (Cua et al., 2001; Katayama and Bennett, 1996; Sakakibara et al., 1997). Many of researchers consider
another important category as “human resources management” (Flynn and Sakakibara, 1995; Forza, 1996; Lowe, 1997;
MacDuffie, 1995; Smith et al., 2003; Shah and Ward, 2003).
By deep examination of the literature, Shah and Ward (2007) presented researches related to operational tools used to
measure lean production elements as table (1). The table shows that there are a lot of overlapping and confusion in this
regard. In this table, operational scales are in fact questions of survey questionnaires regarded as lean practices and tools
and are presented as manifest variables/items in the researches. These variables are settled in latent variables using
factor analysis and data reduction. These latent variables may be first hand (whenever the items are the base of their
exploitation) or second hand or more (whenever the latent variables themselves are under data reduction and factor
analysis). These scales show visible items of lean production. Totally, there are only three studies that specifically
measured lean production (Shah and Ward, 2003; Li et al., 2005; Shah and Ward, 2007). Shah and Ward (2003)
developed some criteria for lean production and made them operational as a set of practices related to total quality
management, total preventive maintenance, and human resources management. At the other hand, Li and his
Colleagues (2005) measured lean production with only 5 items including set up time, small lot size, and pull production.

147
Table 1: Lean production—charting the measurement instruments (Shah and Ward, 2003)
12 11 10 9 8 7 f 6 5 d 4 e
3 d 2 1 Scale/individual measure a,b,c
TQMb Just in time (JIT) principles
TQMa JIT Infrastructurec Quality management (QM)
Infrastructurec Infrastructurec
Workforce management
X Leana JITa
JITb JITb,c
JIT TBCb JITc
JITc JIT systemb
Setup time reduction
X JITa JITc
Flowb Small lot size (reduction)
Flowb Pull system (support)
X Leana JITa
JITb JITb,c
JIT TBCb JITc
JITc Flowb
Kanban/pull production
X JITb JITb,c
JITc Flowb
Equipment layout
X JITa (Continuous) flow
JITb JITb,c
TPMb JITc
JITc JIT systemb
Daily schedule adherence
X JITa JIT TBCb
Cellular manufacturing
X Leana TQMa
TBCb Continuous improvement
X TQMa TQMb
Quality anagementc TQMc
Statistical process control
X Workforce managementc JIT systemb
Group problem solving
X HRMb HRMb
Commonb,c TPMb
TQMb JIT systemb
Training
X HRMb HRMb
TPMb TQMb
Cross functional teams
X Commonb,c TBCb,1
Employee involvement
Workforce commitment
X TPMa JIT TBCb
JITc JIT systemb Preventive maintenance
JITb TQMb,c
Infrastructurec TQMc Flowb
Product design (simplicity)
X
JITb,c
JITc
Supplier
managementb
JIT delivery by suppliers
TQMb,c Quality managementc
Infrastructurec
Supplier
managementb
Supplier (quality) level
X Leana TQMb
TQMb TBCb
Infrastructurec Supplier relationship/involvement
X TQMb TQMb,c
TQMb TQMc
Customer focus/involvement
X JITb JIT links with customers
(1) Sakakibara et al. (1993); (2) Flynn et al. (1995); (3) Sakakibara et al. (1997); (4) Koufteros et al. (1998); (5) Koufteros and Vonderembse (1998); (6) Dow et al. (1999); (7)
McKone andWeiss (1999); (8) Cua et al. (2001); (9) Ahmad et al. (2003); (10) Shah and Ward (2003); (11) Li et al. (2005); (12) Shah and Ward, 2007). a Used as an item to measure a first order construct.
b Used as first order construct to measure a second order construct.
c Reduced the first order construct to a single score.
d Measurement items are not included in the study.
e TBC: time based competition.
f TPM: total preventive maintenance; 1-not included by Nahm et al. (2003) in their measures of TBC.

148
In their recent research, Shah and Ward ) 2007) with an comprehensive look and with regarding to all internal and
external dimensions of lean production tried to define and test appropriate scales for organizational leanness
measuring. In this study, at first, a list of lean items in the literature was extracted. Then, 10 practitioners were
interviewed in a structured manner for examining context validity and next the scales were tested by some of
practitioners and academics. The result list was comprised of 48 items. Explanatory factor analysis and reliability
test then was done using data from 63 organizations. After necessary corrections, 280 organizations’ data (unless
those organizations investigated at the pilot stage) were gathered and analyzed using new list. Authentic statistical
tests in addition to an exact method to validate lean items’ list, brought about a high reliability for identified items,
groups and latent variables extracted in this research. Moreover, with respect to acute change of lean dimensions
and elements presented at the literature over the time (Shah and Ward, 2007), it seems that comprehensiveness of
items, the power of research method used and its time approximation with the present study, would justify the use
of shah and ward`s lean items list in the current study.
2-2. Fuzzy logic
The criteria for measuring subjects and phenomena are different base on organizational behavior and research
requirements. Nevertheless, what that would be fix forever, is the process and method of measuring. In this process,
person or persons who enjoy enough expertise on the research question domain would change qualitative data to
differentiable values. However, care must be applied that such a methods, neglect ambiguity related to individuals
judgment and their value changes during transformation to numbers (Chakraborty, 1975). Fuzzy logic was first
introduced by Professor Zadeh (1965), in order to answer such a challenge. He believes that human’s logic can take
advantage of concepts and knowledge that do not have well-defined borders (Yen and Langari, 1999). Fuzzy logic
comprise a wide spectrum of theories and techniques mainly constructed upon four concepts: fuzzy sets, linguistic
variables, probability distribution (membership function), and fuzzy if-then rules (Yen and Langari, 1999). Fuzzy
sets and linguistic variables are widely used as the two fundamental concepts in qualitative assessments. Fuzzy set
is a set in which members’ certainty of membership is rejected and every member belong to the set with its own
specific membership degree ( ).
At the other hand, in a situation that required data are quantitative, expressing them in terms of numerical amounts
are allowed; however, when the research is in a qualitative environment and knowledge therein suffer from
ambiguity and vagueness, data may not be expressed as exact numbers, as if in the most researches it is claimed that
the most of managers cannot express an exact number in order to present their opinion and therefore linguistic
assessment is used instead of specific numerical values (Beach et al., 2000; Gerwin, 1993; Herrera and Herrera-
Viedma, 2000; Kacprzyk, 1986; Vokurka and O_Leary-Kelly, 2000). In these cases right values are fuzzy values
(eg. true, highly true, more or less true, false, probably false, and …), therefore such values are expressible as
linguistic variables and present more exact assessment (Zadeh, 1975,1987). Regularly, a proper linguistic variable is
set up for explanation of ambiguity and vagueness base on the problem domain. Then, expressions’ concept would
be determined using fuzzy numbers, which are defined through space [1,0] and membership function. Since
linguistic assessment is approximate, triangular and trapezoidal membership functions seem to be appropriate for
responding ambiguity of these assessments (Delgado et al., 1993). Several researchers have shown that fuzzy
membership function can reflect in mind the relative importance of linguistic words (Dyer and Sarin, 1979).
Therefore, we can apply fuzzy membership function approach for transforming linguistic beliefs to numbers in
interval scale (Hsiao, Article in Press, 2008). As if nowadays, the applicability of such an approach is more and
more visible in the following fields: information retrieval (Bordogna and Pasi, 1993), medical (Degani and
Bortolan, 1988), education (Law, 1996), suppliers’ selection (Herrera et al., 1999) and decision making (Tong and
Bonissone, 1980; Delgado et al., 1993; Yager, 1995; Herrera et al., 1995; Chen, 2000).
1- Research algorithm
The main goal of the paper is to render a method compatible to inexact human assessments for measuring
organizations’ leanness. This method stages are as follows:
1- Defining lean attributes: defining the lean attributes (enablers) is the first step in this algorithm. In this stage a
proper set of lean scales with high validity and reliability would be defined by a deep study of literature and
investigation of organizational lean assessment methods in the researchers’ surveys.
2- Defining proper linguistic variables: As mentioned, ambiguity existed in human assessment about items,
make using crisp methods unreliable. Fuzzy logic considering ambiguity and uncertainty, maintain an appropriate
tool for encountering with ambiguity in human assessments. Linguistic variables and relevant membership
functions have been extensively used by researchers in operations management. A variety of famous linguistic
variables and related membership functions are proposed for linguistic assessments (Karwowski and Mital, 1986;
Chen and Hwang, 1992). For convenience, we may directly use past studies or modify them according to the
research needs and respondent conditions, in order to define appropriate linguistic variables and their related

149
membership functions. However, as a general recommendation, the number of linguistic variables’ levels should
not exceed 9 levels which is recognized as human recognition limit (Lin et al., 2006).
3- Measuring performance and importance weight of lean enablers using linguistic variables: For proper
accomplishment of this stage it is necessary to identify experts who are familiar to industry conditions and
operations concepts especially lean production. To achieve higher validity and reliability, we should build a
common viewpoint about concepts (lean enablers) between researcher and experts. For this we may use descriptions
at the beginning of the questionnaire or take advantage of interview.
4- Integrating fuzzy importance Weights and performance of lean fuzzy enablers to achieve fuzzy lean index: A
variety of methods like arithmetic mean, median, or mode might be used to integrating decision makers
assessments. Since mean operator is used extensively in the researches, in this study it is used also in order to
collect experts’ opinions.
Assume that a committee of m evaluators, i.e., Et ,t = 1,2,...,m conducts the leanness evaluation. Let Fj, j = 1,2,...,n;
be factors for measuring leanness (enablers); let Rtj = (ajt ,bjt, cjt ) be the fuzzy numbers approximating the linguistic
ratings given to Ft by assessor Et. And let Wtj =(xjt, yjt, zjt) be the fuzzy numbers approximating the linguistic
importance weights assigned to Ft by assessor Et. using the average fuzzy rating Rj and average fuzzy importance
weight Wj, the aggregation of the opinions of experts then are calculated as
(1) Rj = (a j ,bj ,c j ) = (Rj1 (+)Rj2 (+)...(+)Rjm /m.
(2) Wj = (x j , y j , z j ) = (Wj1 (+)Wj2 (+)...(+)Wjm /m.
Fuzzy leanness index (FLI) is an information fusion, which consolidates the fuzzy ratings and fuzzy importance
weights of all of the factors (enablers) that influence leanness. FLI represents overall organizational leanness.
Organizational leanness increases with increasing FLI thus, the membership function of FLI is used to determine
the leanness level. Let Rj and Wj , j = 1,2,...,n; respectively, denote the average fuzzy rating and average fuzzy
importance weight given to factor j by the evaluation committee. The fuzzy leanness index, FLI, then is defined as
n
i
j
n
j
jj WRWFAI11
0 /)( (3)
The membership function of FLI can be calculated using the fuzzy weighted average operation; the calculation
can be found in Kao and Liu (Kao and Liu, 2001).
5- Match the fuzzy Leanness index with an appropriate linguistic level: Once the FLI is obtained, to identify the
leanness level, the FLI can be further matched with the linguistic label, the membership function which is the same
as (or closest to) the membership function of the FLI from the membership function of the natural-language
expression set of Leanness label (LL). Several methods have been proposed for matching the membership function
with linguistic terms, of which include (1) Euclidean distance,(2)successive approximation, and (3) piecewise
decomposition. This study recommends utilizing the Euclidean distance method since it is the most intuitive method
for humans to use in perceiving proximity (Guesgen and Albrecht, 2000).
6- Assuming the natural-language leanness level expression set is LL, then UFLI and ULLi represent the
membership functions of the FLI and natural-language leanness i, respectively. The distance between UFLI and ULLi
then can be calculated as:
2/1
2))()((),(
px
LLFLIi xUxULLFLIdi
(4)
}1,95.0,9.0,85.0,8.0,75.0,7.0,65.0,6.0,55.0,5.0,45.0,4.0,35.025.02.0,51.0,1.0,05.0,0{
.0.1....01,,...,, 100100
p
letsimplifyToxxxthatsooxxxpwhere mm
The distance from the FLI to natural-language leanness i can then be calculated, and the closest natural expression
with the smallest distance UFLI to ULLi can be identified.
4. Leanness Assessment using Fuzzy Logic Approach (Case Study) In this section, the above proposed method is used for measuring leanness level of a tile and ceramic producing
company. The steps are as follows:
Step 1: defining of lean enablers
The first step in successful measuring and analyzing an organization’s leanness is to define leanness enablers. In
this respect, the research team studied leanness and it`s enablers literature deeply and defined leanness scales on the
basis of enablers. These scales were then modified using industry executive experts’ opinions. The final list is
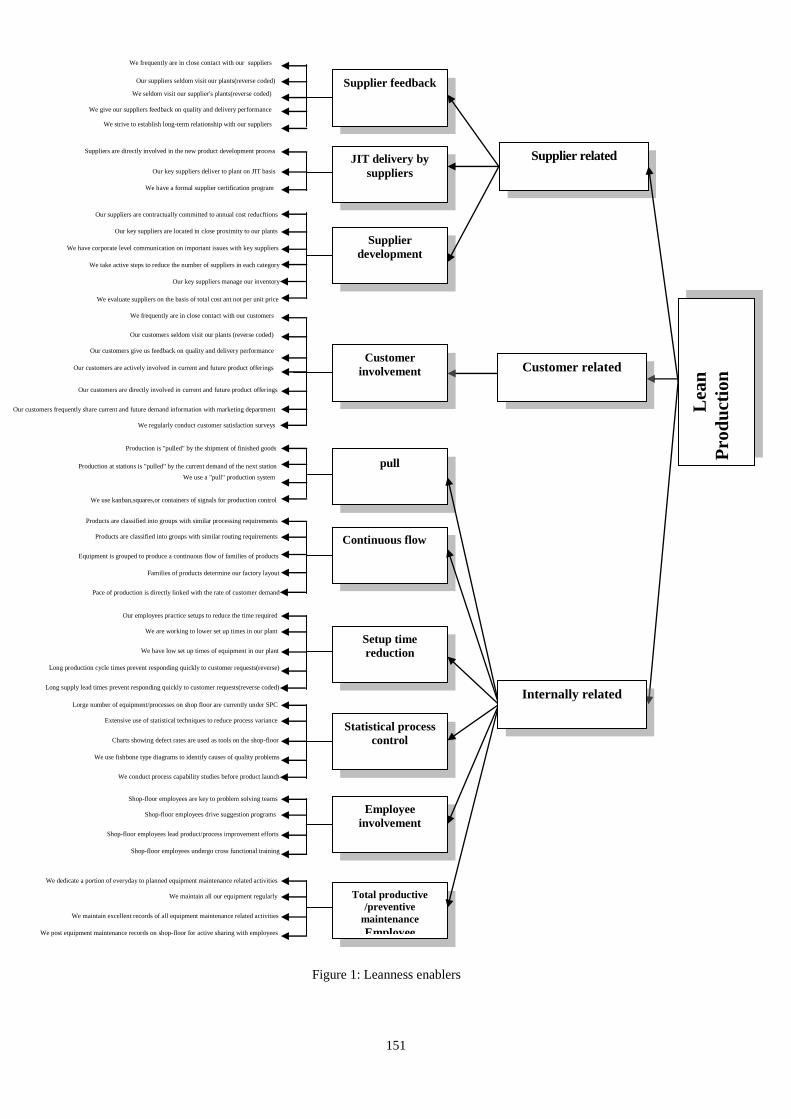
compiled according to Figure 1. The graph shows that there are 3 dimensions, 10 subdimensions and 48 items.

150
Step 2: Preparing assessors for assessing leanness items in the organization
The estimating team was chosen among tile and ceramic industry experts who have academic education in
production and operations related fields. To improve survey validity and build a common understanding for
concepts, concepts of organizational leanness, its history, and definitions of leanness items were described for
estimators firstly. Then leanness items were estimated using common agreement method.
Step 3: Designing linguistic variables for estimating leanness items
Using non general linguistic variables and related membership functions is always criticized in fuzzy logic (Lin et
al., 2006). In addition many linguistic variables and membership functions are proposed for linguistic assessments
(Chen and Hwang, 1992; Karwowski and Mital, 1986). Therefore, for convenience, we decided to use linguistic
variables and related membership functions from previous studies and adjust them to research needs. Therefore, On
the basis of the original data of the study conducted by Yang and Li (2002) and considering the human way of
perceiving differences, the linguistic variables{Excellent [E], Very Good [VG], Good [G], Fair [F], Poor [P], Very
Poor [VP], Worst [W]}, are selected to assess the performance rating of the leanness capabilities. Matching the
above mentioned linguistic variables with fuzzy numbers is being done according to a similar study accomplished
by Lin et al (Lin et al., 2006). These researchers proposed appropriate fuzzy numbers for these expressions (table 2)
base on individual understanding from the meaning of linguistic variables.
Stage 4: Assessment of leanness capabilities using linguistic variables and approximating them by fuzzy numbers
Assessment committee evaluated the organization’s performance and importance weight in every leanness items
using real data and their experience based on linguistic variables. The results are shown in the tables 3 and 4.
Stage 5: Calculation of fuzzy leanness index (FLI) using performance and importance weight of leanness items
Eq. 1 and 2 are being used for fuzzy score calculation of each items using their performance and importance. These
calculations are presented in table (4). Sum of items` fuzzy scores related to each dimension, make fuzzy scores of
sub dimensions` performance. These scores, also with a similar method, multiplying to the importance weights of
sub dimensions, totally build fuzzy scores of dimensions’ performance. Finally, the resulted scores multiplying to
importance of these dimensions would build fuzzy leanness index.
Table 2: Fuzzy numbers for approximating linguistic variable values
Performance-rating Importance-weighting
Linguistic variable Fuzzy number Linguistic variable Fuzzy number
Worst (W) (0, 0.5, 1.5) Very Low (VL) (0, 0.05, 0.15)
Very Poor (VP) (1, 2 ,3) Low (L) (0.1, 0.2, 0.3)
Poor (P) (2 ,3.5, 5) Fairly Low (FL) (0.2, 0.35, 0.5)
Fair (F) (3, 5, 7) Medium (M) (0.3, 0.5, 0.7)
Good (G) (5, 6.5, 8) Fairly High (FH) (0.5, 0.65, 0.8)
Very Good (VG) (7, 8 , 9) High (H) (0.7, 0.8, 0.9)
Excellent (E) (8.5, 9.5, 10) Very High (VH) (0.85, 0.95, 1)
Stage 6: Match the FLI with an appropriate Leanness level: Once the FLI has been obtained, to identify the level of
leanness, the FLI can be further matched with the linguistic label whose membership function is the same as (or
closest to) the membership function of the FLI from the natural-language expression set of leanness label (LL).
Figure 2 shows the method using Lin research (Lin et al., 2006). In order to determine linguistic variables fit to
leanness fuzzy score, it is necessary to calculate distance between this score and each of linguistic variables cited in
figure 2. calculating distances, the linguistic variable with the least distance would show organization`s leanness
degree. In order to calculate distance between the two fuzzy numbers following equation would be used. Suppose
that A and B are two triangular fuzzy numbers like ),,( 111 cbaA and ),,( 222 cbaB , then distance between
A and B is calculated as:
2
12
2
12
2
123
1, ccbbaaBAD (5)
)13.7,57.5,04.4(9.0,8.0,7.08.0,65.0,5.01,95.0,85.0
/9.0,8.0,7.082.7,33.6,85.48.0,65.0,5.059.7,88.5,18.41,95.0,85.014.6,71.4,29.3_ LeanF
W VP F G VG E
Fuzzy agility index
P
151
Figure 1: Leanness enablers
We have a formal supplier certification program
Our suppliers seldom visit our plants(reverse coded)
Suppliers are directly involved in the new product development process
Our key suppliers deliver to plant on JIT basis
Our suppliers are contractually committed to annual cost reducftions
Our key suppliers are located in close proximity to our plants
We have corporate level communication on important issues with key suppliers
We take active steps to reduce the number of suppliers in each category
Our key suppliers manage our inventory
Our customers are directly involved in current and future product offerings
We evaluate suppliers on the basis of total cost ant not per unit price
Our customers frequently share current and future demand information with marketing department
Production is "pulled" by the shipment of finished goods
Production at stations is "pulled" by the current demand of the next station
We use a "pull" production system
We use kanban,squares,or containers of signals for production control
We regularly conduct customer satisfaction surveys
Products are classified into groups with similar processing requirements
Products are classified into groups with similar routing requirements
Equipment is grouped to produce a continuous flow of families of products
Families of products determine our factory layout
Pace of production is directly linked with the rate of customer demand
Our employees practice setups to reduce the time required
We are working to lower set up times in our plant
We have low set up times of equipment in our plant
Long production cycle times prevent responding quickly to customer requests(reverse)
Long supply lead times prevent responding quickly to customer requests(reverse coded)
Lorge number of equipment/processes on shop floor are currently under SPC
Extensive use of statistical techniques to reduce process variance
Charts showing defect rates are used as tools on the shop-floor
We use fishbone type diagrams to identify causes of quality problems
We conduct process capability studies before product launch
Shop-floor employees are key to problem solving teams
Shop-floor employees drive suggestion programs
Shop-floor employees lead product/process improvement efforts
Shop-floor employees undergo cross functional training
We dedicate a portion of everyday to planned equipment maintenance related activities
We maintain all our equipment regularly
We maintain excellent records of all equipment maintenance related activities We maintain excellent records of all equipment maintenance related activities
We post equipment maintenance records on shop-floor for active sharing with employees
We frequently are in close contact with our suppliers
We seldom visit our supplier's plants(reverse coded)
We give our suppliers feedback on quality and delivery performance
Supplier feedback
JIT delivery by
suppliers
Supplier
development
Customer
involvement
L
ean
Pro
du
ctio
n
We frequently are in close contact with our customers
Our customers seldom visit our plants (reverse coded)
Our customers give us feedback on quality and delivery performance
Our customers are actively involved in current and future product offerings
We strive to establish long-term relationship with our suppliers
pull
Continuous flow
Setup time
reduction
Statistical process
control
Employee
involvement
Total productive
/preventive
maintenance
Employee
involvement
Supplier related
Customer related
Internally related

152
Table 3: Aggregated performance rating and aggregated importance weight of leanness capabilities
performance
rate
importance
weights ijLMI iLMI
performance
rate
importance
weights ijLMI iLMI
6LMI
1LMI
W M 61LMI G FL 11LMI
W M 62LMI VP L 12LMI
W M 63LMI F VL 13LMI
W M 64LMI F FL 14LMI
G FL 65LMI G FH 15LMI
7LMI 2LMI
F L 71LMI P FL 21LMI
VG M 72LMI F M 22LMI
VP FL 73LMI VP M 23LMI
F M 74LMI
F M 75LMI 3LMI
VP L 31LMI
8LMI VG M 32LMI
VP L 81LMI VP L 33LMI
VP L 82LMI F FH 34LMI
W FL 83LMI W M 35LMI
VG M 84LMI P L 36LMI
VG VL 85LMI
4LMI
9LMI P L 41LMI
P VL 91LMI P L 42LMI
P FL 92LMI P L 43LMI
VP M 93LMI G VL 44LMI
G M 94LMI G VL 45LMI
P L 46LMI
10LMI W VL 47LMI
G M 1,10LMI
VG M 2,10LMI 5LMI
P M 3,10LMI VP M 51LMI
P FL 4,10LMI G H 52LMI
W FL 53LMI
W VL 54LMI

153
Table 4: Linguistic terms approximated by fuzzy numbers
Weighted
performance rates
(Wij*Rij)
performance rates(Rij)
importance
weights
(Wij)
Weights of 10
subdimensions’
Weights of 3
dimensions’
(2.55 ,4.75 ,7) (3 ,5 ,7) (0.85 ,0.95 ,1) (0.7 ,0.8 ,0.9) (0.85 ,0.95 ,1) (1.7 ,3.325 ,5) (2 ,3.5 ,5) (0.85 ,0.95 ,1)
(2.55 ,4.75 ,7) (3 ,5 ,7) (0.85 ,0.95 ,1) (2.1 ,4 ,6.3) (3 ,5 ,7) (0.7 ,0.8 ,0.9)
(1.4 ,2.8 ,4.5) (2 ,3.5 ,5) (0.7 ,0.8 ,0.9)
(0.5 ,1.3 ,2.4) (1 ,2 ,3) (0.5 ,0.65 ,0.8) (0.85 ,0.95 ,1) (0.85 ,1.9 ,3) (1 ,2 ,3) (0.85 ,0.95 ,1)
(0.6 ,1.75 ,3.5) (2 ,3.5 ,5) (0.3 ,0.5 ,0.7)
(0.85 ,1.9 ,3) (1 ,2 ,3) (0.85 ,0.95 ,1) (0.85 ,0.95 ,1)
(0.7 ,1.6 ,2.7) (1 ,2 ,3) (0.7 ,0.8 ,0.9) (2.1 ,4 ,6.3) (3 ,5 ,7) (0.7 ,0.8 ,0.9)
(1.4 ,2.8 ,4.5) (2 ,3.5 ,5) (0.7 ,0.8 ,0.9) (3.5 ,5.2 ,7.2) (5 ,6.5 ,8) (0.7 ,0.8 ,0.9)
(4.9 ,6.4 ,8.1) (7 ,8 ,9) (0.7 ,0.8 ,0.9) (2.55 ,4.75 ,7) (3 ,5 ,7) (0.85 ,0.95 ,1) (0.7 ,0.8 ,0.9) (2.5 ,4.225 ,6.4) (5 ,6.5 ,8) (0.5 ,0.65 ,0.8)
(1.4 ,2.8 ,4.5) (2 ,3.5 ,5) (0.7 ,0.8 ,0.9) (1.4 ,2.8 ,4.5) (2 ,3.5 ,5) (0.7 ,0.8 ,0.9)
(0.5 ,1.3 ,2.4) (1 ,2 ,3) (0.5 ,0.65 ,0.8) (1.7 ,3.325 ,5) (2 ,3.5 ,5) (0.85 ,0.95 ,1)
(0.7 ,1.6 ,2.7) (1 ,2 ,3) (0.7 ,0.8 ,0.9)
(3.5 ,5.2 ,7.2) (5 ,6.5 ,8) (0.7 ,0.8 ,0.9) (0.85 ,0.95 ,1) (3.5 ,5.2 ,7.2) (5 ,6.5 ,8) (0.7 ,0.8 ,0.9)
(3.5 ,5.2 ,7.2) (5 ,6.5 ,8) (0.7 ,0.8 ,0.9) (4.9 ,6.4 ,8.1) (7 ,8 ,9) (0.7 ,0.8 ,0.9)
(4.9 ,6.4 ,8.1) (7 ,8 ,9) (0.7 ,0.8 ,0.9) (0.7 ,0.8 ,0.9) (4.9 ,6.4 ,8.1) (7 ,8 ,9) (0.7 ,0.8 ,0.9)
(4.9 ,6.4 ,8.1) (7 ,8 ,9) (0.7 ,0.8 ,0.9) (4.9 ,6.4 ,8.1) (7 ,8 ,9) (0.7 ,0.8 ,0.9)
(4.25 ,6.175 ,8) (5 ,6.5 ,8) (0.85 ,0.95 ,1)
(3.5 ,5.2 ,7.2) (5 ,6.5 ,8) (0.7 ,0.8 ,0.9) (0.5 ,0.65 ,0.8) (0.5 ,0.65 ,0.8) (3.5 ,5.2 ,7.2) (5 ,6.5 ,8) (0.7 ,0.8 ,0.9)
(2.1 ,4 ,6.3) (3 ,5 ,7) (0.7 ,0.8 ,0.9) (4.25 ,6.175 ,8) (5 ,6.5 ,8) (0.85 ,0.95 ,1)
(2.55 ,4.75 ,7) (3 ,5 ,7) (0.85 ,0.95 ,1)
(4.9 ,6.4 ,8.1) (7 ,8 ,9) (0.7 ,0.8 ,0.9) (0.7 ,0.8 ,0.9) (0.7 ,0.8 ,0.9) (3.5 ,5.2 ,7.2) (5 ,6.5 ,8) (0.7 ,0.8 ,0.9)
(3.5 ,5.2 ,7.2) (5 ,6.5 ,8) (0.7 ,0.8 ,0.9) (3.5 ,5.2 ,7.2) (5 ,6.5 ,8) (0.7 ,0.8 ,0.9)
(2.1 ,4 ,6.3) (3 ,5 ,7) (0.7 ,0.8 ,0.9)
(2.5 ,4.225 ,6.4) (5 ,6.5 ,8) (0.5 ,0.65 ,0.8) (0.85 ,0.95 ,1) (2.5 ,4.225 ,6.4) (5 ,6.5 ,8) (0.5 ,0.65 ,0.8)
(1.5 ,3.25 ,5.6) (3 ,5 ,7) (0.5 ,0.65 ,0.8) (0.6 ,1.75 ,3.5) (2 ,3.5 ,5) (0.3 ,0.5 ,0.7)
(4.9 ,6.4 ,8.1) (7 ,8 ,9) (0.7 ,0.8 ,0.9) (0.5 ,0.65 ,0.8)
(3.5 ,5.2 ,7.2) (7 ,8 ,9) (0.5 ,0.65 ,0.8) (2.1 ,4 ,6.3) (7 ,8 ,9) (0.3 ,0.5 ,0.7)
(1.5 ,3.25 ,5.6) (3 ,5 ,7) (0.5 ,0.65 ,0.8)

154
Table 5: Weighted performance for leanness dimensions
performance of 3
dimensions’ (Ri*Wj) Rj* Wj
performance of 10
subdimensions’ (Ri)
Weights of 10
subdimensions’ (Wj)
Weights of 3
dimensions’
(3..29, 4.71. 6.14) (1.82 ,3.52
,5.58)
(2.60 ,4.41 ,6.20) (0.7 ,0.8 ,0.9) (0.85 ,0.95 ,1)
(1.84 ,3.53
,5.26)
(2.16 ,3.72 ,5.26) (0.85 ,0.95 ,1) (3.06 ,4.75 ,6.4) (3.6 ,5 ,6.4) (0.85 ,0.95 ,1)
(1.15 ,2.36
,3.82)
(1.65 ,2.95 ,4.24) (0.7 ,0.8 ,0.9) (2.86 ,4.46
,6.02)
(3.37 ,4.69 ,6.02) (0.85 ,0.95 ,1)
(4.57 ,6.12
,7.90)
(6.53 ,7.65 ,8.78) (0.7 ,0.8 ,0.9)
(4.18, 5.88, 7.59) (2.09 ,3.82
,6.07)
(4.18 ,5.88 ,7.59) (0.5 ,0.65 ,0.8) (0.5 ,0.65 ,0.8) (4.85, 6.33, 7.82) (3.5 ,5.2 ,7.2) (5 ,6.5 ,8) (0.7 ,0.8 ,0.9) (0.7 ,0.8 ,0.9)
(3.94 ,5.81
,7.61)
(4.64 ,6.11 ,7.61) (0.85 ,0.95 ,1) (2.50 ,4.18
,6.30)
(5.01 ,6.44 ,7.87) (5 ,6.5 ,8)
Figure 2: Linguistic levels to match fuzzy-agility-index
With respect to the above equation, distance between leanness fuzzy score with each of leanness linguistic variables
is as follow:
D (FLI, very low) = 4.96 D (FLI, low) = 3.61
D (FLI, relatively low) = 2.08 D (FLI, medium) = 0.69
D (FLI, relatively high) = 0.92 D (FLI, high) = 2.54
D (FLI, very high) = 3.80
Thus, by matching a linguistic label with the minimum D, the leanness index level of the company can be identified
as ‘‘medium lean’, as shown in Fig. 1.
5. Conclusion Nevertheless developing lean production in recent years, there are some steps to it`s maturity. In fact there are some
questions about leanness requirements: to what extent a company should be lean? What index should be used to
measure organization leanness? How could organization leanness be measured? Answering this question is vital for
leanness specialists and for developing lean theory. Then this research goal is answering some of these questions by
special attention on leanness measuring. At the first step, we defined leanness concepts, dimensions and measures
using a deep study of literature. Considering vagueness and uncertainty in human evaluation, At the second step, we
developed a fuzzy method to measure organizational leanness. The fuzzy method include three stages: at the first,
each measure’s performance and importance weight and each subdimensions and dimensions` importance weight
were measured in linguistic variables. At the second step, subdimensions and dimensions performance were
calculated using performances and importance weights were asked in the last stage. At the end of this step fuzzy
leanness index was calculated using dimensions performance and weights and finally third step dedicated to
converting fuzzy leanness index to a linguistic variable. At the end, developed method was used for measuring an
organization leanness and results showed the power and accuracy of this method.
References 1. Agarwal, A., Shankar, R. and Tiwari, M.K. (2006), "Modeling the metrics of lean, agile and legible supply
chain: An ANP-based approach", European Journal of Operational Research, Vol. 173, No.1, pp. 211-225.
W VP F G VG E
Fuzzy agility index
P

155
2. Ahmad, S., Schroeder, R.G., Sinha, K.K., 2003. The role of infrastructure practices in the effectiveness of
JIT practices: implication for plant competitiveness. J. Engineering Tech. Management 20 (3), 161–191.
3. Beach, R., Muhlemann, A.P., Price, D.H.R., Paterson, A. and Sharp, J.A. (2000), "A review of
manufacturing flexibility", European Journal of Operational Research, Vol. 122, pp. 41–57.
4. Bordogna, G. and Pasi, G. (1993), "A fuzzy linguistic approach generalising boolean information retrieval:
a model and its evaluation", Information Systems, Vol. 44, pp. 70–82.
5. Chakraborty, D., Optimization in impressive and uncertain environment, Ph.D. Thesis, Dept. of
Mathematics, IIT Kharagpur, 1975.
6. Chen, C.-T. (2000), "Extensions oft he TOPSIS for group decision-making under fuzzy environment",
Fuzzy Sets and Systems, Vol. 114, pp. 1–9.
7. Chen, S.J. and Hwang, C.L. (1992), Fuzzy Multiple Attribute Decision Making Methods and Application.
Springer, Berlin, Heidelberg.
8. Cua, K.O., McKone, K.E. and Schroeder, R.G. (2001), "Relationships between implementation of TQM,
JIT, and TPM and manufacturing performance", J. Operations Management, Vol. 19 No. 2, pp. 675–694.
9. De Treville, S. and Antonakis, J. (2006), "Could lean production job design be intrinsically motivating?
Contextual, configurational and levels-of-analysis issue", J. Oper. Management, Vol. 24. No. 2, pp. 99–123.
10. Degani, R. and Bortolan, G. (1988), "The problem of linguistic approximation in clinical decision making",
Int. J. Approx.Reasoning, Vol. 2, pp. 143–162.
11. Delgado, M., Verdegay, J.L. and Vila, v, (1993), "Linguistic decision making models", Int. J. Intel.
Systems, Vol. 7, pp. 479–492.
12. Dow, D., Samson, D., Ford, S., 1999. Exploding the myth: do all quality management practices contribute
to superior quality performance? Production and Operations Management 8 (1),1–27.
13. Dyer, J. S. and Sarin, R. K. (1979), "Measurable multiattribute value functions" Operations Research, Vol.
39, pp. 810–822.
14. Flynn, B.B. and Sakakibara, S. (1995), "Relationship between JIT and TQM: practices and performance",
Academy of Management Journal, Vol. 38 No. 5, p. 1325.
15. Flynn, B.B., Sakakibara, S. and Schroeder, R.G. (1995), "Relationship between JIT and TQM: practices and
performance", Academy of Management Journal, Vol. 38 No. 5, pp. 1325–1360.
16. Forza, C. (1996), "Work organization in lean production and traditional plants – what are the differences",
International Journal of Operations & Production Management, Vol. 16 No. 2, p. 42.
17. Gerwin, D. (1993), "Manufacturing flexibility: A strategic perspective", Management Science, Vol. 39, No.
4, pp. 395–410.
18. Guesgen, H.W. and Albrecht, J. (2000), "Imprecise reasoning in geographic information systems", Fuzzy
Sets and Systems, Vol. 113, pp. 121–131.
19. Herrera, F. and Herrera-Viedma, E. (2000), "Linguistic decision analysis: Steps for solving decision
problems under linguistic information", Fuzzy Sets and Systems, Vol. 115, pp. 67–82.
20. Herrera, F., Herrera-Viedma, E. and Verdegay, J.L. (1995), "A sequential selection process in group
decision making with linguistic assessment", Inform. Sci. Vol.85, pp. 223–239.
21. Herrera, F., Lopez, E., Menda˜na, C. and Rodriguez, M. (1999), "A linguistic decision model to suppliers
selection in international purchasing", in: L.A. Zadeh, J. Kacprzyk (Eds.), Computing with words in
information=intelligent systems 2. Applications, Physica-Verlag, Schursberg, pp. 500–524.
22. Hopp, W.J. and Spearman, M.L. (2004), "To pull or not to pull: what is the question?", Manufacturing and
Service Operations Management, Vol. 6 No. 2, pp. 133–148.
23. Hsiao, W.F., Lin, H.H. and Chang, T.M. (2008), "Fuzzy consensus measure on verbal opinions", Expert
Systems with Applications xxx, xxx–xxx
24. Kacprzyk, J. (1986), "Group decision making with a fuzzy linguistic majority", Fuzzy Sets and Systems,
VOL. 18, PP. 105–118.
25. Kao,C. and Liu, S.T. (2001), "Fractional programming approach to fuzzy weighted average", Fuzzy Sets
and Systems, Vol. 120, pp. 435–444.
26. Karwowski, W. and Mital, A.(1986), Applications of approximate reasoning in risk analysis. In:
Karwowski, W. and Mital, A.(Eds.), Applications of Fuzzy Set Theory in Human Factors, Netherlands.
27. Katayama, H. and Bennett, D. (1996), "Lean production in a changing competitive world: a Japanese
perspective", International Journal of Operations & Production Management, Vol. 16 No. 2, pp. 8-23.
28. Kojima, S. and Kaplinsky, R. (2004), "The use of a lean production index in explaining the transition to
global competitiveness: the auto components sector in South Africa", Technovation, Vol. 24, pp. 199–206.
29. Koufteros, X.A., Vonderembse, M.A., Doll, W.J., 1998. Developing measures of time based manufacturing.
Journal of Operations Management 16 (1), 21–41.
30. Koufteros, X.A., Vonderembse, M.A., 1998. The impact of organizational structure on the level of JIT attainment.
International Journal of Production Research 36 (10), 2863–2878.
156
31. Krafcik, J.F. (1988) "Triumph of the lean production system", Sloan Management Review, Vol. 30 No. 1,
pp. 41–52.
32. Law, C.K. (1996), "Using fuzzy numbers in educational grading system", Fuzzy Sets and Systems, Vol. 83,
pp. 311–323.
33. Li, S., Subba Rao, S., Ragu-Nathan, T.S. and Ragu-Nathan, B. (2005), "Development and validation of a
measurement instrument for studying supply chain management practices", Journal of Operations
Management, Vol. 23, No. 6, pp. 618–641.
34. Lin, C.T, Chiu, H. and Tseng, Y. H. (2006), "Agility evaluation using fuzzy logic", Int. J. Production
Economics, Vol. 101 No. 2, pp. 353-368.
35. Lowe, J., Delbridge, R. and Oliver, N. (1997), "High-performance manufacturing – evidence from the
automotive components industry", Organization Studies, Vol. 18 No. 5, pp. 783-98.
36. MacDuffie, J.P. (1995), "Human resource bundles and manufacturing performance: organizational logic
and flexible production systems in the world auto industry", Industrial and Labour Relations Review, Vol.
48 No. 2, p. 197.
37. Machacha, L.L. and Bhattacharya, P. (2000), "A fuzzy logic-based approach to project selection", IEEE
Transactions on Engineering Management, Vol. 47 No 1, pp. 65–73.
38. McKone, K.E. and Weiss, E.N. (1999), "Total productive maintenance: bridging the gap between practice
and research", Production and Operations Management, Vol. 7, No. 4, pp. 335–351.
39. Rivera, A. and Chen, F.F. (2007), "Measuring the impact of Lean tools on the cost–time investment of a
product using cost–time profiles", Robotics and Comp.-Int. Manufacturing, Vol. 23 No. 6, pp. 684-689.
40. Sakakibara, S., Flynn, B.B. and Schroeder, R.G. (1993), "A framework and measurement instrument for
just-in-time manufacturing", Production and Operations Management, Vol. 2, No. 3, pp. 177–194.
41. Sakakibara, S., Flynn, B.B., Schroeder, R.G. and Morris,W.T. (1997), The impact of just-in-time
manufacturing and its infrastructure on manufacturing performance” Management Science, Vol. 43 No. 9,
pp. 1246–1257.
42. Sanchez, A. and Perez, M. (2000), "Lean indicators and manufacturing strategies", International Journal of
Operations & Production Management, Vol. 21 No. 11, pp. 1-13.
43. Shah, R. and Ward, P.T. (2003), "Lean manufacturing: context, practice bundles, and performance", Journal
of Operations Management, Vol. 21, No. 2, pp. 129–149.
44. Shah, R. and Ward, P.T. (2007), "Defining and developing measures of lean production", Journal of
Operations Management, Vol. 25, No. 4, pp. 785-805.
45. Simons ,D and Zokaei , K (2005), "Application of lean paradigm in red meat processing", British Food
Journal, Vol. 107 No. 4, pp. 192-211.
46. Sink, D.s. and Tuttle, T.c. (1989), Planning and measurement in your organization of the future, Industrial
Engineering and Management Press, Norcross, GA.
47. Smith, A., Oczkowski, E., Noble, C. and Macklin, R. (2003), "New management practices and enterprise
training in Australia", International Journal of Manpower, Vol. 24 No. 1, p. 31.
48. Spear, S. and Bowen, H.K. (1999), "Decoding the DNA of the Toyota Production System". Harvard
Business Review ,Vol. 77, No. (9/10), pp.97–106.
49. Tong, M. and Bonissone. (1980), "A linguistic approach to decision making with fuzzy sets", IEEE Trans.
Systems, Man Cybernet., Vol. 10, pp. 716–723.
50. Vokurka, R.J. and O_Leary-Kelly, S.W. (2000), "A review of empirical research on manufacturing
flexibility", Journal of Operations Management, Vol. 18, pp. 485–501.
51. Wacker, J.G. (2004). "A theory of formal conceptual definitions: developing theory building measurement
instruments", Journal of Operations Management, Vol. 23, No. 4, pp. 629–650.
52. Wada, K. (2004), Kiichiro Toyoda and the Birth of the Japanese Automobile Industry: Reconsideration of
the Toyoda-Platts Agreement, Working paper #CIRJE-F-288, University of Tokyo.
53. Womack, J.P. and Jones, D.T. (1996), Lean Thinking: Banish Waste and Create Wealth in Your
Corporation. Simon & Schuster, New York.
54. Womack, J.P., Jones, D.T., Roos, D., 1990. The Machine that Changed the World. Harper Perennial, N
55. Yager, R.R. (1995), "An approach to ordinal decision making", Int. J. Approx. Reasoning, 12, 237–261.
56. Yang, S.L. and Li, T.F. (2002), “Agility evaluation of mass customization product manufacturing”, Journal
of Materials Processing Technology, Vol. 129, pp. 640–644.
57. Yen, J. and Langari, R. (1999), "Fuzzy Logic Intelligence", Information and Control, Prentice Hall.
58. Zadeh, L.A. (1965), "Fuzzy sets", Information and Control, No. 8, pp. 338–353.
59. Zadeh, L.A. (1975), "The concept of linguistic variable and its application to approximate reasoning",
Information and Control. Sci. I: 8, pp.199–249; II: 8, pp. 310–357; III: 9, pp. 43–80.
60. Zadeh, L.A. (1987), "Fuzzy sets, usuality and common-sense reasoning, in: L.M. Vaina (Ed.)", Matters of
Intelligence, Reidel, Dordrecht, pp. 289–309.