Embed Size (px)
Citation preview

Measuring Oil’s Role in Latin American Economic Growth
Guillermo Perry
Chief Economist for Latin America & Caribbean,
The World Bank
Houston, TexasNovember 16, 1999

Relative Price of Oil (Index by Export Unit Value of OECD Countries)
0
0.1
0.2
0.3
0.4
0.5
0.6
Jan
-60
Jan
-62
Jan
-64
Jan
-66
Jan
-68
Jan
-70
Jan
-72
Jan
-74
Jan
-76
Jan
-78
Jan
-80
Jan
-82
Jan
-84
Jan
-86
Jan
-88
Jan
-90
Jan
-92
Jan
-94
Jan
-96
Jan
-98

Average Relative Price of Oil(With Standard Deviations)
0
0.1
0.2
0.3
0.4
0.5
Jan
-57
Jan
-59
Jan
-61
Jan
-63
Jan
-65
Jan
-67
Jan
-69
Jan
-71
Jan
-73
Jan
-75
Jan
-77
Jan
-79
Jan
-81
Jan
-83
Jan
-85
Jan
-87
Jan
-89
Jan
-91
Jan
-93
Jan
-95
Jan
-97
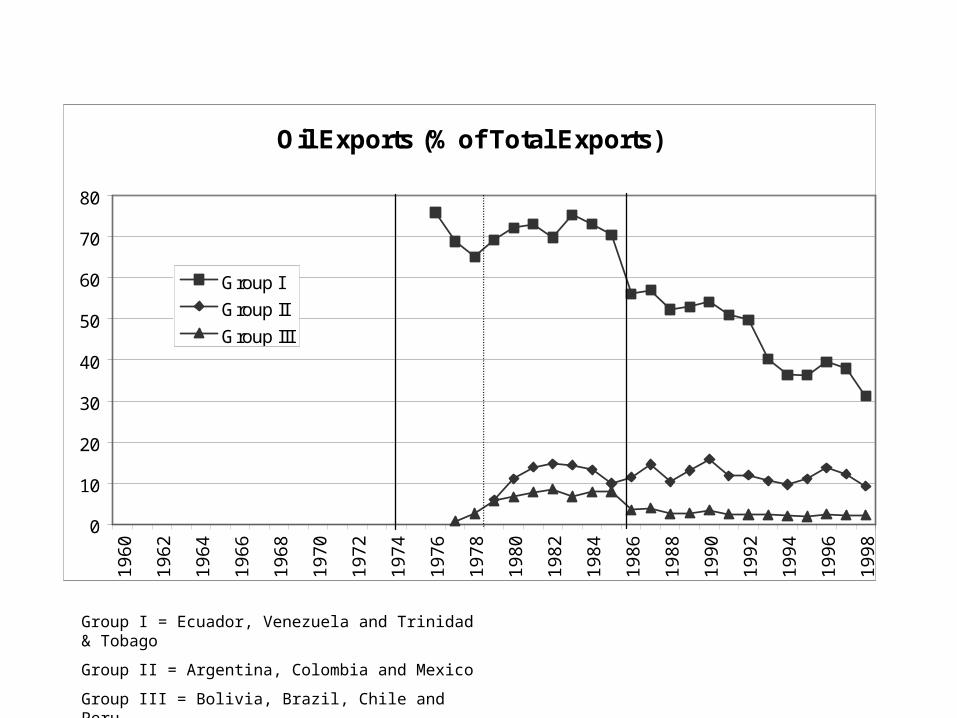
Group I = Ecuador, Venezuela and Trinidad & Tobago
Group II = Argentina, Colombia and Mexico
Group III = Bolivia, Brazil, Chile and Peru
Oil Exports (% of Total Exports)
0
10
20
30
40
50
60
70
80
1960
1962
1964
1966
1968
1970
1972
1974
1976
1978
1980
1982
1984
1986
1988
1990
1992
1994
1996
1998
Group I
Group II
Group III

Non-Oil Exports (% of GDP)
0
5
10
15
20
25
30
1960
1962
1964
1966
1968
1970
1972
1974
1976
1978
1980
1982
1984
1986
1988
1990
1992
1994
1996
1998
Group I
Group II
Group III
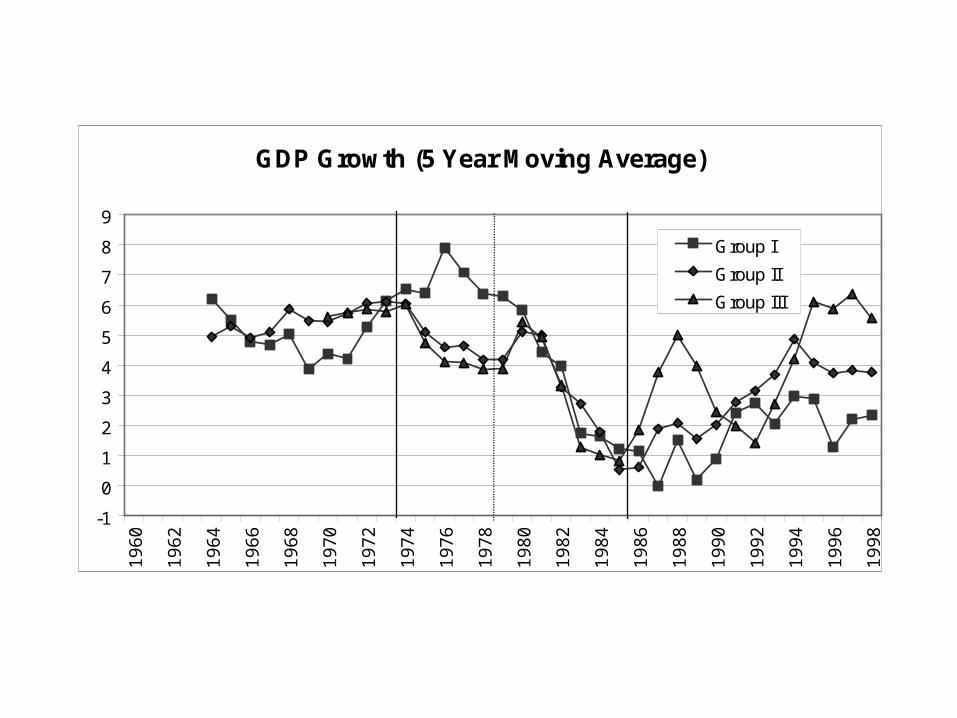
GDP Growth (5 Year Moving Average)
-1
0
1
2
3
4
5
6
7
8
9
1960
1962
1964
1966
1968
1970
1972
1974
1976
1978
1980
1982
1984
1986
1988
1990
1992
1994
1996
1998
Group I
Group II
Group III
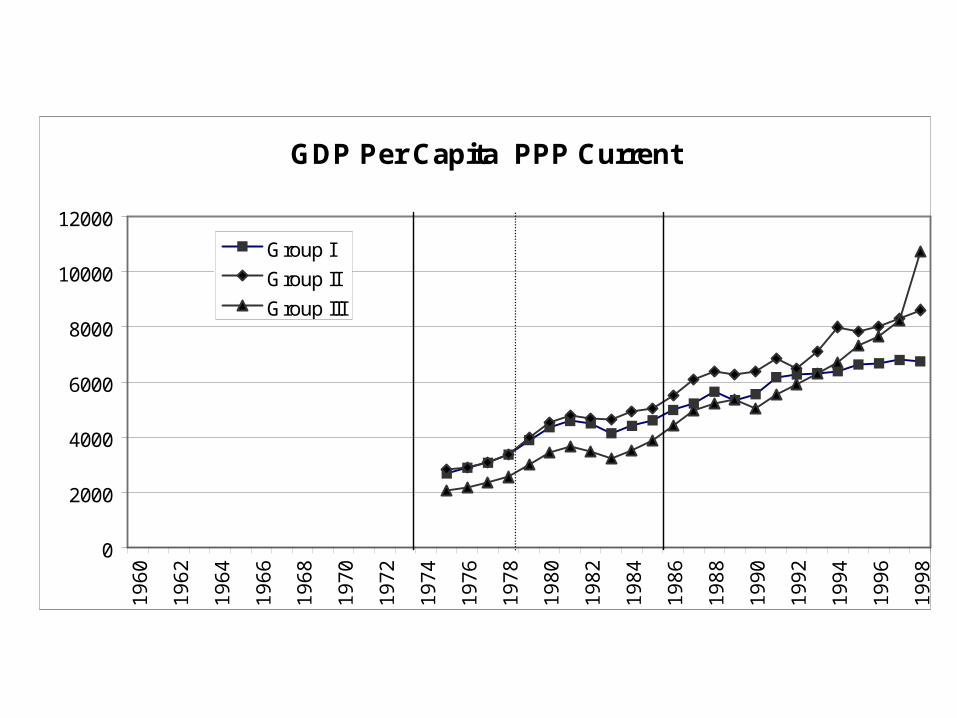
GDP Per Capita PPP Current
0
2000
4000
6000
8000
10000
12000
1960
1962
1964
1966
1968
1970
1972
1974
1976
1978
1980
1982
1984
1986
1988
1990
1992
1994
1996
1998
Group I
Group II
Group III
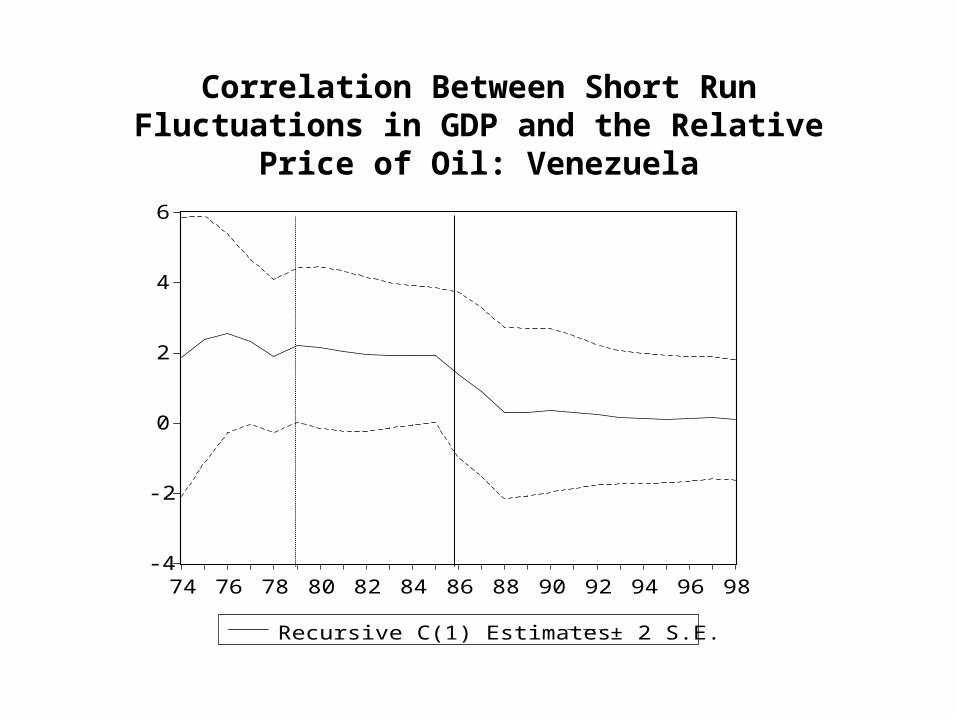
Correlation Between Short Run Fluctuations in GDP and the Relative Price of Oil: Venezuela
-4
-2
0
2
4
6
74 76 78 80 82 84 86 88 90 92 94 96 98
Recursive C(1) Estimates ± 2 S.E.

0.0
0.1
0.2
0.3
0.4
0.5
76 78 80 82 84 86 88 90 92 94 96
Recursive C(1) Estimates ± 2 S.E.
Correlation Between Short Run Fluctuations in GDP and the Relative Price of Oil: Mexico
-0.2
-0.1
0.0
0.1
0.2
0.3
0.4
74 76 78 80 82 84 86 88 90 92 94 96 98
Recursive C(1) Estimates ± 2 S.E.
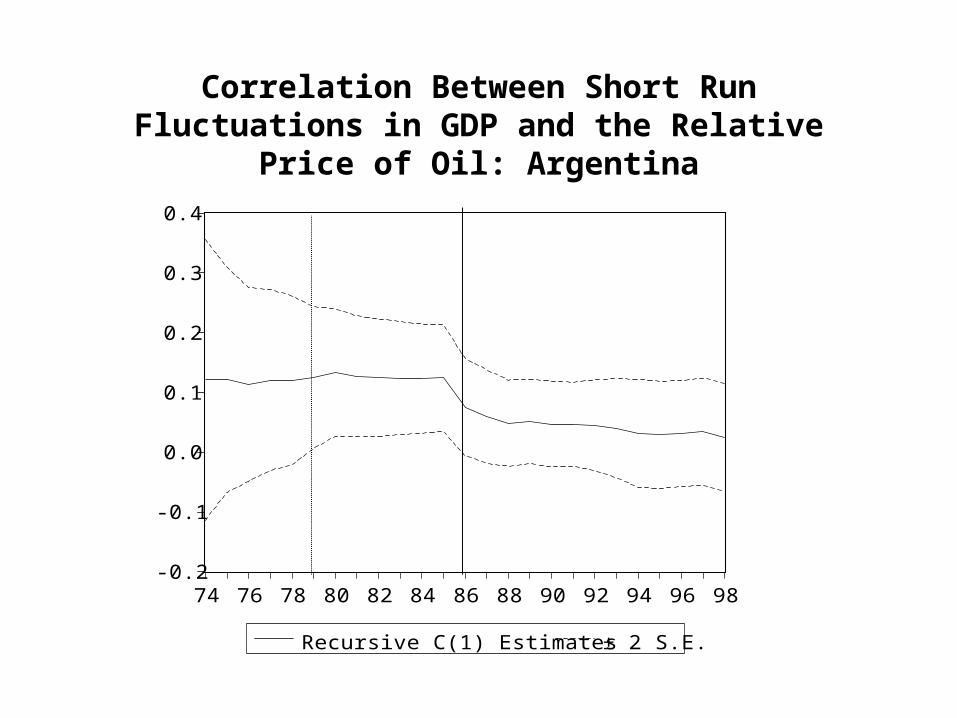
Correlation Between Short Run Fluctuations in GDP and the Relative Price of Oil: Argentina
-0.2
0.0
0.2
0.4
0.6
74 76 78 80 82 84 86 88 90 92 94 96 98
Recursive C(1) Estimates ± 2 S.E.
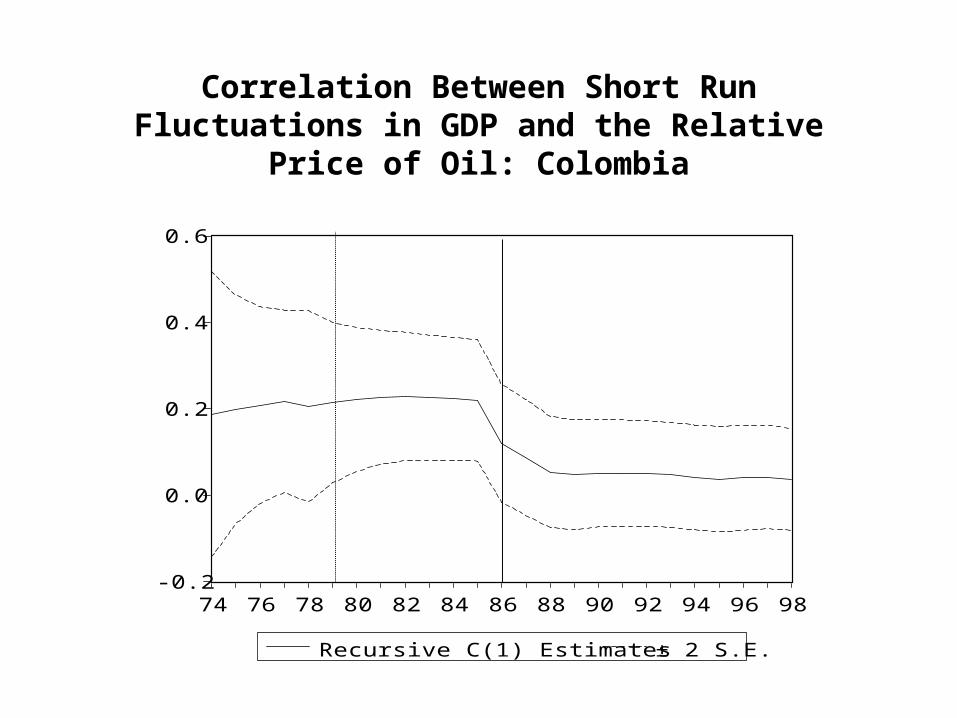
Correlation Between Short Run Fluctuations in GDP and the Relative Price of Oil: Colombia

Investments (% of GDP, 5 Year Moving Average)
0
5
10
15
20
25
30
35
1960
1962
1964
1966
1968
1970
1972
1974
1976
1978
1980
1982
1984
1986
1988
1990
1992
1994
1996
1998
Group I
Group II
Group III

Savings (% of GDP, 5 Year Moving Average)
0
5
10
15
20
25
30
35
40
1960
1962
1964
1966
1968
1970
1972
1974
1976
1978
1980
1982
1984
1986
1988
1990
1992
1994
1996
1998
Group I
Group II
Group III

NFPSB (% of GDP)
-30
-25
-20
-15
-10
-5
0
5
1980
1981
1982
1983
1984
1985
1986
1987
1988
1989
1990
1991
1992
1993
1994
1995
1996
1997
1998
Group I
Group II
Group III
Note: Trinidad & Tobago is not included in Group I.

Note: Argentina not included in Group II.
Government Expenditures (% of GDP)
0.0
2.0
4.0
6.0
8.0
10.0
12.0
14.0
16.0
18.0
1960
1962
1964
1966
1968
1970
1972
1974
1976
1978
1980
1982
1984
1986
1988
1990
1992
1994
1996
1998
Group I
Group II
Group III
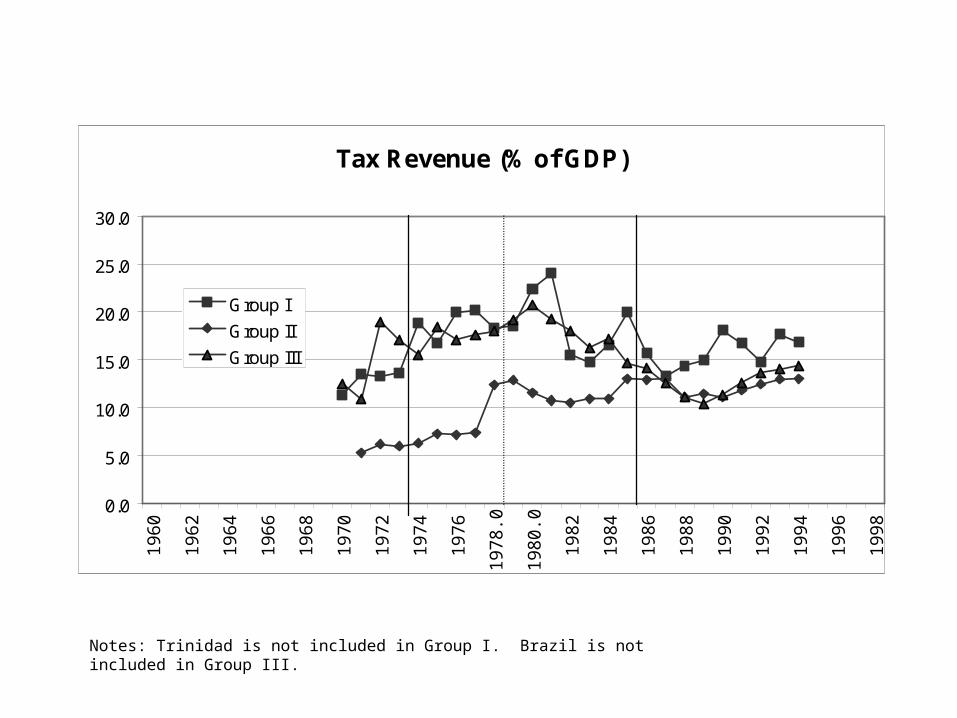
Tax Revenue (% of GDP)
0.0
5.0
10.0
15.0
20.0
25.0
30.0
1960
1962
1964
1966
1968
1970
1972
1974
1976
1978
.0
1980
.0
1982
1984
1986
1988
1990
1992
1994
1996
1998
Group I
Group II
Group III
Notes: Trinidad is not included in Group I. Brazil is not included in Group III.
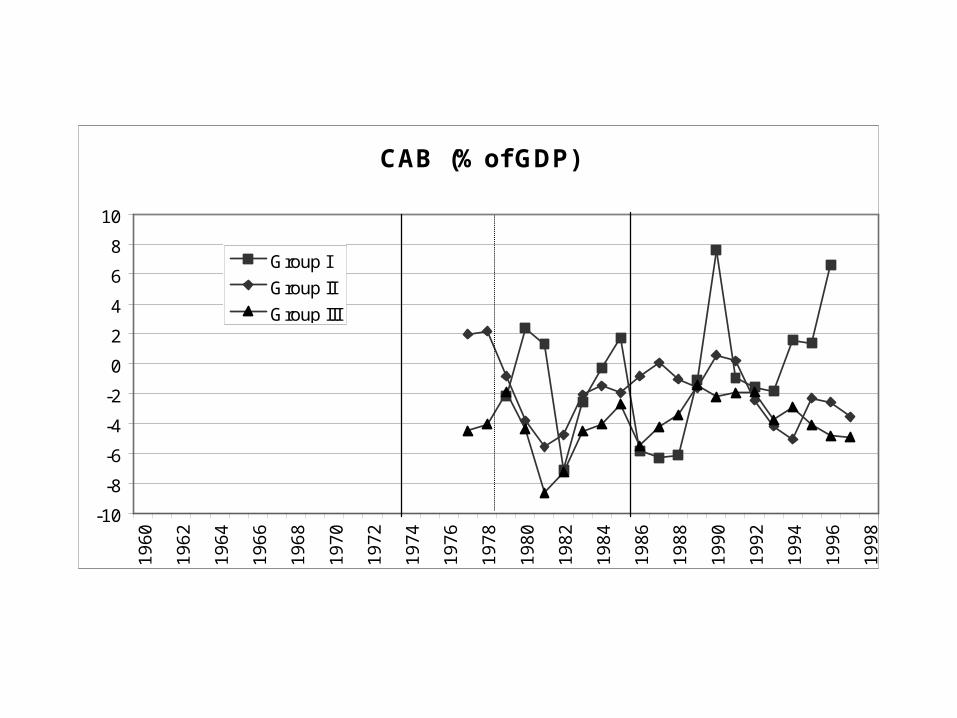
CAB (% of GDP)
-10
-8
-6
-4
-2
0
2
4
6
8
10
1960
1962
1964
1966
1968
1970
1972
1974
1976
1978
1980
1982
1984
1986
1988
1990
1992
1994
1996
1998
Group I
Group II
Group III

External Debt (% of GDP)
0
10
20
30
40
50
60
70
80
90
100
1960
1962
1964
1966
1968
1970
1972
1974
1976
1978
1980
1982
1984
1986
1988
1990
1992
1994
1996
1998
Group I
Group II
Group III

Latin America: External Factors and Growth
Deceleration,1999-1997
Due to externalfactors A
Due to externalfactors B
Argentina -11.5% -4.0% -1.6%Brazil -3.0% -5.5% -2.6%Chile -8.6% -4.7% -2.4%Colombia -6.6% -4.7% -2.7%Ecuador -10.4% -5.2% -3.1%Mexico -3.5% -1.5% -1.1%Peru -4.5% -3.2% -2.4%Venezuela -11.9% -5.2% -3.6%WeightedAvg. -5.5% -4.3% -2.2%
External Factors = U.S. Federal Funds Rate, terms of trade, “Non-Latin” Spreads, El Niño.
Weighted Avg. based on 1997 GDPs.
External Factors A = Estimated using 1998 and 1999 projections under 1997 external conditions.
External Factors B = Using 1997 external conditions for 1998 projection; 1998 conditions for 1999 projections
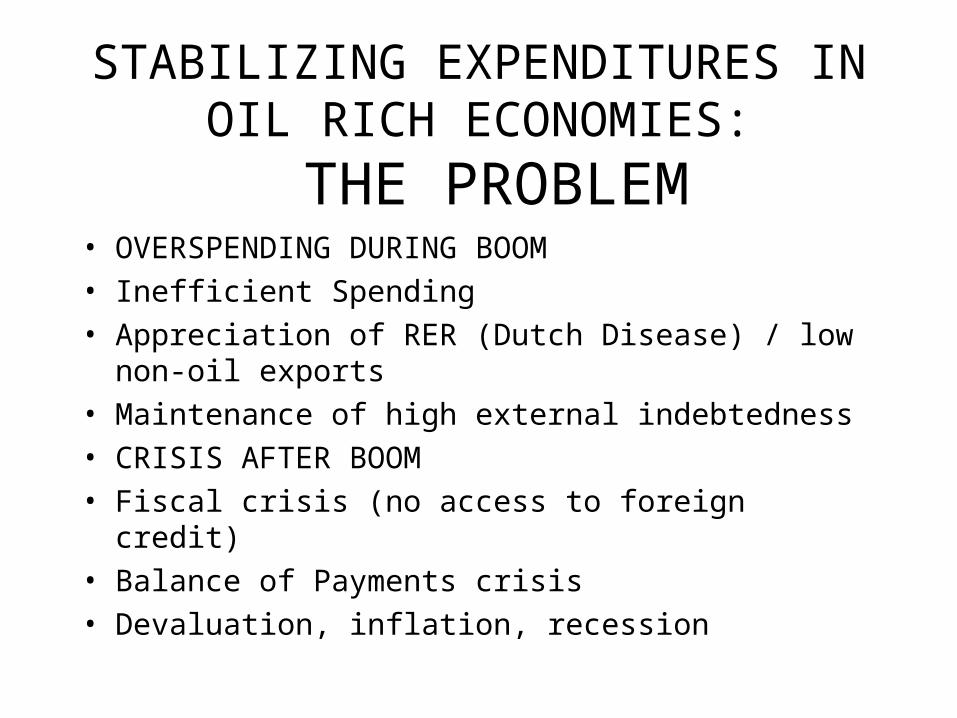
STABILIZING EXPENDITURES IN OIL RICH ECONOMIES:
THE PROBLEM• OVERSPENDING DURING BOOM
• Inefficient Spending
• Appreciation of RER (Dutch Disease) / low non-oil exports
• Maintenance of high external indebtedness
• CRISIS AFTER BOOM
• Fiscal crisis (no access to foreign credit)
• Balance of Payments crisis
• Devaluation, inflation, recession
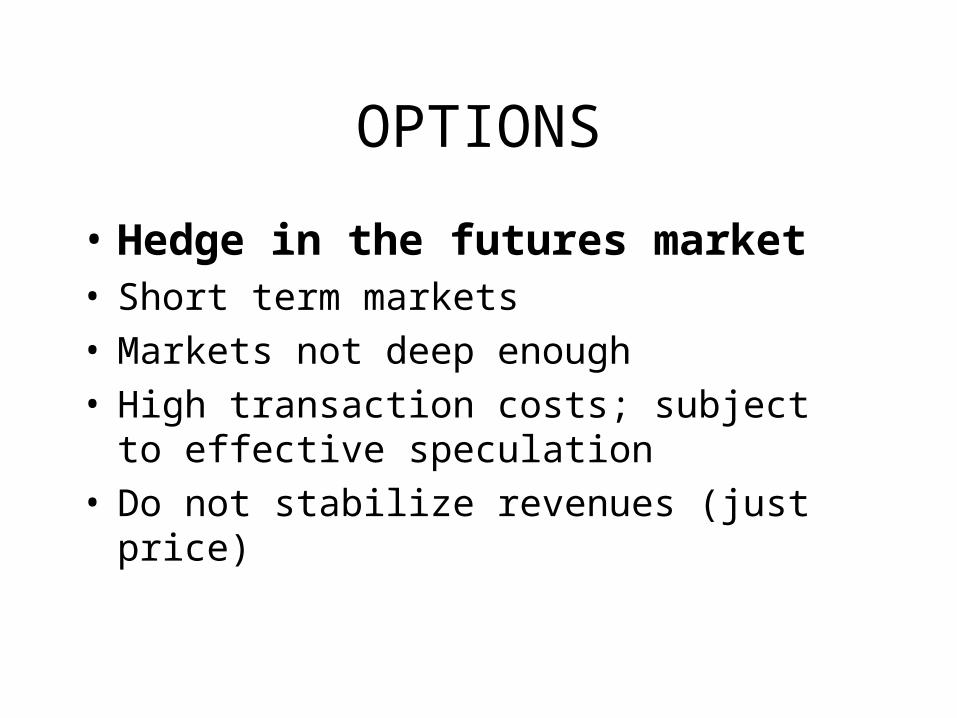
OPTIONS
• Hedge in the futures market• Short term markets• Markets not deep enough• High transaction costs; subject to effective
speculation• Do not stabilize revenues (just price)

OPTIONS
• Stabilization Fund
• To insulate from political pressures during boom
• Credibility for investors

Issues in the Design of Stabilization Funds
• Savings and withdrawal rules
• Reference price
• Fund can not be used as collateral
• Stabilization Fund is not enough to guarantee fiscal soundness
• Require coordination with exchange rate and monetary policies
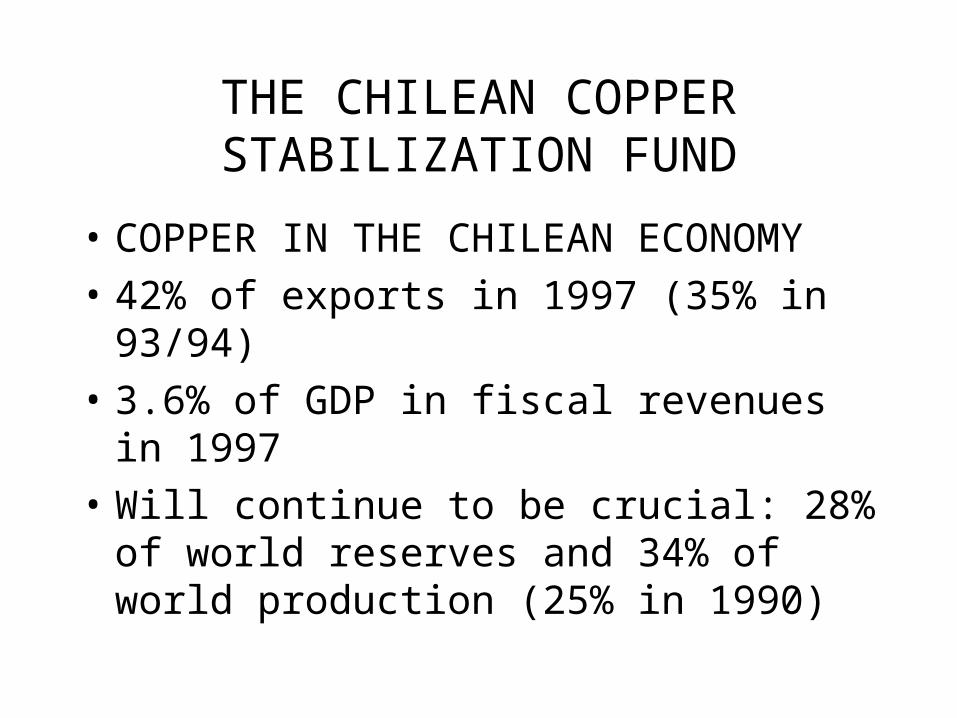
THE CHILEAN COPPER STABILIZATION FUND
• COPPER IN THE CHILEAN ECONOMY
• 42% of exports in 1997 (35% in 93/94)
• 3.6% of GDP in fiscal revenues in 1997
• Will continue to be crucial: 28% of world reserves and 34% of world production (25% in 1990)
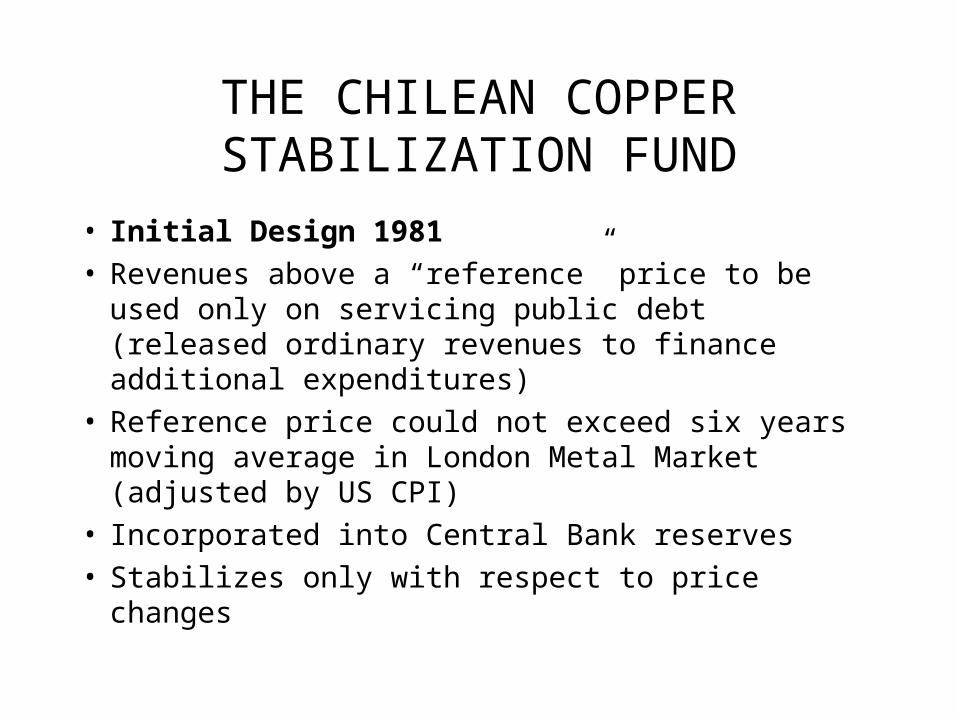
THE CHILEAN COPPER STABILIZATION FUND
• Initial Design 1981• Revenues above a “reference” price to be used only
on servicing public debt (released ordinary revenues to finance additional expenditures)
• Reference price could not exceed six years moving average in London Metal Market (adjusted by US CPI)
• Incorporated into Central Bank reserves• Stabilizes only with respect to price changes

THE CHILEAN COPPER STABILIZATION FUND
• Modifications
• 1985: CSF created as a separate Fund under WB Structural Adjustment Loan
• 1988: Proceeds can be used only for “extraordinary amortizations” of public debt

THE CHILEAN COPPER STABILIZATION FUND
• EVALUATION• Copper price cycles influence fiscal balance, but
less in last decade (Spilimbergo, IMF, April 1999)• Chile is one of the few LAC countries that has
achieved anticyclical fiscal policies (IDB)• Chile’s business cycle associated with copper
prices (3 out of 4 cycles since 1998), though last one less pronounced. Effect mainly through variations in investment

THE CHILEAN COPPER STABILIZATION FUND
• The CSF was crucial to contain political pressures for spending at beginning of democracy (Foxley)
• Recent downturn due to both sharp drop in copper prices and monetary overkill (Perry and Herrera -see graph-)
• About 640mUS$ (1%GDP), from accumulated 1500, used to ease fiscal adjustment in 1998 and 1999.

The Chilean Copper Stabilization Fund.
• Overall, it has contributed to Chile’s strong fiscal stance and anticyclical fiscal policy, and may have moderated but has not completely avoided effects of price on business cycle
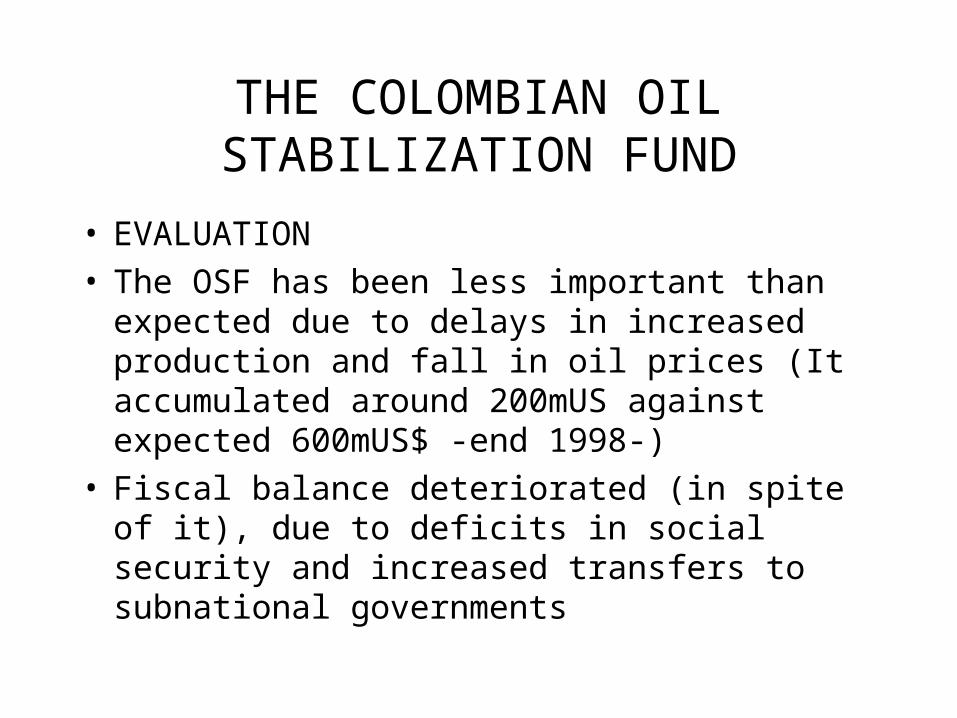
THE COLOMBIAN OIL STABILIZATION FUND
• EVALUATION• The OSF has been less important than expected
due to delays in increased production and fall in oil prices (It accumulated around 200mUS against expected 600mUS$ -end 1998-)
• Fiscal balance deteriorated (in spite of it), due to deficits in social security and increased transfers to subnational governments

THE VENEZUELAN FUND FOR MACROECONOMIC
STABILIZATION• Created in 1998
• Savings rule: 80% of revenues from price in excess of five-year moving average.
• Uses: 40% to Social Investment Fund (expenditure!); 30% for public debt reduction; 30% for “Venezuelan Investment Fund” (abroad).
• Present Government may amend legislation.