Embed Size (px)
Citation preview

Inter-Regional Preparatory Meeting in preparation for the Third International Conference on Small Island Developing
States Addressing Structural Deficiencies in Knowledge Gaps on Vulnerabilities in SIDS-
Investing in Statistical, Human and Institutional Systems towards Enhanced Information for Decision Making
Measuring Multidimensional Poverty in Barbados and the OECS
By Edwin St Catherine, Director of Statistics, SAINT LUCIA
August 28th, 2013

SIDS Statistical System Infrastructure Context• Geographic and Institutional Characteristics
• higher per capita cost of data acquisition, • e.g. larger sample requirements for valid results, we have to be
strategic about what we collect due to
the relatively higher cost of data gathering from the population
per capita• Confidentiality issues related to data are higher due to small population size
• Human Resource issues• Staff have to be generalist and deal with many different statistical issues and cannot
specialize as is required.• Need for continuous training and re‐training to shore up the knowledge base, it is costly but unavoidable
• Due to our limited technical and human resource capacity we must
leverage to our
advantage external assistance, example we don’t develop software but customize software
already built on “open data”
standards• Due to small numbers, staff turnover can create large disruptions so wherever possible
redundancies must be built to counteract these limitations.

Why Multidimensional Poverty Measures (MPI)?• Data are increasing as are technical measurement tools:
• In the Caribbean region from the decade of the ‘90s through to today• Increasing availability of more data sources in addition to Census we have seen the
introduction of and increasing frequency of LSMS type SLCs with CDB support, CWIQ
Surveys and MICS with UN Agencies and Labour Surveys with increasing demand for
data on employment and unemployment.
• Improvement of our methods• Income poverty: important but doesn’t proxy key indicators• Economic Growth obscures weakness in the social fabric of society• No single non‐income proxy • Income/expenditure is not a sufficient proxy of multidimensional
poverty
• Political Reasons• National and International “demand”
increasing for better measures• Political space for new current metrics
Growth? Claims are strong…and debatable“Growth is not an end in itself. But it makes it possible to achieve other
important objectives of individuals and societies. It can spare people en
masse from poverty and drudgery. Nothing else ever has.”• 2008 Growth Commission (Michael Spence)
‘The correlation between GDP per capita growth and non‐incomeMDGs is practically zero…
This interesting finding suggests that
economic growth is not sufficient per se to generate progress in
nonincome
MDGs. Sectoral policies and other factors or circumstances presumably
matter as much as growth....’François Bourguignon, Agnès Bénassy‐Quéré, Stefan Dercon, Antonio Estache, Jan Willem Gunning, Ravi
Kanbur, Stephan Klasen, Simon Maxwell, Jean‐Philippe Platteau, Amedeo Spadaro


Current Situation – Data Sources• Potential Data Sources for Multi‐Dimensional Poverty Measurement
• Census 2010 –
2011 (Based on CARICOM Common Core Questionnaire)• Census Barbados, St Lucia 2010 • Census Rest of OECS 2011
• Pro: Many indicators are available to cover poverty dimensions to be considered• Pro: Highly geographically specific since data available at small geographic level• Con: Data availability and timeliness given the date census was conducted is a serious issue
most countries have census data are still not published. UNFPA support is key here.• Con: limited specificity of measurement of some dimensions example education and in particular
health
• Labour Force Survey• Quarterly Survey in Barbados and St Lucia (commencement dates Oct 1975 and November
1992, respectively)• St Lucia Survey contains indicators on household assets which is
frequently included in the
measurement of wealth or in as indicators of Welfare or access to information in an MPI• Opportunity to with the inclusion of household assets to use these surveys as a vehicle to measure
Multi‐dimensional poverty• For the Rest of OECS Labour Force Surveys are ad hoc but there is a high policy demand for
these surveys on a frequent basis

Current Situation – Data Sources
• Pros:• Very comprehensive, measures
most of the indicators necessary
for an MPI, incl labour• Conforms with international
methods for poverty measurement
using uni‐dimensional money‐
metric methods
• Cons:• Quality issues due to resource
constraints in data collection.• Cloud connected tablet computers
to program consistency checks and
improve data quality
Country Type in Most Recent Year
(with reference period)SLC+HBS with Diary
Barbados 2010 linked to 2009 HBSOECS Countries:
Antigua and Barbuda 2005/06(six mths)St Kitts and Nevis* 2009(six mths)Dominica* 2009(six mths)Anguilla 2009(six mths)St Vincent and the Grenadines* 2009(six mths)St Lucia* 2005/06(six mths)Grenada, Carriacou* 2009(six mths)Monsterrat 2008(six mths)
• Summary of last round of CDB supported SLC, * ‐
Similar survey prior to 2003

Current Situation – Data Sources• CWIQ
• St Lucia 2004 and Grenada 2006• MICS
• Barbados and St Lucia 2012• Pros: High Quality Data Collection and Consultation Process and application of
international best practice in survey implementation process
• Pros: Contains high quality measurement of MDG indicators on Women and Children,
particularly related to Health, Education and Assets
• Cons: Cost to conduct and replication may require heavy external
input in OECS
Countries, however potentially much higher eventual societal cost if issues revealed by
this source remains unknown.
• Cons: Does not capture labor indicators for the potential inclusion in an MPI

Current Situation – Methods:
Basic Needs Approach:“As a first step, it might be useful to define the best indicator
for each basic need. At present the essential BN are
considered to cover six areas: basic education, health,
sanitation, water supply and housing and related
infrastructure. This list is not exhaustive, nor do all needs
listed have the same status. A limited set of core indicators
covering these areas would be a useful device for
concentrating efforts”
(Hicks & Streeten, 1979).

Current Situation – Methods: Basic Needs Two approaches:
• Modified “Unmet Basic Needs”
index to rank population groups• Applied in Censuses of 2001 and 2010, CWIQ and SLC/HBS• Used indicators based on Assets, employment rate, education of head,
overcrowding and “intuitive”
weights• Development of poverty maps for the 2001 and 2010 Census where available• Use of Census Data to rank communities by living condition index
• Statistical Method, Filmer and Prichett• Applied in Census 2010 in St Lucia and is a standard output of MICS• The introduction of the Statistical method using PCA in 2010 (Principle
Components Analysis)/Multiple Correspondence Analysis• Applied mostly using number of household Assets as an indicator of welfare

Unmet “Basic Needs” Index at the level of Small Areas
•• This approach was used on the Census 2001 and 2010 in St. Lucia This approach was used on the Census 2001 and 2010 in St. Lucia and and
a number of Other OECS Countries a number of Other OECS Countries •• Poverty Reduction Fund (SSDF) draws upon the poverty map as a mePoverty Reduction Fund (SSDF) draws upon the poverty map as a method for thod for
targeting poor communities for policy interventiontargeting poor communities for policy intervention
•• This approach was used on the Census 2001 of Grenada (GREP). This approach was used on the Census 2001 of Grenada (GREP).

Single-Dimensional Money-metric Approach Implemented in SLC supported by CDB• Single dimensional achievement
– Income, Expenditure, Calories
• Achievements of a society or a country can be represented by a
vector or a distribution of expenditure
• Unit of analysis may be individual or household


The Problem with our Uni-dimensional Expenditure per Capita Methods
• shows some changes with lag; others at once• does not show how people are poor and •
affected by different policies• have measurement error & data collection issues due
especially to the extensive coverage of household and
personal expenditures

Problem of Many Indicators from Multiple Sources“As communications instruments, one frequent
criticism is that they lack what has made GDP a
success: the powerful attraction of a single headline
figure allowing simple comparisons of socio‐economic
performance over time or across countries”
(Stiglitz,
Sen, Fitoussi, 2009) ……use method that has this
elegance for communication where necessary.
The Problem of Many Indicators from Multiple Sources is:When the base population coincides in part or in
total, overlaps in deprivations are overlooked, ie.
the joint distribution is ignored. Blind to joint
deprivations (Ferreira, 2011; AFS, 2011) ………Use one primary data source constantly and
consistently, but supplement it with MICS/DHS to
investigate issues further

Considerations for an MPI Measure in Barbados and the OECS• Our Data Sources:
• Decennial Census Best Source for Comparability across all countries but • Given the limitation that it is a once in a decade event, consider incorporating a household assets module within the
Labour Force Survey and a module on Health periodically• Health Dimension will include BMI for women and weigh to age ratios for Children
• The World Bank is already supporting the OECS Secretariat with such an initiative and this can allow the production
of an MPI on a regular basis• MICS because of its international attributes can be done at least once every five years to obtain more in‐depth data
on women and children.
• Our Consultative process can be based on Human Rights or MDG Framework and if possible be rooted
in legislation to ensure broad based consensus on:• Dimensions and associated indicators for Health, Education, information, Assets as a proxy for living
standards and attributable weights and cut‐offs which draw a line between who is deprived and who is not.
• Employment is a Central Theme of our national policy agendas and this dimension of the MPI must be
represented in indicators, for example:• Money Income• Household Employment Rate or • Unemployed Youth and these must be weighted appropriately in the
overall MPI
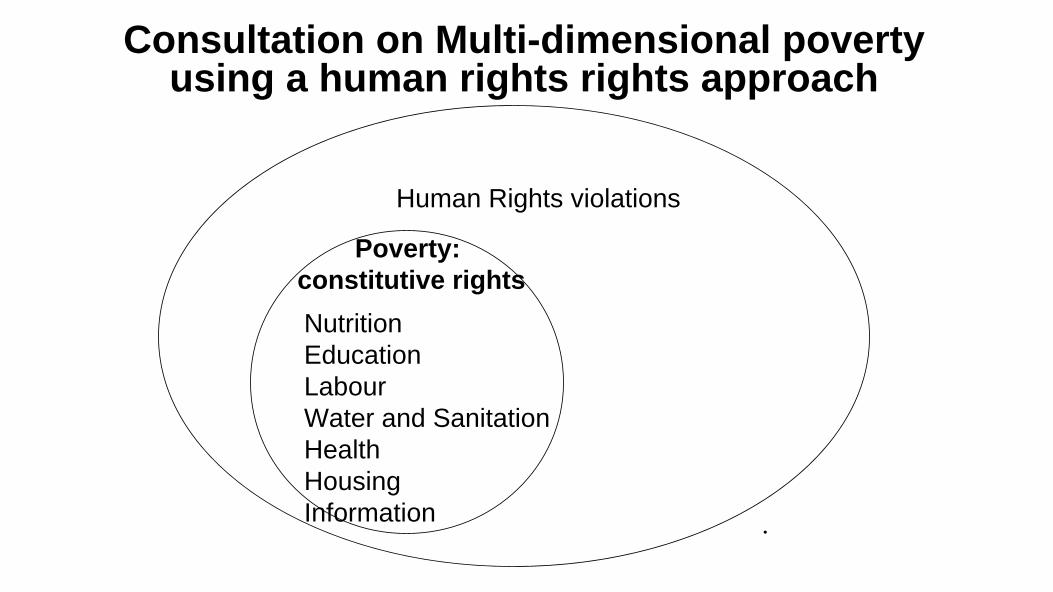
Consultation on Multi-dimensional poverty using a human rights rights approach
Poverty: constitutive rights
Human Rights violations
NutritionEducationLabourWater and SanitationHealthHousingInformation .

Vulnerable to…
Non-income poor(rights deprived)
AIncome poor
BC
Combining other dimensions of deprivation and poverty
Excluded:Social Cohesoin
C – Contains the set of persons with multiple deprivations and of most concern
or persons who are severely deprived

Regional Examples of MPI
The Multidimensional Poverty Measurement
developed by Coneval (Mexico) is a bi‐
dimensional measure. The model’s conceptual
framework is the human rights approach and the
dimensions included in the model are guided by
the Social Development Law (2004).
Columbia has its own version of the MPI

Considerations for an MPI Measure in Barbados and the OECS• This methodology must be robust and deeply rooted in a widely accepted
theoretical axiomatic framework such as Alkire/Forster which is akin to
Forster‐Greer‐Thorbecke from the Uni‐dimensional expenditure based
approaches which has been used widely in the Caribbean region.
• Measures derived using this axiomatic framework can be summarized as
with GDP or as is done with the money‐metric approaches, example a
poverty or headcount rate associated with all deprivations with respect to
the total population can be derived from a single dataset even one where
consumption expenditures are not measured.
• Our measures based on this framework will be additively decomposable
and therefore lend itself to potentially intensive policy use:

Considerations for an MPI Measure in Barbados and the OECS – Our Objective is to facilitate better policy responses:
We will be able to associate poverty with specific types of deprivations for
each region and this will allow better targeting of deprivations.
‐One National summary MPI Poverty rate which is decomposable by
subpopulation groups, the working poor, poor mothers, children etc.
‐One MPI poverty rate for each region allowing comparison of regions based
on the elegance of one rate
This rate will be decomposable into the elements which affect the population
most in the region be it a health, education or a labour related
deprivation in
order of importance thereby lending itself to varying policy responses based on
how people are poor.

OUR MPI SHOULD BE LIKE A HIGH POWERED LENS
You can zoom
in to see more


![IB - Barbados International Finance & Business Magazine 2010 [Barbados]](https://img.dokumen.tips/doc/110x75/5553d3efb4c905c4048b4c4b/ib-barbados-international-finance-business-magazine-2010-barbados.jpg)

