Embed Size (px)
Citation preview

Spectroscopic Ellipsometry
Introduction: Ellipsometry and Liquids
Optical properties of liquids can play an important role in various scientific and technological domains like immersion microscopy, liquid crystals, non-linear optics, fluorescence studies, biomaterials or nanoparticles in solution. These fields show a new potential where HORIBA ellipsometry products can illustrate their flexible characteristics and high-end performances. For several years, ellipsometry has become a reference technique that provides optical properties, but the technique is applied mostly to characterize solids and generally, thin film samples. Ellipsometry has also been applied to study solids in liquid ambients and liquid-liquid or air-liquid interfaces, but to our knowledge, there has not been an application of ellipsometry to efficiently characterize real and imaginary parts of the complex refractive index of the actual liquids themselves. There are several reasons for this, the most realistic one being that for liquids, fluorescence and transmission spectroscopy remain the reference techniques, however, they do not provide information independently on the real part of the refractive index. On the other hand, ellipsometry is a technique that gives access to both the real and the imaginary part of the optical indices of materials. We illustrate in this note a method and the associated accessory that allow efficient characterization of liquids by ellipsometry.
1. Reminder of Ellipsometry Accessories Related to Studies of Liquids
Before developing the core of this note that is devoted to studies of liquids themselves, we find it useful to summarize the HORIBA accessories that are linked to ellipsometry and liquid environments, in general.As early as 1993, there has been work performed with HORIBA ellipsometers in liquid environments. References [1] and [2] illustrate ellipsometry analysis during electrochemical processes. These experiments were achieved with the specially designed electrochemical cell illustrated in Fig.1
Figure 1: Electrochemical cell mounted on UVISEL stage
Ellipsometry has also been applied to study solid-liquid interfaces and the liquid cell accessory illustrated in Fig.2 is dedicated to this kind of application. One can find an illustration using this accessory in reference [3].
Figure 2: Liquid cell for solid-liquid interface studies
To conclude this introductory section, one must quote ref [4] that is dedicated to the study of an air-water interface. No specific accessory was used in this work; a simple container placed on the ellipsometer stage is sufficient to start the experiment. However, only the ultimate sensitivity and precision of the UVISEL phase modulation ellipsometer (PME) could make this experiment possible.
Michel Stchakovsky, HORIBA FRANCE SAS, Avenue de la Vauve, 91120 Palaiseau, France
Keywords: Liquid, new accessory, ellipsometric modeling, spectroscopic ellipsometry
AbstractThe development of a new accessory to perform liquid measurement and characterization by spectroscopic ellipsometry has been successfully carried out, taking advantage of specific features of the phase modulation technology of HORIBA UVISEL ellipsometers.
Measuring Liquids with a New Accessory on UVISEL
Spectroscopic Ellipsometers
Application Note
Material ScienceSE37

2
2. Introducing a new experimental principle and the corresponding accessory
PME’s such as UVISEL systems have the characteristic feature in their optical design that all polarizing optics are fixed during the measurement. This offers several competitive advantages over rotating type ellipsometers including insensitivity to vibrations, and very robust alignment characteristics that seldom need calibration and alignment. Another strength of PMEs is that they also include a large aperture into the collecting optics for reflected light. These arguments explain two decades of successes of PMEs in application fields including transparent substrates where the backside reflection phenomenon plays an important role [5]. The new accessory introduced by this note is another exploitation of these specific advantages of the UVISEL. This device to characterize liquids is illustrated in Fig.3 and its principle is summarized in Fig.4.
Figure 3: Picture of the liquid-prism cell
Figure 4: Principle of the method. Multiple reflected beams become negligible after the third one.
The liquid under study is sandwiched between the base of an isosceles prism and a bulk mirror. This ensures the absence of waves at both interfaces of the liquid. The thickness of the liquid under study is mechanically fixed by spacers with thicknesses in the range of 50 to 200 µm. The incident ellipsometric beam enters the prism under normal incidence and is partially reflected and transmitted at the prism-liquid interface. Note that this method should not be confused with the total reflection technique. Light being reflected at the liquid-mirror interface, a regime of multiple reflections takes place into the liquid layer. The optical path inside liquids is in the range of 200µm and more. This enables a very significant improvement of sensitivity to the small absorption of the liquid compared to the one obtained during the bulk studies. The determination of optical properties of the liquid is finally achieved by modeling with the DeltaPsi2 software. The generic structure of the model includes a 4 nm oxide on top of the crystalline silicon “mirror” and is illustrated in Fig.5 in the case of a 125µm thick liquid. This model is universal and applicable to any liquid studies.
Figure 5: Modeling structure in DeltaPsi2 software
3. Illustrated Results
3.1 Water, Ethanol, Immersion liquidsThe validation of the method was established by comparing optical properties obtained from our experiments on deionized water, with the abundant literature on this subject. Fig.6 illustrates the match between the measurement (dots) and the model (solid line).
Figure 6a: Comparison between ellipsometric measurements on water (dots) and calculated data (solid line). Is = sin2ψ sin∆ ; Ic = sin2ψ cos∆
Figure 6b: Magnification of Ic expressed in nm in near infrared range where water absorption modes are significant.
From this excellent fit, we extract optical properties of water illustrated in black on Fig.7a and 7b. These optical properties match the room temperature values from literature, in the spectral range of availability, within 0.005 on the real part of the index n and better than 0.001 on the imaginary part of the index k. Note that in Fig.4b the extinction coefficient is accurate below 10-5, which is a value that has never been reached using the technique of spectroscopic ellipsometry.
Figure 7: Room temperature optical properties of water obtained in this work in black and published in the literature in colors. a) Real part and b) Imaginary part
The second application example is the study of ethanol. Similar performances as for water were obtained. Fig.8a shows a good agreement between the experiment and model. The optical properties are given in Fig.8b.
Figure 8: Experiments on ethanol. a) Agreement between experiment in dots and model in solid line b) Optical index
3
The final examples of pure liquids deal with transparent fluorinated liquids having applications in immersion microscopy. Their optical indices are illustrated in Fig.9.
Figure 9: Real part of refractive index for tetradecafluorohexane in red and commercial 3MTM FC3283 in blue
3.2 Application for estimation of ovalbumine concentration in solutionThe liquid measurement method can be applied in the field of biology to evaluate protein concentration in solutions. We synthesized 6 concentrations of bovine serum albumin (BSA) aqueous solutions and controlled them with a dedicated spectrophotometer. Experiments with the prism cell on the UVISEL were performed in parallel. It is noticeable that both methods consume very little material, not more than 50 µl. Figure 9a summarizes the ellipsometric determination of the extinction coefficient k. The increase of k is clearly correlated to the increase of BSA concentration. Fig.10b illustrates the linear dependence between the different concentrations and the value of the extinction coefficient at 200nm (6.2 eV). Such a curve can then be used as reference for process control. This principle can certainly be applied for a large variety of protein species.
Figure 10: Experiments on BSA solutions. a) Extinction coefficient k obtained by ellipsometry. b) Dependence of concentration with k at 200nm
3.3 Application for Single Wall Carbon Nanotube (SWCNT) solution studiesSWCNTs are cylindrical carbon molecules with unusual properties which are valuable for nanotechnology, electronics, optics and other fields of materials science and technology. They can have either metallic or semiconducting properties, depending on their carbon atom arrangement, called chirality (armchair, zigzag and chiral).
Figure 11: CNT with armchair atom arrangement
Future applications of these materials are expected in several fields like flexible transistors with ultra-high integration and ultra-high speed. Such materials are generally synthesized as a mixed chirality of SWCNTs having various electrical properties. Thus, in order to approach application targets, high-purity chirality separation techniques have been developed and ellipsometry can be used to control efficiency of this separation.We have demonstrated this possibility by characterizing a water solution of SWCNT.
Figure 12.: SWCNT water suspension
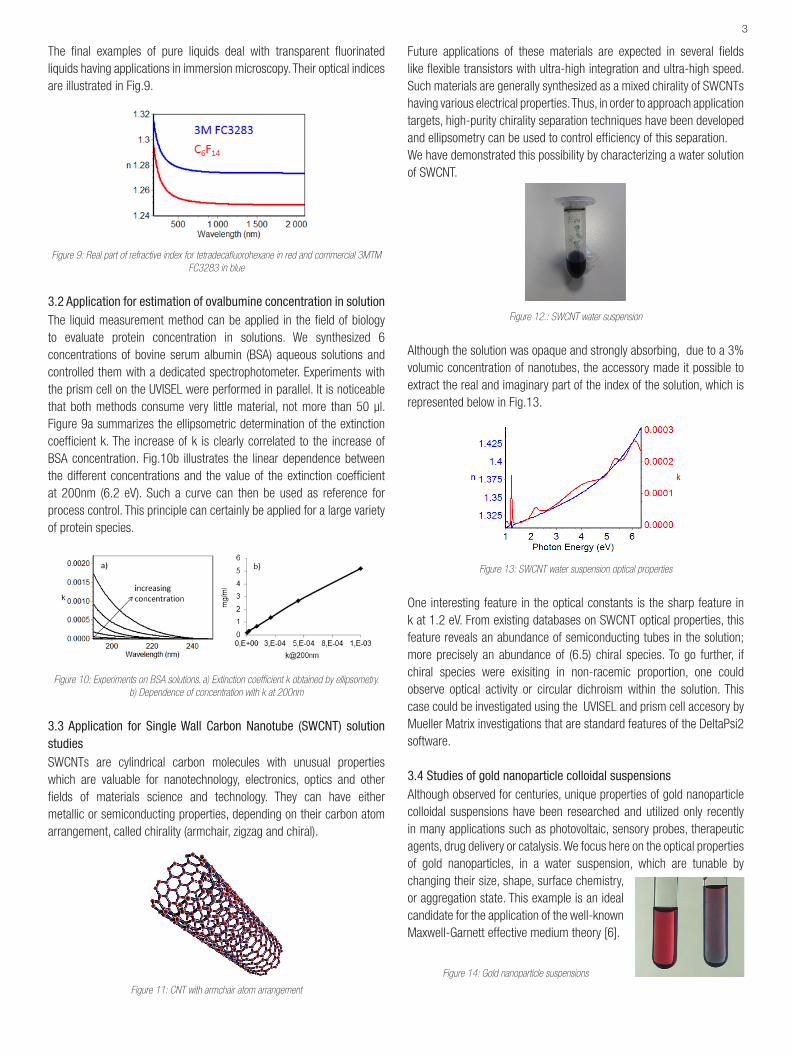
Although the solution was opaque and strongly absorbing, due to a 3% volumic concentration of nanotubes, the accessory made it possible to extract the real and imaginary part of the index of the solution, which is represented below in Fig.13.
Figure 13: SWCNT water suspension optical properties
One interesting feature in the optical constants is the sharp feature in k at 1.2 eV. From existing databases on SWCNT optical properties, this feature reveals an abundance of semiconducting tubes in the solution; more precisely an abundance of (6.5) chiral species. To go further, if chiral species were exisiting in non-racemic proportion, one could observe optical activity or circular dichroism within the solution. This case could be investigated using the UVISEL and prism cell accesory by Mueller Matrix investigations that are standard features of the DeltaPsi2 software.
3.4 Studies of gold nanoparticle colloidal suspensionsAlthough observed for centuries, unique properties of gold nanoparticle colloidal suspensions have been researched and utilized only recently in many applications such as photovoltaic, sensory probes, therapeutic agents, drug delivery or catalysis. We focus here on the optical properties of gold nanoparticles, in a water suspension, which are tunable by changing their size, shape, surface chemistry, or aggregation state. This example is an ideal candidate for the application of the well-known Maxwell-Garnett effective medium theory [6].
Figure 14: Gold nanoparticle suspensions

[email protected] www.horiba.com/scientificUSA: +1 732 494 8660 France: +33 (0)1 69 74 72 00 Germany: +49 (0)6251 8475 0UK: +44 (0)20 8204 8142 Italy: +39 2 5760 3050 Japan: +81 (0)3 6206 4721China: +86 (0)21 6289 6060 Brazil: +55 (0)11 2923 5400 Other: +33 (0)1 69 74 72 00
This
doc
umen
t is
not
con
trac
tual
ly b
ind
ing
und
er a
ny c
ircum
stan
ces
- P
rinte
d in
Fra
nce
- ©
HO
RIB
A F
RA
NC
E 0
3/20
17
The reader is advised to read application note « Ellipsometric characterization and modeling of different types of nanoparticles » for introduction to these modeling aspects.
We have measured two colloidal gold nanoparticle suspensions, one monodisperse with spherical nanoparticles and a second one polydisperse containing both nanospheres and nanorods. The two solutions were also studied by transmission electron microscopy (TEM). Ellipsometric analysis allowed for quantifying non-idealities of the nanoparticle population such as:• Non-idealities of spherical shapes expressed as a broadening of
aspect ratio. The spheres lose their shape and the aspect ratio becomes smaller than 1
• Dispersion of shapes: the aspect ratio follows a Gaussian distribution around an average value for both spheres and nanorods.
Figure 15: Gold nanoparticle suspension TEM picture and schematic of particle shapes distribution
UVISEL measurements of these suspensions were performed with the prism cell. The ellipsometric modeling allowed for the determination of the optical properties of the liquid composite, as a first step. Then, a dedicated Maxwell-Garnett development allowed the quantification of geometrical properties of nanoparticles in the suspension. This was expressed by the distribution of their aspect ratio. The following diagram illustrates the agreement between direct TEM analysis displayed by a histogram, simply counting and measuring on a picture like Fig.15, and ellipsometric extended Maxwell-Garnett modeling.
Figure 16: Quantification of nanoparticles and their shape as observed on TEM picture compared with distribution of shape obtained from ellipsometric modeling
The message behind this illustrated example is that the application of the nanoparticle study done in the liquid phase by ellipsometry provides information on optical properties, as usual, but also on geometrical properties at the nanoscale. This information is now not anymore only accessible with heavier techniques like transmission electron microscopy.
Conclusions
With the illustrations given in this note, we have demonstrated the feasibility of characterizing liquids with standard UVISEL ellipsometers. This has become possible with the introduction of a new dedicated accessory taking advantage of specific features of the phase modulation ellipsometer such as large collecting optics and fixed polarizing elements.The field of investigation of optics of liquids is not restricted to chemistry or biology and we hope that this new HORIBA technical note will help you to consider a new potential for ellipsometry in the large field of material science.
AcknowledgementsThe author is grateful to Yann Battie and Aotman En Naciri from Université de Lorraine who contributed to the present work and agreed to its publication in this note.
Bibliography[1] B.H. Erné and al., J. Electrochem. Soc., Vol. 145, No. 2, February 1998[2] A. Zimmer and al, Optical constants of electroplated Bi2Te3 films by Mueller matrix spectroscopic ellipsometry, Thin Solid Films 516 (2008) 2922–2927[3] J. Lu and al., Effect of Surface Packing Density of Interfacially Adsorbed Monoclonal Antibody on the Binding of Hormonal Antigen Human Chorionic Gonadotrophin, J. Phys. Chem. B 2006, 110, 1907-1914[4] R. Greef and al., The water-like film on water, p hys. stat. sol. (c) 5, No. 5, 1184–1186 (2008)[5] M. Kildemo and al., Measurement of the absorption edge of thick transparent substrates using the incoherent reflection model and spectroscopic UV-visible-near IR ellipsometry, Thin Solid Films 313-314, 1998, 108-113[6] http://www.horiba.com/fileadmin/uploads/Scientific/Documents/TFilm/AN_SE36-Ellipsometric_modeling_of_NanoParticles_072016.pdf
4


![Fluorinated [beta]-sultones as Precursors to Fluorinated ... · Mohtasham, Javid, "Fluorinated [beta]-sultones as Precursors to Fluorinated Sulfonic Acids, and New Fluorosulfonyl](https://img.dokumen.tips/doc/110x75/5f02bafa7e708231d405b9f5/fluorinated-beta-sultones-as-precursors-to-fluorinated-mohtasham-javid-fluorinated.jpg)