Embed Size (px)
Citation preview
Measuring Latency Variation in the
Internet
Toke Høiland-Jørgensen?,Bengt Ahlgren†, Per Hurtig? and Anna Brunstrom?
?Karlstad University, †SICS
{firstname.lastname}@kau.se, [email protected]
1 July 20th, 2017 | Toke Høiland-Jørgensen et al

Research question
How much bufferbloat exists in theinternet?
2 July 20th, 2017 | Toke Høiland-Jørgensen et al
The idea
I Combine large-scale active measurements withpassive captures
I Use latency span as metricI Estimate queueing latency by:
I Looking at latency drop after TCP congestion eventI Correlating latency with link load
3 July 20th, 2017 | Toke Høiland-Jørgensen et al
The idea
I Combine large-scale active measurements withpassive captures
I Use latency span as metric
I Estimate queueing latency by:
I Looking at latency drop after TCP congestion eventI Correlating latency with link load
3 July 20th, 2017 | Toke Høiland-Jørgensen et al
The idea
I Combine large-scale active measurements withpassive captures
I Use latency span as metricI Estimate queueing latency by:
I Looking at latency drop after TCP congestion eventI Correlating latency with link load
3 July 20th, 2017 | Toke Høiland-Jørgensen et al
The idea
I Combine large-scale active measurements withpassive captures
I Use latency span as metricI Estimate queueing latency by:
I Looking at latency drop after TCP congestion event
I Correlating latency with link load
3 July 20th, 2017 | Toke Høiland-Jørgensen et al
The idea
I Combine large-scale active measurements withpassive captures
I Use latency span as metricI Estimate queueing latency by:
I Looking at latency drop after TCP congestion eventI Correlating latency with link load
3 July 20th, 2017 | Toke Høiland-Jørgensen et al
The datasets
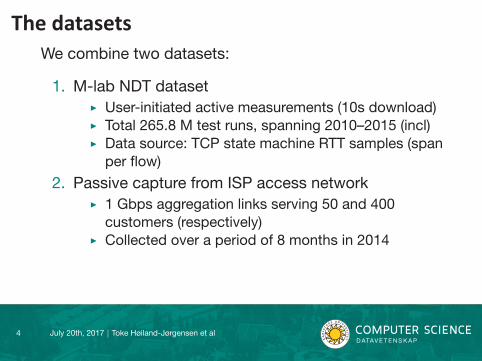
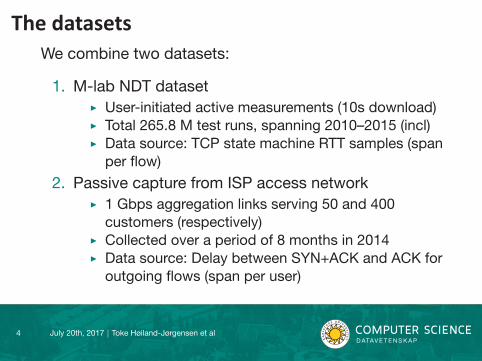
We combine two datasets:
1. M-lab NDT dataset
I User-initiated active measurements (10s download)I Total 265.8 M test runs, spanning 2010–2015 (incl)I Data source: TCP state machine RTT samples (spanper flow)
2. Passive capture from ISP access network
I 1 Gbps aggregation links serving 50 and 400customers (respectively)
I Collected over a period of 8 months in 2014I Data source: Delay between SYN+ACK and ACK foroutgoing flows (span per user)
4 July 20th, 2017 | Toke Høiland-Jørgensen et al
The datasets
We combine two datasets:
1. M-lab NDT datasetI User-initiated active measurements (10s download)
I Total 265.8 M test runs, spanning 2010–2015 (incl)I Data source: TCP state machine RTT samples (spanper flow)
2. Passive capture from ISP access network
I 1 Gbps aggregation links serving 50 and 400customers (respectively)
I Collected over a period of 8 months in 2014I Data source: Delay between SYN+ACK and ACK foroutgoing flows (span per user)
4 July 20th, 2017 | Toke Høiland-Jørgensen et al

The datasets
We combine two datasets:
1. M-lab NDT datasetI User-initiated active measurements (10s download)I Total 265.8 M test runs, spanning 2010–2015 (incl)
I Data source: TCP state machine RTT samples (spanper flow)
2. Passive capture from ISP access network
I 1 Gbps aggregation links serving 50 and 400customers (respectively)
I Collected over a period of 8 months in 2014I Data source: Delay between SYN+ACK and ACK foroutgoing flows (span per user)
4 July 20th, 2017 | Toke Høiland-Jørgensen et al
The datasets
We combine two datasets:
1. M-lab NDT datasetI User-initiated active measurements (10s download)I Total 265.8 M test runs, spanning 2010–2015 (incl)I Data source: TCP state machine RTT samples (spanper flow)
2. Passive capture from ISP access networkI 1 Gbps aggregation links serving 50 and 400customers (respectively)
I Collected over a period of 8 months in 2014
I Data source: Delay between SYN+ACK and ACK foroutgoing flows (span per user)
4 July 20th, 2017 | Toke Høiland-Jørgensen et al
The datasets
We combine two datasets:
1. M-lab NDT datasetI User-initiated active measurements (10s download)I Total 265.8 M test runs, spanning 2010–2015 (incl)I Data source: TCP state machine RTT samples (spanper flow)
2. Passive capture from ISP access networkI 1 Gbps aggregation links serving 50 and 400customers (respectively)
I Collected over a period of 8 months in 2014I Data source: Delay between SYN+ACK and ACK foroutgoing flows (span per user)
4 July 20th, 2017 | Toke Høiland-Jørgensen et al
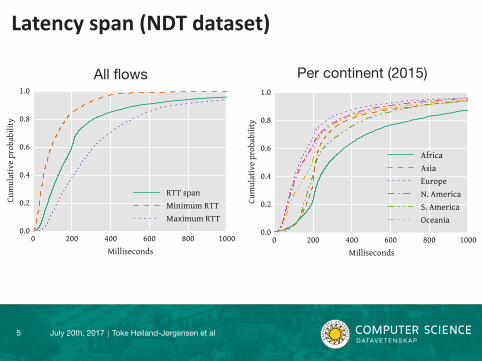
Latency span (NDT dataset)
All flows
0 200 400 600 800 1000Milliseconds
0.0
0.2
0.4
0.6
0.8
1.0
Cum
ulat
ive p
roba
bilit
y
RTT spanMinimum RTTMaximum RTT
Per continent (2015)
0 200 400 600 800 1000Milliseconds
0.0
0.2
0.4
0.6
0.8
1.0
Cum
ulat
ive p
roba
bilit
y
AfricaAsiaEuropeN. AmericaS. AmericaOceania
5 July 20th, 2017 | Toke Høiland-Jørgensen et al
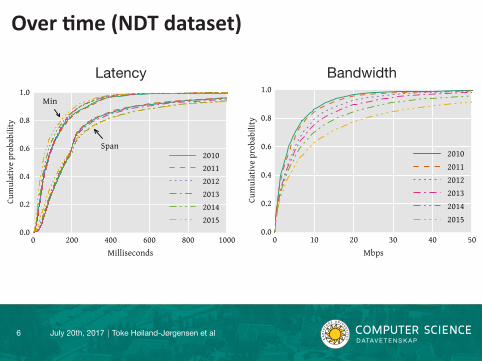
Over time (NDT dataset)
Latency
0 200 400 600 800 1000Milliseconds
0.0
0.2
0.4
0.6
0.8
1.0
Cum
ulat
ive p
roba
bilit
y
Min
Span201020112012201320142015
Bandwidth
0 10 20 30 40 50Mbps
0.0
0.2
0.4
0.6
0.8
1.0
Cum
ulat
ive p
roba
bilit
y
201020112012201320142015
6 July 20th, 2017 | Toke Høiland-Jørgensen et al
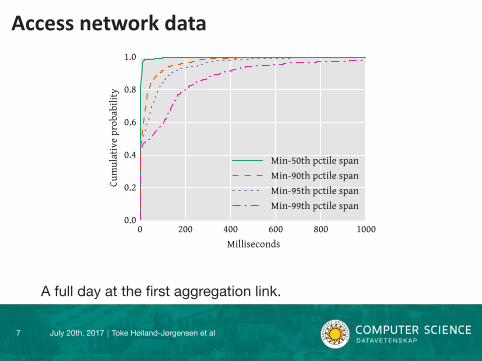
Access network data
0 200 400 600 800 1000Milliseconds
0.0
0.2
0.4
0.6
0.8
1.0
Cum
ulat
ive p
roba
bilit
y
Min-50th pctile spanMin-90th pctile spanMin-95th pctile spanMin-99th pctile span
A full day at the first aggregation link.
7 July 20th, 2017 | Toke Høiland-Jørgensen et al

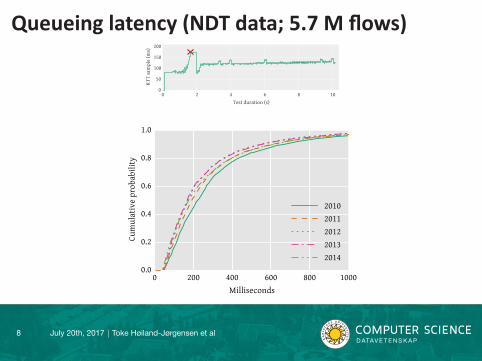
Queueing latency (NDT data; 5.7 M flows)
0 2 4 6 8 10Test duration (s)
0
50
100
150
200
RTT
sam
ple (
ms)
0 200 400 600 800 1000Milliseconds
0.0
0.2
0.4
0.6
0.8
1.0
Cum
ulat
ive p
roba
bilit
y
20102011201220132014
8 July 20th, 2017 | Toke Høiland-Jørgensen et al
Queueing latency (NDT data; 5.7 M flows)
0 2 4 6 8 10Test duration (s)
0
50
100
150
200
RTT
sam
ple (
ms)
0 200 400 600 800 1000Milliseconds
0.0
0.2
0.4
0.6
0.8
1.0Cu
mul
ativ
e pro
babi
lity
20102011201220132014
8 July 20th, 2017 | Toke Høiland-Jørgensen et al
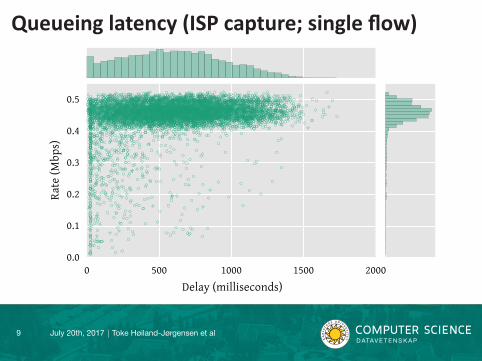
Queueing latency (ISP capture; single flow)
0 500 1000 1500 2000Delay (milliseconds)
0.0
0.1
0.2
0.3
0.4
0.5
Rate
(Mbp
s)
9 July 20th, 2017 | Toke Høiland-Jørgensen et al

Conclusions
I Latency variation in the internet is significantI It has not improved over timeI There are significant regional differences
I At least some of it can be attributed to queueingI Where queueing occurs, its magnitude is significant
10 July 20th, 2017 | Toke Høiland-Jørgensen et al
Conclusions
I Latency variation in the internet is significantI It has not improved over timeI There are significant regional differences
I At least some of it can be attributed to queueingI Where queueing occurs, its magnitude is significant
10 July 20th, 2017 | Toke Høiland-Jørgensen et al
We need to pay more attention to latency
I Higher bandwidth 6= a better connection
I Deploy better queue management today!I Better congestion control? E.g., BBR.
11 July 20th, 2017 | Toke Høiland-Jørgensen et al
We need to pay more attention to latency
I Higher bandwidth 6= a better connectionI Deploy better queue management today!
I Better congestion control? E.g., BBR.
11 July 20th, 2017 | Toke Høiland-Jørgensen et al
We need to pay more attention to latency
I Higher bandwidth 6= a better connectionI Deploy better queue management today!I Better congestion control? E.g., BBR.
11 July 20th, 2017 | Toke Høiland-Jørgensen et al