Embed Size (px)
Citation preview

Measuring health inequality in the context of cost-effectiveness analysis
Miqdad Asaria, Susan Griffin, Richard Cookson
Centre for Health Economics, University of York, Heslington, York, YO10 5DD, UK
Abstract: In this paper we discuss the cost-effectiveness analysis of public health interventions
where there are combined, and potentially conflicting, objectives of increasing total population health
and reducing unfair health inequalities in the population. Our focus is on identifying appropriate
health inequality measures in this context to quantify the impacts of interventions on unfair health
inequality and, where necessary, analyse equity-efficiency trade-offs between improving total
population health and reducing unfair health inequality. We recognise that this requires a number of
important social value judgements to be made, and so prefer measures that facilitate transparency
about these social value judgements. We briefly summarise the literature on health inequality and
health related social welfare functions, and conclude that while valuable it is not entirely suitable for
our purpose. We borrow instead from the wider literature on economic inequality, highlighting how
this translates to a health setting, and identify appropriate measures for cost-effectiveness analysis.
We conclude with a stylised example illustrating how we would apply a battery of dominance rules
and social welfare indices to evaluate the health distributions associated with two hypothetical health
interventions.
Acknowledgements: The authors would like to thank Karl Claxton, Tony Culyer, Nigel Rice and
Mark Sculpher for their role in steering the project work and to acknowledge the Public Health
Research Consortium for funding the work.
Keywords: health inequalities, cost effectiveness, equity, public health, trade off, social value
judgements
Corresponding author: Miqdad Asaria, Centre for Health Economics, University of York,
Heslington, York, YO10 5DD, Tel: +44 (0)1904 321973, Email: [email protected]

2
1. Introduction
Public health interventions often have dual objectives of improving population health and reducing
unfair health inequalities. Cost-effectiveness analysis (CEA) is often used to evaluate such
interventions, but typically only ranks interventions based on the first of these objectives. While
quantitative analysis is occasionally conducted to explore the distribution of the reach or uptake of
interventions, this is rarely worked through to understand the impact the interventions have on the
final distribution of health.
We propose in this paper that to evaluate interventions of this kind we must estimate and compare the
expected population health distributions associated with the interventions considered. Social value
judgements need to be made when comparing such distributions regarding the unfairness of health
variation (as it is only unfair health variation that we aim to minimise) as well as the degree of
aversion to inequality (to allow us to trade off more overall health on average with more equal
distributions of health). We draw on the general economic inequalities literature to identify methods
that are meaningful in a health inequalities context and are transparent about the social value
judgements that are imposed in evaluating distributions.
We have written the paper with two audiences in mind: specialists in economic inequality who may
not be familiar with methods of cost-effectiveness analysis; and specialists in cost-effectiveness
analysis who may not be familiar with measures of economic inequality. We apologise to both
audiences for reviewing material they are familiar with, but nevertheless hope that readers of both
kinds will find something of interest in our attempt to combine ideas and methods from these two
different literatures with a view to developing practical tools that can help inform important public
policy decisions.
We start this paper by briefly describing how CEA is used to evaluate health interventions and
describe how this must be adapted to generate distributions of health outcomes and health opportunity
costs. We review some principles underlying the quantification of economic inequality then briefly
describe the methods from the health economics literature to evaluate distributions of health in terms
3
of health inequality. We next describe the health economics literature on addressing inequality
concerns in health distributions using health related social welfare functions, before looking at the
more general economic inequalities literature on social welfare functions. We conclude by presenting
a stylised example to demonstrate how such methods could be used in the cost-effectiveness analysis
of health interventions.
1.1 Using cost-effectiveness analysis to estimate net health benefits
The role of cost-effectiveness analysis is to provide information to decision makers to help them
identify which of a set of investment opportunities would provide the greatest payoff. We take as a
starting point a societal decision making framework and describe a typical cost-effectiveness analysis
conducted from a health sector perspective1. That is, we assume a fixed budget for the provision of
health interventions, and that the interventions do not have important non-health benefits or impose
costs outside the health sector. Health outcomes are quantified in terms of a single cardinal measure
of health that reflects mortality and morbidity, for example a quality adjusted life year (QALY). This
common measure of health can be applied to all evaluations, allowing comparisons to be made across
a range of health conditions. The resources of interest, which determine the cost burden of the
interventions, are simply those that fall on the budget constraint, i.e. resources within the health
sector. A primary objective of the decision maker is assumed to be maximisation of expected
population health gains, conventionally calculated as the sum total of expected individual discounted
health gains, from available resources.
The health budget is assumed to be fully allocated, so introducing a new health intervention displaces
some currently funded activity. Should one of the mutually exclusive options be found to offer an
improvement in health but at a greater cost than the currently funded alternative, the potential
improvement in health outcomes must be compared to the health lost as a result of discontinuing other
currently funded activities by reallocating resources to fund the new intervention. The health gains
forgone by displacing existing health interventions represent the opportunity cost of introducing the
1 This typifies the use of cost-effectiveness analysis by health technology assessment agencies such as NICE in
the UK.
4
new intervention. If the health gains from the new intervention exceed this opportunity cost then it is
regarded as cost-effective.
Identifying and evaluating displaced health service activity is not often undertaken. Instead an
estimation of the shadow price of the budget constraint provides a threshold for assessing cost-
effectiveness. This threshold represents an estimate of the impact of the displacement that would
occur by diverting resources to the new intervention in terms of health forgone. When the amount of
additional resources demanded by each intervention has only a marginal impact on existing services
the cost-effectiveness threshold will not alter with each reallocation of resources, and a common
estimate can be used within each budgetary period. This cost-effectiveness threshold can be used to
describe the cost burden of interventions in terms of health, and these can be subtracted from the
expected health gains attributed to an intervention in order to describe its net health benefit.
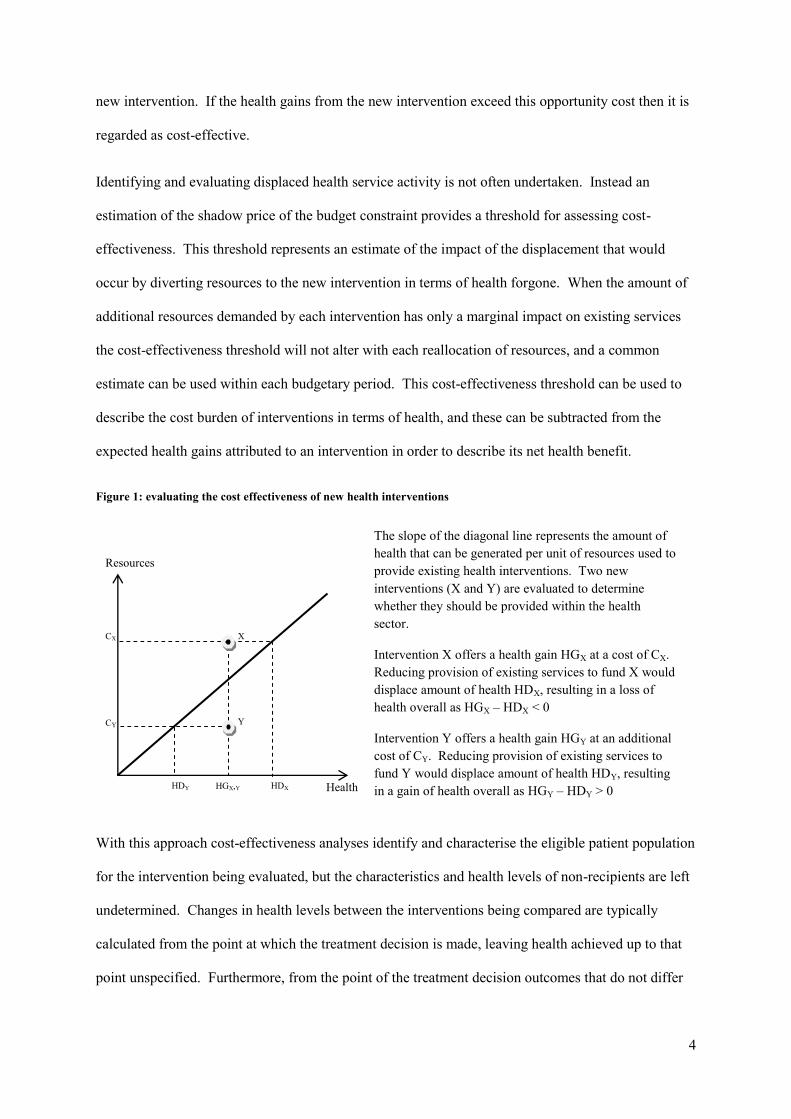
Figure 1: evaluating the cost effectiveness of new health interventions
With this approach cost-effectiveness analyses identify and characterise the eligible patient population
for the intervention being evaluated, but the characteristics and health levels of non-recipients are left
undetermined. Changes in health levels between the interventions being compared are typically
calculated from the point at which the treatment decision is made, leaving health achieved up to that
point unspecified. Furthermore, from the point of the treatment decision outcomes that do not differ
X
Y
Health
Resources
HGX,Y HDX HDY
CX
CY
The slope of the diagonal line represents the amount of
health that can be generated per unit of resources used to
provide existing health interventions. Two new
interventions (X and Y) are evaluated to determine
whether they should be provided within the health
sector.
Intervention X offers a health gain HGX at a cost of CX.
Reducing provision of existing services to fund X would
displace amount of health HDX, resulting in a loss of
health overall as HGX – HDX < 0
Intervention Y offers a health gain HGY at an additional
cost of CY. Reducing provision of existing services to
fund Y would displace amount of health HDY, resulting
in a gain of health overall as HGY – HDY > 0

5
according to the intervention received may also be left unspecified. So, interventions are evaluated by
focusing on changes in health, without explicitly characterising the resulting levels of health.
2. Extending cost-effectiveness analysis to estimate health distributions
In order to extend this analysis to allow us to evaluate health inequalities we first require information
on the distribution of total health levels without the interventions. We augment this with estimates of
the distributions of health changes to be produced by the interventions being compared to give the
modelled health distributions resulting from the respective interventions. The distribution of changes
in health attributed to an intervention is informed by the distribution of the health gains among
recipients of the intervention, and the distribution of the opportunity costs among those who would
have received the displaced activities. The key additional data requirements for this analysis are the
distributions of:
1. total health levels without the intervention;
2. incidence or eligibility for the interventions being evaluated;
3. treatment effect in terms of health gains and resource use;
4. health opportunity cost;
5. equity relevant characteristics (e.g. income, ethnicity) to allow us to isolate unfair inequality
It is important to note that because we are operating within the framework of CEA we assume that
health is measured on a fixed cardinal scale such as quality adjusted life expectancy (QALE).
2. 1 Evaluating health inequalities
The literature on measuring health inequality draws heavily from the literature on income inequalities.
However, while there are many similarities between health and income there are also some important
differences that should be considered, and the application and interpretation of income inequality
measures to health inequality must be done in light of these differences between the two domains
(Atkinson, 2010). Health and income both make vitally important contributions to individual
wellbeing, and both are “goods” in the sense that more is generally considered to be better. In
addition, both can act as stores of future value (“capital”) as well as current value (“consumption”).

6
Income can be invested as well as spent on non-durable goods, and health is a form of human capital
as well as a consumption good. Furthermore, both concepts can in principle be measured on fixed
ratio scales that enable comparisons between all individuals. However key differences include:
Levels of income and wealth are defined as a current flow and a current stock respectively,
whereas levels of health are often defined as a sum total of past, current and/or expected
future flows (e.g. life expectancy)
Income is unbounded while health has an upper bound
Full equality of income between individuals is in principle achievable but some inequality in
health between individuals is irremediable and incompensable
Income has only instrumental value, whereas health has intrinsic value (e.g. the value of being
alive, mentally alert, free of pain) as well as instrumental value (e.g. as a pre-requisite for
undertaking household and employment tasks)
Individual income is usually assumed to have diminishing marginal value, whereas any such
assumption about individual health is controversial
With these differences in mind it is useful to examine some of the key properties of inequality
measures as outlined below.
Weak principle of transfers / Pigou-Dalton transfer principle (Dalton, 1920):
In terms of income inequalities it is possible to remove income earned by one individual in the form
of a tax and transfer it directly to another in the form of a benefit. In the context of health care it
would not be possible to remove health gained by one individual and transfer it to another. Instead it
is future expected health gains that can be transferred between individuals.
Scale independence versus translation independence:
Scale independence focuses attention on concern for relative inequality between individuals, rather
than the size or scale of absolute differences between individuals. While this is relatively
uncontroversial when applied to changes in the scale used to measure health – analogous to nominal
7
changes in income due to inflation – it is harder to justify when looking at real differences in health.
For example, if everyone’s life span doubles then a ten year absolute health gap will grow into a
twenty year absolute health gap. It is not self-evident that any reasonable person must deem the new
health distribution to be just as “equal” or “fair” as the old one.
Translation independence on the other hand focuses on concern for absolute inequality between
individuals. This is perhaps a more attractive property in domains such as health where fixed upper
bounds exist and ideas of diminishing marginal value do not necessarily hold.
A brief review of health inequality measures
The health inequalities literature can broadly be categorised into studies using univariate measures of
health inequality, directly translated from the income inequalities domain, and studies using bivariate
measures, measuring health inequality with respect to some socioeconomic variable.
The univariate literature makes use of tools such as the Lorenz curve and it associated Gini coefficient
which characterises all variation in health (Le Grand, 1987). It has been argued that pure measures of
health variation have limited ethical or policy interest: what generates public policy concern is
systematic association between health and an equity relevant social variable such as income
(Hausman, 2007).
This has led to the development of bivariate measures of socio-economic inequality in health such as
the concentration curve and its associated concentration index – for more on these and other similar
socio-economic inequality measures see (Mackenbach & Kunst, 1997) (A Wagstaff et al., 1991).
Concentration curves can be thought of as analogous to Lorenz curves with individuals ordered
according to some other socio-economic variable apart from health, most commonly income. The
concentration curve allows one to see how the distribution of health varies with a variable that is
considered to be an unfair determinant of health. Where ranking by income and ranking by health
coincide, the Lorenz curve and the concentration curve for a distribution will be identical. While
these measures come closer to capturing what we are after – a characterisation of the unfair health
8
inequalities in the health distribution – they only allow us to look at one unfair dimension at a time
and typically limit us to looking at ordinal dimensions.
More sophisticated measures of health inequality have been proposed based on standardisation of
health distributions, using regression techniques to directly or indirectly standardise health
distributions for variation in health considered fair allowing only the unfair variation in health to be
characterised (Fleurbaey & Schokkaert, 2009). The health distribution thus adjusted simultaneously
captures unfair health inequality in all dimensions and can be evaluated using the standard univariate
health inequality measures. This approach requires the decision maker to make explicit social value
judgements about which dimensions of inequality are deemed fair and which unfair. The ability to
simultaneously isolate and evaluate all dimensions of the unfair inequality and the explicitness of the
social value judgements underpinning the adjustment process makes this approach most amenable to
use in the CEA process.
2.2 Social welfare functions combining concern for improving health and reducing health
inequality
Once we have appropriately modelled our health distributions and measured the corresponding levels
of total health and unfair health inequality, we need to combine these two objectives in order to rank
the interventions. We can do this by means of social welfare functions. A health-related social
welfare function (SWF) can in principle be used to describe social welfare as a function of the health
distribution, other things equal – i.e. setting aside non-health aspects of the social state. A health
related SWF may yield either a partial or a complete ordering of health distributions, depending on the
strength of the social value judgements it embodies.
Some key properties used when defining SWFs include that they can be individualistic, non-
decreasing, symmetric, additive, concave, and have constant relative/absolute inequality aversion.
For more details on these properties see (Sen, 1973)(Cowell, 2011). We can use these properties to
derive rules to help us determine which of two health distributions are socially preferable. The
following rules are listed in order from least restrictive to most restrictive and allow us to determine a
9
partial ordering of estimated health distributions A and B associated with two different health
interventions that we are considering:
Rule 1 - Pareto Dominance: for any individualistic, increasing and additive SWF: distribution
A is preferred to distribution B if every person in distribution A has more health than they do
in distribution B.
Rule 2 – Re-ranked Pareto Dominance: for any individualistic, increasing, additive and
symmetric SWF: distribution A is preferred to distribution B if every person in distribution A
has more health than the equivalently ranked person in distribution B.
Rule 3a – Atkinson’s Theorem: for any individualistic, increasing, additive, symmetric, and
strictly concave SWF where the mean health in distributions A and B is the same:
distribution A is preferred to distribution B if and only if the Lorenz curve for A lies wholly
inside the Lorenz curve for B. (Atkinson, 1970)
Rule 3b – Shorrocks’ Theorem: for any individualistic, increasing, additive, symmetric, and
strictly concave SWF and states A and B where the mean health in distributions A and B is
not the same: distribution A is preferred to distribution B if the Generalised Lorenz curve for
A lies wholly inside the Generalised Lorenz curve for B. (Shorrocks, 1983)
By using these dominance rules we do not need to specify the exact nature of the SWF but can
describe broad characteristics that encompass whole classes of SWFs, under any of which the welfare
rankings of particular interventions would be the same. It is important to recognise that these rules
cannot assess trade-offs between health inequality and total health: the rules would never rank a
distribution with lower overall health higher than one with greater overall health. This does not mean
that we always prefer the distribution with higher overall health, as there will be cases under Rule 3
where higher overall health combined with a higher level of inequality leaves us unable to rank
distributions.
2. 3 Social welfare indices
10
Where dominance rules do not apply, in order to obtain a complete ranking of health distributions we
need more fully to describe the SWF. Adding a final assumption about the type and level of
inequality aversion that our SWF entails, e.g. constant relative inequality aversion or constant
absolute inequality aversion, allows us to construct a social welfare index (SWI). The key idea used in
these SWF based indices is that if health is distributed unequally then, given that we have an aversion
to inequality, more overall health would be required to produce the same social welfare than if health
were distributed equally. Social welfare can be represented in these measures using a simple and
convenient “equally distributed equivalent” (EDE) health: the common level of health in a
hypothetical equal distribution of health that has the same level of social welfare as the actual unequal
distribution of health.
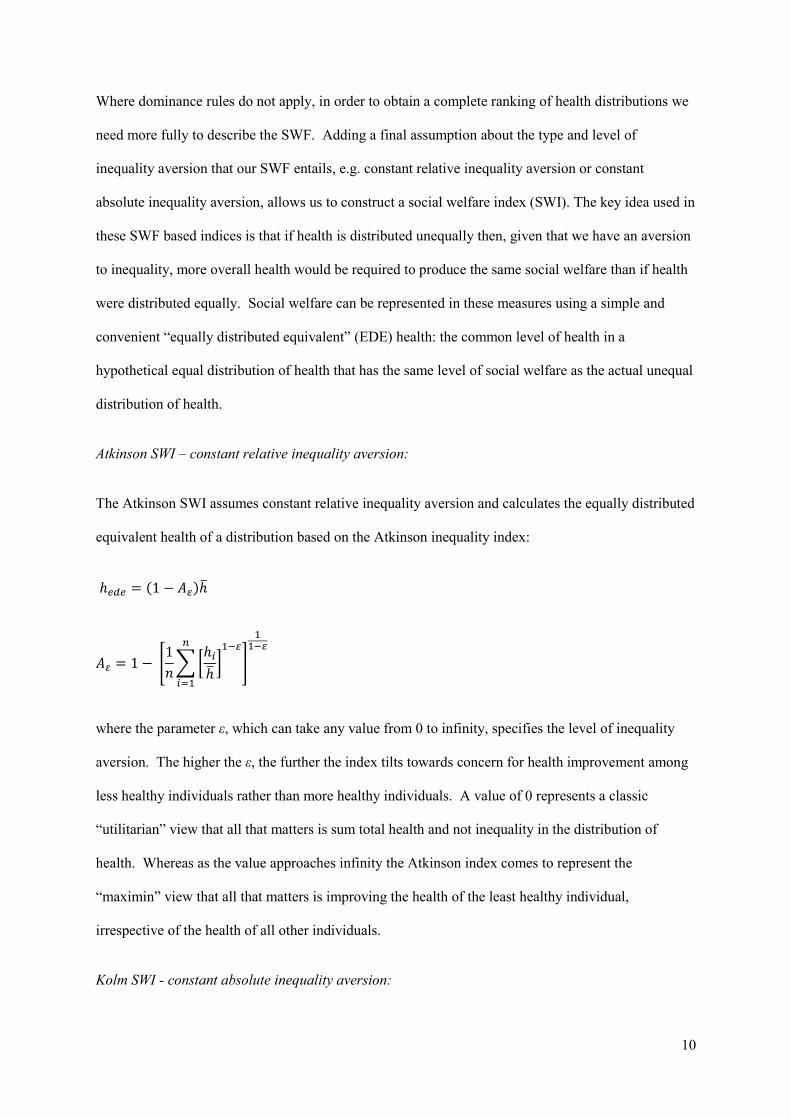
Atkinson SWI – constant relative inequality aversion:
The Atkinson SWI assumes constant relative inequality aversion and calculates the equally distributed
equivalent health of a distribution based on the Atkinson inequality index:
( )
[
∑[
]
]
where the parameter ε, which can take any value from 0 to infinity, specifies the level of inequality
aversion. The higher the ε, the further the index tilts towards concern for health improvement among
less healthy individuals rather than more healthy individuals. A value of 0 represents a classic
“utilitarian” view that all that matters is sum total health and not inequality in the distribution of
health. Whereas as the value approaches infinity the Atkinson index comes to represent the
“maximin” view that all that matters is improving the health of the least healthy individual,
irrespective of the health of all other individuals.
Kolm SWI - constant absolute inequality aversion:
11
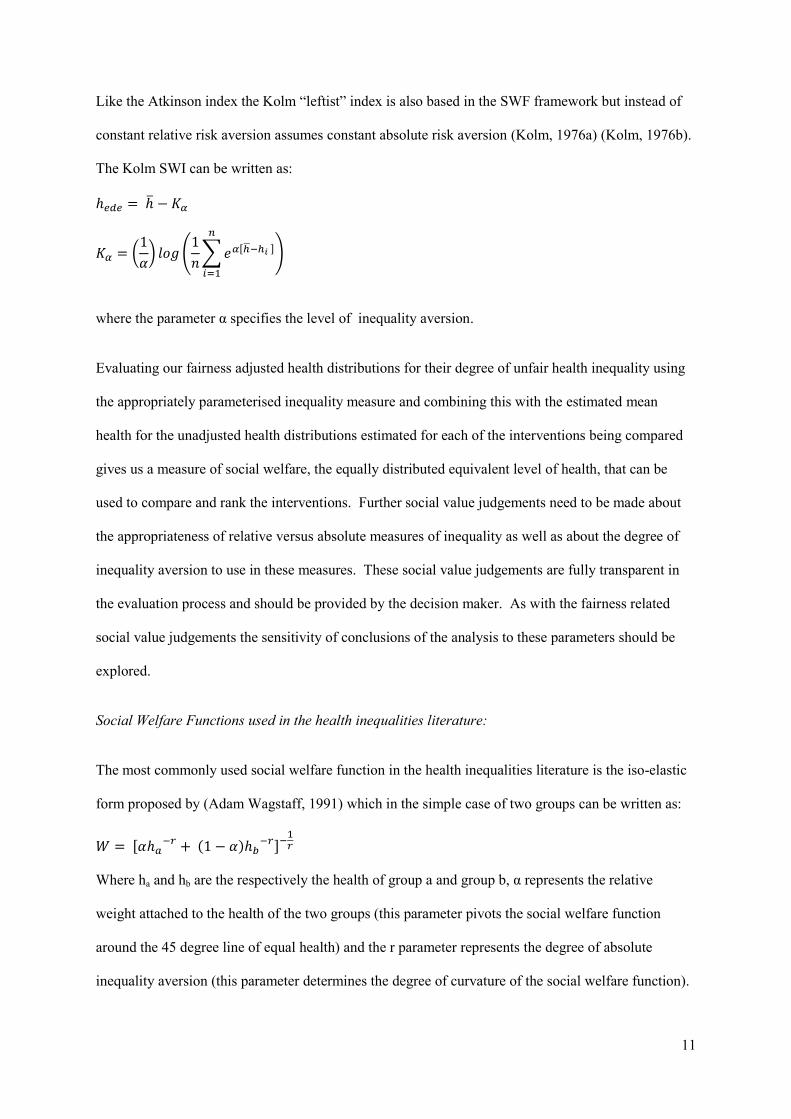
Like the Atkinson index the Kolm “leftist” index is also based in the SWF framework but instead of
constant relative risk aversion assumes constant absolute risk aversion (Kolm, 1976a) (Kolm, 1976b).
The Kolm SWI can be written as:
(
) (
∑ [ ]
)
where the parameter α specifies the level of inequality aversion.
Evaluating our fairness adjusted health distributions for their degree of unfair health inequality using
the appropriately parameterised inequality measure and combining this with the estimated mean
health for the unadjusted health distributions estimated for each of the interventions being compared
gives us a measure of social welfare, the equally distributed equivalent level of health, that can be
used to compare and rank the interventions. Further social value judgements need to be made about
the appropriateness of relative versus absolute measures of inequality as well as about the degree of
inequality aversion to use in these measures. These social value judgements are fully transparent in
the evaluation process and should be provided by the decision maker. As with the fairness related
social value judgements the sensitivity of conclusions of the analysis to these parameters should be
explored.
Social Welfare Functions used in the health inequalities literature:
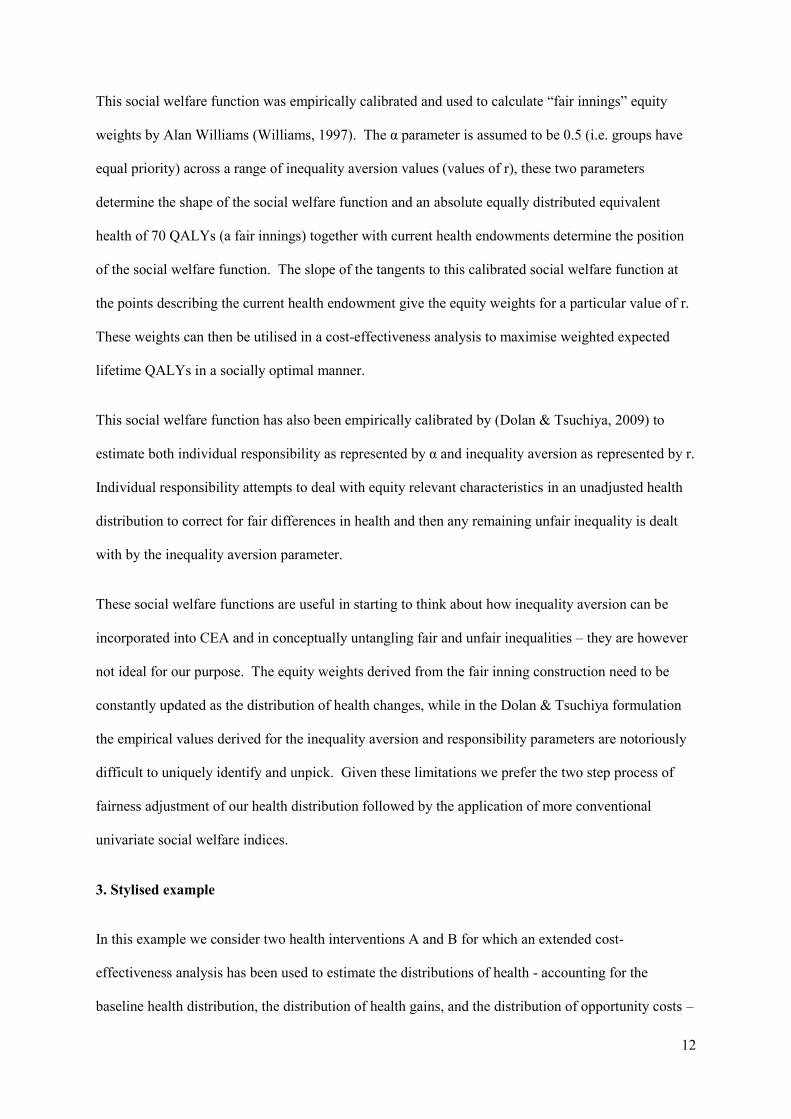
The most commonly used social welfare function in the health inequalities literature is the iso-elastic
form proposed by (Adam Wagstaff, 1991) which in the simple case of two groups can be written as:
[ ( )
]
Where ha and hb are the respectively the health of group a and group b, α represents the relative
weight attached to the health of the two groups (this parameter pivots the social welfare function
around the 45 degree line of equal health) and the r parameter represents the degree of absolute
inequality aversion (this parameter determines the degree of curvature of the social welfare function).
12
This social welfare function was empirically calibrated and used to calculate “fair innings” equity
weights by Alan Williams (Williams, 1997). The α parameter is assumed to be 0.5 (i.e. groups have
equal priority) across a range of inequality aversion values (values of r), these two parameters
determine the shape of the social welfare function and an absolute equally distributed equivalent
health of 70 QALYs (a fair innings) together with current health endowments determine the position
of the social welfare function. The slope of the tangents to this calibrated social welfare function at
the points describing the current health endowment give the equity weights for a particular value of r.
These weights can then be utilised in a cost-effectiveness analysis to maximise weighted expected
lifetime QALYs in a socially optimal manner.
This social welfare function has also been empirically calibrated by (Dolan & Tsuchiya, 2009) to
estimate both individual responsibility as represented by α and inequality aversion as represented by r.
Individual responsibility attempts to deal with equity relevant characteristics in an unadjusted health
distribution to correct for fair differences in health and then any remaining unfair inequality is dealt
with by the inequality aversion parameter.
These social welfare functions are useful in starting to think about how inequality aversion can be
incorporated into CEA and in conceptually untangling fair and unfair inequalities – they are however
not ideal for our purpose. The equity weights derived from the fair inning construction need to be
constantly updated as the distribution of health changes, while in the Dolan & Tsuchiya formulation
the empirical values derived for the inequality aversion and responsibility parameters are notoriously
difficult to uniquely identify and unpick. Given these limitations we prefer the two step process of
fairness adjustment of our health distribution followed by the application of more conventional
univariate social welfare indices.
3. Stylised example
In this example we consider two health interventions A and B for which an extended cost-
effectiveness analysis has been used to estimate the distributions of health - accounting for the
baseline health distribution, the distribution of health gains, and the distribution of opportunity costs –
13
associated with each of the health interventions. In this case we make the social value judgement that
all inequality in the distribution should be regarded as unfair so no further adjustment is necessary.
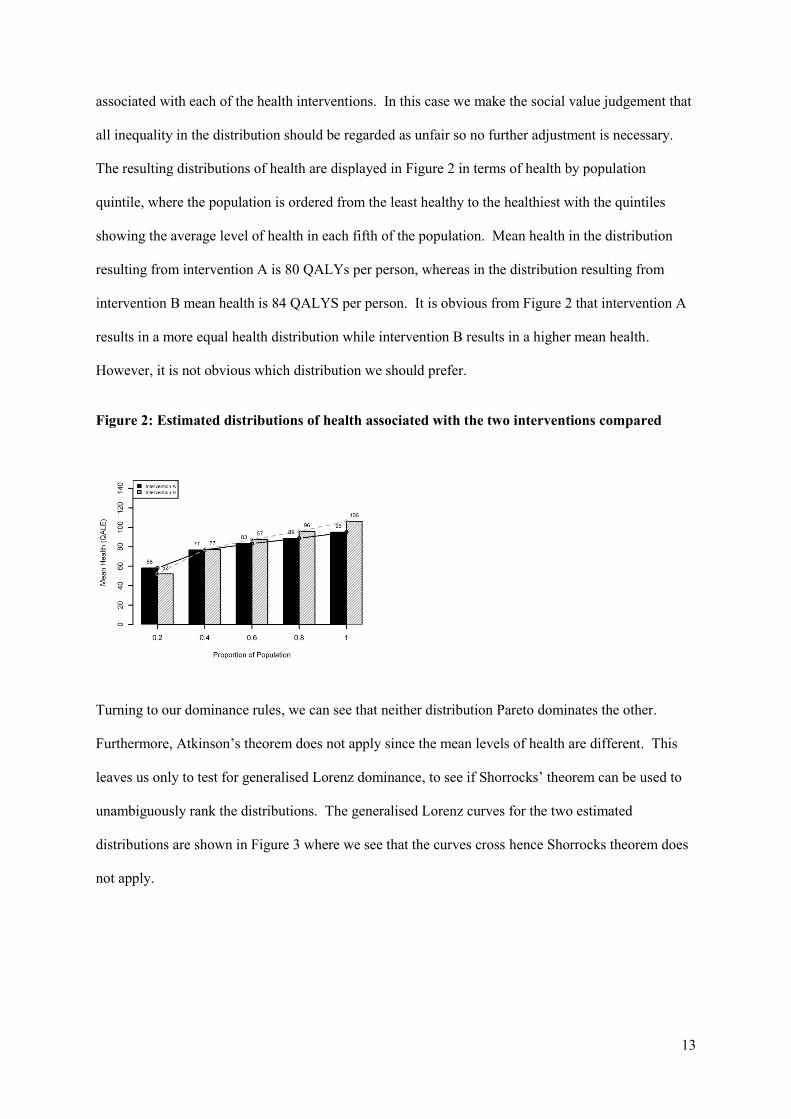
The resulting distributions of health are displayed in Figure 2 in terms of health by population
quintile, where the population is ordered from the least healthy to the healthiest with the quintiles
showing the average level of health in each fifth of the population. Mean health in the distribution
resulting from intervention A is 80 QALYs per person, whereas in the distribution resulting from
intervention B mean health is 84 QALYS per person. It is obvious from Figure 2 that intervention A
results in a more equal health distribution while intervention B results in a higher mean health.
However, it is not obvious which distribution we should prefer.
Figure 2: Estimated distributions of health associated with the two interventions compared
Turning to our dominance rules, we can see that neither distribution Pareto dominates the other.
Furthermore, Atkinson’s theorem does not apply since the mean levels of health are different. This
leaves us only to test for generalised Lorenz dominance, to see if Shorrocks’ theorem can be used to
unambiguously rank the distributions. The generalised Lorenz curves for the two estimated
distributions are shown in Figure 3 where we see that the curves cross hence Shorrocks theorem does
not apply.

14
Figure 3: Generalised Lorenz curves for the estimated distributions of health associated with
the two interventions compared
Given that we have been unable to rank the health distributions using our dominance rules, we next
try to rank the distributions by calculating social welfare indices for the two distributions. Both
Atkinson and Kolm indices have been calculated for the two distributions at both high and low levels
of inequality aversion (see Table 1). We can see from the SWIs that at low levels of inequality
aversion both the relative and absolute indices rank the more unequal but higher mean health
distribution B above distribution A, however for both indices as inequality aversion increases the
ranking is reversed.
Table 1: Social welfare indices comparing the two estimated distributions of health
Distribution A Distribution B Difference B - A
Mean Health 80.37 83.70 3.32
Atkinson SWI (ε=0.5) 79.36 81.85 2.49
Atkinson SWI (ε=1.5) 70.14 58.80 -11.34
Kolm SWI (α=0.0125) 78.89 80.84 1.95
Kolm SWI (α=0.05) 70.63 67.31 -3.32

15
We have seen that our ranking is sensitive to social welfare judgements around the type and level of
inequality aversion expressed in our social welfare indices. We next explore the sensitivity of our
rankings to alternative social welfare judgements about the fairness of the various dimensions of the
health variation. Let us now assume that all health variation in the distribution is fair apart from the
variation associated with income. We standardise the health distributions for the other population
characteristics captured in the analysis, in this case gender and ethnicity, leaving only variation
associated with income as depicted in Figure 4. We can now see from these adjusted distributions
that not only is mean health higher in the distribution associated with intervention B but also that this
distribution Pareto dominates the distribution associated with intervention A. Using these social value
judgements regarding fairness, we could unambiguously rank intervention B as being better than
intervention A. We can confirm this ranking by re-examining our SWIs for the adjusted distributions
as shown in Table 2.
Figure 4: Fairness adjusted distributions of health associated with the two interventions
Table 2: Social welfare indices comparing the adjusted distributions of health
Distribution A Distribution B Difference B - A
Mean Health 80.37 83.70 3.32
Atkinson SWI (ε=0.5) 80.33 83.62 3.29
Atkinson SWI (ε=1.5) 80.26 83.47 3.21
Kolm SWI (α=0.0125) 80.29 83.52 3.23
Kolm SWI (α=0.05) 80.06 82.99 2.93
16
4. Discussion
The income inequality literature provides a rich set of tools for incorporating distributional concerns
into economic analysis. In this paper we have explored ways in which these methods can be applied
to assess the cost-effectiveness and health inequality impact of public health interventions.
We have seen that traditional bivariate health inequality analysis, while useful in exploring particular
social determinants of health, can be limiting in the context of practical cost-effectiveness analysis
when decision makers may be interested in multiple unfair sources of health inequality. Drawing
from the wider literature on economic inequality, our methods allow us more fully to describe health
distributions in a way that is more informative in the context of public health priority setting.
In order to use these methods we have seen that we need to extend cost-effectiveness analysis to
calculate not only the distribution of health benefits due to particular interventions but also the
distribution of health opportunity costs due to activities displaced by the interventions. We also need
to calculate the baseline distribution of health levels and the final distribution of health levels
associated with each intervention, in order set the health changes in context. Finally, we need to
evaluate the final health distributions associated with each intervention by applying dominance rules
and, where necessary, social welfare indices that explicitly characterise the nature of any trade-off
between reducing health inequality and improving total population health.
We have also seen that a number of social value judgements need to be made to allow us to adjust and
rank the resulting distributions of health. The methods we propose make these social value
judgements transparent and expose them as parameters to the decision maker. Our stylised example
has shown that it is essential to test the sensitivity of the rankings produced by such an analysis to
alternate social value judgements to appreciate the robustness of any conclusions that can be drawn.
17
References
Atkinson, A. B. (1970). On the measurement of inequality. Journal of economic theory, 2(3), 244–
263.
Atkinson, A. B. (2010). Atkinson Brocher Lecture revised October 2010. Measurement and Ethical
Evaluation of Health Inequalities.
Cowell, F. (2011). Measuring Inequality (p. 304). Oxford University Press.
Dalton, H. (1920). The measurement of the inequality of incomes. The Economic Journal, 30(119),
348–361.
Dolan, P., & Tsuchiya, A. (2009). The social welfare function and individual responsibility: some
theoretical issues and empirical evidence. Journal of health economics, 28(1), 210–20.
Fleurbaey, M., & Schokkaert, E. (2009). Unfair inequalities in health and health care. Journal of
health economics, 28(1), 73–90.
Le Grand, J. (1987). Inequalities in health: some international comparisons. European economic
review, 31, 182–191.
Hausman, D. (2007). What’s Wrong with Health Inequalities?*. Journal of Political Philosophy,
15(1), 46–66.
Kolm, S.-C. (1976a). Unequal inequalities. I. Journal of Economic Theory, 12(3), 416–442.
Kolm, S.-C. (1976b). Unequal inequalities. II. Journal of Economic Theory, 13(1), 82–111. Elsevier.
Mackenbach, J. P., & Kunst, A. E. (1997). Measuring the magnitude of socio-economic inequalities in
health: an overview of available measures illustrated with two examples from Europe. Social
Science & Medicine, 44(6), 757–771. Elsevier.
Sen, A. K. (1973). On economic inequality (p. 118). Norton.
Shorrocks, A. F. (1983). Ranking Income Distributions. Economica, 50(197), 3.
Wagstaff, A, Paci, P., & van Doorslaer, E. (1991). On the measurement of inequalities in health.
Social science & medicine (1982), 33(5), 545–57.
Wagstaff, Adam. (1991). QALYs and the equity-efficiency trade-off. Journal of Health Economics,
10(1), 21–41. Elsevier.
Williams, A. (1997). Intergenerational equity: an exploration of the “fair innings” argument. Health
economics, 6(2), 117–32.