Embed Size (px)
Citation preview

ASIA AND PACIFIC COMMISSION ON AGRICULTURAL STATISTICS
TWENTY-SIXTH SESSIONThimphu, Bhutan, 15-19 February 2016
Agenda Item 6.4
Measuring Food Security in Bangladesh Challenges and Way-Forward
Contributed by: Salima Sultana, Director ( Joint Secretary)Bangladesh Bureau of Statistics [email protected]
APCAS/16/6.4.3
Measuring Food Security in BangladeshChallenges and Way-Forward
The 26th Session of the Asia and Pacific Commission on Agricultural Statistics
15-19 February 2016 Thimphu, Bhutan
Salima SultanaDirector( Joint Secretary)
Bangladesh Bureau of Statistics
Statistics and Informatics DivisionMinistry of Planning
Outline
• FBS Initiative in Bangladesh
• Technical support by FAO
• FBS Bangladesh Context
• Dimension of FBS
• Main challenges
• Way Forward
FBS Initiative in Bangladesh
• BBS published FBS up to 2005-06 in Statistical Yearbook
• Training conducted in July 2015 and October 2015
• Data entry done during July-December 2015 for 5 Year FBS (2009-2013)
• Draft report prepared in January 2016
• Report will be published after validation workshop in February 2016

Technical Support by FAO
• Training organized in July and October 2015
• Provide consultancy support (international and national)
• Publication of the FBS Report
FBS Bangladesh Context
• FBS Report outline
Introduction, Methodologies, Concepts and definitions, Food supply situation, Food security status, Suggestive measures
• Food requirement (demand)
• Food production status in Bangladesh
• Overall food security situation
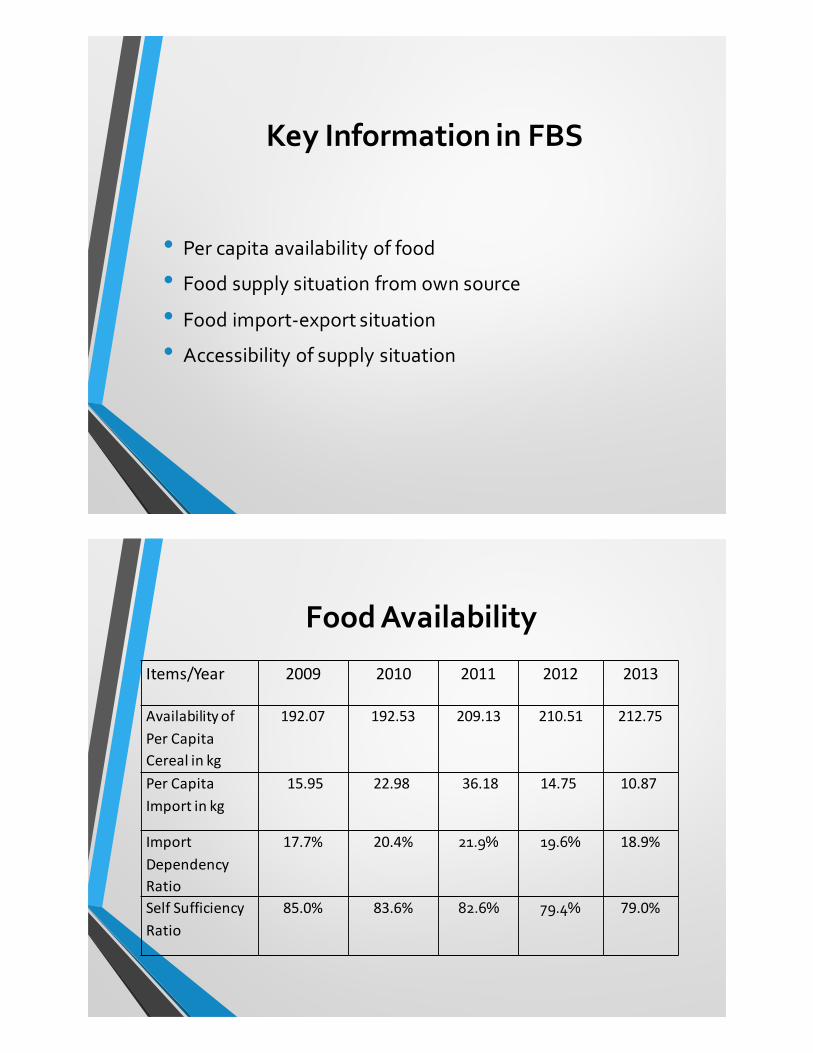
Key Information in FBS
• Per capita availability of food
• Food supply situation from own source
• Food import-export situation
• Accessibility of supply situation
Food Availability
Items/Year 2009 2010 2011 2012 2013
AvailabilityofPerCapitaCerealinkg
192.07 192.53 209.13 210.51 212.75
PerCapitaImportinkg
15.95 22.98 36.18 14.75 10.87
ImportDependencyRatio
17.7% 20.4% 21.9% 19.6% 18.9%
SelfSufficiencyRatio
85.0% 83.6% 82.6% 79.4% 79.0%

Food Security Situation
Items/Year 2009 2010 2011 2012 2013AvailabilityofPerCapitaPerdayinkilocalorie
2633 2690 2877 2925 2945
PerCapitaPerdayRequirementinkilocalorie
2265
PerCapitaPerdayActualConsumptioninHIES2010inkilocalorie
2318
Available for Consumption of different Food groups (in kg)
Items/Year 2009 2010 2011 2012 2013Cereal 192.07 192.53 209.13 210.51 212.75Fish 17.99 19.19 20.03 20.98 21.74Meat 11.74 11.62 12.88 13.39 13.96Milk 15.38 13.35 14.79 14.67 15.15Egg 4.21 4.18 4.16 4.12 4.07Oil 7.78 8.28 9.15 9.63 8.46Vegetable 20.21 21.81 22.83 23.64 23.42Fruits 25.71 28.53 25.80 25.64 26.46

Dimension of FBS in Bangladesh
• Trend analysis for current availability assessment
• Export –import situation
• Magnitude of Food Security with nutritional aspects
• Policy Implications
Main Challenges
• Data gap (seed, feed, wastage and so on)
• Timely data unavailable
• Huge data needed
• More survey required

Way Forward
• Identify core data set required for FBS
• Conduct necessary surveys for using country specific coefficients
• Utilize more administrative data in an efficient manner
• Sustained effort by GoB to continue FBS process
Thank You
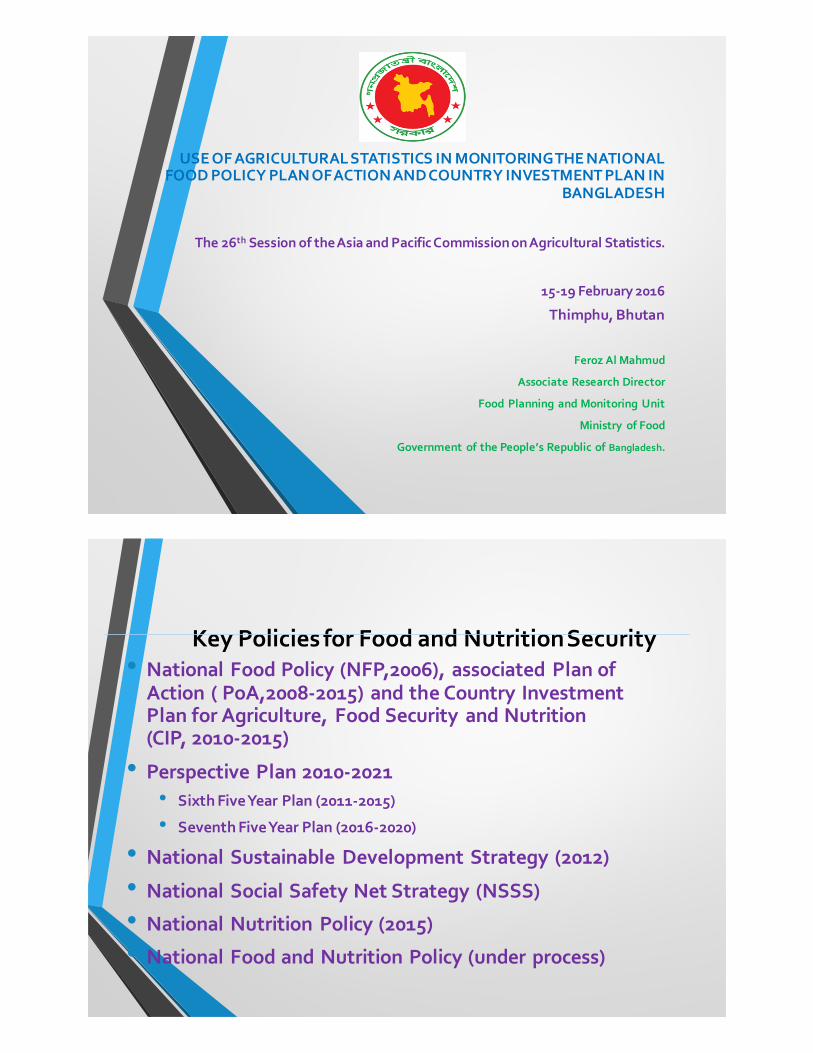
USE OF AGRICULTURAL STATISTICS IN MONITORING THE NATIONAL FOOD POLICY PLAN OF ACTION AND COUNTRY INVESTMENT PLAN IN
BANGLADESH
The 26th Session of the Asia and Pacific Commission on Agricultural Statistics.
15-19 February 2016
Thimphu, Bhutan
Feroz Al Mahmud
Associate Research Director
Food Planning and Monitoring Unit
Ministry of Food
Government of the People’s Republic of Bangladesh.
Key Policies for Food and Nutrition Security• National Food Policy (NFP,2006), associated Plan of
Action ( PoA,2008-2015) and the Country Investment Plan for Agriculture, Food Security and Nutrition (CIP, 2010-2015)
• Perspective Plan 2010-2021 • Sixth Five Year Plan (2011-2015)
• Seventh Five Year Plan (2016-2020)
• National Sustainable Development Strategy (2012)
• National Social Safety Net Strategy (NSSS)
• National Nutrition Policy (2015)
• National Food and Nutrition Policy (under process)

Monitoring Result Indicators
2/18/16Programs in 2014
17FPMU Learning Program
Availability Access Utilization
27 Output Indicators
15 Output Indicators
22 Output Indicators
Food Security : 3 Goal Indicators +5 SYP Ind.
4 OutcomeIndicators
5 OutcomeIndicators
5 Outcome Indicators
Outcome indicators by Food Security Dimensions (i.e. availability, access, utilisation)
Ava
ilabi
lity
Adequate & stable supply of safe & nutritious food is achieved
• RateofgrowthofagriculturalGDPinconstantprices• Rice import dependency (3-year moving average)• Instability of rice production•Share of rice value added in total food value added in current price
Acc
ess
Increased purchasing power & access to food of the people
•Changeinnationalwagesexpressedinkgofrice(3-yearmovingaverage)•Poverty headcount index (CBN upper poverty line) •Poverty gap (CBN upper poverty line)•Difference between food and general inflation (3-year moving average)•Extreme poverty rate (CBN lower poverty line)
Uti
lizat
ion
Adequate nutrition achieved for all individuals, especially women & children
•Nationaldietaryenergysupplyfromcereals(%)•National dietary energy intake from cereals (%) •Chronic energy deficiency prevalence among women (BMI <18.5) (%)•Proportion of children receiving minimum acceptable diet at 6-23 months (%) •Proportion of households consuming iodized salt (%)

Result Indicators : NFP Objective 1 (outcome)
CIP/NFP PoA proxy indicatorsResults Source
RateofgrowthofagriculturalGDPinconstantprices2005-06 BBS
Riceimportdependency(3-yearmovingaverage) FPMU
Instabilityofriceproduction BBS
Shareofricevalueaddedintotalfoodvalueaddedincurrentprice BBS
CIP/NFP PoA output proxy indicators Results Source
No. of improved new rice varieties released by GoB agencies MoA
No. of improved new non- rice varieties (wheat, maize, potato, pulses, vegetables, fruits) released by GoB agencies
MoA
Annual change in major crops' production
Rice BBS
Wheat BBS
Maize BBS
Potato BBS
Pulses BBS
Vegetables BBS
Fruits BBS
% of cropped area under irrigation BBS
Change in crop yields(moving average over3 previous years)
Rice BBS
Wheat BBS
Vegetables BBS
Fruits BBS
Pulses BBS
Edible Oilseeds BBS
CIP/NFP PoA Output Proxy indicators

Key Result indicators (output): Food Availability
CIP/NFP PoA output proxy indicators Results Source
Agricultural Credit Disbursement (Billion TK) and progress BB
Annual changes of quantity of fish production
MoFL
Production of livestock items
Egg (million) MoFL
Milk (Million MT)MoFL
Meat (MMT)MoFL
GDP from Fisheries sector as % of AgricultureGDP BBS
GDP from Livestock sector as % of AgricultureGDP BBS
HOW RESULTS ARE TRANSLATED INTO MONITORING REPORT?
2 examples : 1. Fig: Rice production and its instability in Bangladesh
Instability of rice production remained substantially unchanged in 2014/15 at 3.09% compared to the previous year. Rice production increased by around 1.03% in 2014/15 than
in 2013/14.
Source: BBS

2. Fig: Rice wage of agricultural laborers
Rice wage of agricultural workers had a lot of fluctuations over the months even the years . 11.5 kg of rice wage was registered in June 2015.
Source: BBS, DAM
Challenges:
• Disaggregated data (Division, District and Upazilla level) data are not available.
• Gender disaggregated data are also limited
• Access to micro data.
• Timely availability of data

Thank You