Embed Size (px)
Citation preview
Measuring Excellence at Concordia
University
Prepared by the Institutional Planning Office
July 2011


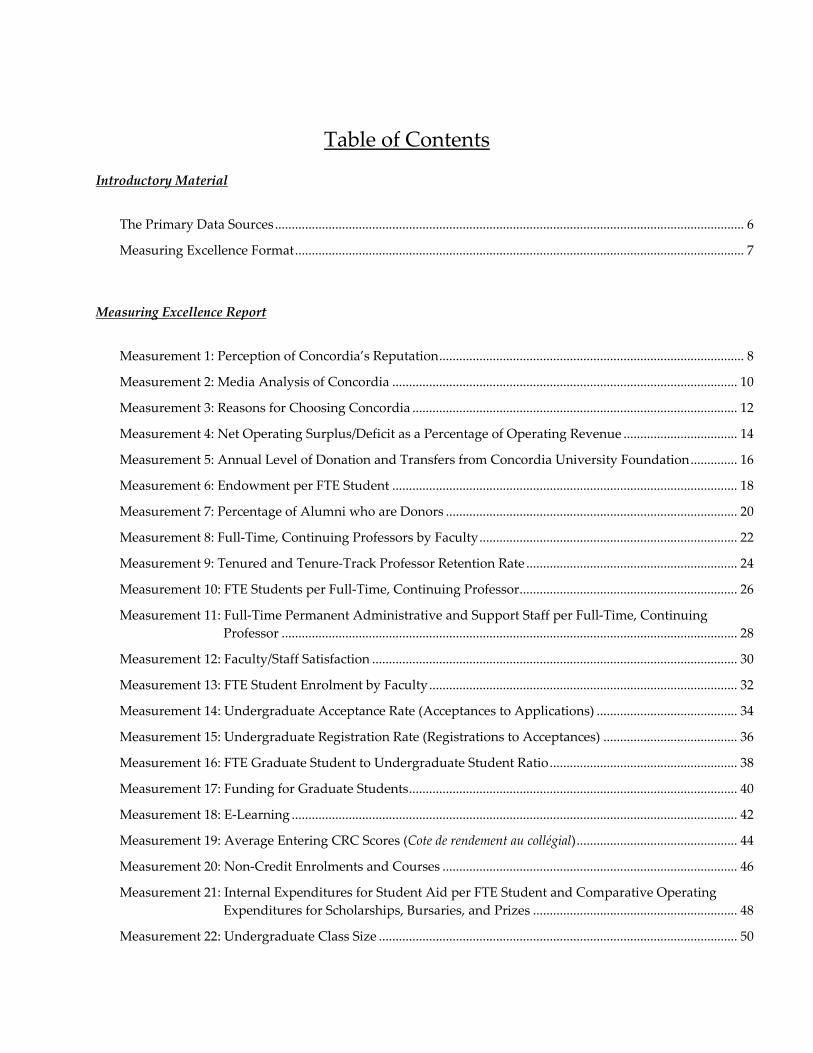
Table of Contents
Introductory Material
The Primary Data Sources ............................................................................................................................................ 6
Measuring Excellence Format ...................................................................................................................................... 7
Measuring Excellence Report
Measurement 1: Perception of Concordia’s Reputation ........................................................................................... 8
Measurement 2: Media Analysis of Concordia ....................................................................................................... 10
Measurement 3: Reasons for Choosing Concordia ................................................................................................. 12
Measurement 4: Net Operating Surplus/Deficit as a Percentage of Operating Revenue .................................. 14
Measurement 5: Annual Level of Donation and Transfers from Concordia University Foundation .............. 16
Measurement 6: Endowment per FTE Student ....................................................................................................... 18
Measurement 7: Percentage of Alumni who are Donors ....................................................................................... 20
Measurement 8: Full‐Time, Continuing Professors by Faculty ............................................................................. 22
Measurement 9: Tenured and Tenure‐Track Professor Retention Rate ............................................................... 24
Measurement 10: FTE Students per Full‐Time, Continuing Professor ................................................................. 26
Measurement 11: Full‐Time Permanent Administrative and Support Staff per Full‐Time, Continuing
Professor ........................................................................................................................................ 28
Measurement 12: Faculty/Staff Satisfaction ............................................................................................................. 30
Measurement 13: FTE Student Enrolment by Faculty ............................................................................................ 32
Measurement 14: Undergraduate Acceptance Rate (Acceptances to Applications) .......................................... 34
Measurement 15: Undergraduate Registration Rate (Registrations to Acceptances) ........................................ 36
Measurement 16: FTE Graduate Student to Undergraduate Student Ratio ........................................................ 38
Measurement 17: Funding for Graduate Students .................................................................................................. 40
Measurement 18: E‐Learning ..................................................................................................................................... 42
Measurement 19: Average Entering CRC Scores (Cote de rendement au collégial) ................................................ 44
Measurement 20: Non‐Credit Enrolments and Courses ........................................................................................ 46
Measurement 21: Internal Expenditures for Student Aid per FTE Student and Comparative Operating
Expenditures for Scholarships, Bursaries, and Prizes ............................................................. 48
Measurement 22: Undergraduate Class Size ........................................................................................................... 50

Measurement 23: Student Satisfaction ...................................................................................................................... 52
Measurement 24: Teaching Effectiveness ................................................................................................................. 54
Measurement 25: Prevalence of “Active and Collaborative Learning” ............................................................... 56
Measurement 26: Retention Rates of Full‐Time Bachelor’s Degree‐Seeking Students ...................................... 58
Measurement 27: Undergraduate Students with Failed Status ............................................................................. 60
Measurement 28: Graduation Rates of Full‐Time Bachelor’s Degree‐Seeking Students ................................... 62
Measurement 29: Duration of Studies and Graduation/Withdrawal/Continuation Rates of Full‐Time
Master’s and Doctoral Students .................................................................................................. 64
Measurement 30: Expenditures for Academic Support Services per FTE students ........................................... 66
Measurement 31: Average Grades at Completion .................................................................................................. 68
Measurement 32: Employment of Graduates Six Months and Two Years after Graduation ............................ 70
Measurement 33: Scholarly Productivity Index ...................................................................................................... 72
Measurement 34: Patent Output ................................................................................................................................ 74
Measurement 35: Research Funding per Tenured and Tenure‐Track Professor ................................................ 76
Measurement 36: Federal Research Funding (Tri‐Council) ................................................................................... 78
Measurement 37: Provincial Research Funding (FQRNT, FQRSC) ...................................................................... 80
Measurement 38: Number of Research Chair Holders ........................................................................................... 82
Measurement 39: Percentage of Tri‐Council Scholarships per Full‐Time Graduate Students .......................... 84
Measurement 40: International Visa Students ......................................................................................................... 86
Measurement 41: Student Exchanges ....................................................................................................................... 88
Measurement 42: Facilities Condition Index ........................................................................................................... 90
Measurement 43: Space Allocation ........................................................................................................................... 92
Other Sections
Acronyms used in this Report ................................................................................................................................... 94
Glossary of Terms used in this Report...................................................................................................................... 97
Appendix A: Detailed Description of Report Sections ......................................................................................... 104
Appendix B: Professors by Disciplinary Sector and Institution, Québec Universities, October 1, 2008 ....... 105

6
The Primary Data Sources
Much of the data for this report was drawn from Concordia’s Data Warehouse. Several sectors of the
University administration, including Academic Administration, Advancement and Alumni Relations,
Enrolment and Student Services, Facilities Management, Financial Services, and the Office of Research
supplied other Concordia data. Where possible, requested data were independently verified by the
Institutional Planning Office.
For comparative measurements, this report favours data drawn from independent sources. For example,
the Tri‐council Funding “Cube” was used to compare grant funds awarded by the Canadian Institutes of
Health Research (CIHR), the Natural Sciences and Engineering Research Council of Canada (NSERC),
and the Social Sciences and Humanities Research Council of Canada (SSHRC). To compare grant funds
awarded from the Répertoire de la recherche subventionnée, FQRNT‐FQRSC, the amounts awarded to
Concordia were drawn directly from the databases of each Council. In this way, we were able to ensure
that all universities were being compared using the same parameters.1
Concordia belongs to several data‐sharing consortia broadening access to valid, reliable, comparative
data. These include:
The National Survey of Student Engagement (NSSE): tri‐annual
The Consortium for Student Retention Data Exchange (CSRDE): annual
The Observatoire des sciences et des technologies (OST)
The Cormex Canadian Universities Media Research Consortium: membership terminated as of 2007
Canadian Undergraduate Survey Consortium (CUSC): annual (participation suspended as of 2009)
Each of the consortia is defined as it appears in the report’s text and in the Glossary.
The Institutional Planning Office would like to thank the members of the Concordia University
community, whose support and cooperation have made this report possible.
1 The Conférence des recteurs et des principaux des universités Québecois (CREPUQ) has fewer data collection and sharing initiatives
than the Council of Ontario Universities (COU), which inhibits provincial comparisons. Furthermore, the “G13” universities, which
call themselves “Canada’s thirteen most research‐intensive universities,” formed their own data‐sharing consortium in 1999 that
excludes Concordia. In this context, Concordia has had to be creative in obtaining comparative data and will therefore continue to
improve its ability to collect such data as each annual report appears.

7
Measuring Excellence Format
The measurements are arranged so that the open booklet presents a single measurement with the text and
figures on facing pages.
For each measurement, the following sections appear on its text page:
1. Definition of the Measurement
2. Findings and Conclusions
3. Source
Following each text are one or two figures illustrating salient aspects of the measurement. The figures
generally show one of the following four situations:
Concordia’s progress over a period of time with no comparative peer data
Concordia’s progress over a period of time with comparative peer data
Concordia’s position in time with no comparative peer data
Concordia’s position in time with comparative peer data
As in other reports of this type, the choice of situation was largely determined by the available data.
Lists of Acronyms, as well as a Glossary of Terms are provided at the end of this document. The Glossary
elaborates further on terms and definitions in the text.
This report represents an iterative process that will refine measurements with a view to making them
successively more useful in academic and strategic planning. The Institutional Planning Office welcomes
constructive engagement in this process.

8
Measurement 1: Perception of Concordia’s Reputation
NOTE: There are no new data to report this year; data presented are those from Measuring Excellence
2007.
Definition of the Measurement:
This benchmark research was conducted by The Strategic Counsel. The research, which took place
between January and November 2006, included one‐on‐one interviews, focus groups, and surveys among
ten different groups, conducted in both English and French. For this measurement, respondents were
asked to provide their perception of overall reputation. All respondents in each group were asked to
provide their perception of the overall reputation for specific universities. The list of institutions varied in
length from group to group for methodological reasons. The universities shown represent the largest
number of institutions common to all questionnaires.
Findings and Conclusions:
Margins of error for the various groups ranged from ± 1.51% to ± 14.61% with students having the lowest
and general public having the highest. Note that margins of error were calculated using a formula based
on the number of respondents only. Figure 1.1 shows that perceptions of Concordia as having a good or
excellent reputation are held by those who want to study (applicants, 81%), are studying (students, 67%),
or have studied here (alumni, 69%). Conversely, those who work for the university (staff, 57% and
faculty, 40%) are less likely to say Concordia has a good or excellent reputation. In surveys done by other
Canadian universities such a gap has been found between these groups, but in the case of Concordia this
gap is more pronounced, with fewer faculty and staff tending to rate it as having an “excellent”
reputation.
While business leaders (62%) perceive Concordia as having a good or excellent reputation, more than a
quarter of those surveyed indicated they “do not know” enough about Concordia to make a judgment or
declined to venture a guess. A similar pattern emerged among the general public, where 48% consider
Concordia’s reputation to be good or excellent, but a full 39% responded that they “do not know” or have
“no opinion.” With so many respondents holding no particular view about Concordia’s reputation,
raising the university’s profile is crucial. Clearly, the more positive the communication is, the more the
impressions they form will be positive.
Figure 1.2, which excludes “don’t know/no opinion” responses, shows that across the various groups
Concordia exhibits similar patterns to other universities, with the exception of McGill, whose reputation
is consistently high for all groups.
Analyses of overall reputation ratings for all universities included in the research reveal that the
institutions can be classified into three tiers. In this respect, the first tier of universities includes McGill,
Toronto, Queen’s, and to a lesser extent, Waterloo. For the most part, Concordia is part of a second tier,
on par with York and McMaster. Among faculty and to some extent staff, however, Concordia falls into a
third tier along with Carleton and Guelph.
Source:
Concordia University’s Reputation Survey conducted by The Strategic Counsel 2006

9
Source: Concordia University's Reputation Survey conducted by The Strategic Counsel, 2006
Source: Concordia University's Reputation Survey conducted by The Strategic Counsel, 2006 Note: (1) All groups were asked to provide their perception of the overall reputation for specific universities. The universities appearing in this Figure represent the largest number of institutions common to all questionnaires. (2) Dashed lines are intended as an aid to following a group of respondents and do not indicate a trend.
15
17
3
7
17
17
32
33
45
37
50
52
50
49
12
9
47
34
23
24
13
1
1
9
4
3
4
2
2
1
39
28
2
4
3
4
3
0% 10% 20% 30% 40% 50% 60% 70% 80% 90% 100%
General Population (n=2,007)
Business Leaders (n=200)
Faculty(n=319)
Staff(n=454)
Alumni(n=1,338)
Students(n=4,223)
Applicants(n=1,927)
Percentage by Response Choice
Excellent Good Average Poor Very poor Don't Know/No Opinion
Figure 1.1: Perception of Concordia's Overall Reputation by Group
10%
20%
30%
40%
50%
60%
70%
80%
90%
100%
Concordia McGill UdeM SimonFraser
Laval York Carleton UQAM
Business Leaders General Population Alumni Students Staff Faculty Applicants
Figure 1.2: Percentage of Respondents Indicating a University's Overall Reputation is "Good" or "Excellent", Concordia Compared with Other Universities
0%

10
Measurement 2: Media Analysis of Concordia
Definition of the Measurement:
This measurement looks at media coverage in the Canadian mainstream media, tracked over time.
Tracking for Concordia began in 2005. The analysis was based on approximately 15,000 media items per
month, tracking 16 dailies, four widely‐subscribed magazines, and major national and provincial radio
and television. While media analysis does not constitute an exact science, a primary scale of measurement
in media coverage is estimated “audience reach” calculated in total media “impressions.” A media
impression refers to an individual audience view of a news item, whether it is by a subscriber or a non‐
paying reader. Impressions are also scaled based on the prominence and position of Concordia’s mention
within an item and within a publication, or in the case of broadcast, the time of airing.
Findings and Conclusions:
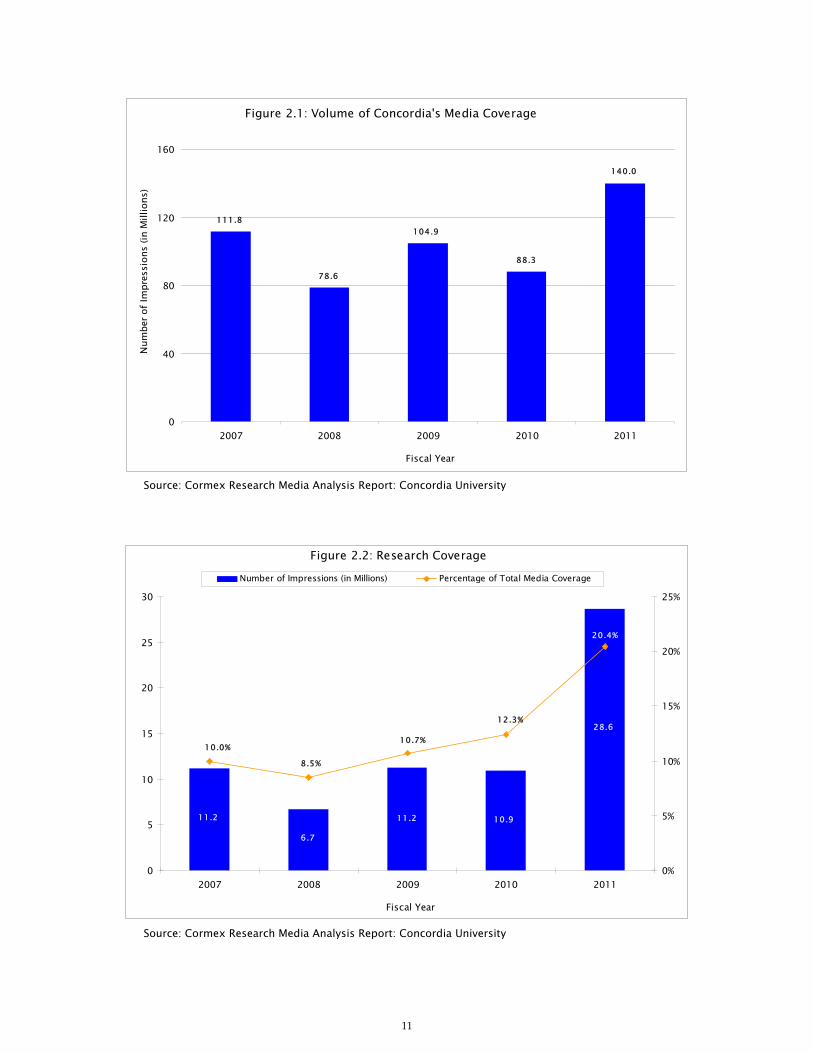
During the 2011 fiscal year, Concordia’s total media exposure climbed to its highest level in over six years
of tracking, reaching 140 million impressions. Figure 2.1 shows that Concordia’s profile increased by
58.6% in comparison to 2010. Numerous factors contributed to the university’s elevated media profile,
including heightened attention to the human resources and governance issues related to the departure
and replacement of the university’s president, as well as increased research coverage and expert
commentary.
Figure 2.2 shows that coverage of Concordia’s research activities in fiscal year 2011 more than doubled
over the previous four years and represented one‐fifth of the university’s media profile.
Source:
Cormex Research Media Analysis Report: Concordia University
11
Source: Cormex Research Media Analysis Report: Concordia University
Source: Cormex Research Media Analysis Report: Concordia University
111.8
78.6
104.9
88.3
140.0
0
40
80
120
160
2007 2008 2009 2010 2011
Num
ber o
f Im
pres
sion
s (in
Mill
ions
)
Fiscal Year
Figure 2.1: Volume of Concordia's Media Coverage
11.2
6.7
11.2 10.9
28.6
10.0%
8.5%
10.7%
12.3%
20.4%
0
5
10
15
20
25
30
2007 2008 2009 2010 2011
Fiscal Year
0%
5%
10%
15%
20%
25%
Number of Impressions (in Millions) Percentage of Total Media Coverage
Figure 2.2: Research Coverage
12
Measurement 3: Reasons for Choosing Concordia
NOTE: There are no new data to report this year; data presented are those from Measuring Excellence
2009.
Definition of the Measurement:
Measurement 3 seeks to determine why students choose to attend university and, more importantly, why
they choose to enroll at Concordia. Information was obtained from surveys administered by the
Canadian Undergraduate Survey Consortium (CUSC). This survey runs in a three‐year cycle, with
different student populations targeted each year of the cycle: (1) all undergraduate students, (2) first‐year
undergraduate students, and (3) graduating students. The questions most relevant for tracking purposes
appear in the first‐year student survey, which was conducted in 2001, 2004, and 2007. The questions of
interest are:
How important were the following reasons [nine items listed in 2001, 2004, and 2007] in your decision
to attend university?
How important were the following reasons [23 items listed in 2001, 26 in 2004 and 23 in 2007] in your
choosing this university?
The 2001, 2004, and 2007 data for these questions have been aggregated. The benchmark score is a
weighted average of the scores for Carleton, Concordia, Simon Fraser, Victoria, and York. The results are
weighted because of differences in sample sizes and response rates for each university.
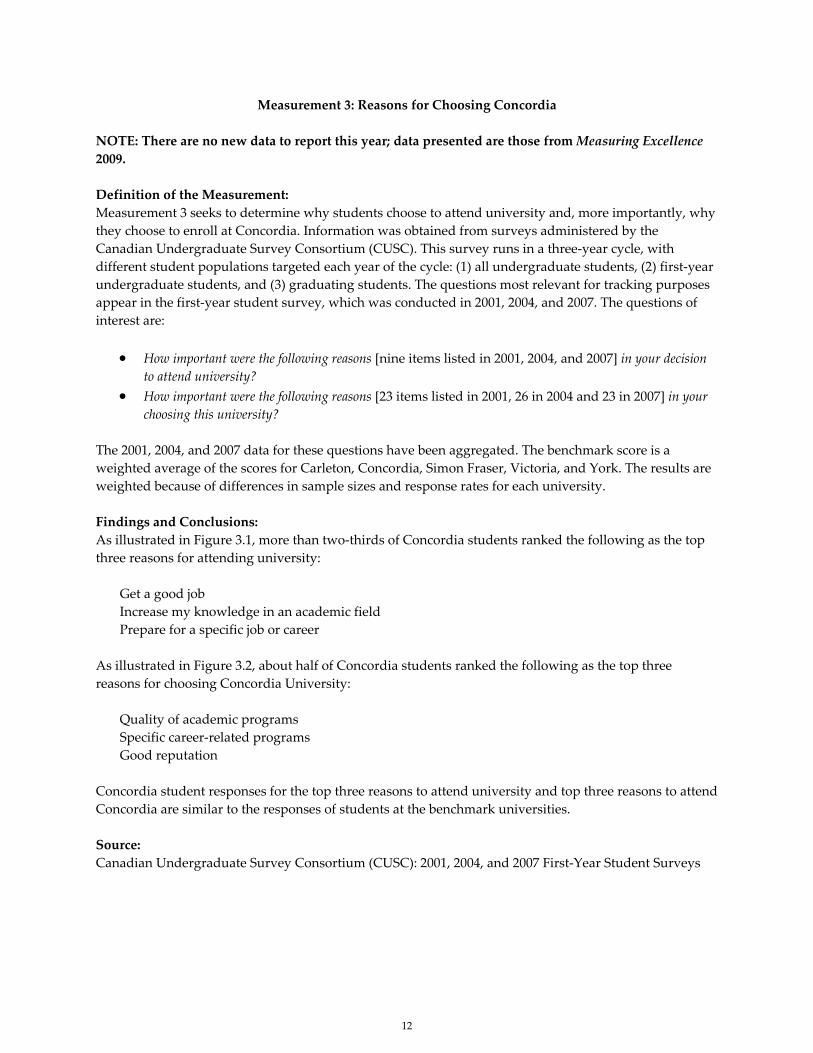
Findings and Conclusions:
As illustrated in Figure 3.1, more than two‐thirds of Concordia students ranked the following as the top
three reasons for attending university:
Get a good job
Increase my knowledge in an academic field
Prepare for a specific job or career
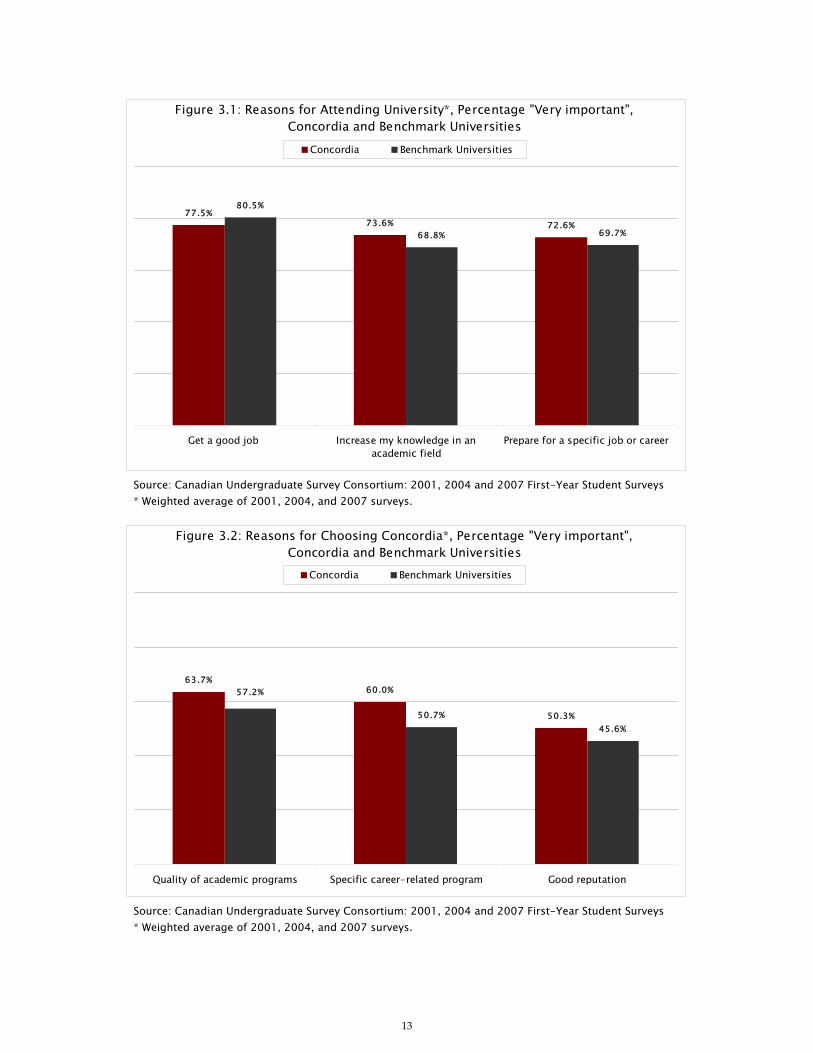
As illustrated in Figure 3.2, about half of Concordia students ranked the following as the top three
reasons for choosing Concordia University:
Quality of academic programs
Specific career‐related programs
Good reputation
Concordia student responses for the top three reasons to attend university and top three reasons to attend
Concordia are similar to the responses of students at the benchmark universities.
Source:
Canadian Undergraduate Survey Consortium (CUSC): 2001, 2004, and 2007 First‐Year Student Surveys
13
Source: Canadian Undergraduate Survey Consortium: 2001, 2004 and 2007 First-Year Student Surveys * Weighted average of 2001, 2004, and 2007 surveys.
Source: Canadian Undergraduate Survey Consortium: 2001, 2004 and 2007 First-Year Student Surveys * Weighted average of 2001, 2004, and 2007 surveys.
73.6% 72.6%
80.5%
68.8% 69.7%
77.5%
Get a good job Increase my knowledge in anacademic field
Prepare for a specific job or career
Concordia Benchmark Universities
Figure 3.1: Reasons for Attending University*, Percentage "Very important", Concordia and Benchmark Universities
63.7%60.0%
50.3%50.7%45.6%
57.2%
Quality of academic programs Specific career-related program Good reputation
Concordia Benchmark Universities
Figure 3.2: Reasons for Choosing Concordia*, Percentage "Very important", Concordia and Benchmark Universities

14
Measurement 4: Net Operating Surplus/Deficit as a Percentage of Operating Revenue
Definition of the Measurement:
This measurement compares Concordia’s annual net operating surplus or deficit with its operating
revenues. The Operating Fund is used to finance the day‐to‐day operating expenditures of Concordia.2
Findings and Conclusions:
Concordia emerged from an operating deficit in the late 1990s, which was largely due to expenditure
reductions imposed by cuts to operating grants from the province. A limited amount of re‐investment
that began in the late 1990s, together with additional funds generated by planned, significant enrolment
increases, allowed Concordia to bank an accumulated surplus for several years.
It is notable that the operating budget was nearly balanced at the end of the 2006/07 fiscal year, as shown
in Figure 4.1; this was due largely to an unanticipated (but non‐recurring) injection of funds from the
province. In May 2007, the Board of Governors approved an operating deficit of $7.3M for the 2007/08
fiscal year; unfortunately, revisions imposed by the Ministry part way through the year resulted in a
reduction of approximately $11M to the amount attributed to the teaching grant (enseignement). This
combined with other factors resulted in a final deficit of over $14M for fiscal 2007/08.
Beginning with the 2009/10 fiscal year, Concordia (and all other Québec universities) retroactively
adopted the recommendations of the Canadian Institute of Chartered Accountants (CICA) and prepared
its financial statements in accordance with Generally Accepted Accounting Principles (GAAP). GAAP
reporting is designed to standardize and simplify reporting for a wide range of corporations,
organizations and institutions, and government. In Concordia’s case, this change required accounting for
employee future benefits as well as accruals for vacations and banked time. This resulted in retroactive
adjustments to surplus and deficit figures beginning with the 2008/09 fiscal year.
Figure 4.2 shows Concordia’s net operating surplus or deficit expressed as a percentage of operating
revenue. The significant decrease in 2009/10 is explained by the introduction of a $16M reserve for
Concordia’s implementation of the Pay Equity Legislation. Without such a reserve the net operating
surplus or deficit expressed as a percentage of operating revenue would have remained stable at 8.2%.
The future situation continues to remain uncertain. The Quebec Government’s March 2011 budget
announced a significant annual increase in tuition fees ($325 annually over 5 years for full‐time students)
beginning in 2012/13. Additionally, the budget included a series of restrictions attached to any new
funding allocated to the university network. At this point, however, there is reason to be optimistic that
these conditions will not adversely affect Concordia’s funding. Nonetheless, there remain some
uncertainties that challenge projection of future budgets:
Interest expense incurred to finance capital projects
Faculty and staff wage settlements
Increased expenses to accommodate increased enrolments
Sources:
Concordia University’s Audited Financial Statements from 2002/03 to 2009/10 fiscal years; prior years
from Financial Services; Bank of Canada (Consumer Price Index)
2 Data shown in the audited financial statements can differ from those appearing in internal financial statements. These differences
are explained by inter‐fund transfers and by funds that have been internally restricted for specific projects and which are considered
as expensed in the internal statements. Thus, the surplus/deficit for any given year may be different on the audited and internal
financial statements. Inter‐fund transfers for this purpose occurred in each of the 2003/04, 2004/05, and 2005/06 fiscal years.

15
Sources (both figures): Concordia University’s Audited Financial Statements from 2002/03 to 2009/10 fiscal years; prior years from Financial Services. Note: Constant dollars were calculated using the May 2010 Consumer Price Index (CPI).
$252.0
$292.9$317.1 $329.6 $333.3 $333.5
$346.2 $350.7$374.6
$389.5
$11.8$28.4
$13.5
($0.8) ($5.6) ($7.5) ($0.3)($14.8)
$33.0$15.9
2000/01 2001/02 2002/03 2003/04 2004/05 2005/06 2006/07 2007/08 2008/09 (GAAP
reporting)
2009/10 (GAAP
reporting)Fiscal year
Operating Revenue Net Excess (deficit) of Revenue over Expenses
Figure 4.1: Operating Revenue and Net Surplus/Deficit (in Millions of Constant 2010 Dollars)
4.7%
9.7%
4.3%
-0.2%
-1.7%-2.2%
-0.1%
-4.2%
8.8%
4.1%
2000/01 2001/02 2002/03 2003/04 2004/05 2005/06 2006/07 2007/08 2008/09 (GAAP
reporting)
2009/10 (GAAP
reporting)Fiscal year
Figure 4.2: Net Operating Surplus/Deficit as a Percentage of Operating Revenue

16
Measurement 5: Annual Level of Donation and Transfers from Concordia University Foundation
Definition of the Measurement:
Measurement 5 provides the total of all donations received with the exception of (1) corporate
sponsorships and (2) student contributions to the last capital (comprehensive) campaign. Additionally, a
“three‐year moving average” plots the average value of the previous three years, inclusive. For example,
the plot for 2002/03 is the average value from 2000/01 through 2002/03; the plot for 2003/04 is the average
value for 2001/02 through 2003/04, and so on. The annual amount of transfers to the University from the
Concordia Foundation is also reported in this measurement.
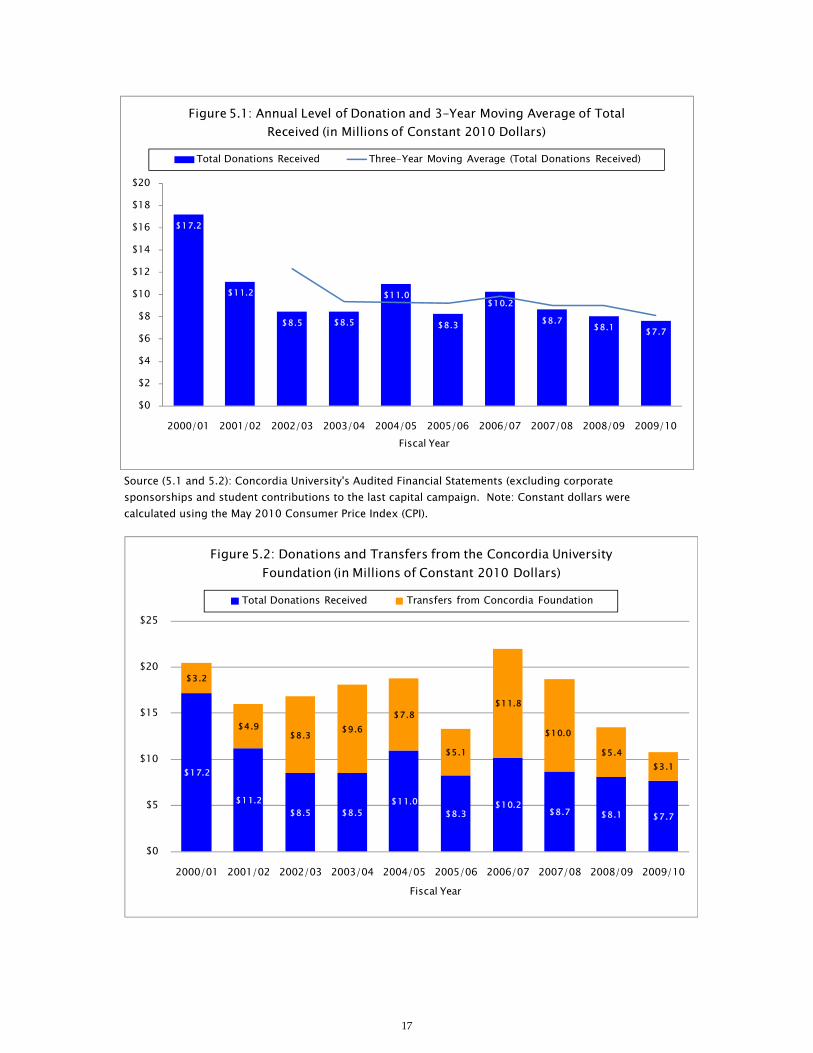
Findings and Conclusions:
When using constant 2010 dollars3, the mean level of donation over the last ten years is $9.9 million
annually. Figure 5.1 shows the level of donation went from a high of $17.2 million in 2000/01 to $7.7
million in 2009/10. Despite the current comprehensive campaign, the three‐year moving average has
become relatively flat as a result of fluctuating levels of donation in recent years.
The considerably higher levels of actual donation up to 2000/01 as shown in Figure 5.1 can be attributed
to payments received in association with Concordia’s last major fund‐raising initiative, Fresh Ideas: The
Campaign for a New Millennium.
Figure 5.2 shows the amounts transferred annually from the Concordia University Foundation (as well as
the annual level of donation). These funds represent income generated by endowments and other
contributions that are managed through the Foundation and made available to the University for items
such as scholarships, fellowships, capital projects, endowed chairs, library acquisitions, etc.
Sources:
Concordia University’s Audited Financial Statements; Bank of Canada (Consumer Price Index)
3 Constant dollars were calculated using the May 2010 Consumer Price Index (CPI).
17
Source (5.1 and 5.2): Concordia University's Audited Financial Statements (excluding corporate sponsorships and student contributions to the last capital campaign. Note: Constant dollars were calculated using the May 2010 Consumer Price Index (CPI).
$17.2
$11.2
$8.5 $8.5
$11.0
$8.3
$10.2
$8.7 $8.1 $7.7
$0
$2
$4
$6
$8
$10
$12
$14
$16
$18
$20
2000/01 2001/02 2002/03 2003/04 2004/05 2005/06 2006/07 2007/08 2008/09 2009/10Fiscal Year
Figure 5.1: Annual Level of Donation and 3-Year Moving Average of Total Received (in Millions of Constant 2010 Dollars)
Total Donations Received Three-Year Moving Average (Total Donations Received)
$17.2
$11.2$8.5 $8.5
$11.0$8.3
$10.2$8.7 $8.1 $7.7
$3.2
$4.9$8.3 $9.6
$7.8
$5.1
$11.8
$10.0
$5.4$3.1
$0
$5
$10
$15
$20
$25
2000/01 2001/02 2002/03 2003/04 2004/05 2005/06 2006/07 2007/08 2008/09 2009/10Fiscal Year
Figure 5.2: Donations and Transfers from the Concordia University Foundation (in Millions of Constant 2010 Dollars)
Total Donations Received Transfers from Concordia Foundation
18
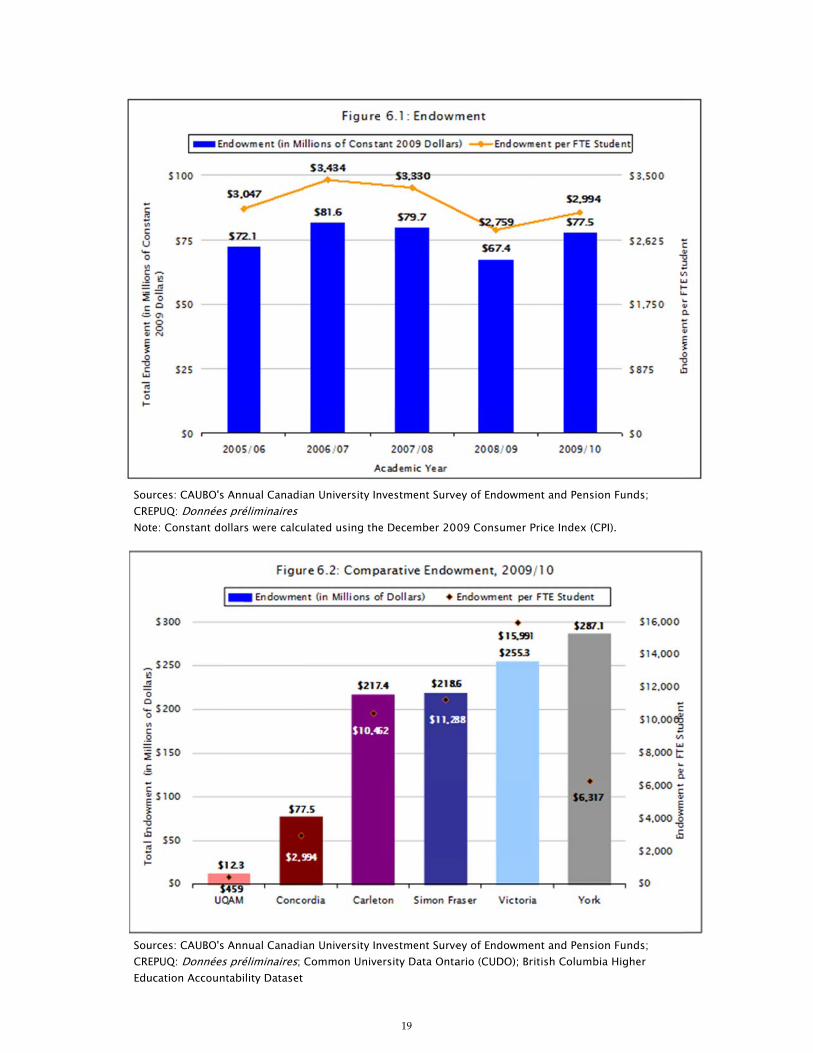
Measurement 6: Endowment per FTE Student
Definition of the Measurement:
Measurement 6 tracks the endowment per full‐time equivalent (FTE) student from 2005/06 to 2009/10,
and compares the most recent data available (2009/10) with the benchmark universities (UQAM,
Carleton, Simon Fraser, Victoria, and York). “Endowment” refers to gifts of money where the capital sum
is to be invested and held in perpetuity, and only a fixed percentage (usually 5%) of the distributed
income is to be spent. This measurement uses data that are reported through the Canadian Association of
University Business Officers’ (CAUBO) annual survey of endowment and pension funds, which tracks
such funds by calendar year, and thus are reported each December.
The basis for calculating FTE students has been harmonized using Statistics Canada methodology and
fall‐semester headcount data obtained from independent sources. Statistics Canada calculates full‐
time equivalence as follows: 1 full‐time student equals 1 FTE and 3.5 part‐time students equal 1 FTE.
This methodology is more favourable for inter‐institutional comparison owing to differences in
definitions and calculation of full‐time equivalency in other institutions and provinces.
Findings and Conclusions:
Using constant 2009 dollars4, Figure 6.1 shows that Concordia’s endowment funds held in perpetuity
have grown at an average rate of 6% per year from 2005/06 to 2009/10, standing last year at $77.5 million,
an increase of 15% or $10.1 million over the previous year. This places Concordia at $2,994 per FTE
student in 2009/10, falling 13% from its five‐year high of $3,434 per FTE student in 2006/07, but increasing
by 9% over the preceding year.
According to CAUBO‐based figures, Figure 6.2 shows that Concordia’s endowment is in a better position
than UQAM, but trails the other benchmark universities by a wide margin. Per FTE, Concordia’s
placement is also better than UQAM, but again lags far behind the other four benchmark universities
with Victoria leading the group.
Sources:
CAUBO’s Annual Canadian University Investment Survey of Endowment and Pension Funds; CREPUQ:
Données préliminaires; Common University Data Ontario (CUDO); British Columbia Higher Education
Accountability Dataset
4 Constant dollars were calculated using the December 2009 Consumer Price Index (CPI).
SouCRENot
SouCREEdu
rces: CAUBO's AEPUQ: Données e: Constant do
rces: CAUBO's AEPUQ: Données cation Account
Annual Canadiapréliminaires llars were calcu
Annual Canadiapréliminaires;
tability Dataset
an University In
ulated using the
an University InCommon Unive
19
nvestment Surve
e December 20
nvestment Surveersity Data Onta
ey of Endowme
09 Consumer P
ey of Endowmeario (CUDO); Br
ent and Pension
Price Index (CPI
ent and Pensionritish Columbia
n Funds;
I).
n Funds; Higher
20
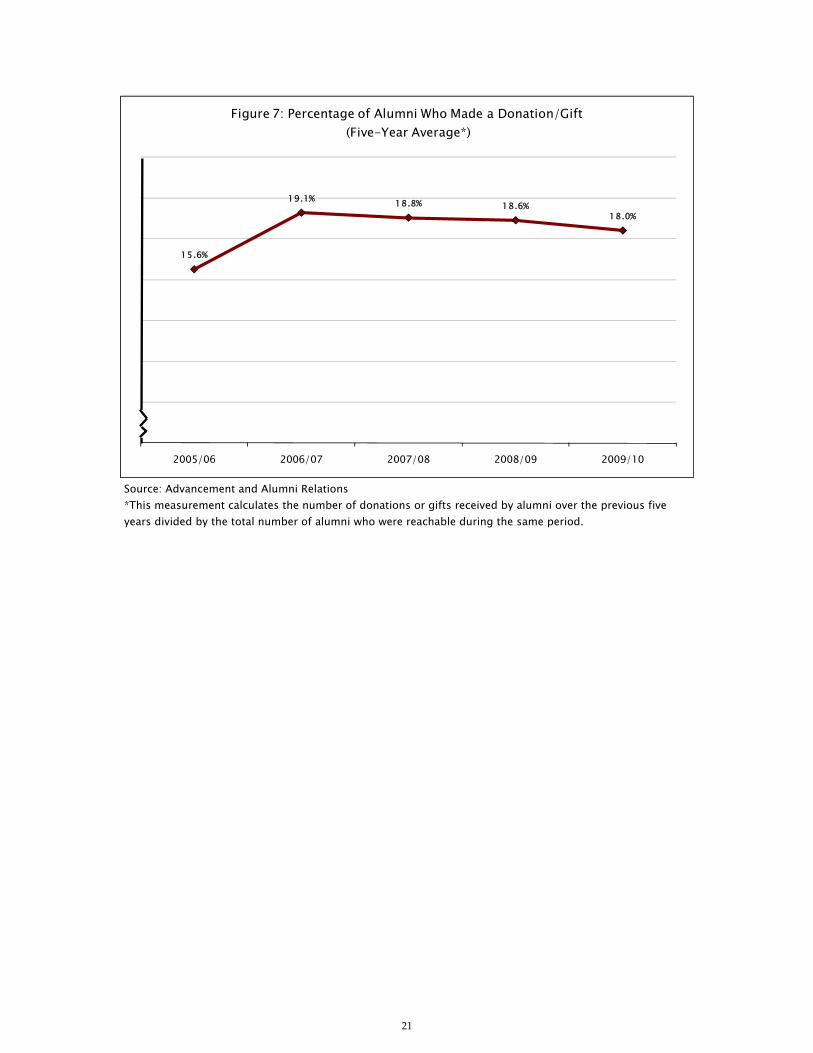
Measurement 7: Percentage of Alumni who are Donors
Definition of the Measurement:
Measurement 7 tracks the percentage of alumni who have made a donation or gift to the
University. The provision of financial support by alumni is a measure of loyalty, ability, and
recognition of the value graduates attribute to their university experience.
For 2009/10, the data consist of the total number of alumni for whom the University had a current address
between May 2005 and May 2010, divided by the total number of alumni who made annual gifts or
comparable financial commitments to the institution or its affiliates during the same time. Each year’s
data represent the same calculation for the applicable five‐year period. Unfortunately, benchmark data
have not been available since 2004/05.
Findings and Conclusions:
Figure 7 shows that the five‐year average proportion of alumni supporting Concordia has been
decreasing slightly every year since peaking at 19% in 2006/07. Despite this, it should be noted that the
number of alumni donors (averaged over five years) has increased by 31% between the period ending
May 2006 and May 2010. Also notable is the fact that on average just over 3 in 4 donors to the University
were members of the alumni.
Source:
Advancement and Alumni Relations
21
Source: Advancement and Alumni Relations *This measurement calculates the number of donations or gifts received by alumni over the previous five years divided by the total number of alumni who were reachable during the same period.
15.6%
19.1% 18.8% 18.6%18.0%
2005/06 2006/07 2007/08 2008/09 2009/10
Figure 7: Percentage of Alumni Who Made a Donation/Gift(Five-Year Average*)

22
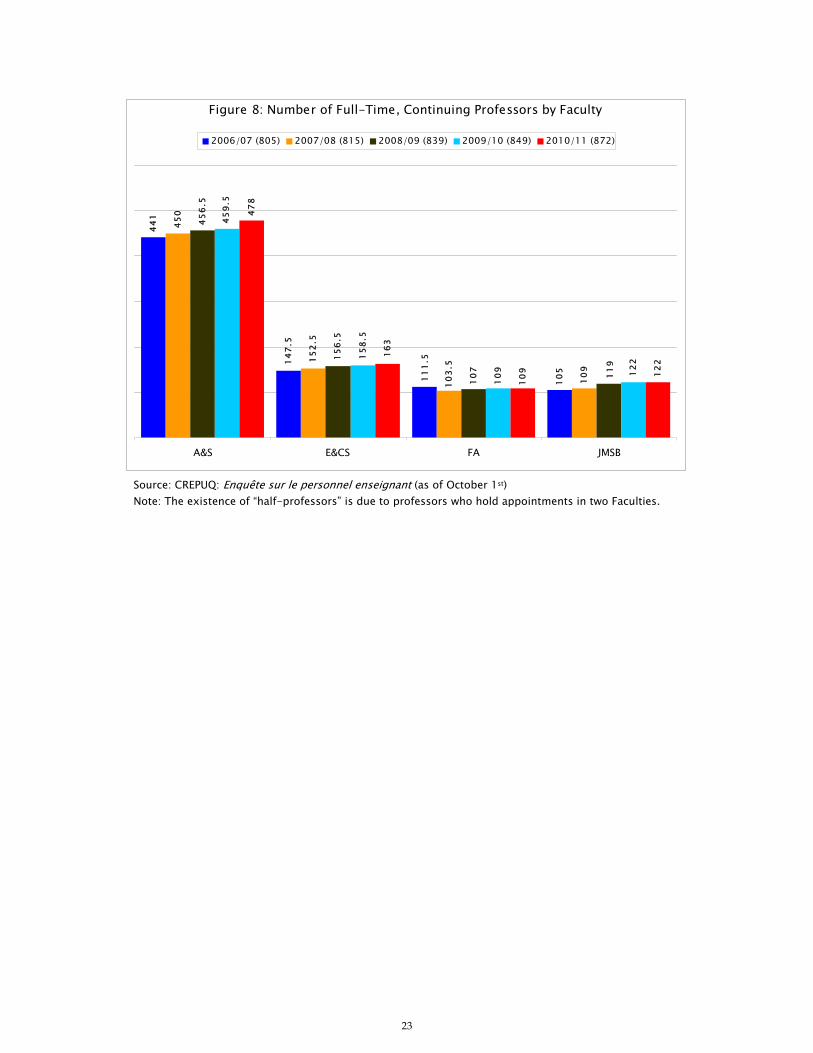
Measurement 8: Full‐Time, Continuing Professors by Faculty
Definition of the Measurement:
Measurement 8 tracks the number of full‐time, continuing professors at Concordia by Faculty for the
2006/07 to 2010/11 academic years. A professor who is hired with tenure, hired into a tenure track, or
hired as an extended‐term appointment is considered a full‐time, continuing professor. Tenured
professors are those who have been granted permanent appointments by Concordia’s Board of
Governors. Tenure‐track professors are those hired on a probationary basis. Most often, these professors
are engaged on a three‐year contract that is renewable once. During the period of the second contract,
these professors are eligible to apply for tenure. Extended‐Term professors are those holding three‐ to
five‐year renewable contracts. A professor is included in this measurement if he or she held an academic
appointment in a specified position as of the government reporting date of October 1st. Other full‐time
professors, such as those holding visiting, research, or limited‐term appointments (9½ to 36 months), are
excluded.
Numbers vary from one year to another for various reasons such as new hiring, retirements, deaths, and
departures.
Findings and Conclusions:
Figure 8 shows the total number of full‐time, continuing professors from 2006/07 to 2010/11 for each
Faculty. Over the past five years, Concordia’s number of full‐time, continuing professors has increased by
67 or 8.3%.
By Faculty, JMSB had the largest percentage increase of full‐time, continuing professors over five years
(16.2%) representing 17 additional professors, followed by E&CS (10.5%) representing 15.5 professors,
and then by A&S (8.4%) representing 37 professors. FA had a small decrease (‐2.2%) of 2.5 professors.
It should be noted that “half‐professors” are those who hold appointments in two Faculties.
Source:
CREPUQ: Enquête sur le personnel enseignant (as of October 1st)
23
Source: CREPUQ: Enquête sur le personnel enseignant (as of October 1st) Note: The existence of “half-professors” is due to professors who hold appointments in two Faculties.
105
111.
5147.
5
441
109
103.
5152.
5
450
119
107
156.
5
456.
5
122
109
158.
5
459.
5
122
109
163
478
A&S E&CS FA JMSB
2006/07 (805) 2007/08 (815) 2008/09 (839) 2009/10 (849) 2010/11 (872)
Figure 8: Number of Full-Time, Continuing Professors by Faculty
24
Measurement 9: Tenured and Tenure‐Track Professor Retention Rate
Definition of the Measurement:
Measurement 9 tracks tenured and tenure‐track professors over four sets of ten‐year periods. Tenured
professors are those who have been granted permanent appointments by Concordia’s Board of
Governors. Tenure‐track professors are those hired on a probationary basis. Most often, these professors
are engaged on a three‐year contract that is renewable once. During the period of the second contract,
tenure‐track professors are eligible to apply for tenure.
Professors leave Concordia for many reasons. This measurement tracks those who leave for any reason,
which can include termination, non‐renewal, or death.
Retention rates are calculated as the percentage of tenured and tenure‐track professors hired into a ten‐
year cohort who have remained at Concordia. Academic year 2010/11 data remain preliminary (as of June
2011).
Findings and Conclusions:
Figure 9 shows tenured and tenure‐track professor retention rates over four sets of ten‐year cohorts. The
results indicate an increase in the retention rate of the most recent cohort, where 413 of 491 professors
hired between academic year 2001/02 and 2010/11 are still with the University (84.1%). Over the 17 years
targeted in this measurement, the average retention rate of single academic year cohorts is 74.9%, while
the median stands at 73.3%.
Sources:
Concordia University’s Human Resources Information System (HRIS); Academic Administration

25
Sources: Concordia University's Human Resources Information System (HRIS); Academic Administration
506 525491
418 436 423
508
413
82.6% 83.0% 83.3% 84.1%
0
100
200
300
400
500
600
700
800
1998/99 to 2007/08 1999/00 to 2008/09 2000/01 to 2009/10 2001/02 to 2010/11Academic Years
0%
25%
50%
75%
100%
Hired Stayed Retention Rate
Figure 9: Tenured and Tenure-Track Professor Hiring and Retention Rates(Ten-Year Cohorts)

26
Measurement 10: FTE Students per Full‐Time, Continuing Professor
Definition of the Measurement:
Measurement 10 tracks Concordia’s progress toward lowering its full‐time equivalent (FTE) students to
full‐time, continuing professor ratio. For this measurement, Concordia will be compared with UQAM,
Carleton, Simon Fraser, Victoria, and York. Benchmark data are provided by the Canadian Association of
University Teachers (CAUT). CAUT uses Statistics Canada data along with federal government
definitions for FTE students and full‐time faculty. Caution should be taken when comparing FTE students to
full‐time faculty ratios from different institutions since universities may have reported data to Statistics Canada
using different definitions for FTE students and for full‐time faculty as published in the CAUT Almanac.
The basis for calculating FTE students has been harmonized using Statistics Canada methodology and
fall‐semester headcount data obtained from independent sources. Statistics Canada calculates full‐
time equivalence as follows: 1 full‐time student equals 1 FTE and 3.5 part‐time students equal 1 FTE.
This methodology is more favourable for inter‐institutional comparison owing to differences in
definitions and calculation of full‐time equivalency in other institutions and provinces.
Findings and Conclusions:
Figure 10.1 shows Concordia’s ratio of FTE students per full‐time, continuing professor had been on a
slight, steady decline from 2005/06 to 2008/09, but increased in 2009/10 to 30.5. This is considerably higher
than 22, where it stood in 1995/96.
For benchmarking, Figure 10.2 shows the ratio of FTE students to full‐time faculty in 2007/08 (most recent
data available). Concordia appears to be in a relatively good position trailing only Victoria and Simon
Fraser; moreover, Concordia’s ratio is slightly better than the average for all benchmark institutions.
Sources:
IPO’s working file5 for CREPUQ: Enquête sur le personnel enseignant (as of October 1st); Canadian Association of University Teachers (CAUT): Almanac of Post‐Secondary Education 2010; CREPUQ:
Données préliminaires
5 IPO’s working file is used because it indicates the tenure status of the professor. The tenure status field is not transmitted to the
CREPUQ.

27
Sources: IPO’s working file for CREPUQ: Enquête sur le personnel enseignant (as of October 1st); CREPUQ: Données préliminaires
Source: CAUT: Almanac of Post-Secondary Education, 2010 Note: Institution figures include Faculty and enrolment counts in all affiliated colleges.
30.129.5 29.4 29.1
30.5
2005/06 2006/07 2007/08 2008/09 2009/10
Academic Year
Figure 10.1: Number of FTE Students per Full-Time, Continuing Professor
32.930.3
28.6
22.8 22.4
27.3
York Carleton UQAM Concordia Simon Fraser Victoria
Figure 10.2: Comparative Number of FTE Students per Full-Time Professor, 2007/08
Benchmark Average = 27.4
28
Measurement 11: Full‐Time Permanent Administrative and Support Staff per Full‐Time, Continuing
Professor
Definition of the Measurement:
Measurement 11 tracks Concordia’s progress toward ensuring an appropriate number of full‐time
permanent administrative and support staff per full‐time, continuing professor. Appropriate support to
professors allows them to function better in their teaching, research, and service roles and enhances
Concordia’s ability to retain them.
Full‐time permanent administrative and support staff include all people in payroll groups that are
permanent or on contracts that are deemed permanent. A professor who is hired with tenure, hired into a
tenure track, or hired as an extended‐term appointment is considered a full‐time, continuing professor.
Although benchmarking for this measurement is not available this year, progress will be made toward
finding comparative data in the future. Benchmarking for this measurement proves difficult to obtain
because of the lack of a common source for administrative and support staff data and/or different
universities’ definitions for measuring professor and staff numbers.
Findings and Conclusions:
Figure 11 shows that Concordia’s ratio of full‐time permanent administrative and support staff per full‐
time, continuing professor remained relatively steady since 2006/07. The ratio for 2010/11 is 1.8 (which is
also the average for the past five years).
Sources:
Concordia University’s Data Warehouse; IPO’s working file6 for CREPUQ: Enquête sur le personnel
enseignant (as of October 1st)
6 IPO’s working file is used because it indicates the tenure status of the professor. The tenure status field is not transmitted to the
CREPUQ.

29
Sources: Concordia University’s Data Warehouse; IPO’s working file for CREPUQ: Enquête sur le personnel enseignant (as of October 1st)
1,3771,462 1,492 1,531 1,535
872805 815 839 849
1.71.8 1.8 1.8 1.8
0
200
400
600
800
1,000
1,200
1,400
1,600
1,800
2006/07 2007/08 2008/09 2009/10 2010/11Academic Year
Num
ber
0.0
0.5
1.0
1.5
2.0
2.5
3.0
Ratio
Full-Time, Continuing Professors Administrative and support staff Ratio
Figure 11: Full-Time Permanent Administrative and Support Staff per Full-Time, Continuing Professor
30
Measurement 12: Faculty/Staff Satisfaction
Note: There are no new data to report this year; data presented are those from the Measuring Excellence
2007.
Definition of the Measurement:
Measurement 12 seeks to determine the level of satisfaction with Concordia among faculty and staff.
Concordia’s Reputation Survey is being employed as an interim measure since currently there is no direct
measure of employee satisfaction at Concordia. The Reputation Survey was designed to obtain
perceptions of Concordia’s reputation and image. Several questions are identified as potentially relating
to faculty/staff satisfaction. These questions are:
I would have no hesitation recommending Concordia to family or friends, as a place to work.
Being employed at Concordia allows me to have a better work/personal life balance than if I worked for a
different employer.
To what extent does each of the following words or phrases [a list of 13] describe the overall work
culture/environment at Concordia?
It should be noted that without questions directly asking about “satisfaction”, it is not possible to know
the actual relationship of these questions to faculty/staff satisfaction at Concordia.
In the calculation of percentages, respondents indicating “don’t know” are included and missing values
are excluded, whereas in the correlation analyses, both “don’t know” responses and missing values are
excluded. A missing value indicates that no data are available for a variable for that particular
observation.
Findings and Conclusions:
The overall response rate to the survey was 33% with 456 staff and 319 faculty participating. The overall
margin of error was ± 2.9% and by group it was ± 4.6% for staff and ± 5.5% for faculty. Note that margins
of error for faculty and staff were calculated using a formula based on the number of respondents only.
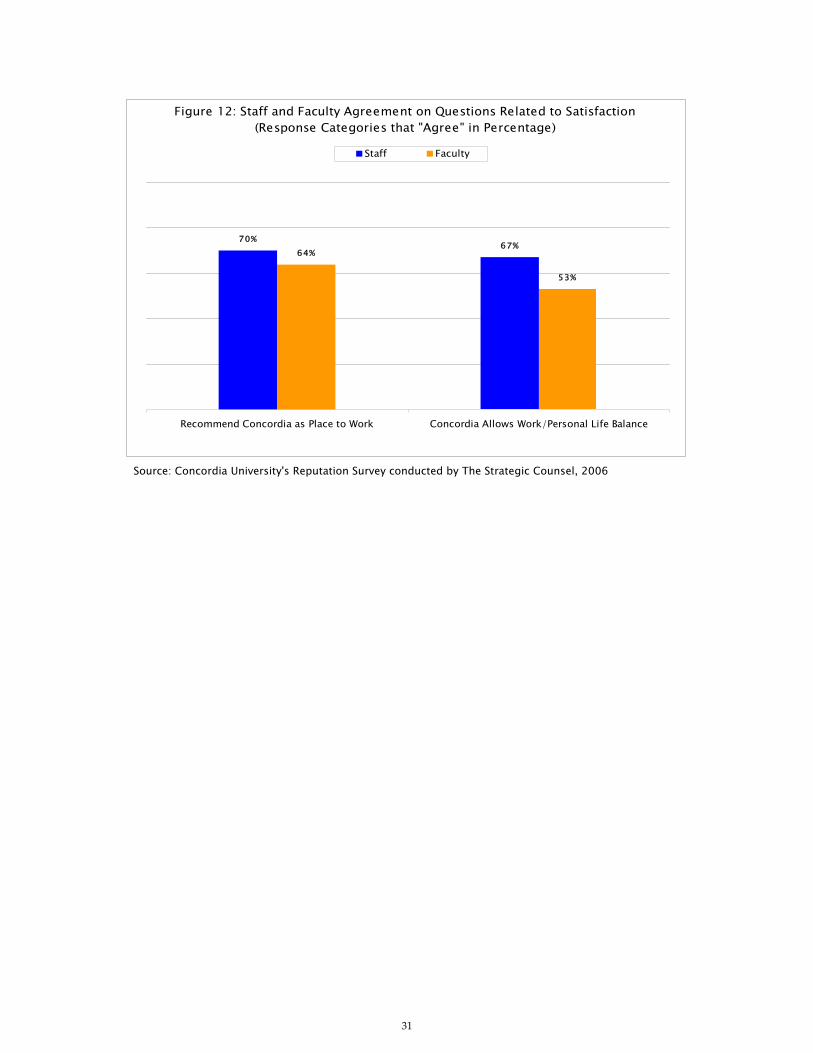
Figure 12 shows that a majority of staff and faculty agreed (top three of seven response choices
combined) with the statement recommending Concordia as a place to work, and strong agreement was close
to a third for staff (28%) and one‐quarter (22%) for faculty. Two‐thirds of staff and about half of faculty
agreed that Concordia allows a better work/life balance than that offered by other employers.
From the correlation analysis, staff who agreed with the statement recommending Concordia as a place to
work were also more likely to describe the overall work culture/environment at Concordia as: (1)
Supportive; (2) Respectful; (3) Fair; (4) Progressive; and (5) Responsive. Faculty who agreed with the
statement recommending Concordia as a place to work were more likely to describe Concordia’s work
environment as: (1) Supportive; (2) Collaborative; (3) Exciting; (4) Respectful; and (5) Fair, with Creative,
Responsive and Innovative very close behind. Staff who agreed with the statement Concordia allows a
better work/life balance described their work environment at Concordia as: (1) Respectful; (2) Flexible; (3)
Supportive; (4) Fair; and (5) Responsive. Finally, faculty who agreed with the same question on work/life
balance at Concordia were more likely to describe Concordia’s work environment as: (1) Supportive; (2)
Exciting; (3) Collaborative; (4) Flexible; and (5) Creative.
Source:
Concordia Reputation Survey conducted by The Strategic Counsel, 2006
31
Source: Concordia University's Reputation Survey conducted by The Strategic Counsel, 2006
70%67%
64%
53%
Recommend Concordia as Place to Work Concordia Allows Work/Personal Life Balance
Staff Faculty
Figure 12: Staff and Faculty Agreement on Questions Related to Satisfaction(Response Categories that "Agree" in Percentage)
32
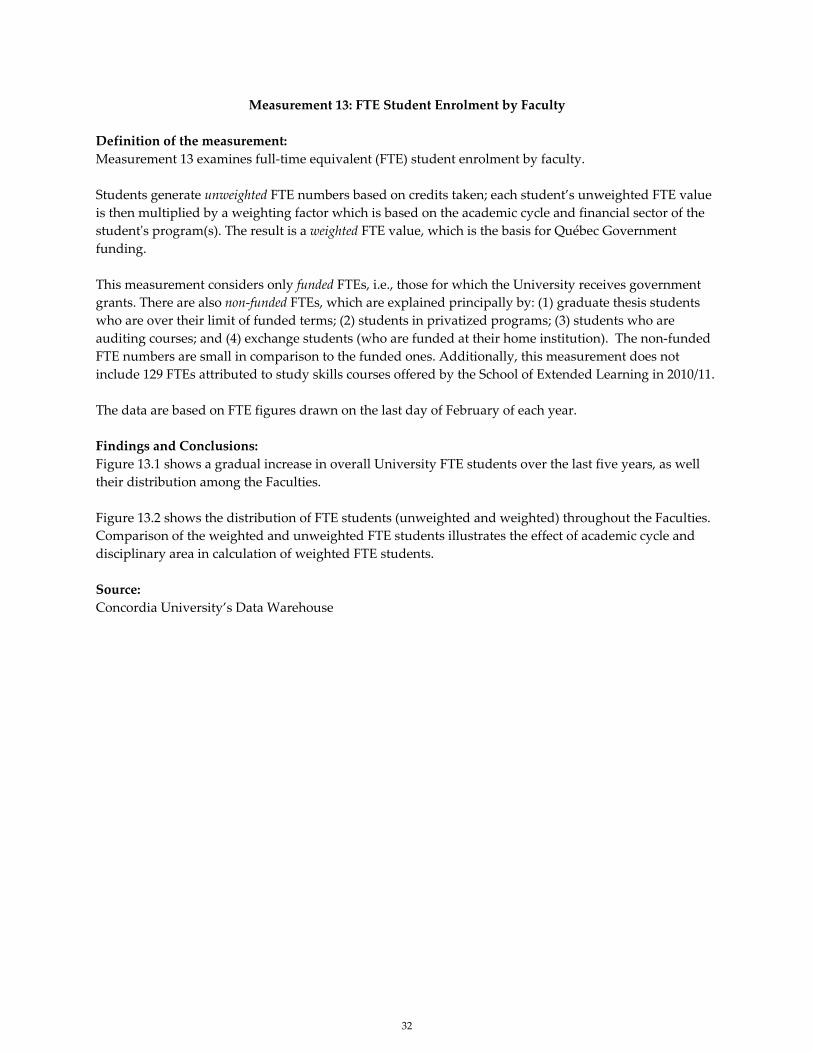
Measurement 13: FTE Student Enrolment by Faculty
Definition of the measurement:
Measurement 13 examines full‐time equivalent (FTE) student enrolment by faculty.
Students generate unweighted FTE numbers based on credits taken; each student’s unweighted FTE value
is then multiplied by a weighting factor which is based on the academic cycle and financial sector of the
studentʹs program(s). The result is a weighted FTE value, which is the basis for Québec Government
funding.
This measurement considers only funded FTEs, i.e., those for which the University receives government
grants. There are also non‐funded FTEs, which are explained principally by: (1) graduate thesis students
who are over their limit of funded terms; (2) students in privatized programs; (3) students who are
auditing courses; and (4) exchange students (who are funded at their home institution). The non‐funded
FTE numbers are small in comparison to the funded ones. Additionally, this measurement does not
include 129 FTEs attributed to study skills courses offered by the School of Extended Learning in 2010/11.
The data are based on FTE figures drawn on the last day of February of each year.
Findings and Conclusions:
Figure 13.1 shows a gradual increase in overall University FTE students over the last five years, as well
their distribution among the Faculties.
Figure 13.2 shows the distribution of FTE students (unweighted and weighted) throughout the Faculties.
Comparison of the weighted and unweighted FTE students illustrates the effect of academic cycle and
disciplinary area in calculation of weighted FTE students.
Source:
Concordia University’s Data Warehouse
Sourc*This Learn
Sourc*This Learn
ce: Concordia Umeasurement ing in 2010/11
ce: Concordia Umeasurement ing in 2010/11
University's Datdoes not includ.
niversity's Datadoes not includ.
a Warehouse. de 129 FTEs att
a Warehouse. de 129 FTEs att
33
tributed to stud
tributed to stud
dy skills course
dy skills course
s offered by th
s offered by th
e School of Ext
e School of Ext
tended
tended
34
Measurement 14: Undergraduate Acceptance Rate (Acceptances to Applications)
Definition of the Measurement:
Measurement 14 tracks undergraduate applications (by first, second, and third choice) in relation to the
number of acceptances, i.e., the percentage of applicants who are accepted. Additionally, it compares the
undergraduate student acceptance rate by Faculty (first choice only) by student source of application
(CEGEP, other Canadian, or international). It should be noted that “other Canadian” includes not only
students from other provinces, but also Québec students who enter without the usual CEGEP credentials
(e.g., mature students and transfers from other universities).
Applicants to undergraduate studies may list up to three program choices (degree and concentration,
e.g., first choice: Bachelor of Science, Major Biology, second choice: Bachelor of Commerce, Major
Accountancy, etc.) on a single application; students who are not admitted to their first choice are
automatically considered for their second and so on. Choices are not limited to a single Faculty.
As graduate student data become available, this measurement will also track the acceptance rate for
graduate students. Eventually, comparable benchmarking data to measure performance relative to other
institutions will be provided.
Findings and Conclusions:
Overall, the acceptance rate has remained relatively constant since 2006/07, averaging 28.2% for all
Faculties and all choices. As shown in Figure 14.1, the acceptance rates by first, second, and third choices
have been relatively stable for the University as a whole and were markedly better for first‐choice
applicants (averaging 47.8%).
Considering first‐choice applicants only, Figure 14.2 shows that acceptance rates are much higher on
average for CEGEP students compared to other Canadian and international applicants. Nonetheless,
these rates vary greatly between the four Faculties; for example, E&CS accepted 86.2% of CEGEP
applicants compared to 48.2% by FA.
Source:
Concordia University’s Portal: Undergraduate Admission Main Report

35
Source: Concordia University's Portal: Undergraduate Admission Main Report *The number of acceptances divided by the number of applications.
Source: Concordia University's Portal: Undergraduate Admission Main Report *The number of acceptances divided by the number of applications.
47.5% 47.4% 46.5%49.5% 48.2%
13.8% 12.4% 14.0% 13.3% 13.1%13.7% 14.5% 13.7% 12.8% 13.8%
2006-07 2007-08 2008-09 2009-10 2010-11Academic Year
First Choice Second Choice Third Choice
Figure 14.1: Undergraduate Students Acceptance Rate* by Choice
64.6%67.8%
86.2%
48.2%
56.1%
42.2% 44.3%
52.3%
39.2%35.1%33.8%
38.8%42.8%
24.1%26.8%
Concordia Total A&S E&CS FA JMSB
CEGEP Other Canadian International
Figure 14.2: Undergraduate Students Acceptance Rate* by Faculty and Student Source, First Choice Only, Five-Year Average (2006/07 - 2010/11)
36
Measurement 15: Undergraduate Registration Rate (Registrations to Acceptances)
Definition of the Measurement:
Measurement 15 tracks undergraduate acceptances (by first, second, and third choice) in relation to the
number of registrations, i.e., the percentage of accepted applicants who actually register for classes.
Additionally, it compares the undergraduate student registration rate by Faculty (first choice only) by
student source of application (CEGEP, other Canadian, or international). It should be noted that “other
Canadian” includes not only students from other provinces, but also Québec students who enter without
the usual CEGEP credentials (e.g., mature students and transfers from other universities).
Applicants to undergraduate studies may list up to three program choices (degree and concentration,
e.g., first choice: Bachelor of Science, Major Biology, second choice: Bachelor of Commerce, Major
Accountancy, etc.) on a single application; students who are not admitted to their first choice are
automatically considered for their second and so on. Choices are not limited to a single Faculty. A high
registration rate implies that there is a good match between candidates who are offered admission and
those who ultimately decide to register.
As graduate student data become available, this measurement will also track registration rates for
graduate students. Eventually, comparable benchmarking data to measure performance relative to other
institutions will be provided.
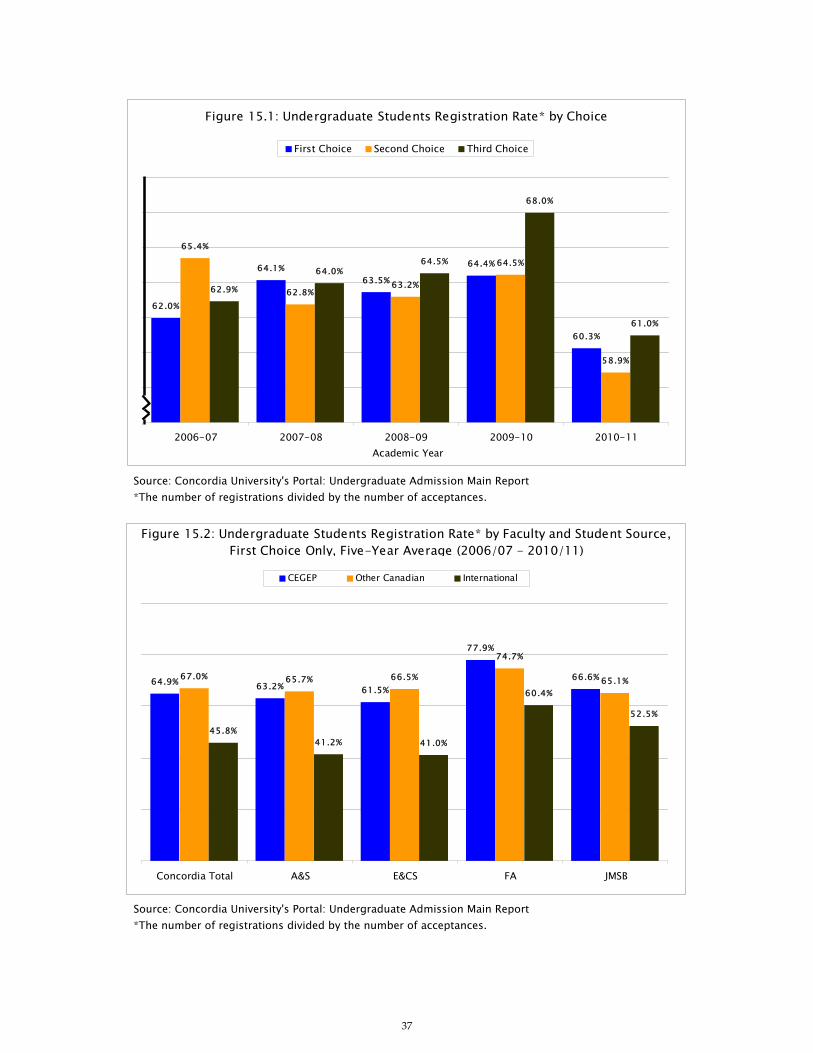
Findings and Conclusions:
Overall, the proportion of admitted students who registered at Concordia has decreased slightly when
considering all Faculties and all choices, from 62.6% in 2006/07 to 60.1% in 2010/11. As shown in Figure
15.1, the registration of first choice applicants over the past five years showed an increasing trend but
declined in 2010/11.
A focus on first‐choice admitted students (Figure 15.2) shows that registration rates by Faculty are much
higher in FA compared to the other Faculties for all student sources (CEGEP, other Canadian, and
international). This indicates that students who have been accepted to FA see this Faculty as their
primary option, while those admitted to other Faculties may have other programs under consideration.
It is interesting to note the somewhat lower registration rate for international students compared to
students entering from CEGEP or other Canadian sources. The underlying reasons for this discrepancy
should be investigated further since a great deal more effort is required in the evaluation and admission
of students from abroad.
Source:
Concordia University’s Portal: Undergraduate Admission Main Report
37
Source: Concordia University's Portal: Undergraduate Admission Main Report *The number of registrations divided by the number of acceptances.
Source: Concordia University's Portal: Undergraduate Admission Main Report *The number of registrations divided by the number of acceptances.
62.0%
64.1%63.5%
64.4%
60.3%
65.4%
62.8%63.2%
64.5%
58.9%
62.9%
64.0%64.5%
68.0%
61.0%
2006-07 2007-08 2008-09 2009-10 2010-11Academic Year
First Choice Second Choice Third Choice
Figure 15.1: Undergraduate Students Registration Rate* by Choice
64.9% 63.2% 61.5%
77.9%
66.6%67.0% 65.7% 66.5%
74.7%
65.1%
45.8%41.2% 41.0%
60.4%
52.5%
Concordia Total A&S E&CS FA JMSB
CEGEP Other Canadian International
Figure 15.2: Undergraduate Students Registration Rate* by Faculty and Student Source, First Choice Only, Five-Year Average (2006/07 - 2010/11)
38
Measurement 16: FTE Graduate Student to Undergraduate Student Ratio
Definition of the Measurement:
This measurement shows the ratio between full‐time equivalent (FTE) graduate and undergraduate
students for Concordia and the benchmark universities (UQAM, Carleton, Simon Fraser, Victoria, and
York).
The basis for calculating FTE students has been harmonized using Statistics Canada methodology and
fall‐semester headcount data obtained from independent sources. Statistics Canada calculates full‐time
equivalence as follows: 1 full‐time student equals 1 FTE and 3.5 part‐time students equal 1 FTE. This
methodology is more favourable for inter‐institutional comparison owing to differences in definitions
and calculation of full‐time equivalency in other institutions and provinces.
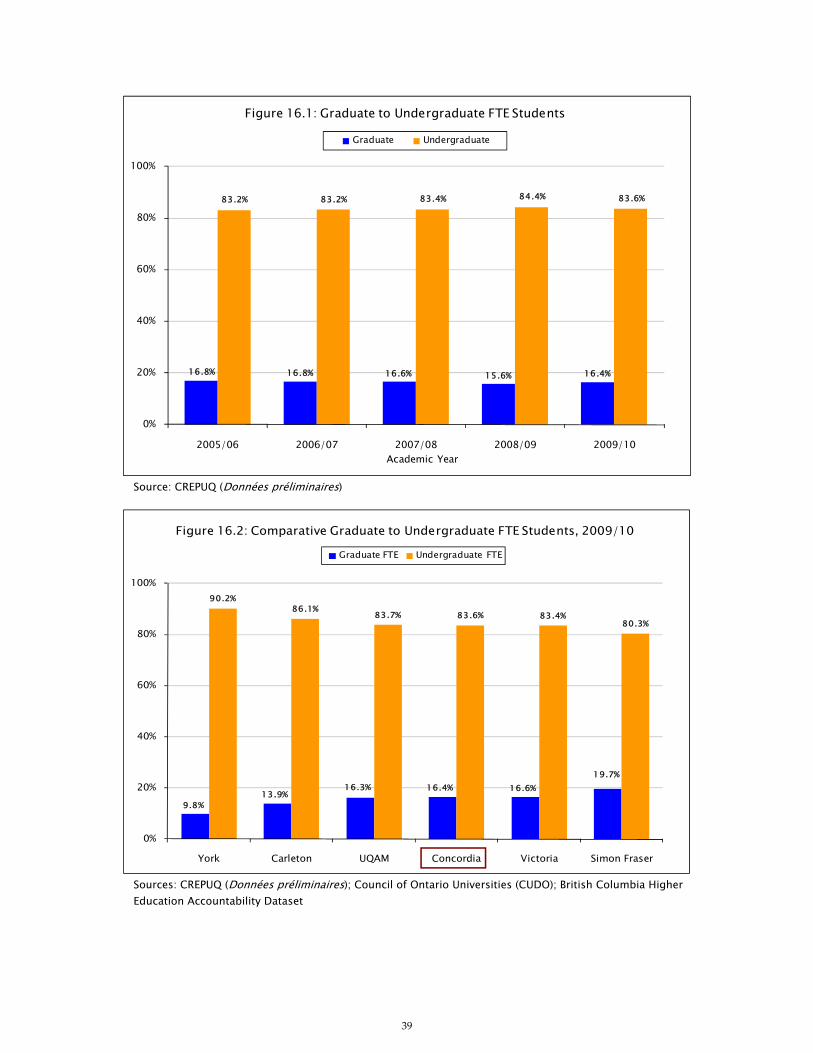
Findings and Conclusions:
Figure 16.1 shows that Concordia’s proportion of graduate to undergraduate FTE students had been
relatively stable, decreasing in 2008/09, while increasing again in 2009/10. Figure 16.2 compares the
proportion of graduate to undergraduate FTE students at Concordia and the benchmark universities for
the 2009/10 academic year. The data show that Concordia has fewer FTE graduate students
proportionally (16.4%) than Simon Fraser and Victoria, (ranging from 16.6% to 19.7%) but still more than
York, Carleton, and UQAM.
Although all institutions have enrolled increased numbers of graduate students over the past few years,
the overall proportions have changed very little because total enrolments have also been increasing,
particularly since the middle of the last decade.
Sources:
CREPUQ (Données préliminaires); Council of Ontario Universities (CUDO); British Columbia Higher
Education Accountability Dataset
39
Source: CREPUQ (Données préliminaires)
Sources: CREPUQ (Données préliminaires); Council of Ontario Universities (CUDO); British Columbia Higher Education Accountability Dataset
16.8% 16.8% 16.6% 15.6% 16.4%
83.2% 83.2% 83.4% 84.4% 83.6%
0%
20%
40%
60%
80%
100%
2005/06 2006/07 2007/08 2008/09 2009/10Academic Year
Graduate Undergraduate
Figure 16.1: Graduate to Undergraduate FTE Students
9.8%13.9%
16.3% 16.4% 16.6%19.7%
90.2%86.1% 83.7% 83.6% 83.4%
80.3%
0%
20%
40%
60%
80%
100%
York Carleton UQAM Concordia Victoria Simon Fraser
Graduate FTE Undergraduate FTE
Figure 16.2: Comparative Graduate to Undergraduate FTE Students, 2009/10

40
Measurement 17: Funding for Graduate Students
Definition of the Measurement:
Measurement 17 tracks the total scholarships and fellowships awarded to graduate students from both
internal and external sources in terms of total dollars7 awarded, number of awards, and total dollars
available per FTE graduate student from 2006/07 to 2010/11. Additionally, it compares the most recent
data available (2009/10) with the benchmark universities (UQAM, Carleton, Simon Fraser, and York); the
University of Victoria considers these data to be proprietary and does not publish them.
Concordia’s internally sourced awards include fellowships and scholarships such as the Women’s
Entrance Scholarship and awards from the McConnell Endowment. External source awards include those
from a variety of federal and provincial government agencies (e.g., Natural Sciences and Engineering
Research Council (NSERC), Fonds québécois de la recherche sur la société et la culture (FQRSC), Social Sciences
and Humanities Research Council (SSHRC)).
Each institution has its own internal sources of funding; graduate students, however, compete for the
same sources of external support from the federal government (e.g., NSERC, SSHRC). There are unique
funding sources in most provinces, but these awards are only available to students enrolled in
institutions in that province (e.g., Ontario Graduate Scholarships, FQRSC in Québec).
Tuition fee remissions for international graduate students are not included in this measurement.
Findings and Conclusions:
Although progress has been made over the past five years in increasing the number and magnitude of
graduate‐level scholarships (Figure 17.1), much remains to be done if Concordia is to be competitive with
other institutions.
Figure 17.2 shows that Concordia lags behind the benchmark institutions; the fewer number of awards
available is considered by many to be a significant handicap in terms of attracting and retaining graduate
students.
Sources:
Concordia University’s Graduate Awards Office; Carleton University Data Book; Bourses d’Excellence
Année universitaire 2009/10 (UQAM); Simon Fraser University, Institutional Research and Planning Office;
York University Factbook 2009/10; FTE data from: CREPUQ (Données préliminaires); Council of Ontario
Universities (CUDO); British Columbia Higher Education Accountability Dataset
7 Constant dollars were calculated using the February 2011 Consumer Price Index (CPI).

41
Sources: Concordia University's Graduate Awards Office, FTE data from: CREPUQ (Données préliminaires). Note: Constant dollars were calculated using the February 2011 Consumer Price Index (CPI)
Sources: Concordia University's Graduate Awards Office; Carleton University Data Book; Bourses d’Excellence Année universitaire 2009/10 (UQAM); Simon Fraser University, Institutional Research and Planning Office; York University Factbook 2009/10; FTE data from: CREPUQ (Données préliminaires); Council of Ontario Universities (CUDO); British Columbia Higher Education Accountability Dataset. *Simon Fraser’s number of awards was not available.
$5.43$5.87
$7.65 $8.82 $9.15
661 726885 902
1,077
$1,357$1,478
$2,003$2,074 $2,074
0
500
1,000
1,500
2,000
2,500
3,000
$0
$2
$4
$6
$8
$10
$12
2006/07 2007/08 2008/09 2009/10 2010/11
Mill
ions
of C
onst
ant 2
011
Dolla
rs
Academic Year
Total $ Awarded (in Constant 2011 Dollars)Number of Awards$ per Graduate FTE
Figure 17.1: Dollars Awarded and Number of Awards for Graduate Students
$8.7 $13.9 $18.1 $21.8 $26.8
902 979
2,070
4,348
$2,040
$3,175
$6,283
$4,880
$7,048
0
1,000
2,000
3,000
4,000
5,000
6,000
7,000
8,000
$0
$5
$10
$15
$20
$25
$30
$35
$40
Concordia UQAM Carleton York Simon Fraser*
Mill
ions
of D
olla
rs
Total Dollars Awarded (in Millions) Number of Awards Amount per FTE Graduate Student
Figure 17.2: Comparative Dollars Awarded and Number of Awardsfor Graduate Students (2009/10)
42
Measurement 18: E‐Learning
Definitions of the Measurement:
E‐Learning can be broadly understood as computer‐enhanced learning. Measurement 18 tracks the
number of courses and the number of enrolments in courses that are ‘web‐based’ (offered via the
internet), rather than taught in a classroom.
There are two systems in use at Concordia to deliver electronic content: Moodle and FirstClass. They are
used not only in web‐based courses but also in many classroom‐based courses.
Findings and Conclusions:
Figure 18 shows that the number of web‐based courses and enrolments continues to climb, with 148
courses offered in 2010/11. Enrolments have increased almost tenfold compared to 2003.
In parallel with the growth of web‐based courses, there has also been pronounced growth in the use of
instructional technology in traditional courses. Between the 2005 and 2009 fall terms, use of Moodle
increased from 350 course sites to almost 1,450; however, it decreased to 1,115 in fall 2010. JMSB’s
FirstClass system is used in roughly 80% of classes in that Faculty. These figures include both web‐based
and traditional classes.
Sources:
Concordia University’s Data Warehouse; Instructional and Information Technology Services

Sou
rces: Concordiaa University's D
Data Warehouse
43
e; Instructional and Informatioon Technology SServices
44
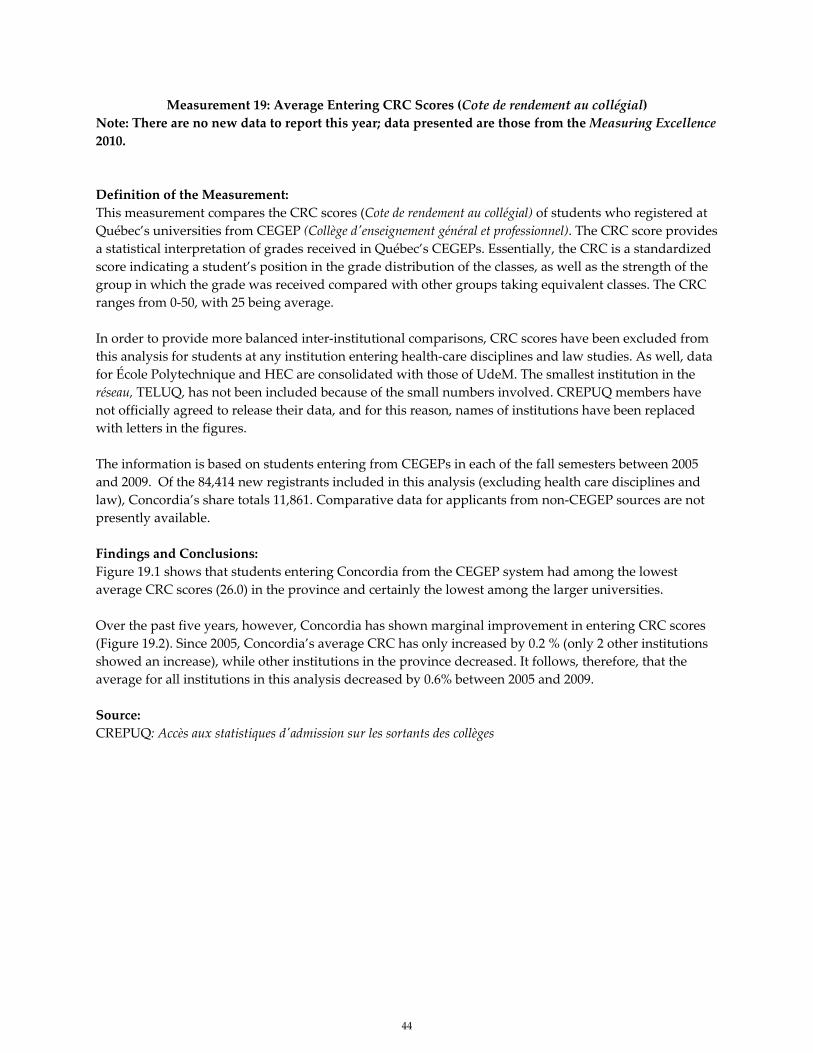
Measurement 19: Average Entering CRC Scores (Cote de rendement au collégial)
Note: There are no new data to report this year; data presented are those from the Measuring Excellence
2010.
Definition of the Measurement:
This measurement compares the CRC scores (Cote de rendement au collégial) of students who registered at
Québec’s universities from CEGEP (Collège dʹenseignement général et professionnel). The CRC score provides
a statistical interpretation of grades received in Québec’s CEGEPs. Essentially, the CRC is a standardized
score indicating a student’s position in the grade distribution of the classes, as well as the strength of the
group in which the grade was received compared with other groups taking equivalent classes. The CRC
ranges from 0‐50, with 25 being average.
In order to provide more balanced inter‐institutional comparisons, CRC scores have been excluded from
this analysis for students at any institution entering health‐care disciplines and law studies. As well, data
for École Polytechnique and HEC are consolidated with those of UdeM. The smallest institution in the
réseau, TELUQ, has not been included because of the small numbers involved. CREPUQ members have
not officially agreed to release their data, and for this reason, names of institutions have been replaced
with letters in the figures.
The information is based on students entering from CEGEPs in each of the fall semesters between 2005
and 2009. Of the 84,414 new registrants included in this analysis (excluding health care disciplines and
law), Concordia’s share totals 11,861. Comparative data for applicants from non‐CEGEP sources are not
presently available.
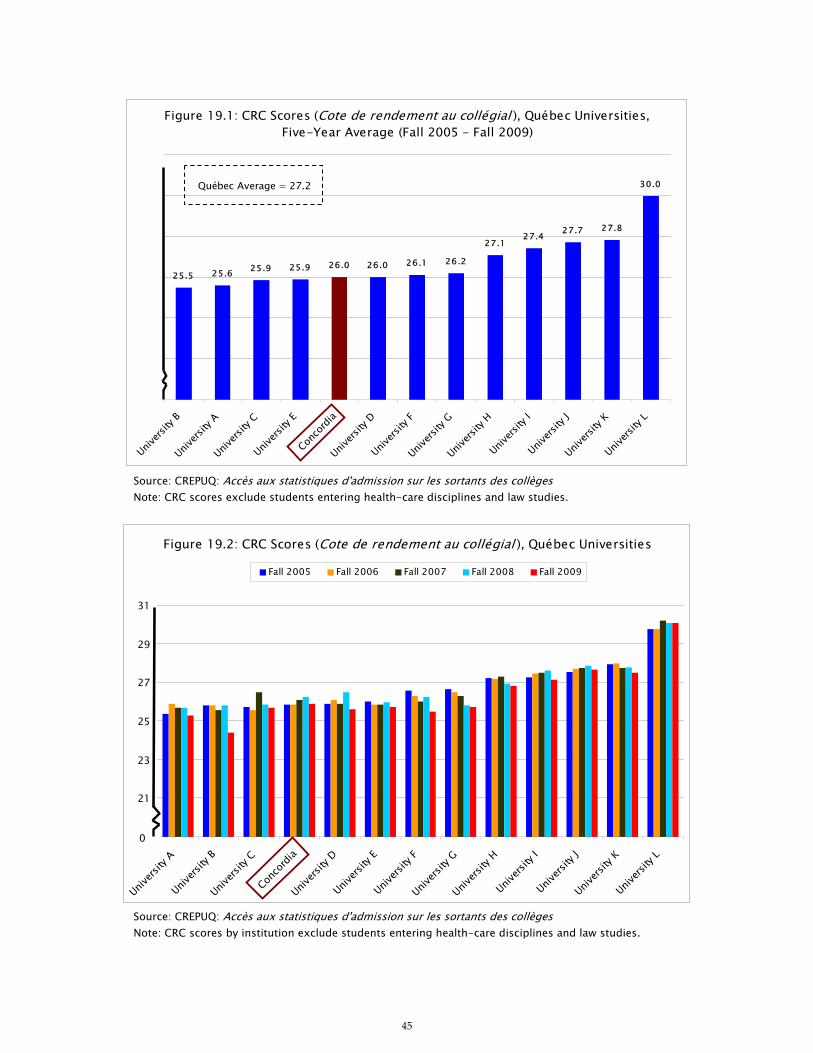
Findings and Conclusions:
Figure 19.1 shows that students entering Concordia from the CEGEP system had among the lowest
average CRC scores (26.0) in the province and certainly the lowest among the larger universities.
Over the past five years, however, Concordia has shown marginal improvement in entering CRC scores
(Figure 19.2). Since 2005, Concordia’s average CRC has only increased by 0.2 % (only 2 other institutions
showed an increase), while other institutions in the province decreased. It follows, therefore, that the
average for all institutions in this analysis decreased by 0.6% between 2005 and 2009.
Source:
CREPUQ: Accès aux statistiques dʹadmission sur les sortants des collèges
45
Source: CREPUQ: Accès aux statistiques d'admission sur les sortants des collèges Note: CRC scores exclude students entering health-care disciplines and law studies.
Source: CREPUQ: Accès aux statistiques d'admission sur les sortants des collèges Note: CRC scores by institution exclude students entering health-care disciplines and law studies.
25.5 25.6 25.9 25.9 26.0 26.0 26.1 26.2
27.127.4 27.7 27.8
30.0
Univers
ity B
Univers
ity A
Univers
ity C
Univers
ity E
Conco
rdia
Univers
ity D
Univers
ity F
Univers
ity G
Univers
ity H
Univers
ity I
Univers
ity J
Univers
ity K
Univers
ity L
Québec Average = 27.2
Figure 19.1: CRC Scores (Cote de rendement au collégial ), Québec Universities,Five-Year Average (Fall 2005 - Fall 2009)
19
21
23
25
27
29
31
Univers
ity A
Univers
ity B
Univers
ity C
Conco
rdia
Univers
ity D
Univers
ity E
Univers
ity F
Univers
ity G
Univers
ity H
Univers
ity I
Univers
ity J
Univers
ity K
Univers
ity L
Fall 2005 Fall 2006 Fall 2007 Fall 2008 Fall 2009
Figure 19.2: CRC Scores (Cote de rendement au collégial ), Québec Universities
0

46
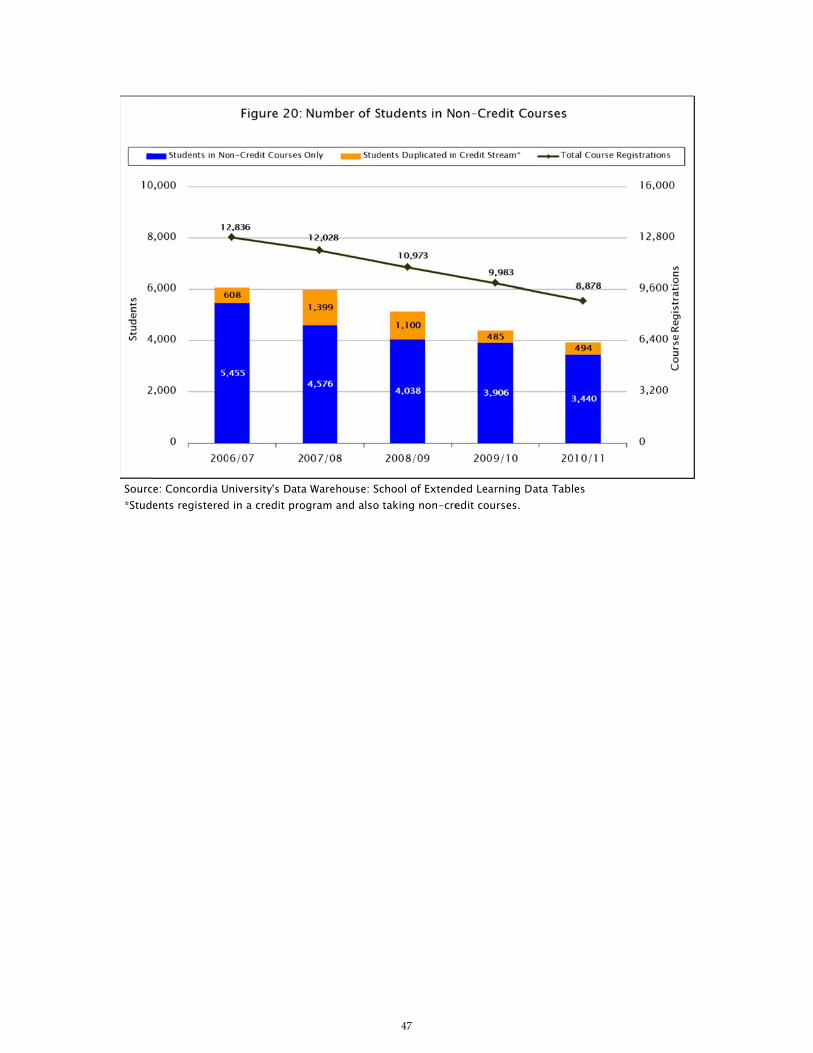
Measurement 20: Non‐Credit Enrolments and Courses
Definition of the Measurement:
Measurement 20 tracks enrolments in non‐credit courses in the School of Extended Learning. These
courses cannot be counted towards a degree. The Centre offers the largest number of such courses,
although some non‐credit courses are also offered by eConcordia.
Non‐credit students receive Concordia certification for completing specified programs of study (such as
the certificate in financial management) but are not enrolled in a Concordia degree program unless doing
so concurrently. The Centre for Continuing Education is a “for‐profit” enterprise, and must meet its
financial obligations on its own, as it receives no provincial funding. Profit, if any, is returned to the
University.
The academic year of Continuing Education (begins with the fall term) and that of Concordia’s credit
stream (begins with the summer term) have been harmonized for this report to allow comparison across
the two streams.
Findings and Conclusions:
Figure 20 shows that enrolments in non‐credit courses at Concordia have been declining. In past years,
approximately 10% of each year’s non‐credit students were duplicated in Concordia’s credit stream,
generally representing students in programs aimed at developing their language skills. In 2007/08, there
was a surge in such simultaneous enrolments, ostensibly the result of the new Step‐Up courses, created
specifically for students in the credit stream needing support. Since Step‐Up has been replaced by SEL‐
19x courses, which are part of the credit stream, the simultaneous enrolments have returned roughly to
their previous share of the total.
Source:
Concordia University’s Data Warehouse: School of Extended Learning Data Tables
Sourc*Stud
ce: Concordia Uents registered
niversity's Datad in a credit pro
a Warehouse: Scogram and also
47
chool of Extendtaking non-cre
ded Learning Dedit courses.
ata Tables
48
Measurement 21: Internal Expenditures for Student Aid per FTE Student and Comparative Operating
Expenditures for Scholarships, Bursaries, and Prizes
Definition of the Measurement:
Measurement 21 tracks the amount of internal expenditures from all sources for Student Aid per full‐time
equivalent (FTE) student from 2006/07 to 2010/11. Additionally, it compares the most recent data
available (2009/10) for the benchmark universities’ operating expenditures on scholarships, bursaries, and
prizes (dollars per FTE and as a percentage of total operating expenditures). The benchmark universities
include UQAM (2008/09 only), Carleton, Simon Fraser, Victoria, and York. Comparative data were
obtained from the Canadian Association of University Business Officers (CAUBO).
Findings and Conclusions:
Using constant 2011 dollars8, Figure 21.1 (internal data) shows that funding per FTE student (from all
internal sources) had been decreasing since its peak of $607 per FTE in 2007/08, but has rebounded in
2010/11. It should be noted that over the 5‐year period, FTE enrolments have increased by 3,476 (14.6%)
while expenditures (in constant 2011 dollars) are still about $0.9M lower than 5 years earlier.
According to CAUBO data, Figure 21.2 shows that Concordia trails the benchmark universities by a wide
margin; Concordia spends $296 per FTE student on scholarships, bursaries, and prizes compared to
Carleton’s allocation of $1,193. Moreover, this represents only 2.2% of Concordia’s total operating
expenses compared to Carleton’s 8.3%.
Sources:
Concordia University Financial Services; CAUBO: Financial Information of Universities and College
(2009‐10) General Operating Expenditures by Function (Report 3.4). FTE data from: CREPUQ (Données
préliminaires); Council of Ontario Universities (CUDO); British Columbia Higher Education
Accountability Dataset. Bank of Canada (Consumer Price Index)
8 Constant dollars were calculated using the April 2011 Consumer Price Index (CPI).

49
Sources: Concordia University Financial Services; FTE data from CREPUQ (Données préliminaires) Note: Constant dollars were calculated using the April 2011 Consumer Price Index (CPI).
Sources: CAUBO University General Operating Expenditures by Function, 2009/10 (UQAM figures only available for 2008/09); CREPUQ (Données préliminaires); Council of Ontario Universities (CUDO); British Columbia Higher Education Accountability Dataset
$592 $607
$508
$433$483
2006/07 2007/08 2008/09 2009/10 2010/11Fiscal year
Figure 21.1: Internal Expenditures for Student Aid per FTE Student(in Constant 2011 Dollars)
Average $525
$73
$296
$898$922
$941
$1,193
0.6%
2.2%
5.0% 4.7%
6.0%
8.3%
0%
1%
2%
3%
4%
5%
6%
7%
8%
9%
$0
$200
$400
$600
$800
$1,000
$1,200
$1,400
$1,600
UQAM (2008/09) Concordia Victoria Simon Fraser York Carleton
$ per FTE % of Total Operating Expenditures
Figure 21.2: Comparative General Operating Expenditures for Sholarships, Bursaries, and Prizes (per FTE and as a Percentage of Total Operating Expenditures), 2009/10
50
Measurement 22: Undergraduate Class Size
Definition of the Measurement:
Measurement 22 tracks the distribution of 2010/11 undergraduate class sections in specific class‐size
ranges for courses at each of the 200, 300 and 400 levels.
The measurement provides the percentage of registrants in each of the following class‐size ranges: fewer
than 30, 30 to 60, 61‐100, 101‐250, 251 or greater. Excluded from the analysis are: courses lacking a
standard lecture component (online, self‐study, practicum, internship, directed studies, co‐op work term,
honors thesis, independent study) and all courses with fewer than six registrants.
Findings and Conclusions:
Concordia has always fared well in terms of class size. Figure 22 shows that roughly one‐third of courses
at the 200 and 300 levels have fewer than 30 students. Moreover, the percentage of courses with 101 or
more students is below 7% overall.
Smaller class sizes tend to have a positive impact on the quality of the learning experience because of
greater access to the professor and more opportunities for small‐group cooperative work. While other
variables certainly affect student learning, the class‐size measurement provides some insight into the
level of resources dedicated to teaching and learning at an institution.
Source:
Concordia University’s Data Warehouse

Sourc
ce: Concordia University's Data
a Warehouse
51

52
Measurement 23: Student Satisfaction
Note: There are no new data to report this year; data presented are those from the Measuring Excellence
2010.
Definition of the Measurement:
Measurement 23 examines how satisfied Concordia students are with their university experience.
Information is obtained from two surveys. The first is the Canadian University Report (CUR), a survey of
Canadian university degree‐seeking undergraduate students. The second is the Canadian Graduate and
Professional Student Survey (CGPSS), a survey of graduate students in Master’s and Doctoral programs.
This survey was originally designed and administered by the Massachusetts Institute of Technology, and
has been adapted for Canadian use by Mosaic Research Solutions. The CUR is an annual survey whereas
the CGPSS is conducted triennially. The questions from the two surveys cannot be aggregated because of
dissimilar questions and scales.
Questions from CUR:
Thinking about all of your experiences at your university thus far, how satisfied are you overall with your university? (5 point scale: Very satisfied to Very dissatisfied)
Would you recommend your university to a friend or family member? (5 point scale: Definitely would to
Definitely would not)
Questions from CGPSS:
Overall, how would you rate the quality of: Your overall experience at this university? (5 point scale:
Excellent to Poor)
Would you recommend this university to someone considering your program? (5 point scale: Definitely
to Definitely not)
The two most positive response choices (e.g., very satisfied and somewhat satisfied) are reported as
percentages. Benchmark data are only available for the CUR and include Carleton, Simon Fraser, Victoria,
and York. Results from the CUR are available for 2007, 2008, and 2009; the data were aggregated to avoid
year to year variations caused by different samples. Results from CGPSS are presented for 2010 and are
compared with an overall Canadian benchmark, which consists of 23 universities including Concordia.
Findings and Conclusions:
Figure 23.1 shows aggregate results for the 2007, 2008, and 2009 CUR surveys in percentage terms for the
two most positive response choices. The overall margins of error (95 times out of 100) are ± 1.7% for
Concordia and ± 0.8% for the benchmark universities. Given the overall margins of error, there are likely
no practical differences between Concordia and the benchmark universities in the “satisfied…overall
with your university” question. In terms of “recommending your university to a friend or family
member” question, however, there is likely a practical difference in Concordia’s favor for students who
“definitely would recommend” their universities. As a result, a practical difference for the overall
percentage of students “likely to recommend their university” (two response choices combined) is most
plausible.
Using results from the 2010 CGPSS, Figure 23.2 shows that Concordia graduate respondents are slightly
less positive on both questions (“quality of the university experience” and “recommending this
university”) than the Canadian benchmark. The CGPSS was completed by 989 Concordia graduate
students representing a 22.2% response rate. The overall margins of error were ± 3.1% for Concordia and
± 0.5% for the Canadian benchmark, 95 times out of 100. Again, given the overall margins of error, there
likely are no practical differences between Concordia and the benchmark group.
Sources: Canadian University Report conducted by The Strategic Counsel, 2007, 2008, and 2009;
Canadian Graduate and Professional Student Survey conducted by Mosaic Research Solutions
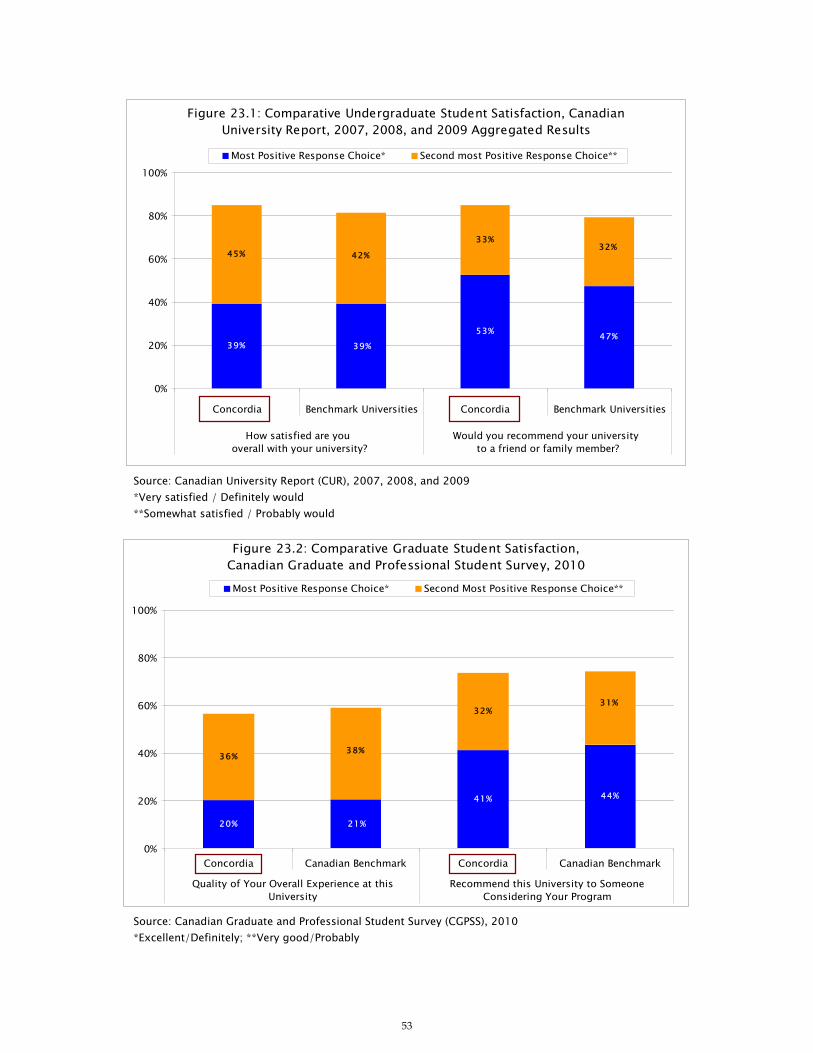
53
Source: Canadian University Report (CUR), 2007, 2008, and 2009 *Very satisfied / Definitely would **Somewhat satisfied / Probably would
Source: Canadian Graduate and Professional Student Survey (CGPSS), 2010 *Excellent/Definitely; **Very good/Probably
39%53% 47%
45%33%
39%
32%42%
0%
20%
40%
60%
80%
100%
Concordia Benchmark Universities Concordia Benchmark Universities
How satisfied are you overall with your university?
Would you recommend your university to a friend or family member?
Most Positive Response Choice* Second most Positive Response Choice**
Figure 23.1: Comparative Undergraduate Student Satisfaction, Canadian University Report, 2007, 2008, and 2009 Aggregated Results
20%
41% 44%
36%
32%
21%
38%
31%
0%
20%
40%
60%
80%
100%
Concordia Canadian Benchmark Concordia Canadian Benchmark
Quality of Your Overall Experience at thisUniversity
Recommend this University to SomeoneConsidering Your Program
Most Positive Response Choice* Second Most Positive Response Choice**
Figure 23.2: Comparative Graduate Student Satisfaction, Canadian Graduate and Professional Student Survey, 2010

54
Measurement 24: Teaching Effectiveness
Definition of the Measurement:
There is no universally agreed‐upon definition for teaching effectiveness, nor are there universally
accepted methods for measuring it. In general, however, the research literature on university teaching
effectiveness suggests that while imperfect, psychometrically sound student evaluations of teaching
performance tend to be reliable and valid.
Measurement 24 looks at course evaluation data for full and part‐time faculty. Seven different “forms” of
the evaluation questionnaire are in use at Concordia: one each for the Faculties of E&CS, FA, and JMSB,
one for part‐time faculty, and one each for the three sectors in A&S: Humanities, Science, and Social
Science. In principle, four global questions appear in all forms of the course evaluation. These questions
are intended to rate, from the student’s perspective:
The quality of the course
The quality of the professor’s teaching
The quality of the student’s learning
The professor’s accessibility to students
In practice, however, these questions are presented using different wording and/or evaluation scales in
each of the course evaluation forms. For the purpose of the current measurement, the individual
wordings of the questions are considered equivalent, and corrections have been made to try to account
for the various evaluation scales. Each measure is presented as if scored on a 1 to 5 Likert scale with a
higher score representing a more positive student impression. Only courses evaluated by 5 or more
students are included in this analysis.
As mentioned above, while each evaluation form contains questions intended to evaluate the same four
dimensions, the specific text of each question and the scales used to evaluate them differ from form to
form. This inconsistency seriously limits the meaningfulness of these results.
Findings and Conclusions:
Figure 24 shows the mean score for each of the four global questions for full and part‐time professor
course evaluations collected in the five years since the 2006/07 academic year. Overall, Concordia full‐
time and part‐time faculty receive consistently positive assessments in each of the four areas and mean
scores for each of the global questions have changed little since 2006/07. On average, faculty accessibility
receives a slightly higher rating than quality of instruction, which in turn, receives a slightly higher rating
than either quality of the student’s own learning or overall quality of the course.
Source:
Concordia University’s Data Warehouse: CEVAL tables
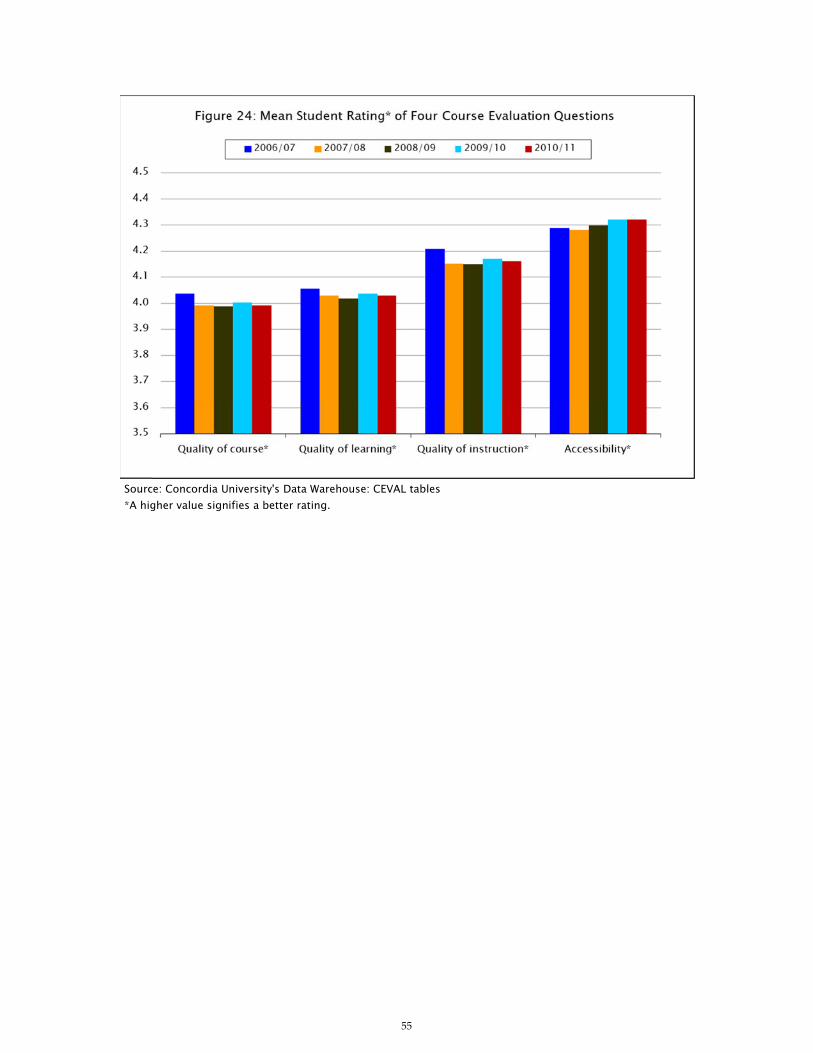
Sourc*A hig
ce: Concordia Ugher value sign
niversity's Dataifies a better ra
a Warehouse: Cating.
55
EVAL tables
56
Measurement 25: Prevalence of “Active and Collaborative Learning”
NOTE: There are no new data to report this year; data presented are those from Measuring Excellence 2009.
Definition of the Measurement:
Measurement 25 assesses the prevalence of “Active and Collaborative Learning” (ACL) at Concordia as
defined in the National Survey of Student Engagement (NSSE) in 2006 and 2008. In explaining ACL,
NSSE states that “students learn more when they are intensely involved in their education and asked to
think about what they are learning in different settings. Collaborating with others in solving problems or
mastering difficult material prepares students for the messy, unscripted problems they will encounter
daily during and after college [i.e., university].” The NSSE ACL benchmark score (a weighted average
ranging from 0 to 100) combines scores on seven questions asked to first‐year and final‐year
undergraduate students. The survey questions that comprise the benchmark included:
Asked questions in class or contributed to class discussions
Made a class presentation
Worked with other students on projects during class
Worked with classmates outside of class to prepare class assignments
Tutored or taught other students (paid or voluntary)
Participated in a community‐based project (e.g., service learning) as part of a regular course
Discussed ideas from your readings or classes with others outside of class (students, family
members, co‐workers, etc.)
The Concordia ACL benchmark score is compared to NSSE “Comprehensive Peers” (Carleton, Guelph,
UQAM, Victoria, Waterloo, Windsor, and York). In addition to the ACL benchmark score, comparisons
between Concordia and the Comprehensive Peers of the weighted percentage of “favorable” responses
(“Very often” and “Often” combined) for the seven individual questions are presented. Note that
Concordia’s data are not included with the comparison group’s data.
Findings and Conclusions:
The overall response rate to the NSSE survey for Concordia in 2008 was 27% (26% first‐year students and
28% final‐year; a total of 1,320 respondents) compared to 52% in 2006 (49% first‐year students and 54%
final‐year; a total of 2,457 respondents).
Figure 25.1 shows a comparison of the weighted means for Concordia and the Comprehensive Peers for
the two years Concordia has participated in NSSE. In 2008, Concordia’s ACL standard error of the mean
for first and final‐year students is ± 0.70 compared to ± 0.50 in 2006. With confidence intervals of the true
population mean overlapping (at a 95% confidence level), there likely are no practical differences in the
mean comparison over time for each group of students. Using the effect sizes to compare the mean
between institutions, there are no practical differences for both years and student groups when
comparing with the Comprehensive Peers.
Figure 25.2 shows 2008 results for Concordia and the Comprehensive Peers at the level of specific
questions. In comparison with the Comprehensive Peers, Concordia’s results are mixed. Specifically,
Concordia respondents felt that they had more opportunities for participation in class and making class
presentations. Conversely, there were fewer opportunities for working outside of class with other
students and fewer discussions with others about their studies outside of class. It is important to note,
however, that the percentage differences (positive or negative) are generally too small to be of any
significance.
Sources: National Survey of Student Engagement (NSSE), 2006 and 2008

57
Sources: National Survey of Student Engagement (NSSE), 2006 and 2008 *Weighted by gender, enrolment status, and institutional size
Source: National Survey of Student Engagement (NSSE), 2008 *Weighted by gender, enrolment status, and institutional size
34.8
43.2 44.1
33.9
42.8 43.8
36.3 36.4
0
10
20
30
40
50
60
2006 2008 2006 2008
First-Year Final-Year
Concordia Comprehensive Peers
Figure 25.1: Prevalence of "Active and Collaborative Learning"2006 and 2008 NSSE Benchmarks, Weighted* Mean Score Comparisons
0%
20%
40%
60%
80%
100%
ClassParticipation
ClassPresentation
Work DuringClass with
OtherStudents
Work OutsideClass with
OtherStudents
Tutored Community-based
Projects
Discuss withOthers
Wei
ghte
d Pe
rcen
tage
*
First Year Concordia First Year ComprehensiveFinal Year Concordia Final Year Comprehensive
Figure 25.2: Prevalence of "Active and Collaborative Learning""Very Often" and "Often" Responses Combined by Question, NSSE 2008

58
Measurement 26: Retention Rates of Full‐Time Bachelor’s Degree‐Seeking Students
Definition of the Measurement:
Measurement 26 provides rates of retention to second year and to third year for first‐time (no prior
university studies) full‐time Bachelor’s degree‐seeking students admitted in the fall term for academic years
2003 through 2007.
Comparative data for this measurement were obtained from the Consortium for Student Retention Data
Exchange (CSRDE). The U.S.‐based CSRDE consists of 466 North American post‐secondary institutions.
For the 2010 exercise, 27 Canadian universities participated. Comparative data from 21 of these were
available, including five from the “comprehensive” category, universities reasonably similar to Concordia
in terms of size and types of programs. The terms of participation in the CSRDE do not permit
identification of institutions by name.
There are many reasons why students are not retained; in many cases the circumstances are not at all
related to academic programming or the quality of services. For this reason, 100% retention and 100%
graduation is neither realistic nor attainable in most institutions.
It should be noted that when making comparisons, many of Concordia’s full‐time undergraduate
students enter directly from CEGEP (with an additional year of experience) into a three‐year program,
while students in other Canadian universities enter directly from high school, into a four‐year program.
The exclusion of Concordia’s sizable part‐time undergraduate population is an inherent limitation of this
measurement.
Findings and Conclusions:
After slipping for a few years in comparison to other Canadian CSRDE participants, Concordiaʹs
retention has improved.
Source:
Consortium for Student Retention Data Exchange, March 2010 submission
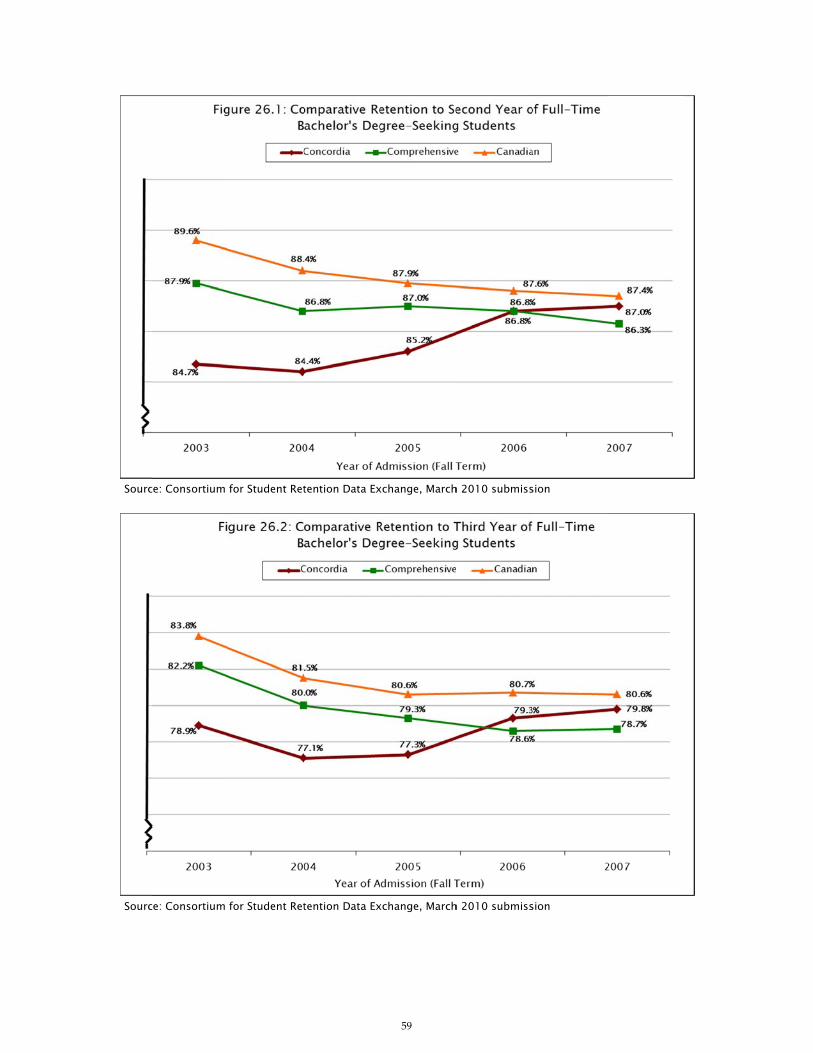
Sourc
Sourc
ce: Consortium
ce: Consortium
for Student Ret
for Student Ret
tention Data Ex
tention Data Ex
59
xchange, March
xchange, March
h 2010 submiss
h 2010 submiss
sion
sion

60
Measurement 27: Undergraduate Students with Failed Status
Definition of the Measurement:
The measurement provides the percentage of undergraduate students assessed to have failed status at the
end of each academic year. A distinction is made between first‐time failure and subsequent failures.
Undergraduate students are assessed as failed as follows: an annual Weighted Grade Point Average
(WGPA) for each student is calculated at the end of each academic year (including the summer, fall, and
winter terms), provided that the student has attempted a minimum of 12 credits. If the student has
attempted fewer than 12 credits, these credits will be included in the assessment for the following
academic year. If the WGPA is less than 1.50, the student will be assessed as failed. Students assessed
with a WGPA of between 1.50 and 1.99 are placed on conditional standing. These students will be
assessed as failed if they do not attain acceptable standing (i.e., WGPA of at least 2.00) at the next
assessment.
The academic progress of graduate students is monitored on a periodic basis. To be permitted to continue
in the program, students in master’s and doctoral programs must maintain a cumulative Grade Point
Average (GPA) of at least 3.00 based on a minimum of 12 credits. Students whose GPA falls below 3.00
are considered to be on academic probation for the subsequent review period. Students whose GPA falls
below 3.00 for two consecutive review periods are withdrawn from the program.
Findings and Conclusions:
Figure 27 shows that the rate of undergraduate first‐time failure is around 7% annually, although there
was a slight decrease in 2009/10; the proportion of subsequent failures has been fairly stable (averaging
2.8%), having decreased from a high of 3.4% in 2005/06.
At the graduate level, the proportion of failed students is much lower (less than 1% overall for cycle 2),
and in most cases the numbers are too small to analyze. There are very few failures at cycle three.
Although the majority of Concordia’s students are academically successful, a small minority does not
develop the appropriate skills to succeed, despite the availability of academic support services; these
include a wide‐variety of advising and counseling options. Not all failed students, however, should be
considered marginal or at risk. There are many reasons why students fail, in many cases due to
extenuating circumstances.
Source:
Concordia University’s Data Warehouse
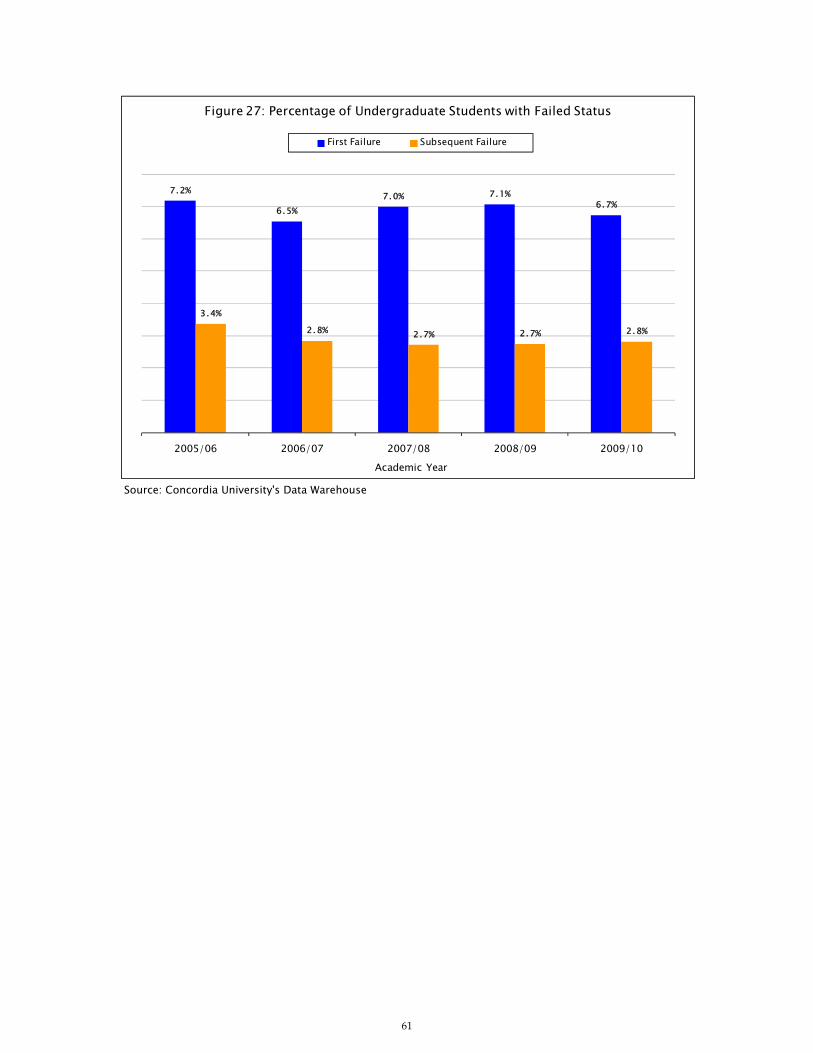
61
Source: Concordia University's Data Warehouse
7.2%
6.5%7.0% 7.1%
6.7%
3.4%2.8% 2.7% 2.7% 2.8%
2005/06 2006/07 2007/08 2008/09 2009/10Academic Year
First Failure Subsequent Failure
Figure 27: Percentage of Undergraduate Students with Failed Status
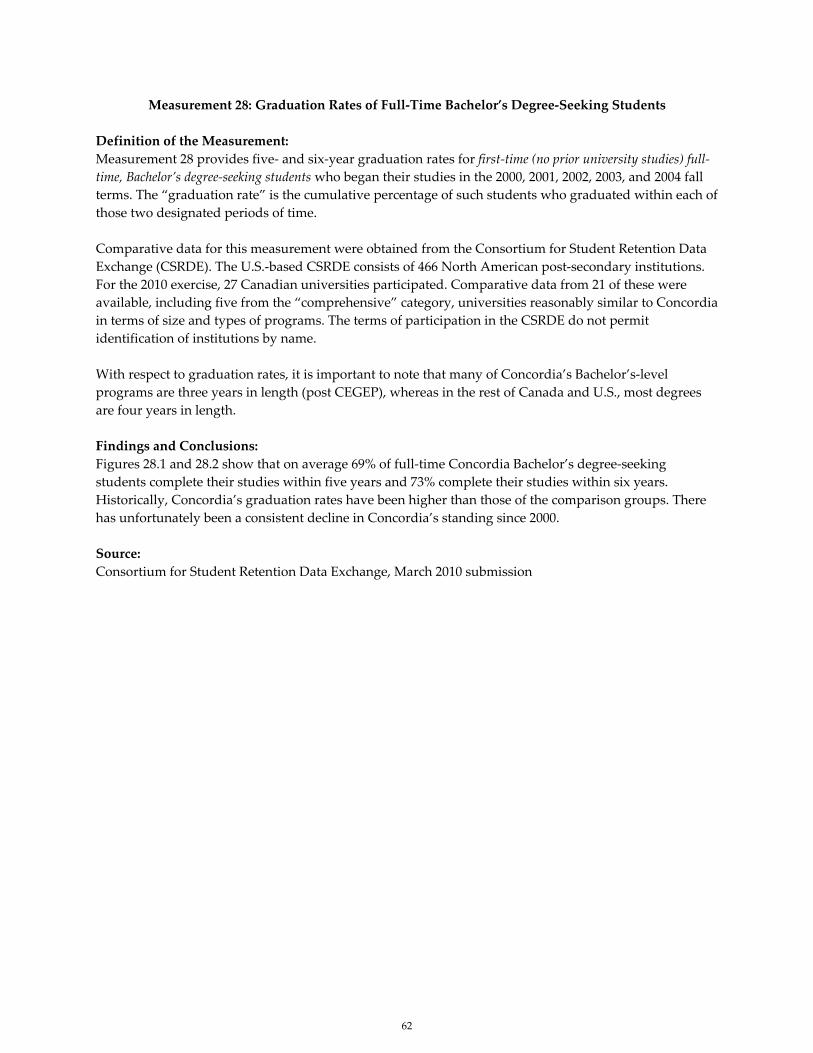
62
Measurement 28: Graduation Rates of Full‐Time Bachelor’s Degree‐Seeking Students
Definition of the Measurement:
Measurement 28 provides five‐ and six‐year graduation rates for first‐time (no prior university studies) full‐
time, Bachelor’s degree‐seeking students who began their studies in the 2000, 2001, 2002, 2003, and 2004 fall
terms. The “graduation rate” is the cumulative percentage of such students who graduated within each of
those two designated periods of time.
Comparative data for this measurement were obtained from the Consortium for Student Retention Data
Exchange (CSRDE). The U.S.‐based CSRDE consists of 466 North American post‐secondary institutions.
For the 2010 exercise, 27 Canadian universities participated. Comparative data from 21 of these were
available, including five from the “comprehensive” category, universities reasonably similar to Concordia
in terms of size and types of programs. The terms of participation in the CSRDE do not permit
identification of institutions by name.
With respect to graduation rates, it is important to note that many of Concordia’s Bachelor’s‐level
programs are three years in length (post CEGEP), whereas in the rest of Canada and U.S., most degrees
are four years in length.
Findings and Conclusions:
Figures 28.1 and 28.2 show that on average 69% of full‐time Concordia Bachelor’s degree‐seeking
students complete their studies within five years and 73% complete their studies within six years.
Historically, Concordia’s graduation rates have been higher than those of the comparison groups. There
has unfortunately been a consistent decline in Concordia’s standing since 2000.
Source:
Consortium for Student Retention Data Exchange, March 2010 submission
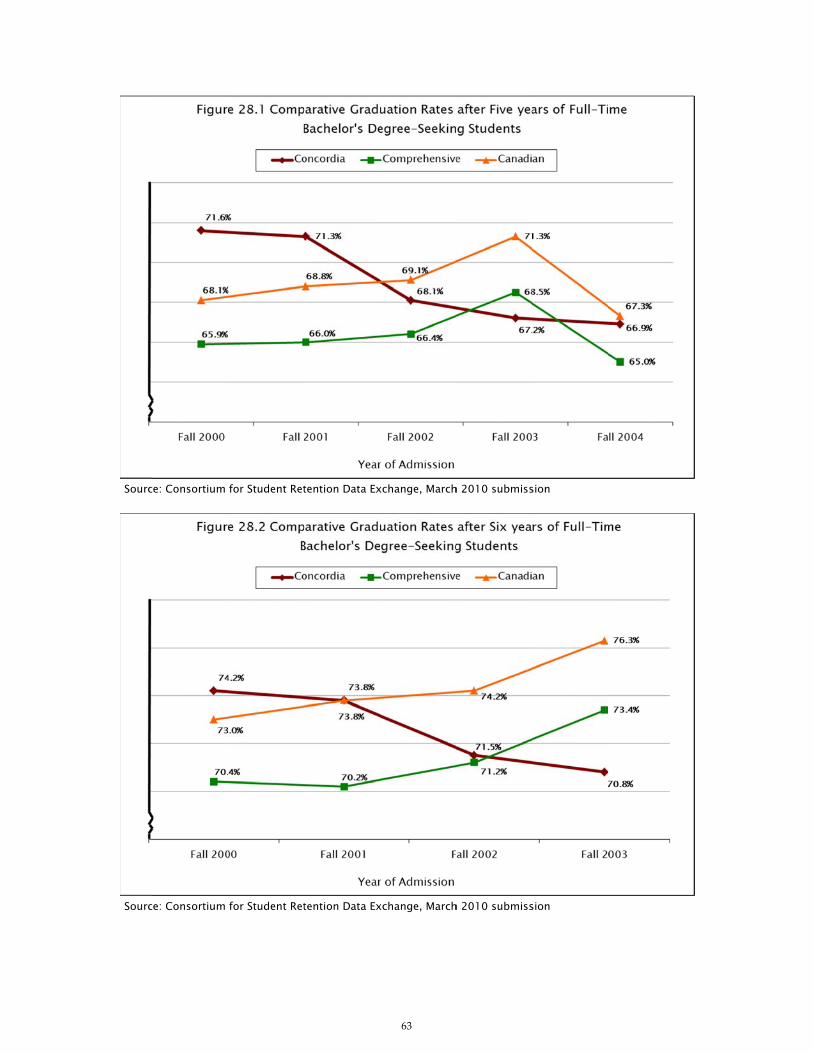
Sourc
Sourc
ce: Consortium
ce: Consortium
for Student Ret
for Student Ret
tention Data Ex
tention Data Ex
63
xchange, March
xchange, March
h 2010 submiss
h 2010 submiss
sion
sion
64
Measurement 29: Duration of Studies and Graduation/Withdrawal/Continuation Rates of Full‐Time
Master’s and Doctoral Students
Definition of the Measurement:
Measurement 29 examines the time taken by full‐time Master’s and Doctoral students to complete their
program of study and consists of the percentage who have graduated for each of the following time
intervals: (1) two years and less, (2) three, four, five, and six years, and (3) more than six years.
At the Master’s and Doctoral level, there are University‐defined time limits for completion of studies; at
the Master’s level (45 credits), the time limit for full‐time study is four years for the majority of programs.
At the Doctoral level (120 credits), the limit is six years post entry. Additionally, there are government‐
defined limits for funding of graduate students; specifically, Master’s and PhD students do not generate
any government funding for the University two and four years respectively after entry.
In addition to duration of studies for those who graduate, this measurement also provides information on
the success rates of full‐time Master’s and PhD students (2001, 2002, and 2003 cohorts) and includes the
following:
Proportion that graduate
Proportion that withdraw prior to completion
Proportion still registered five years after entry (for Master’s students) and seven years after
entry (for Doctoral students)
Findings and Conclusions:
Figure 29.1 shows that the vast majority of students who graduated did so within the time limits
established for their program. Specifically, 99.8% of Master’s course‐based graduates and 91% of Master’s
thesis graduates completed within four years, and just under 80% of Doctoral graduates completed
within six years. Despite completing within the program time limits set by the University, many students
do not complete within the funding time limits prescribed by the government; this means that the
University does not receive any funding for these students for a period of time despite providing services
and facilities for them. In order to remedy this situation, there needs to be a closer match between
program and funding time limits; if this were implemented and enforced, however, there would very
likely be a sharp increase in attrition rates and decrease in graduation rates.
Figure 29.2 shows rates of graduation, withdrawal, and continuation of all full‐time Master’s and
Doctoral students (after five and seven years, respectively) admitted in fall 2001, 2002, and 2003. The data
show that on average, 29% of Doctoral students withdraw prior to completing their studies compared to
about 10% at the Master’s level. Moreover, graduation rates are much lower for Doctoral students
(averaging 47%) compared to 85% of Master’s students.
Figure 29.2 also shows that on average, 24% of full‐time Doctoral students are still registered seven years
after entry; this is cause for concern since the University no longer receives funding for these students
from the Ministry. Undoubtedly, these students obtained permission from the School of Graduate Studies
to extend their studies beyond the six‐year limit. This is evidence that many Doctoral students experience
difficulty in completing their studies in an expedient manner. It would be prudent to examine this issue
in more detail with a view to finding ways to encourage timelier program completion at the doctoral
level. At the same time, further investigation should be undertaken into the reasons that about one in four
Doctoral students withdraw prior to completion.
Source:
Concordia University’s Data Warehouse

65
Source: Concordia University’s Data Warehouse Specified years in this figure range from one to six years or more. “Years” are defined as “from time of entry to time of completion of studies.”
Source: Concordia University’s Data Warehouse “Years” are defined as “from time of entry to time of completion of studies.”
35%
41%
55%
4%0.2%
14%
57%
20%
7%
2% 0.4%0.3% 2%
13%
30%
21%
2 years or less 3 years 4 years 5 years 6 years More than 6 years
Master's (course-based) Master's (thesis-based) Doctoral
Figure 29.1: Percent of Master's (2002 to 2007 Cohorts) and Doctoral (2002 to 2005 Cohorts) Full-Time Students Graduating within Specified Years
86%
10%4%
51%
27%
85%
10%5%
42%
32%26%
84%
10%6%
48%
29%23%22%
% Graduated % Withdrew % Still registeredafter 5 years
% Graduated % Withdrew % Still registeredafter 7 years
Master's (Course and Thesis-based) Doctoral
2001 Cohort 2002 Cohort 2003 Cohort
Figure 29.2: Graduation, Withdrawal and Continuation Rates Master's and Doctoral Full-Time Students (2001 - 2003 Cohorts)
66
Measurement 30: Expenditures for Academic Support Services per FTE students
Definition of the Measurement:
This measurement examines Concordia’s expenditures for academic support services from 2005/06 to
2009/10, and compares the most recent data available (2009/10) with those at the benchmark universities
(UQAM – 2008/09 only; Carleton, Simon Fraser, Victoria, and York). In this case, academic support
services include expenditures for libraries, computing and communications, and student services.
Comparative information for this measurement was drawn from data compiled by the Canadian
Association of University Business Officers (CAUBO); the most recent information available pertains to
the 2009/10 fiscal year.
In order to provide a measure of comparability with the benchmark universities, the expenditures for
academic support services are divided by the number of full‐time equivalent (FTE) students at each
institution.
Findings and Conclusions:
Using constant 2010 dollars9, Figure 30.1 shows that Concordia’s expenditures for academic support
services per FTE student had been on the increase, but has been dropping the past 3 years. It is notable
that total spending (in constant 2010 dollars) between 2005/06 and 2009/10 increased from $38.4 M to
$47.8 M (24.4%), while at the same time, FTE enrolments increased from 23,674 to 25,886 (9.3%).
Despite the increased expenditures, Concordia still needs to provide much more in order to attain levels
comparable to those offered elsewhere in Canada. Figure 30.2 shows that Concordia spent less than the
average of the benchmark universities in 2009/10 ($1,195 less per FTE student) but more than UQAM10
($219 more per FTE student). In order to reach a level of expenditure on academic support comparable to
that offered by Simon Fraser, however, Concordia would have needed to commit an additional $69.5 M in
fiscal 2009/10.
To increase its attractiveness, Concordia will need to develop an incremental, strategic approach to bring
its expenditures in this area in line with other universities.
Sources:
CAUBO Financial Information of Colleges and Universities (Report 2.4C); CREPUQ (Données
préliminaires); Council of Ontario Universities (CUDO); British Columbia Higher Education
Accountability Dataset; Bank of Canada (Consumer Price Index)
9 Constant dollars were calculated using the May 2010 Consumer Price Index (CPI). 10 Data for UQAM pertain to the 2008/09 fiscal year; more recent data will be available after July 2011

67
Sources: CAUBO Financial Information of Colleges and Universities (2005/06 to 2009/10); FTE data from CREPUQ (Données préliminaires). Note: Constant dollars were calculated using the May 2010 Consumer Price Index (CPI).
Sources: CAUBO Financial Information of Colleges and Universities 2009/10; FTE data from CREPUQ (Données préliminaires); Council of Ontario Universities (CUDO); British Columbia Higher Education Accountability Dataset
$1,623
$1,751
$1,954$1,912
$1,847
2005/06 2006/07 2007/08 2008/09 2009/10Academic Year
5-year Average = $1,773
Figure 30.1: Expenditures for Academic Support per FTE Student (in Constant 2010 Dollars)
$1,628$1,847
$3,267$3,437 $3,543
$4,532
UQAM (2008/09) Concordia Carleton York Victoria Simon Fraser
Average = $3,042
Figure 30.2: Comparative Expenditures for Academic Support per FTE Student, 2009/10
68
Measurement 31: Average Grades at Completion
THIS MEASUREMENT HAS BEEN DELETED FROM
THE MEASURING EXCELLENCE REPORT

69
[PAGE INTENTIONALLY LEFT BLANK]
70
Measurement 32: Employment of Graduates Six Months and Two Years after Graduation
Definition of Measurement:
Measurement 32 tracks the success of undergraduate students in the job market six months and two years
after graduation and seeks to determine the extent to which the skills acquired and developed at
Concordia have helped in their search for employment after graduation. Undergraduate students who
graduated in all degree programs during the 2007 academic year were surveyed. For benchmarking,
Concordia is compared with Ontario students who graduated during the 2006 school year. The key
questions, which focus in turn on status six months and two years after graduation, read:
Were you employed six months/two years after you graduated?
If you were employed six months/two years after you graduated, how closely was your work related to the
skills you acquired through the program of study you completed in 2007?
If you were employed six months/two years after you graduated, what was your personal annual salary
(including tips and commissions) before taxes and other deductions (in Canadian dollars)?
Were you attending school six months/two years after you graduated?
Findings and Conclusions:
Three hundred and sixty‐eight graduates responded to the 2011 Graduate Employment Survey, giving a
response rate of more than 10% and an estimated margin of error of ±4.5%, 95 times out of 100.
Six months after graduation, 92% of respondents were employed or pursuing studies (versus 96% in
Ontario11); two years after graduation, this number increased to 96% (versus 94% in Ontario). In general,
respondents found work related to their field of study. As Figure 32.1 illustrates, six months after
graduation 73% of full‐time employed respondents were working in a job related to their field of study
(79% in Ontario). Two years after graduation, this number increases to 84% (85% in Ontario). As Figure
32.2 illustrates, graduates employed full‐time six months after graduation received an average annual
income of $37,604 ($39,712 in Ontario12); two years after graduation, employed graduates earned close to
$44,782 ($47,347 in Ontario1). In early February 2011, 77% of employed respondents were satisfied with
their employment while 14% were dissatisfied.
Six months after graduation, 26% of respondents were taking courses. Of these, 51% were pursuing
graduate studies, 20% college or undergraduate level courses, 6% professional degrees, and 24% non‐
credit courses. Two years after graduation, over 29% of all respondents were pursuing further studies. Of
these, 57% were pursuing graduate studies, 15% college or undergraduate level courses, 8% professional
degrees, and 20% non‐credit courses.
Sixty‐six percent of respondents work in Québec. Of these, 51% work in a bilingual environment, 11% in
a predominantly French environment, and 35% in a predominantly English environment.
Sources:
2011 Concordia Graduate Employment Survey, based, with permission, on the Ontario Graduate Student
Survey conducted annually by the Council of Ontario Universities (COU); Highlights of the Survey of
Graduates of Ontario University Undergraduate Programs (2006 graduates) (2009, COU)
11 Last year’s Ontario Graduate Student Survey (OGSS), administered in winter 2008, are used for comparisons. 12 Reported average salaries are estimated for non‐professional jobs based on the results of the 2008 OGSS.

71
Source: 2011 Concordia Graduate Employment Survey
Source: 2011 Concordia Graduate Employment Survey
27%16%
30%
34%
43%50%
0%
20%
40%
60%
80%
100%
6 months after graduation 2 years after graduation
Not related at all Somewhat related Closely related
Figure 32.1: Relation Between Skills Acquired and Employment Six Months and Two Years After Graduation
0%
20%
40%
60%
80%
100%
6 months after graduation 2 years after graduation
Over $100,000
$90,001 - $100,000
$80,001 - $90,000
$70,001 - $80,000
$60,001 - $70,000
$50,001 - $60,000
$40,001 - $50,000
$30,001 - $40,000
$20,001 - $30,000
$10,001 - $20,000
$0 - $10,000
Figure 32.2: Annual Income of Full-Time Employed Graduates Six Months and Two Years After Graduation
Average$37,604
Average$44,782
72
Measurement 33: Scholarly Productivity Index
Definition of the Measurement:
Measurement 33 tracks the scholarly productivity of Concordia’s professors and graduate students using
one aspect of scholarly productivity, i.e., peer reviewed article publication in journals indexed by major
citation indices. There are various other types of scholarly productivity including, but not limited to,
exhibitions, performances, book authoring, chapter authoring, curating, etc. Participating authorship of
indexed journal articles was chosen because of the availability of comparative data. Article publications
in journals are indexed by three major citation indices in the Canadian Bibliometric Database (CBD): the
Arts and Humanities Citation Index, the Science Citation Index, and the Social Science Citation Index.
The CBD, produced by the Observatoire des sciences et des technologies (OST), uses information from the
Thomson Institute for Scientific Information (ISI) Database.
For benchmarking purposes, Concordia will be compared with UQAM, Carleton, Simon Fraser, Victoria,
and York, excluding publications from affiliated institutions. Since larger institutions would be expected
to publish more articles than smaller institutions, data are standardized using full‐time equivalent (FTE)
graduate students and professors. Comparative professor numbers are provided by Statistics Canada and
include full‐time professors, associate professors, and assistant professors. Excluded from the analysis
are those appointed as deans and administrators, professors not paid according to regular salary scales,
those on leave of absence, and visiting professors. The most recent data available from Statistics Canada
pertain to 2005/06, 2006/07, 2007/08, and 2008/09; therefore, only four years are used for benchmarking.
The basis for calculating FTE students has been harmonized using Statistics Canada methodology and
fall‐semester headcount data obtained from independent sources. Statistics Canada calculates full‐
time equivalence as follows: 1 full‐time student equals 1 FTE and 3.5 part‐time students equal 1 FTE.
This methodology is more favourable for inter‐institutional comparison owing to differences in
definitions and calculation of full‐time equivalency in other institutions and provinces.
Findings and Conclusions:
The analysis shows that the number of Concordia’s articles in journals indexed in the CBD increased
steadily from 2004 to 2006, decreased slightly in 2007, then increased again in 2008; there was an increase
of 111 publications or 20% from 2004 to 2008. Figure 33.1 indicates that most of Concordia’s increase is
attributable to publications in social science (34% growth) compared with arts and humanities (23%) and
science (16%). Science, however, continues to be the sector with the largest proportion of publications,
representing on average 75% of all of Concordia’s articles.
Figure 33.2 shows how Concordia compares in the number of publications when controlling for the size
effect of the population that is most likely to publish articles. Concordia’s professors and graduate
students’ rate of publication (per 100 professors and FTE graduate students) is higher than UQAM, but
lags behind the other four benchmark universities with Victoria leading the group.
Sources:
Observatoire des sciences et des technologies (OST): The Canadian Bibliometric Database (CBD); Statistics
Canada: Salaries and Salary Scales of Full‐time Teaching Staff at Canadian Universities, 2008/2009: Final
Report; CREPUQ: Données préliminaires; Common University Data Ontario (CUDO); British Columbia
Higher Education Accountability Dataset

73
Source: Observatoire des sciences et des technologies (OST): The Canadian Bibliometric Database (CBD) Note: Institutional data exclude all affiliated institutions.
Sources: Observatoire des sciences et des technologies (OST): The Canadian Bibliometric Database (CBD); Statistics Canada; CREPUQ: Données préliminaires; Common University Data Ontario (CUDO); British Columbia Higher Education Accountability Dataset Note: Institutional data exclude all affiliated institutions.
22 24 21 24 27
420 416 457 429489
108 125111
114
145
0
100
200
300
400
500
600
700
2004 2005 2006 2007 2008Calendar Year
Arts and Humanities
Figure 33.1: Indexed Journal Article Publication
0
5
10
15
20
25
30
35
40
UQAM Concordia York Carleton Simon Fraser Victoria
2005 Ratio 2006 Ratio 2007 Ratio 2008 Ratio
Figure 33.2: Comparative Indexed Journal Article Publication in Calendar Yearper 100 Graduate FTE Students, Full-Time Professors, Associate Professors,
and Assistant Professors
74
Measurement 34: Patent Output
Definition of the Measurement:
Measurement 34 tracks comparative patent output, a measure of one aspect of scholarly productivity that
generally applies to certain disciplines (e.g., sciences, engineering, etc.) Because disciplinary specificity is
not unique to Concordia, we are able to examine Concordia’s production in this area compared with the
benchmark universities (UQAM, Carleton, Simon Fraser, Victoria, and York). All universities encourage
patent production because of its importance in driving scientific and economic progress.
A patent is a document protecting the rights of the inventor and a repository of useful technical
information for the public. Patents cover new inventions, and differ from other intellectual property
rights (i.e., trademarks and copyrights) in the following ways:
Trademarks are words, symbols, or designs used to distinguish the wares or services
Copyrights provide protection for literary, artistic, dramatic, or musical works
A patent document can be either a granted patent (patent issued) or a patent filed; filing a patent
application entails the submission of a formal application to the Commissioner of Patents. It should be
noted that some inventors may not report their affiliated institution and/or some patents may have more
than one assignee, therefore the data may be incomplete for any given institution. Finally, a patent is
effective only in the country of application.
Findings and Conclusions:
Currently13, Concordia has 12 patents issued (all U.S.), 23 patents pending (six Canadian, nine U.S., three
European, and five international), and 12 provisional patents (all U.S.). As Figure 34 shows, none of the
benchmark universities is a prolific patent recipient. Over the past 10 years, the highest number of
Canadian patents was awarded to Simon Fraser (11) with all other benchmark universities having seven
or fewer. In the United States, Simon Fraser also leads in patents awarded for the past 10 years (35),
followed by Victoria (29) and Concordia (14).
Sources:
Concordia University’s Office of Research; Canadian Intellectual Property Office (CIPO): Canadian
Patents Database, including applications filed under the Patent Cooperation Treaty; United States Patent
and Trademark Office (USPTO): Issued Patents Database
13 Data are as of April 1st, 2011
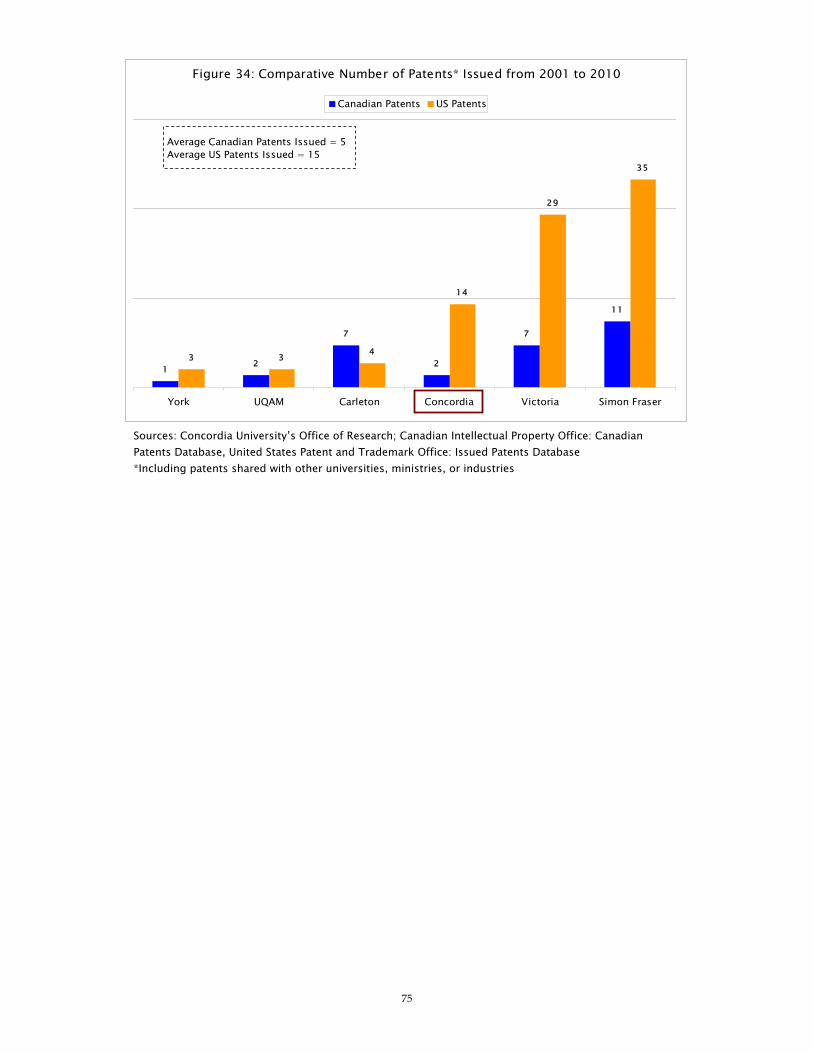
75
Sources: Concordia University’s Office of Research; Canadian Intellectual Property Office: Canadian Patents Database, United States Patent and Trademark Office: Issued Patents Database *Including patents shared with other universities, ministries, or industries
1 2
7
2
7
11
3 3 4
14
29
35
York UQAM Carleton Concordia Victoria Simon Fraser
Canadian Patents US Patents
Average Canadian Patents Issued = 5Average US Patents Issued = 15
Figure 34: Comparative Number of Patents* Issued from 2001 to 2010
76
Measurement 35: Research Funding per Tenured and Tenure‐Track Professor
Definition of the Measurement:
Measurement 35 tracks total research funding awarded directly to professors (grants and contracts) as
well as monies received by the University as a whole (Canadian Foundation for Innovation grants) and
divides this figure by the number of tenured and tenure‐track professors.
This measurement uses Concordia data on total research funding which includes funding from: the
National Sciences and Engineering Research Council (NSERC), Social Sciences and Humanities Research
Council (SSHRC), Canada Institutes of Health Research (CIHR), Canada Foundation for Innovation (CFI)
funding, provincial granting agencies, and all other sources. The total amount of research funding is
based on the fiscal year June 1st to May 31st.
Findings and Conclusions:
In 2009/10, Concordia received $34.2 million of external research funding. Using constant 2010 dollars14,
Figure 35 shows that funding per tenured and tenure‐track professor increased slightly over 2008/09, but
is still less than levels seen 5 years earlier. This is due to a combination of relatively flat levels of funding
combined with increasing numbers of tenure/tenure‐track professors hired over the past few years.
Sources:
Concordia University’s Financial Services; IPO’s working file15 for CREPUQ: Enquête sur le personnel
enseignant (as of October 1st); Bank of Canada (Consumer Price Index)
14 Constant dollars were calculated using the May 2010 Consumer Price Index (CPI). 15 Working file is used because it indicates the tenure status of the professor. This field is not transmitted to the CREPUQ.

77
Sources: Concordia University's Financial Services; IPO’s working file for CREPUQ: Enquête sur le personnel enseignant (as of October 1st). Note: Constant dollars were calculated using May 2010 Consumer Price Index (CPI)
$47.9
$44.6
$45.4
$42.0 $42.9
2005/06 2006/07 2007/08 2008/09 2009/10Fiscal Year
Figure 35: Research Funding per Tenured and Tenured-Track Professor(in Thousands of Constant 2010 Dollars)
78
Measurement 36: Federal Research Funding (Tri‐Council)
Definition of the Measurement:
Measurement 36 tracks Concordia’s funding awarded by the Federal government’s independent funding
bodies (including research grants to professors and fellowships/scholarships to graduate students) from
2005/06 to 2009/10. Additionally, it compares the most recent data available with the benchmark
universities (UQAM, Carleton, Simon Fraser, Victoria, and York).
Funds reported in the Figures are those disbursed by the granting agency whose fiscal year is April 1st to
March 31st. The Tri‐Council granting agencies are:
Canadian Institutes of Health Research (CIHR)
Natural Sciences and Engineering Research Council of Canada (NSERC)
Social Sciences and Humanities Research Council of Canada (SSHRC)
Please note that NSERC‐sourced Canada Research Chairs amounts are included in both Figures for all
universities. Numbers may vary between this measurement and self‐reported data by institution because
of funds transferred in and funds transferred out by professors during the year.
Findings and Conclusions:
Using constant 201016 dollars, Figure 36.1 shows Federal research funding awarded to Concordia by
granting agencies for the past five years. During this period, Concordia’s funding decreased slightly by
2.4%, from $21.6M to $21.1M. The highest percentage growth among the Tri‐Council agencies was CIHR
(16.9%), while NSERC decreased by 0.4% and SSHRC decreased by 11.3%. Among the benchmark
universities, from 2005/06 to 2009/10, Carleton experienced the highest overall growth (in percentage
terms) from the Tri‐Council agencies (20.0%), followed by York (15.9%) and Victoria (12.4%), while Simon
Fraser decreased by 2.5% and UQAM decreased by 7.3%.
Figure 36.2 shows 2009/10 Federal research funding awarded to the benchmark universities. Simon Fraser
received 22.2% of the total received by the six universities, followed by Victoria (19.7%), York (18.0%),
Carleton (14.2%), UQAM (14.0%), and Concordia (12.0%). Sources:
Observatoire des sciences et des technologies (OST): Tri‐Council Funding Cube; Bank of Canada (Consumer
Price Index)
16 Constant dollars were calculated using the March 2010 Consumer Price Index (CPI) obtained from the Bank of Canada.

79
Source: Observatoire des sciences et des technologies (OST): Tri-Council Funding Cube Note: Constant dollars were calculated using the March 2010 Consumer Price Index (CPI)
Source: Observatoire des sciences et des technologies (OST): Tri-Council Funding Cube
$21.6 $22.2 $22.8$21.1
$12.5 $12.8$12.0
$21.2
$2.5$2.8$2.7$2.1$2.2
$11.4$12.0
$6.6$7.2$6.9$7.7$7.5
2005/06 2006/07 2007/08 2008/09 2009/10
Academic Year
Concordia Total CIHR NSERC SSHRC
Figure 36.1: Federal Research Funding by Granting Agency(in Millions of Constant 2010 Dollars)
$2.5 $2.9 $1.4$5.4 $5.3
$8.3
$12.0$9.1
$17.1 $10.8
$21.3
$21.6$6.6 $12.6
$6.3$15.3
$7.9
$9.1
Concordia UQAM Carleton York Victoria Simon Fraser
CIHR NSERC SSHRC
Figure 36.2: Comparative Federal Research Funding by Granting Agency, 2009/10(in Millions of Dollars)
80
Measurement 37: Provincial Research Funding (FQRNT, FQRSC)
Definition of the Measurement:
Measurement 37 tracks Concordia’s research funding awarded by the Québec government’s independent
funding agencies from 2005/06 to 2009/10, and compares the most recent data available with other
Québec universities. The agencies are:
Fonds québécois de la recherche sur la nature et les technologies (FQRNT)
Fonds québécois de la recherche sur la société et la culture (FQRSC)
The Québec government has a third funding agency, the Fonds de recherche en santé du Québec (FRSQ), for
which direct access to their funding data is not yet available.
For benchmarking purposes, Concordia will be compared with other Québec universities having at least
$500,000 in total research funding from FQRNT and FQRSC. As well, data for École Polytechnique and
HEC are consolidated with those of UdeM.
Amounts reported in the graphs are those disbursed by the granting agency whose fiscal year is April 1st
to March 31st. The data were obtained directly from the funding agencies’ websites. The figures may vary
between this measurement and self‐reported data by institution because of funds transferred in and out
by professors during the year (due to co‐investigators located at other institutions).
Findings and Conclusions:
Using constant 2010 dollars17, Figure 37.1 shows Concordia’s funding from FQRNT and FQRSC for the
past five years. Overall, Concordia’s funding remained stable averaging $2.7 million. The relative share
by funding agency remained fairly stable with FQRSC representing most of Concordia’s provincial
agency funding, ranging from 76% in 2005/06 to 73% in 2009/10. Since 2005/06, Concordia’s share of
FQRSC funding awarded to all Québec universities increased from 8.0% to 9.2%, while funding from
FQRNT increased from 2.5% to 2.9%.
Figure 37.2 shows Concordia provincial research funding for 2009/10 among Québec universities
receiving more than $500,000. Overall, Concordia has slipped to sixth position (from fifth in 2008/09),
behind the other large‐size Québec universities.
Sources:
Répertoire de la recherche subventionnée, FQRNT‐FQRSC; Bank of Canada (Consumer Price Index)
17 Constant dollars were calculated using the March 2010 Consumer Price Index (CPI).
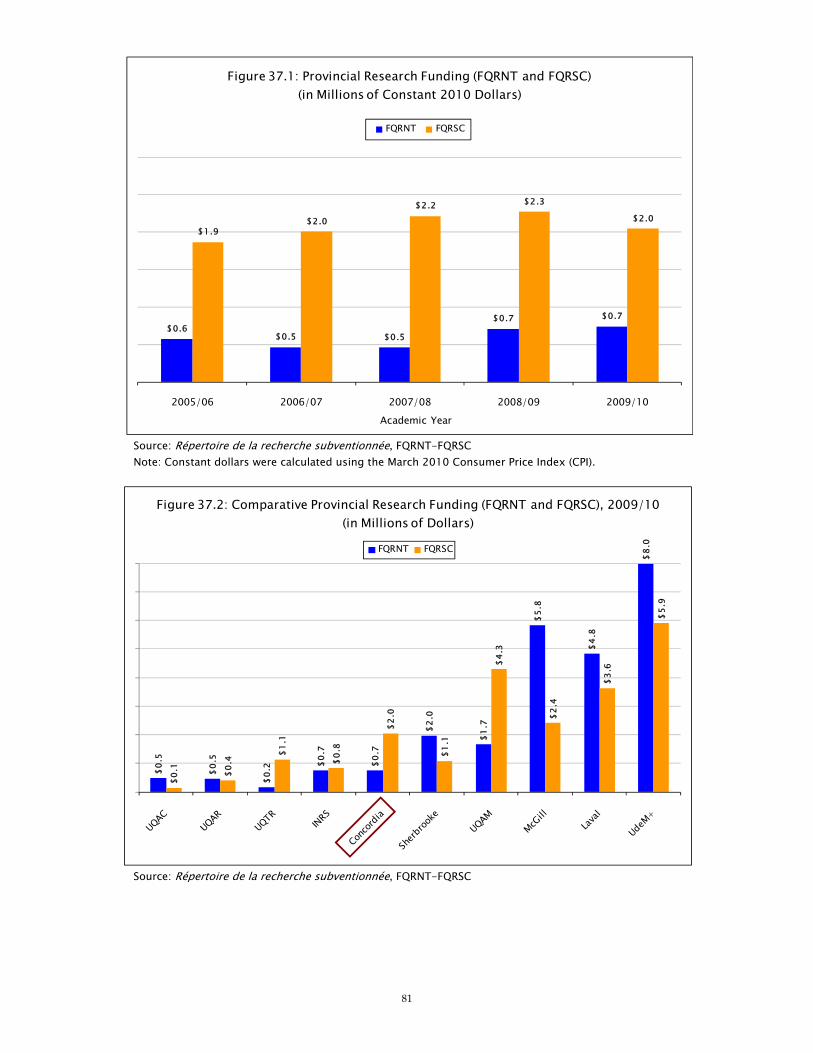
81
Source: Répertoire de la recherche subventionnée, FQRNT-FQRSC Note: Constant dollars were calculated using the March 2010 Consumer Price Index (CPI).
Source: Répertoire de la recherche subventionnée, FQRNT-FQRSC
$0.6$0.5 $0.5
$0.7 $0.7
$1.9$2.0
$2.2 $2.3
$2.0
2005/06 2006/07 2007/08 2008/09 2009/10Academic Year
FQRNT FQRSC
Figure 37.1: Provincial Research Funding (FQRNT and FQRSC)(in Millions of Constant 2010 Dollars)
$0.5
$0.5
$0.2 $0
.7
$0.7
$2.0
$1.7
$5.8
$4.8
$8.0
$0.1 $0
.4
$1.1
$0.8
$2.0
$1.1
$4.3
$2.4
$3.6
$5.9
FQRNT FQRSC
Figure 37.2: Comparative Provincial Research Funding (FQRNT and FQRSC), 2009/10(in Millions of Dollars)
82
Measurement 38: Number of Research Chair Holders
Definition of the Measurement:
Concordia houses three kinds of Research Chairs: Canada Research Chairs, Concordia University
Research Chairs, and Other Research Chairs and Distinguished Professorships.
Canada Research Chairs are funded by the federal government, which funds not only the
professor’s salary, but also the professor’s research activities. There are two categories of Canada
Research Chair: Tier One, and Tier Two. Tier‐One chairs are awarded for seven years and are
renewable. The university receives $200,000 per year for these chairs. Tier‐Two chairs are
awarded for five years and are renewable once. The University receives $100,000 per year for
these chairs. Chair holders are eligible for infrastructure support through the Canada Foundation
for Innovation.
Concordia University Research Chairs are funded internally by the University to provide an
attractive alternative for our established and highly valued researchers to remain with the
University and to continue to be productive in their areas of study.
Other Research Chairs and Distinguished Professorships are funded in whole or in part by
private and/or corporate donors to support researchers focusing on specific topics of interest.
Comparatively, only Canada Research Chairs are tracked because inter‐institutional data on other types
of chairs are not readily available. For the purpose of this measurement, Concordia will be compared
with the benchmark universities (UQAM, Carleton, Simon Fraser, Victoria, and York).
The three federal funding agencies are:
Canadian Institutes of Health Research (CIHR)
National Sciences and Engineering Council (NSERC)
Social Sciences and Humanities Research Council of Canada (SSHRC)
Findings and Conclusions:
According to the Canada Research Chairs “Chair Holder Profiles” as of November 2010, Concordia had
17 filled Canada Research Chairs. Four chairs were Tier‐One and 13 were Tier‐Two, the same as the
previous year. There are eight NSERC‐affiliated Chairs, eight SSHRC, and one CIHR. Among the
benchmark universities (Figure 38), Concordia has the lowest number of filled Canada Research Chairs.
Concordia currently has an assigned allotment of 13 Tier‐One and 14 Tier‐Two Canada Research Chairs.
Allotments of chairs to each institution are based on a rolling average of tri‐council funding (NSERC,
SSHRC, and CIHR) received over the previous three years. Concordia also has 46 Concordia University
Research Chairs and 19 other Research Chairs and Distinguished Professorships (all numbers are as of
March 2011).
Sources:
Canada Research Chairs: Chair Holder Profiles (November 2010); Concordia University’s Office of
Research

83
Sources: Canada Research Chairs, Chair Holder Profiles (November 2010); Concordia University's Office of Research
4
9
13
15 1515
24
16
1312
16
20
Concordia Carleton York UQAM Victoria Simon Fraser
Tier One Tier Two
Overall Average: Tier One = 12Tier Two = 17
Figure 38: Comparative Number of Canada Research Chair Holders, 2010/11
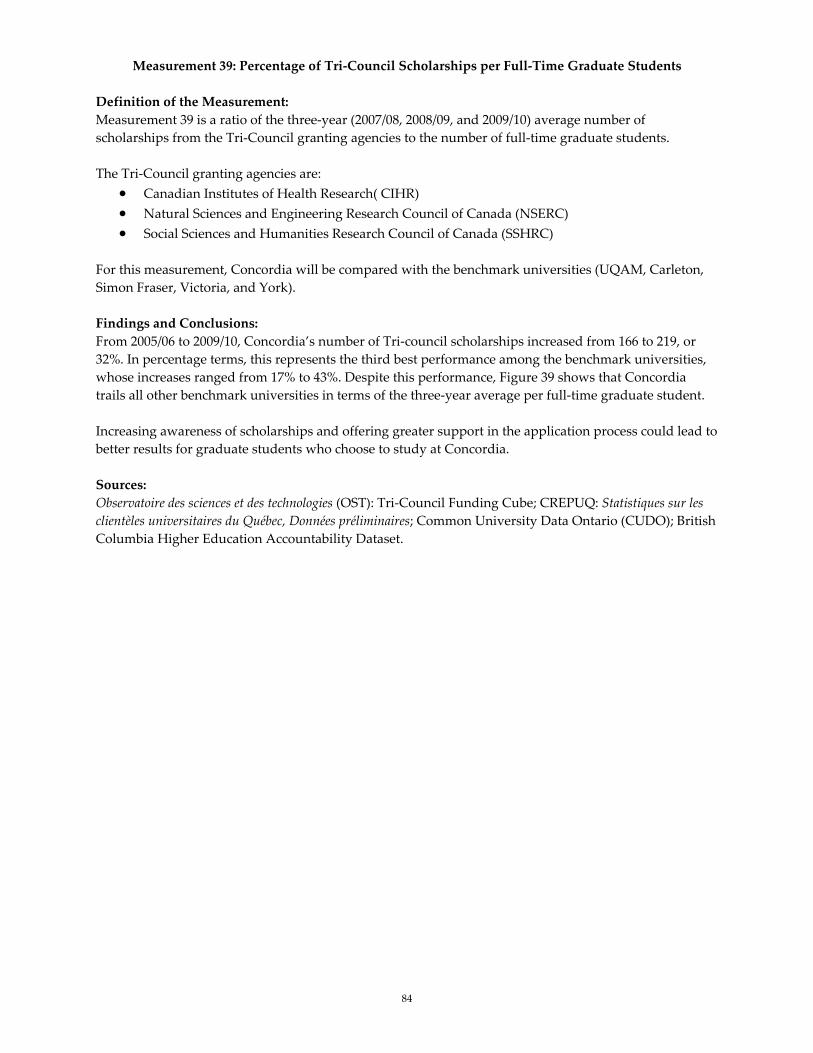
84
Measurement 39: Percentage of Tri‐Council Scholarships per Full‐Time Graduate Students
Definition of the Measurement:
Measurement 39 is a ratio of the three‐year (2007/08, 2008/09, and 2009/10) average number of
scholarships from the Tri‐Council granting agencies to the number of full‐time graduate students.
The Tri‐Council granting agencies are:
Canadian Institutes of Health Research( CIHR)
Natural Sciences and Engineering Research Council of Canada (NSERC)
Social Sciences and Humanities Research Council of Canada (SSHRC)
For this measurement, Concordia will be compared with the benchmark universities (UQAM, Carleton,
Simon Fraser, Victoria, and York).
Findings and Conclusions:
From 2005/06 to 2009/10, Concordia’s number of Tri‐council scholarships increased from 166 to 219, or
32%. In percentage terms, this represents the third best performance among the benchmark universities,
whose increases ranged from 17% to 43%. Despite this performance, Figure 39 shows that Concordia
trails all other benchmark universities in terms of the three‐year average per full‐time graduate student.
Increasing awareness of scholarships and offering greater support in the application process could lead to
better results for graduate students who choose to study at Concordia.
Sources:
Observatoire des sciences et des technologies (OST): Tri‐Council Funding Cube; CREPUQ: Statistiques sur les
clientèles universitaires du Québec, Données préliminaires; Common University Data Ontario (CUDO); British
Columbia Higher Education Accountability Dataset.
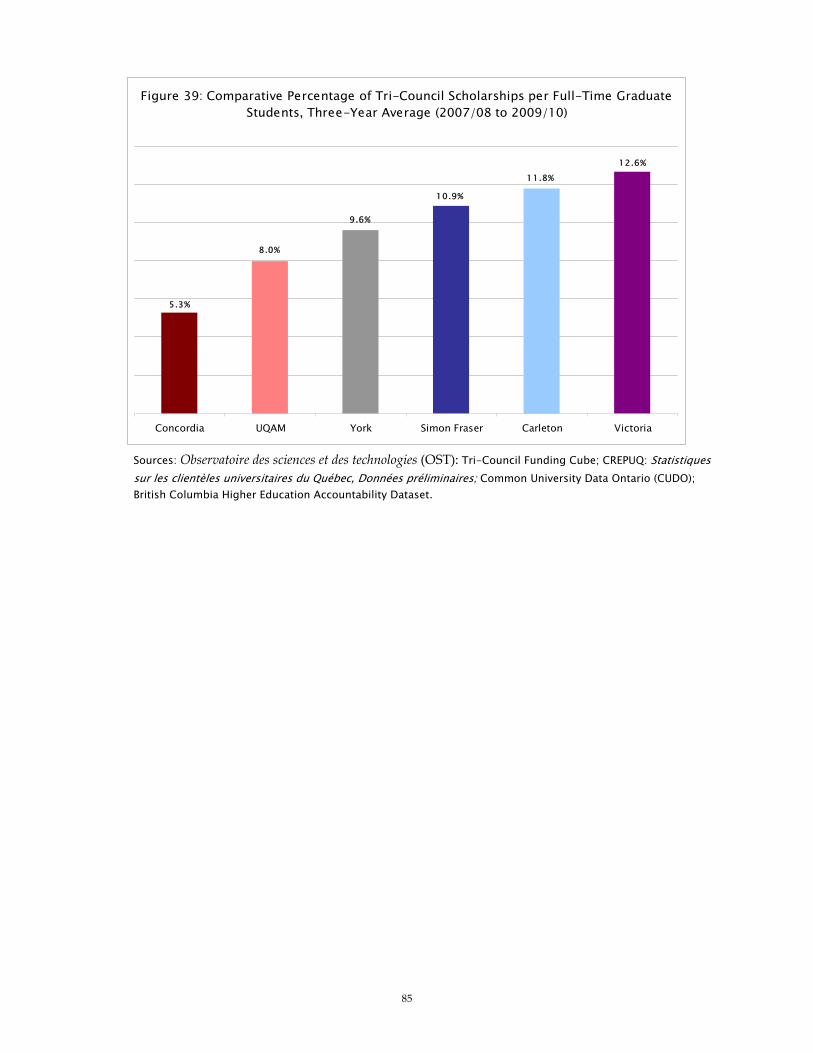
85
Sources: Observatoire des sciences et des technologies (OST): Tri-Council Funding Cube; CREPUQ: Statistiques sur les clientèles universitaires du Québec, Données préliminaires; Common University Data Ontario (CUDO); British Columbia Higher Education Accountability Dataset.
5.3%
8.0%
9.6%
10.9%
11.8%12.6%
Concordia UQAM York Simon Fraser Carleton Victoria
Figure 39: Comparative Percentage of Tri-Council Scholarships per Full-Time Graduate Students, Three-Year Average (2007/08 to 2009/10)
86
Measurement 40: International Visa Students
Definitions of Measurement
This measurement tracks, by cycle, the percentage of all degree‐seeking students who are identified as
international visa students.
An international student is a student from a foreign country who is studying at Concordia on a visa. Such
students take advantage of a wide variety of programs and fee structures.
This measurement does not track exchange (or visiting) students. Visiting students are only at Concordia
for a short period of time and, likewise, are also not pursuing a Concordia degree. As well, this
measurement does not track Concordia’s large population of permanent residents (non‐Canadians who
have been granted permission to live and work in Canada without any time limit and who therefore do
not require a visa).
There is no double counting in these figures. Full‐time status is favored over part‐time status where the
student was classified both ways during the academic year. Graduate status is favored over
undergraduate status where the student was registered in both levels of study in the same year. Where
students studied in multiple Faculties during the year, choice of Faculty is determined by the previous
two criteria. Minor differences between this year’s and previous year’s data result from ongoing updates
to student data in the Data Warehouse as well as the approach used this year to extract data.
Findings and Conclusions:
Figures 40.1 and 40.2 summarize the number of international students enrolled at Concordia University
between the 2006/07 and 2010/11 academic years in the form of head counts and percentage of degree‐
seeking students holding student visas.
We observe from the figures that the number of cycle 1 and cycle 3 international students has remained
relatively stable between 2006/07 and 2010/11. However, the number of cycle 2 international students has
been constantly increasing since 2008/09.
Although international visa students as a percentage total students for all cycles has been fairly stable
around 11%, there are differences between cycles. Cycle 1 international visa students represent about 9%
of the total; however, the proportion of international cycle 2 students has been increasing since 2007/08,
from 15.4% to 23.3% in 2010/2011. For cycle 3, the proportion of international students also began
increasing in 2007/08 but has leveled off the past 2 years.
Source:
Concordia University’s Data Warehouse
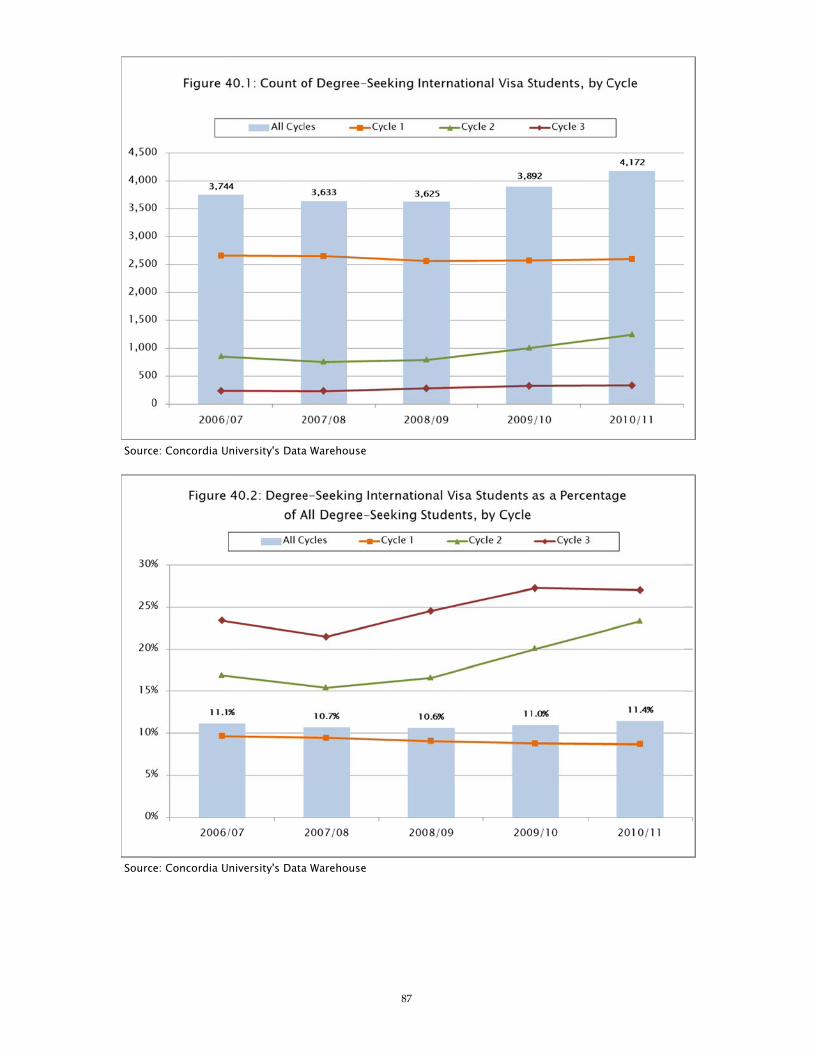
Sourc
Sourc
ce: Concordia U
ce: Concordia U
niversity's Data
niversity's Data
a Warehouse
a Warehouse
87
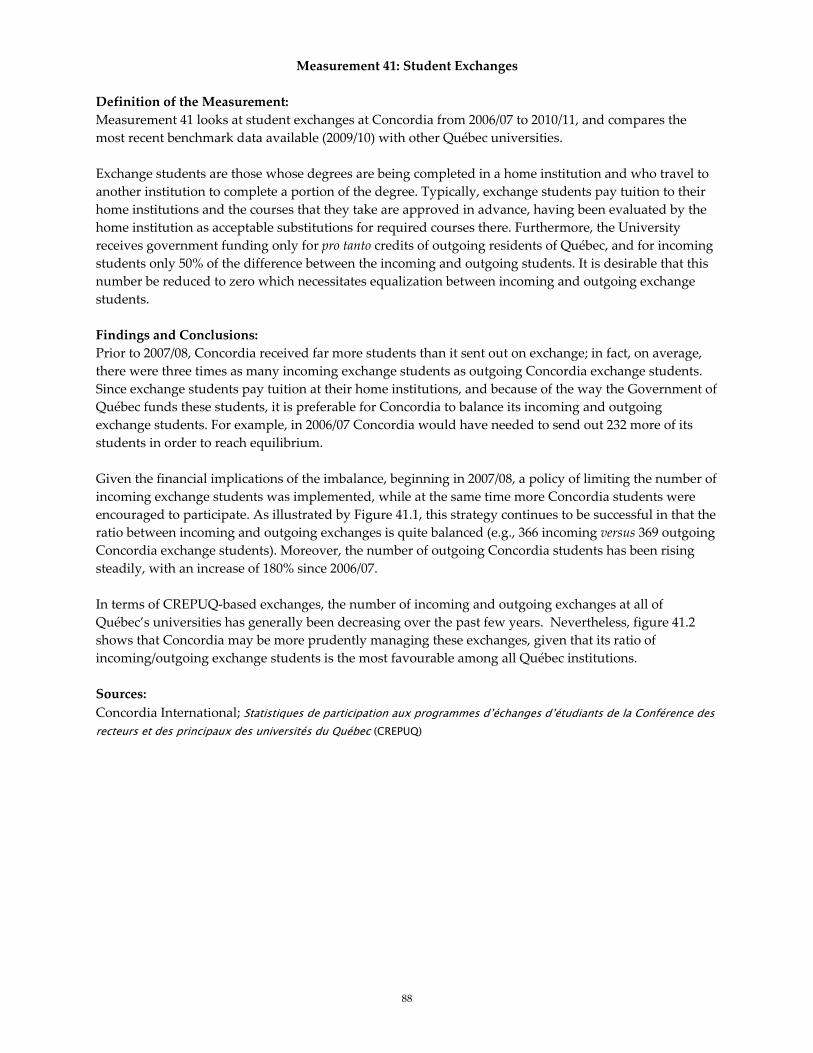
88
Measurement 41: Student Exchanges
Definition of the Measurement:
Measurement 41 looks at student exchanges at Concordia from 2006/07 to 2010/11, and compares the
most recent benchmark data available (2009/10) with other Québec universities.
Exchange students are those whose degrees are being completed in a home institution and who travel to
another institution to complete a portion of the degree. Typically, exchange students pay tuition to their
home institutions and the courses that they take are approved in advance, having been evaluated by the
home institution as acceptable substitutions for required courses there. Furthermore, the University
receives government funding only for pro tanto credits of outgoing residents of Québec, and for incoming
students only 50% of the difference between the incoming and outgoing students. It is desirable that this
number be reduced to zero which necessitates equalization between incoming and outgoing exchange
students.
Findings and Conclusions:
Prior to 2007/08, Concordia received far more students than it sent out on exchange; in fact, on average,
there were three times as many incoming exchange students as outgoing Concordia exchange students.
Since exchange students pay tuition at their home institutions, and because of the way the Government of
Québec funds these students, it is preferable for Concordia to balance its incoming and outgoing
exchange students. For example, in 2006/07 Concordia would have needed to send out 232 more of its
students in order to reach equilibrium.
Given the financial implications of the imbalance, beginning in 2007/08, a policy of limiting the number of
incoming exchange students was implemented, while at the same time more Concordia students were
encouraged to participate. As illustrated by Figure 41.1, this strategy continues to be successful in that the
ratio between incoming and outgoing exchanges is quite balanced (e.g., 366 incoming versus 369 outgoing
Concordia exchange students). Moreover, the number of outgoing Concordia students has been rising
steadily, with an increase of 180% since 2006/07.
In terms of CREPUQ‐based exchanges, the number of incoming and outgoing exchanges at all of
Québec’s universities has generally been decreasing over the past few years. Nevertheless, figure 41.2
shows that Concordia may be more prudently managing these exchanges, given that its ratio of
incoming/outgoing exchange students is the most favourable among all Québec institutions.
Sources:
Concordia International; Statistiques de participation aux programmes d’échanges d’étudiants de la Conférence des recteurs et des principaux des universités du Québec (CREPUQ)
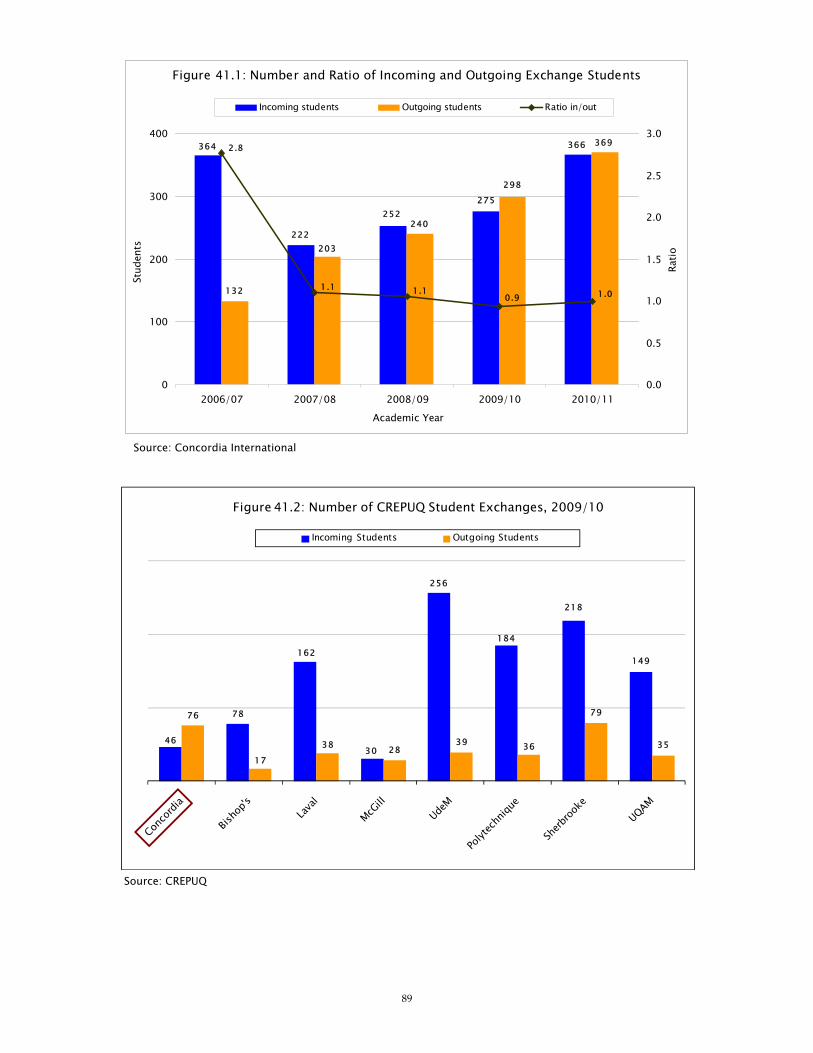
89
Source: Concordia International
Source: CREPUQ
364
222
252275
366
132
203
240
298
3692.8
1.1 1.10.9 1.0
0
100
200
300
400
2006/07 2007/08 2008/09 2009/10 2010/11Academic Year
Stud
ents
0.0
0.5
1.0
1.5
2.0
2.5
3.0
Ratio
Incoming students Outgoing students Ratio in/out
Figure 41.1: Number and Ratio of Incoming and Outgoing Exchange Students
46
78
162
30
256
184
218
149
76
1738 28
39 36
79
35
Incoming Students Outgoing Students
Figure 41.2: Number of CREPUQ Student Exchanges, 2009/10
90
Measurement 42: Facilities Condition Index
NOTE: There are no new data to report this year; data presented are those from Measuring Excellence
2008.
Definition of the Measurement:
This measurement provides a snapshot of the overall condition of Concordia’s buildings and facilities. It
is essential that the University’s facilities remain in good condition, which will help its researchers,
professors, and students develop their full potential. The “overall condition” of buildings and facilities is
derived using a formula called the Facilities Condition Index. The Facilities Condition Index (FCI) is
expressed as a percentage and consists of the dollar value of deferred maintenance over the estimated
replacement cost multiplied by 100. The index for 2006/07 was calculated as follows:
(($89,514,000 ÷ $810,028,000) x 100) = 11.1%
FCI data for Québec universities were obtained through a comprehensive province‐wide study covering
the 2006/07 fiscal year and published in January 2008 by the Conférence des recteurs et des principaux des
universités du Québec (CREPUQ). The report was prepared by the Groupe de travail sur lʹentretien différé
accumulé du Sous‐comité sur les ressources matérielles. It is expected that this will become an annual exercise.
Data for École Polytechnique and HEC are consolidated with those of UdeM.
The ideal FCI score would be 0 (zero deferred maintenance). Generally, a lower FCI score implies that an
institution has less financial risk or exposure to maintenance issues. According to the CREPUQ report, an
FCI between 2 and 5% is reflective of satisfactory overall condition; between 5 and 10% indicates potential
difficulty in meeting maintenance needs over the short to medium term, while 10% is considered the
threshold beyond which there will be substantial difficulty in managing and financing facilities
maintenance needs.
This study is the first of its kind in Québec and is based on government‐based definitions and criteria.
These types of studies have been undertaken previously in other Canadian provinces, most notably in
Ontario. FCI data for the major Ontario universities are presented; it should be noted, however, that there
are differences in definitions, methodology, and mechanisms for funding of capital projects such that
inter‐provincial FCI comparisons should be made with caution.
Findings and Conclusions:
Figure 42.1 shows that Concordia is in somewhat better standing than the other major institutions in the
province; nevertheless, it should be noted that long‐established universities such as McGill, UdeM, and
Laval would be expected to have a higher index owing to the age, size, and number of buildings.
It is notable that all but one of the Université du Québec institutions have indices less than 10% (UQAM =
5.9%), no doubt owing to the fact that many of these institutions are relatively young, having only been
created over the past 35 years. Concordia’s index is somewhat higher because of the age of the facilities
(average 29.5 years) inherited from its founding institutions. The province‐wide index is 21.0% with an
average age of 29.4 years.
Figure 42.2 shows a sample from the 2007 FCI report published by the Council of Ontario Universities.
Sources: CREPUQ: Évaluation de lʹentretien différé accumulé dans les universités québécoises ‐ Rapport produit
par le Groupe de travail sur lʹentretien différé accumulé du Sous‐comité sur les ressources matérielles ‐ 28 janvier
2008; Ontario Universities Facilities Condition Assessment Program as of March 2007 (published July
2007)

91
Source: Conférence des recteurs et des principaux des universités du Québec (CREPUQ) Note: The Facilities Condition Index (FCI) is calculated using the following formula: (DM ÷ RC) x 100, where DM = Deferred Maintenance and RC = Replacement Cost. A lower FCI score implies superior performance.
Source: Ontario Universities Facilities Condition Assessment Program as of March 2007 – published July 2007 Note: The Facilities Condition Index (FCI) is calculated using the following formula: (DM ÷ RC) x 100, where DM = Deferred Maintenance and RC = Replacement Cost. A lower FCI score implies superior performance.
46.0%
8.9%5.9%
25.8%
20.4%
11.1%
39.937.5
29.5 30.6
56.3
18.4
0%
10%
20%
30%
40%
50%
60%
McGill UdeM+ Laval Concordia Sherbrooke UQAM0
10
20
30
40
50
60
Year
s
Facilities Condition Index (%) Average Age of Facilities
Figure 42.1: Comparative Facilities Condition Index,Major Québec Universities, 2006/07
12.7%
10.1%
14.8%
13.2% 13.1%
11.4% 11.3%
9.4%
6.6%
5.0%
2.8%
McMaster Windsor Guelph Western Ottawa Carleton Toronto Ryerson Queen's York Waterloo
Figure 42.2: Comparative Facilities Condition Index, Major Ontario Universities, 2006/07
92
Measurement 43: Space Allocation
Note: Data presented here are those from Measuring Excellence 2008 since occupied and future space
has changed very little and updated data for normed space is still pending.
Definition of the Measurement:
This measurement considers currently occupied and future space for teaching, research, and
administrative facilities. The occupied and projected space values are then compared with the Québec
Government’s space norms.
“Government Norm” is the number of net square meters that are financed by the Government. Allocation
of financial resources for all Québec universities’ space needs is based on Full‐Time Equivalent (FTE)
students and FTE personnel. The number of course‐credits is used to calculate FTE students and the
average salary by category of personnel is used to calculate FTE personnel. These FTE students and
personnel are then weighted according to type of space (the principal ones being teaching space,
laboratories, offices, and library space), and category of personnel (teaching, administrative, technical).
Calculations are done with data from two years prior to allow for data processing and verification. The
Government calculations for space are made globally for the University and not by Department or
Faculty.
“Occupied Space” is the current number of net square meters devoted to each Faculty. The figure for
JMSB includes space used by privatized programs.
“Future Space” represents the future estimated occupied space of each Faculty according to current
planning up until approximately 2011.
Findings and Conclusions:
While Figure 43.1 shows some noticeable differences between normed (government funded) space and
occupied space, aggregating the numbers for all Faculties gives much smaller differences: 102.5 normed,
102.2 occupied, 107.0 future (in thousands of square meters). As previously noted, Government funding
for space is done globally for the University and not at the Department or Faculty level.
Figure 43.2 consists of the data from 43.1 with centrally‐managed classrooms and auditoriums added.
Sources:
Institutional Planning Office: Government Norms; Facilities Management: Occupied and Future Spaces;
Concordia University’s Portal Reports; Financial Services

93
Sources: Institutional Planning Office: Government Norms; Facilities Management: Occupied and Future Spaces; Concordia University’s Portal Reports; Financial Services
Sources: Institutional Planning Office: Government Norms; Facilities Management: Occupied and Future Spaces; Concordia University’s Portal Reports; Financial Services
19.0
8.1
38.736.7
102.5
27.4
102.2
40.1
29.8
4.9
30.5
42.5
107.0
8.6
25.4
Concordia - Total A&S E&CS FA JMSB
Government Norm Occupied Space Future Space
Figure 43.1: Comparative Space Allocation by FacultyExcluding Auditoriums and Centrally Managed Classrooms
(in Thousands of Square Meters)
132.3123.9123.6
GovernmentNorm Space
Occupied Space
Future Space
Figure 43.2: Total Space Allocation for Academic UnitsIncluding Auditoriums and Centrally Managed Space
(in Thousands of Square Meters)
94
Acronyms used in this Report
A&S:
Concordia’s Faculty of Arts and Science
AUCC:
Association of Universities and Colleges of Canada. The AUCC represents 95 Canadian public and
private not‐for‐profit universities and university‐degree level colleges. Additionally, the AUCC
coordinates other data‐sharing initiatives.
CAUBO:
Canadian Association of University Business Officers. Their quarterly publication, University
Manager, and annual report, Financial Information of Universities and Colleges, contain a wide
variety of comparative financial data.
CAUT:
Canadian Association of University Teachers. The CAUT publishes a yearly almanac of higher
education comparative statistics drawn from various sources, including Statistics Canada.
CEGEP:
Collège dʹenseignement général et professionnel, or in English ʺCollege of General and Professional
Education.”
CIHR:
Canadian Institutes of Health Research
CIPO:
Canadian Intellectual Property Office
COU:
Council of Ontario Universities
CRC:
Cote de Rendement au Collégial, known also as the “R‐score” provides a statistical correction to grades
received in Québec CEGEPs. Essentially, the CRC is a representation of the student’s position in the
grade distribution of the classes taken (the standard, or Z score), as well as the strength of the group
in which the grade was received compared with other groups taking equivalent classes.
CREPUQ:
Conférence des recteurs et des principaux des universités du Québec. The CREPUQ is a non‐governmental
body that represents all Québec institutions of higher education as a whole. They provide a breadth
of services, among which are student exchange agreements and institutional research at a provincial
level.
CSRDE:
The Consortium for Student Retention Student Exchange is a consortium of colleges and universities
dedicated to the cooperative exchange of student retention and graduation data for the purpose of
benchmarking. It is US‐based and consists of approximately 450 public and private four‐year and
two‐year institutions across North America including Canada, U.S., Guam, Puerto Rico, and the
Virgin Islands. The data submitted consist of the retention and graduation rates of first‐time*, full‐
time** baccalaureate degree‐seeking freshman cohorts aggregated by all disciplines (*students applying to
an institution for the first time, for full‐time studies into a Bachelor’s‐degree program; ** a student is
considered “overall full‐time” if he or she never dropped to part‐time status at any point in his or her
program).
CUDO:
Common University Data Ontario
95
CUSC:
The Canadian Undergraduate Survey Consortium undertakes a survey which covers a variety of
topics regarding the undergraduate student experience, including student satisfaction. There are 25
Canadian member universities. Since 1996, the survey has run in a three‐year cycle, with different
student populations targeted each year: all undergraduates, first‐year undergraduate students, and
graduating students. Concordia University has been a member of this consortium from its inception.
E&CS:
Concordia’s Faculty of Engineering and Computer Science
ETA:
Extended‐Term Appointment
ETS:
École de Technologie Supérieure
FA:
Concordia’s Faculty of Fine Arts
FCI:
Facilities Condition Index
FTE:
Full‐Time Equivalent (student)
FQRNT :
Fonds québécois de la recherche sur la nature et les technologies
FQRSC:
Fonds québécois de la recherche sur la société et la culture
GPA :
Grade Point Average
HEC:
Hautes Études Commerciales de Montréal
INRS:
Institut National de la Recherche Scientifique
JMSB:
Concordia’s John Molson School of Business
MAESTRO:
Modélisation, Analyse et Évaluation Stratégique des Organisations
MELS:
Ministère de lʹÉducation, du Loisir et du Sport du Québec
MOODLE:
Modular Object‐Oriented Dynamic Learning Environment
NSERC:
Natural Sciences and Engineering Research Council of Canada
NSSE:
The National Survey of Student Engagement (NSSE) is designed to obtain information from scores of
colleges and universities nationwide about student participation in programs and activities that
institutions provide for their learning and personal development. The results will provide an estimate
of how undergraduates spend their time and what they gain from attending college. Survey items on
The National Survey of Student Engagement represent empirically confirmed ʺgood practicesʺ in
undergraduate education. That is, they reflect behaviors by students and institutions that are
associated with desired outcomes of college.

96
OST:
LʹObservatoire des sciences et des technologies (OST) is an organization devoted to the measurement of
science, technology and innovation (STI). The Canadian Bibliometric Database (CBD)™. Constructed
by the OST using the Science Citation Index, Social Sciences Citation Index and the Arts and
Humanities Citation Index databases of the Institute for Scientific Information ISI©, the CBD lists
publications by Canadian researchers according to discipline, institution, collaborative partners, etc.
This database also supplies indicators on Canadian publications like volume of publications,
international or sectoral collaboration, impact factor, and specialization index.
SSHRC:
Social Sciences and Humanities Research Council of Canada
UA:
University of Alberta
UBC:
University of British Columbia
UdeM:
Université de Montréal
UdeM+:
Université de Montréal, including École Polytechnique, and HEC
UofT:
University of Toronto
UQAC:
Université du Québec à Chicoutimi
UQAM:
Université du Québec à Montréal
UQAO:
Université du Québec en Outaouais
UQAR :
Université du Québec à Rimouski
UQTR :
Université du Québec à Trois‐Rivières
U.S.:
United States of America
USPTO:
United States Patent and Trademark Office
UWO:
University of Western Ontario
WGPA :
Weighted Grade Point Average
97
Glossary of Terms used in this Report
Academic Year:
The University’s academic year is June 1st to May 31st.
Acceptance Rate:
The number of acceptances divided by the number of applications (see also Registration Rate).
Benchmark University:
Benchmark university data are presented to compare Concordia with other universities. For this
report, the benchmark universities are: UQAM, Carleton, Simon Fraser, Victoria, and York. When it is
not possible to present these five universities, aggregate data and/or other universities are presented.
Canada Research Chair:
The Government of Canada established the Canada Research Chairs program in 2000. The program
aims to create and provide research funding for 2,000 chairs positions for Canadian and foreign
academics in key academic fields, in order to give Canada a competitive edge in attracting, recruiting,
and retaining academics who are world leaders in their respective fields of expertise. There are two
tiers of research chairs: (a) Tier One chairs are seven‐year renewable at $200,000 per year; (b) Tier
Two chairs are five‐year, once‐renewable at $100,000 per year.
Canadian Association of University Business Officers (CAUBO):
CAUBO publishes a variety of information that is used in Measuring Excellence; specifically: the
annual report “Financial Information of Universities and Colleges” and the quarterly publication
“University Manager.” Both publications contain summary and detailed financial data. CAUBO‐
based data are considered reliable, but subject to the following caveat: there are differences in
budgetary/accounting procedures, institutional size, program, and organizational structures that may
impact comparability.
Citation Index:
An index that provides access to current and retrospective bibliographic information and cited
references. Thompson ISI citation indices include such information found in over 1,130 leading arts
and humanities journals, over 1,700 leading social sciences journals, and over 3,300 leading science
journals.
Cohort:
A cohort is a group of people who share a common characteristic or experience within a defined time
period (i.e., are born, leave school, lose their job, are exposed to a drug or a vaccine, etc.). Thus, a
group of students who begin their studies at Concordia in the same year (e.g., 2004) form a student
cohort. The comparison group for this cohort might be all high school graduates in 2004, or all
students entering a Canadian university in 2004. Alternatively, subgroups within the cohort may be
compared with each other.
Comprehensive University:
A comprehensive university is a large‐size university having a significant amount of research activity
and a wide range of programs at the undergraduate and graduate levels, [often] including
professional degrees but excluding medical programs. Twelve Canadian universities are classified as
comprehensive: Carleton University, Concordia University, University of Guelph, Memorial
University, University of New Brunswick, Simon Fraser University, Université du Québec à
Montréal, University of Regina, University of Victoria, University of Waterloo, University of
Windsor, and York University.
Constant Dollars:
Constant dollars are a metric used for comparing costs or income over time, taking into consideration
inflation or deflation. Specifically, the term refers to dollars whose value is linked to a given year.
Constant dollars are calculated with Consumer Price Index (CPI) of June 2002=100.0. Measurements
4, 5, 6, 17, 21, 30, 35, 36, and 37 use constant dollars.
98
Correlation:
A correlation is a statistical measure, ranging in value from 1 to ‐1 that describes the degree of
relationship or association between two measures. A positive value describes a relationship in which
an increase in one variable corresponds with an increase in the other; a negative value describes a
relationship in which an increase in one variable corresponds with a decrease in the other. A
correlation of zero implies that there is no relationship between the variables. A non‐zero correlation
does not imply causation, that is to say that one measure causes the other to change.
Cycle One:
“Cycle One” refers to undergraduate studies. This includes independent, visiting, undergraduate
certificate, and baccalaureate programs.
Cycle Two:
“Cycle Two” refers to all graduate level studies prior to the doctoral level. This includes independent,
visiting, qualifying, graduate certificate, diploma, and master’s programs.
Cycle Three:
“Cycle Three” refers to doctoral level studies. This includes visiting, doctoral, and post‐doctoral
programs.
Data Warehouse:
Data Warehouse is the nickname for Concordia’s Executive Information System database. The Data
Warehouse is a collection of university data from various sources collected in data tables in a central
location and updated at regular intervals. It includes:
Extracted, detailed data from operational systems
Summarized data at different levels
Integrated data that are consistent across different operational systems
Time‐variant (i.e., historical) data that allow trend analysis
Distance Course:
Refers to a course offered by the University, but not presented on‐campus.
E‐Learning:
E‐Learning can be broadly understood as computer‐enhanced learning.
Effect size:
When sample sizes are large, it is likely that a small difference will be statistically significant. In these
cases, the effect size statistics are often thought of as a measure of practical significance because they
indicate the relative magnitude of the difference.
Endowment:
Gifts of money where the capital sum is to be invested and held in perpetuity, and only the
distributed income is to be spent.
Extended‐Term Appointment (ETA):
Extended‐Term Appointments of full‐time faculty are meant to fill an on‐going full‐time teaching and
service need. Internal ETAs are normally hired for approximately five years, while external ETAs are
normally hired for approximately three years, renewable at five.
Facilities Condition Index (FCI):
The Facilities Condition Index is calculated by dividing the deferred maintenance on all buildings
owned by Concordia by their replacement value, then multiplying the result by 100. A 5.87 index
would mean that Concordia faces $58,700 in deferred maintenance for every $1 million in building
value (5.87 = (58,700 ÷
1,000,000) x 100).
Financial Sector:
The Québec Ministère de l’Éducation, du Loisir, et du Sport (MELS) currently divides all university
disciplines into financial sectors. Concordia receives government funding for teaching (enseignement)
and support (soutien) grants based on a weighting of FTE students by financial sector.

99
Fiscal Year:
Beginning in 2010/11, the University’s fiscal year was changed to a May 1st to April 30th cycle from a
June 1st to May 31st year.
FirstClass:
“FirstClass” is an e‐learning system in JMSB at Concordia that enables instructors to create and
manage a course web site for: posting documents (for example, reading lists, PowerPoint slides, and
images); managing online discussions, and running quizzes, polls, and surveys.
Full‐time Equivalent Personnel:
Full‐time equivalent personnel numbers are used in the calculation of space norms. They are based
on the ratio of each employeeʹs salary to the average salary for his/her category.
Full‐time Equivalent Student:
An FTE is a unit of measure used to describe enrolments. It is used by governments to determine the
level of funding provided to universities. For Québec institutions, the total number of FTEs at the
University is given by summing all registered credits in a given year, and dividing by 30. For all first
cycle programs and course‐based second cycle programs, FTE is based on the number of credits
taken; for second‐ and third‐cycle thesis programs, 11.25 credits are attributed for each term a student
is registered, up to a maximum of 45 credits for a Master’s student and 90 credits for a Ph.D. student.
Once these credits are exhausted, the student may still be in residence at Concordia, but ceases to
generate FTEs. For example, a full‐time undergraduate student generates one FTE during an
academic year, while a part‐time undergraduate who registers for 15 credits during the year
generates 0.5 FTE. This is methodology is used to report FTEs in Measurement 13 (FTE Student
Enrolment by Faculty)
Since the method of calculating FTEs varies by province and institution, we have adopted the
Statistics Canada method of FTE calculation for measurements involving inter‐institutional
comparisons. Statistics Canada calculates FTE students as follows: it recognizes any full‐time student
as one FTE and three and one‐half part‐time students as one FTE. Moreover, we have based the
calculation on fall‐semester enrolment figures obtained from the following independent sources:
CREPUQ: Données preliminaries (Concordia and UQAM); Common University Data Ontario – CUDO
(Carleton and York); British Columbia Higher Education Accountability Dataset (Simon Fraser and
Victoria).
Full‐time, Continuing Professor:
A professor who is hired with tenure, hired into a tenure track, or hired as an extended‐term
appointment is considered a full‐time, continuing professor. Tenured professors are those who have
been granted permanent appointments by Concordia’s Board of Governors. Tenure‐track professors
are those hired on a probationary basis. Most often, these professors are engaged on a three‐year
contract that is renewable once. During the period of the second contract, these professors are eligible
to apply for tenure. Extended‐Term professors are those holding three‐to five‐year renewable
contracts. A professor is included as a full‐time, continuing professor if he or she held an academic
appointment at one of the specified appointment positions as of the government reporting date of
October 1st. Numbers vary from one year to another because of hiring, retirements, deaths, and
departures. Other full‐time professors, such as those holding visiting, research, or limited‐term
appointments (9.5 to 36 months), are excluded.
Full‐Time Permanent Administrative and Support Staff:
Full‐time permanent administrative and support staff include all personnel in payroll groups that are
permanent or on contracts that are deemed permanent by virtue of having contracts of 12 months or
greater. They include all personnel in the following payroll groups: ACUMAE, CULEU, CUPEU,
CUSSU, NUMACE, CUUSS‐TS, RESEARCH, SCOMM, SCOMM‐MT, and SSG.
Full‐Time Student (Overall):
A student is considered “overall full‐time” if he or she never dropped to part‐time status at any point
in his or her program, except the last term before graduation. A student is full‐time for the term if
they take 12 credits a term (undergraduate) or eight credits a term (graduate). Also, for a student to
100
be full‐time for the academic year they must be registered for more than one term and take 24 or 16
credits or more, respectively. Graduate students registered in thesis‐based programs on a full‐time
basis remain full‐time status for the duration of their studies, while those entering part‐time remain
part‐time.
Future Space:
The future estimated space needs for each faculty.
G13:
The “G13” universities, which call themselves “Canada’s thirteen most research‐intensive
universities,” formed their own data‐sharing consortium in 1999 that currently excludes Concordia.
Government Norm (Space):
The government norm is the number of net square meters financed by the Government of Québec
based on (a) FTE students by cycle of studies and (b) FTE personnel professors by average salary of
personnel category. Norms are established by category of space and then applied to FTE values, both
students and professors.
Graduate Level:
The graduate level includes many categories of students studying in cycle two and cycle three:
doctoral, master’s, diploma, graduate certificate, qualifying year, independent, and visiting students.
Graduation Rate:
A graduation rate is the percentage of students admitted in a given academic year and session who
graduate within a specified period of time. For example, the five‐year graduation rate for full‐time
undergraduate students admitted in fall 2001 is the percentage completing their studies before the fall
of 2006. Those who have not graduated either have discontinued their studies (perhaps temporarily)
or are still working toward a degree, due to interruptions or program changes. Such an analysis will
typically be limited to students classified as overall full‐time (as is the case for the Consortium for
Student Retention Student Exchange (CSRDE)), since inclusion of part‐time students will result in a
lower graduation rate.
Impact Factor:
A metric used to estimate the reach of a particular journal article. Calculated each year by the Institute
for Scientific Information for the journals it index. It is calculated by taking the number of times
articles published in the previous two years was cited in the current year, and divides this number by
the number of articles published during the previous two years. Use of this metric is not without
debate, and is currently being used at Concordia only for inter‐institutional benchmarking.
International Student:
For the purposes of this report, international student refers to students who are studying at
Concordia on a visa. A further distinction is made in this report between short‐term visa students
(exchange students) and those studying for a Concordia degree.
Likert Scale:
A typical question using a Likert Scale will make a statement and ask the reader to rate the extent
he/she agrees or disagrees with the statement. The respondent is offered a number of options in the
form of a labeled range of values, for example: 1=strongly disagree, 2=disagree, 3=not sure, 4=agree,
and 5=strongly agree.
Limited‐Term Appointment:
Limited‐Term Appointments of full‐time faculty are made to (a) replace a faculty member on leave,
(b) fill an open tenure‐track position during the course of the search, or (c) respond to specific
teaching, and where appropriate, service, research, scholarly, or creative need. Academic year
appointments are for 9.5 months, with renewals at 12 months up to a maximum of 36 months.
Margin of Error:
The margin of error measures the random sampling error in a survey’s result. It relates to the
accuracy of an estimate of a population parameter such as the percentage. The larger the margin of
error, the less confidence one should have that the survey’s results are close to the figures for the
whole population. For example, a sample mean of 49 with a margin of error of ± 1.20 allows
confidence that 95 times out of 100, the population mean will lie in the range 47.8 (49 ‐ 1.2) and
101
50.2 (49 + 1.2). The margin of error is related to standard error (see definition). Essentially, the margin
of error for a level of confidence of 95% is ±1.96 times the standard error.
Missing Values:
A missing value indicates that no data are available for a variable for the observation in question.
Modular Object‐Oriented Dynamic Learning Environment (MOODLE):
MOODLE is an e‐learning system at Concordia that enables instructors to create and manage a course
web site for: posting documents (for example, reading lists, PowerPoint slides, and images);
managing online discussions, and running quizzes, polls, and surveys.
Moving Average:
Mean value, as calculated over a rolling previous period of fixed length. This is used in order to
discern trends by flattening out large fluctuations.
Non‐Credit Courses:
Non‐credit courses are offered where no credit toward a degree is given. The Centre for Continuing
Education serves the largest number of non‐credit students, but non‐credit courses are also offered by
e‐Concordia. Several hundred degree‐seeking students simultaneously enroll each year in non‐credit
courses for a variety of reasons.
Occupied Space:
The actual number of net square meters devoted to each faculty.
Online Course:
Refers to a course offered where the mode of communication for course content and evaluation is
online.
Overall Full‐Time Student:
Please see Full‐Time Student (Overall).
Oversampling:
A sampling procedure designed to give a demographic or geographic population a larger proportion
of representation in the sample than the populationʹs proportion of representation in the overall
population. Oversamples are often used to study the attitudes or behavior of groups that make up a
small proportion of the total population. For example, it might be desirable to oversample
Francophone students in a study on student satisfaction, or people aged 65 and over for a study
about retiree studying at the university.
Permanent Resident:
A Permanent Resident is not a Canadian citizen but has been granted permission to live and work in
Canada without any time limit on his or her stay. In this report, students who are permanent
residents are excluded from analyses pertaining to international students.
Privatized Program:
A privatized program is one where the university receives no enrolment‐based funding from the
Québec government. Tuition fees thus reflect program operating costs. These programs exist only in
the second cycle of JMSB.
Pro Tanto:
Pro tanto credits are credits for courses taken at another institution (or in another Concordia
program) that may be transferred towards a Concordia degree.
Registration Rate:
The number of registrations divided by the number of acceptances (see also Acceptance Rate).
Retention Rate:
The percentage of students in a particular group who re‐enroll in subsequent terms. For example, the
first year retention rate of full‐time undergraduate students admitted to fall 2001 is the percentage
who re‐enrolled (for second year) in fall 2002. The third and subsequent year retention rates are based
on the same fall 2001 cohort.
Standard Error
The standard error measures the accuracy of an estimate of a population parameter such as the mean.
The standard error is the estimated standard deviation of a statistic. For example, the standard error
of a sample mean is the sample standard deviation divided by the square root of the sample size. If
102
we have a sample mean of 49 with a standard error of 1.2, we are confident that approximately 66
times out of 100, the population mean will lie in the range 47.8 (49 ‐ 1.2) and 50.2 (49 + 1.2). The
standard error is related to margin of error (see definition).
Student Exchanges:
Concordia has bilateral exchange agreements with over 96 institutions around the world. Concordia
students also have access to a wide variety of host institutions through CREPUQ exchange
agreements. The home and host institutions work together to assure that the agreed upon credits
taken while on exchange will be transferred to the home institution. Normally, the home, rather than
the host, institution receives tuition for the exchange student. In Québec, the government funds the
difference between incoming and outgoing exchange students who are Québec residents at 50%, an
amount that has been slated for elimination.
Tenured, Tenure‐Track Professor:
Tenured professors are those who have been granted permanent appointments by Concordia’s Board
of Governors. Tenure‐track professors are those hired on a probationary basis. Most often, these
professors are engaged on a three‐year contract that is renewable once. During the period of the
second contract, these professors are eligible to apply for tenure.
Tri‐Council:
Tri‐council refers to the three major federal academic funding agencies: The Canadian Institutes of
Health Research (CIHR), The Natural Sciences and Engineering Research Council (NSERC), and The
Social Sciences and Humanities Research Council (SSHRC). The Tri‐Council has developed a
memorandum of understanding with universities regarding ʺpolicies that define the standard of
accountability in such areas as research integrity, research involving human and animal subjects, and
fiscal responsibility.”
Top‐Line Findings:
A summary of survey results that consists solely of descriptive statistics.
Top‐two or Top‐three Results:
For survey data, most often the percentage of the top two or top three scale points combined are
presented (for example, “Strongly agree” and “Agree” percentages are combined/added to produce
the “top two” result, and “Completely”, “Moderately” and “Somewhat” are combined to indicate the
“top three”). Top two results are often used as a standard way of presenting and tracking survey
results.
Undergraduate Level:
The undergraduate level includes many categories of students studying in cycle one: bachelor,
undergraduate certificate, independent, and visiting students.
Unweighted Full‐Time Equivalent Student:
Please see Full‐Time Equivalent Student.
Valid Percentage:
A valid percentage is calculated using only those respondents who actually answered the question.
Missing values are not included. For example, if 50 students are asked if they had learned anything
and 42 said yes, 5 said no, and 3 did not answer, the valid percentage would be based on the 42
students who said “yes” and the 47 students who actually responded i.e. (42 ÷ 47) x 100 or 89.2%.
Visa Student:
Please see International Student.
Weighted Full‐Time Equivalent Student:
A weighted FTE is based on each student FTE which is multiplied by a factor determined by the cycle
of the student’s program (or programs) and the financial sector of the program in which the student
is enrolled. Through this method, the Government of Québec attempts to fund universities through
the education (enseignement) and the support (soutien) grants based on their analysis of the actual cost
of providing services in the different financial sectors. A table containing these weightings as they
currently stand is presented below.
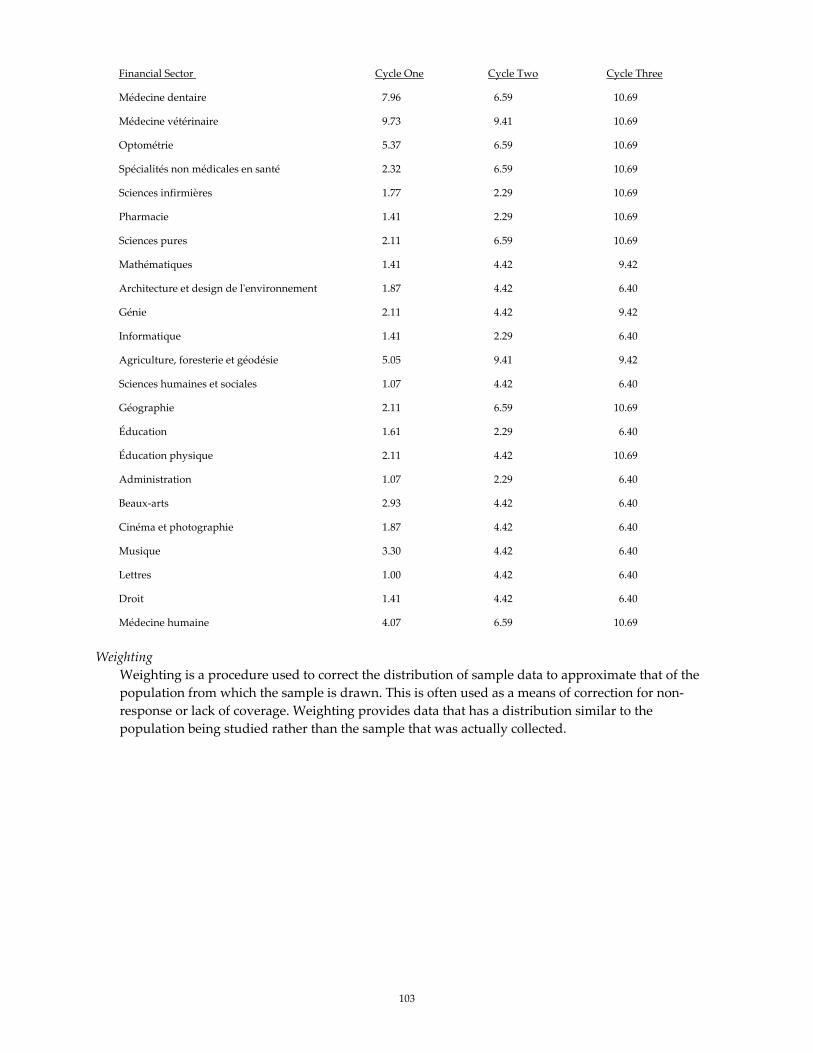
103
Financial Sector Cycle One Cycle Two Cycle Three
Médecine dentaire 7.96 6.59 10.69
Médecine vétérinaire 9.73 9.41 10.69
Optométrie 5.37 6.59 10.69
Spécialités non médicales en santé 2.32 6.59 10.69
Sciences infirmières 1.77 2.29 10.69
Pharmacie 1.41 2.29 10.69
Sciences pures 2.11 6.59 10.69
Mathématiques 1.41 4.42 9.42
Architecture et design de lʹenvironnement 1.87 4.42 6.40
Génie 2.11 4.42 9.42
Informatique 1.41 2.29 6.40
Agriculture, foresterie et géodésie 5.05 9.41 9.42
Sciences humaines et sociales 1.07 4.42 6.40
Géographie 2.11 6.59 10.69
Éducation 1.61 2.29 6.40
Éducation physique 2.11 4.42 10.69
Administration 1.07 2.29 6.40
Beaux‐arts 2.93 4.42 6.40
Cinéma et photographie 1.87 4.42 6.40
Musique 3.30 4.42 6.40
Lettres 1.00 4.42 6.40
Droit 1.41 4.42 6.40
Médecine humaine 4.07 6.59 10.69
Weighting
Weighting is a procedure used to correct the distribution of sample data to approximate that of the
population from which the sample is drawn. This is often used as a means of correction for non‐
response or lack of coverage. Weighting provides data that has a distribution similar to the
population being studied rather than the sample that was actually collected.

104
Appendix A: Detailed Description of Report Sections
Section 1: Definition of the Measurement
Describes the measure(s) in general and explains how the measurement (and benchmark measure, if
applies) were calculated or derived. Any qualifications are also described.
Section 2: Findings and Conclusions
Overall Concordia level results are presented first, followed by findings related to benchmark data at this
level. If appropriate, breakdowns at lower levels (e.g., Faculty) are presented.
In most cases, only five years are shown for trend data with the possibility of one earlier data point prior
to the five years. Exceptions are made in view of very slowly developing trends such as the areas of:
budget, faculty retention, and patents, or when data are not available.
For survey data, valid percentages will be shown (i.e., percentages calculated using only those
respondents who actually answered the question); missing values (i.e., no data are available for a variable
for the observation in question) are not included. Unless otherwise specified, “neutral” scale points are
included in the statistical analyses, and “don’t know” and/or “not applicable” responses are excluded.
Regarding benchmark data: (1) whenever possible, the following five universities are used as
benchmarks: UQAM, Carleton, Simon Fraser, Victoria , and York (universities designated by Concordia’s
Executive group as the most relevant comparisons for Concordia); (2) benchmark data provided by a
consortium will normally be presented as aggregate data; and (3) when two or more of the five
designated benchmark universities are not available or when aggregate benchmarks are not provided,
other universities may be selected for comparison, such as universities identified as “comprehensive”
(i.e., large‐sized Canadian universities having a significant amount of research activity and a wide range
of programs at the undergraduate and graduate levels, [often] including professional degrees but
excluding medical programs). Except where indicated, aggregate benchmarks include Concordia’s data
in the calculation.
Further statistical analyses will be conducted after the report is completed to provide supplemental
results for action‐planning purposes.
Section 3: Source
Lists the internal and/or external data source(s) that apply to the measurement.
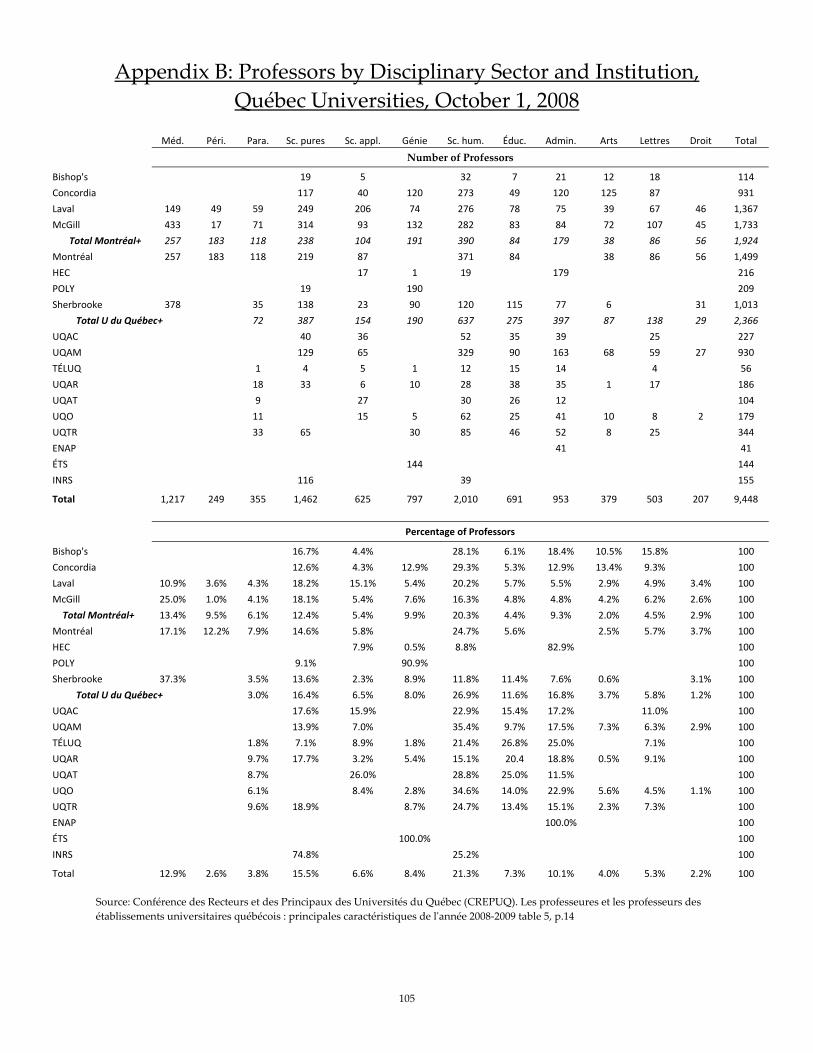
105
Appendix B: Professors by Disciplinary Sector and Institution,
Québec Universities, October 1, 2008
Méd. Péri. Para. Sc. pures Sc. appl. Génie Sc. hum. Éduc. Admin. Arts Lettres Droit Total
Number of Professors
Bishop's 19 5 32 7 21 12 18 114
Concordia 117 40 120 273 49 120 125 87 931
Laval 149 49 59 249 206 74 276 78 75 39 67 46 1,367
McGill 433 17 71 314 93 132 282 83 84 72 107 45 1,733
Total Montréal+ 257 183 118 238 104 191 390 84 179 38 86 56 1,924
Montréal 257 183 118 219 87 371 84 38 86 56 1,499
HEC 17 1 19 179 216
POLY 19 190 209
Sherbrooke 378 35 138 23 90 120 115 77 6 31 1,013
Total U du Québec+ 72 387 154 190 637 275 397 87 138 29 2,366
UQAC 40 36 52 35 39 25 227
UQAM 129 65 329 90 163 68 59 27 930
TÉLUQ 1 4 5 1 12 15 14 4 56
UQAR 18 33 6 10 28 38 35 1 17 186
UQAT 9 27 30 26 12 104
UQO 11 15 5 62 25 41 10 8 2 179
UQTR 33 65 30 85 46 52 8 25 344
ENAP 41 41
ÉTS 144 144
INRS 116 39 155
Total 1,217 249 355 1,462 625 797 2,010 691 953 379 503 207 9,448
Percentage of Professors
Bishop's 16.7% 4.4% 28.1% 6.1% 18.4% 10.5% 15.8% 100
Concordia 12.6% 4.3% 12.9% 29.3% 5.3% 12.9% 13.4% 9.3% 100
Laval 10.9% 3.6% 4.3% 18.2% 15.1% 5.4% 20.2% 5.7% 5.5% 2.9% 4.9% 3.4% 100
McGill 25.0% 1.0% 4.1% 18.1% 5.4% 7.6% 16.3% 4.8% 4.8% 4.2% 6.2% 2.6% 100
Total Montréal+ 13.4% 9.5% 6.1% 12.4% 5.4% 9.9% 20.3% 4.4% 9.3% 2.0% 4.5% 2.9% 100
Montréal 17.1% 12.2% 7.9% 14.6% 5.8% 24.7% 5.6% 2.5% 5.7% 3.7% 100
HEC 7.9% 0.5% 8.8% 82.9% 100
POLY 9.1% 90.9% 100
Sherbrooke 37.3% 3.5% 13.6% 2.3% 8.9% 11.8% 11.4% 7.6% 0.6% 3.1% 100
Total U du Québec+ 3.0% 16.4% 6.5% 8.0% 26.9% 11.6% 16.8% 3.7% 5.8% 1.2% 100
UQAC 17.6% 15.9% 22.9% 15.4% 17.2% 11.0% 100
UQAM 13.9% 7.0% 35.4% 9.7% 17.5% 7.3% 6.3% 2.9% 100
TÉLUQ 1.8% 7.1% 8.9% 1.8% 21.4% 26.8% 25.0% 7.1% 100
UQAR 9.7% 17.7% 3.2% 5.4% 15.1% 20.4 18.8% 0.5% 9.1% 100
UQAT 8.7% 26.0% 28.8% 25.0% 11.5% 100
UQO 6.1% 8.4% 2.8% 34.6% 14.0% 22.9% 5.6% 4.5% 1.1% 100
UQTR 9.6% 18.9% 8.7% 24.7% 13.4% 15.1% 2.3% 7.3% 100
ENAP 100.0% 100
ÉTS 100.0% 100
INRS 74.8% 25.2% 100
Total 12.9% 2.6% 3.8% 15.5% 6.6% 8.4% 21.3% 7.3% 10.1% 4.0% 5.3% 2.2% 100
Source: Conférence des Recteurs et des Principaux des Universités du Québec (CREPUQ). Les professeures et les professeurs des
établissements universitaires québécois : principales caractéristiques de lʹannée 2008‐2009 table 5, p.14