Embed Size (px)
Citation preview

MEASURING EFFECTS OF MOBILE MARKETS ON HEALTHY FOOD CHOICES
November 2013
Dr. Lydia Zepeda Department of Consumer Science, University of Wisconsin-Madison Anna “Alice” Reznickova Nelson Institute of Environmental Studies, University of Wisconsin-Madison
Author Contact: Lydia Zepeda, [email protected] 1-608-262-9487USDA Contact: Luanne Lohr, [email protected] 1-202-690-4142
Recommended Citation: Zepeda, Lydia, and Anna Reznickova, Measuring Effects of Mobile Markets on Healthy Food Choices. Madison, University of Wisconsin, November 2013. Web. http://dx.doi.org/10.9752/142.11-2013 Acknowledgements: This work was supported by Cooperative Agreement Number 12-25-A-5637 with the Agricultural Marketing Service of the U.S. Department of Agriculture.
Disclaimer: The opinions and conclusions expressed do not necessarily represent the views of the U.S. Department of Agriculture or the Agricultural Marketing Service

1

2
EXECUTIVE SUMMARY
What Is the Issue?
About 40 mobile markets have sprung up around the US in the past few years as a strategy to provide healthy food choices to communities identified as food deserts – communities with a low food access. These communities are mostly poor, often minority and frequently have high levels of nutrition related illnesses, such as obesity, heart disease, and type II diabetes. Mobile markets in the form of buses, trucks, or semi-trailers outfitted with refrigeration, cash registers, credit and electronic transfers retailing equipment are a lower cost alternative to establishing brick-and-mortar stores to provide healthy food access to multiple locations. In fact, one of the earliest mobile markets, People’s Grocery’s mobile market Oakland, California started as a plan for a brick and mortar store; those plans were changed to a mobile market in response to a lack of funding (Community Commons, 2012). However, studies of whether and how effective mobile markets are in providing greater access to fresh foods or increasing farm sales are scarce. The goal of this cooperative agreement with the USDA Agricultural Marketing Service (AMS) was to investigate whether mobile food markets may be effective in facilitating healthy food choices to their communities. The objectives of the research were to: (1) understand who does and who does not use mobile markets and why, and (2) investigate whether mobile produce markets have the potential to alter attitudes and food choices, and if so, how.
What Did the Study Find?
For the participants in this study, mobile markets facilitated healthy eating in food deserts; on average, those who shopped at mobile markets (shoppers) ate significantly more fruits and vegetables than those who did not (non-shoppers). However, neither shoppers nor non-shoppers ate the recommended 9 servings per day by the Centers for Disease Control and Prevention (2012). Our study found that not only did participants not know how many servings they should eat, they were also confused about what a serving was, and in some cases lacked cooking skills to prepare healthy foods and in others, particularly among seniors, lacked motivation to cook. Policy makers could therefore facilitate increased fruit and vegetable consumption by supporting education and outreach programs that: provide simple guidelines about recommended services, offer materials illustrating serving sizes, demonstrate cooking skills and facilitate shared cooking. Collaboration with mobile markets to deliver these programs represents an opportunity to provide information, skills, motivation and access to fruits and vegetables through a single venue. The results indicated affordability is crucial; the participants shopped at national chain grocery stores and searched for bargains, promotions and coupons due to limited budgets. Mobile markets need to be competitive on price and quality with such stores; they also need to be sensitive to household budget pressures particularly at the end of the month when food assistance has been spent. The mobile markets can do this by providing specials and discounts focusing particularly at the end of the month, when many people are waiting for their next paycheck or benefits. Farmers’ Market WIC and Senior Farmers’ Market food assistance programs provide additional benefits to vulnerable groups, but can only be used at mobile markets that are

3
affiliated with farms. Policy makers could facilitate greater purchase of healthier foods by extending these programs to all mobile markets. While mobile markets are seen largely as convenient, most only operate on weekdays, so adding stops on the weekend would allow more people to shop there. More work is needed to determine the most convenient days and times to operate mobile market to reach the most customers. In addition, including staples such as milk and bread among the items offered would both bring in more customers and make shopping easier. This is a problem for seniors and others who have problems with transportation, particularly in the winter. Adding staples reduces the space for fruits and vegetables and could require more refrigeration, so more work is needed to determine the optimal mix of products. Participants in this study were largely unaware of the missions of mobile markets. They were impressed when they understood that the mobile markets were non-profits that aim to improve food access, especially if the market had programs to target seniors and children. Therefore, mobile markets can enhance their reputation by letting communities know they are non-profits and by including stops by schools and senior homes. School stops are perfect opportunity to provide education programs and sell healthy snacks; some children used the opportunity to do the family shopping. Mobile markets can provide healthy foods to seniors with kitchen access and health snacks to those without. Revenues from stops at schools and senior centers may be low given limited purchases for snacks or seniors living alone. Policy makers could assist by providing incentives to mobile markets to serve these institutions for seniors and children to foster education and cooking skills. Findings indicate that in order to increase potential customer awareness, mobile markets need to focus on publicity and advertising. Strategies that would enhance their operations include: providing information about locations, times, products and prices in advance, using banners, flyers, loudspeakers and jingles, and letting people know all are welcome. The focus group results imply that such advertising would facilitate greater awareness of healthy foods to which mobile markets provide access. Finally, trust is an important issue in these vulnerable communities. Many participants had experienced or heard about being ripped-off by food trucks and perceived mobile markets as similar for-profit businesses. Since the participants had limited budgets, they were particularly sensitive about obtaining high quality produce; they could not afford to waste money or waste food. What the participants in this study wanted were: fruits and vegetables that were high quality, at competitive prices and impeccable service. Overcoming negative preconceptions of mobile markets may require having more than one staff person at a mobile market, providing information, samples and demonstrations, and keeping the mobile market neat and clean. Having a staff member or an intern from the community would also foster greater trust because the community could see one of their own as part of the mobile market. Fostering training and service and offering internships to community members could be particularly useful in attracting more shoppers to mobile markets.

4
How Was the Study Conducted?
Focus groups were conducted at four sites that reflect urban and rural communities and different ethnic backgrounds. Eight focus groups were conducted in total, two focus groups of approximately ten participants each at each site; one with participants who shopped at the local mobile market (shoppers) and another with participants who lived near the mobile market, but did not shop there (non-shoppers). There were a total of 82 participants. A short questionnaire was administered prior to each session to gather information about eating and shopping habits. Each focus group was voice recorded, professionally transcribed, and coded for themes. Shoppers’ and non-shoppers’ perceptions of mobile markets and suggestions for improvements to attract new customers were compared. While this is a qualitative case study that is not generalizable, it provides insights about strategies and policies that would assist these mobile markets and can guide recommendations and future studies on mobile markets.

5
Measuring Effects of Mobile Markets on Healthy Food Choices
Background Over half of US adults are overweight (Flegal, Carroll, Ogden, and Curtin, 2010). Furthermore, food-related diseases (heart disease, stroke, and diabetes) are implicated in over a third of all deaths in the US (Xu, Kochanek, Murphy, and Tejada-Vera, 2010), and the medical costs for obesity alone in 2008 were $147 billion (Finkelstein, Trogdon, Cohen, and Dietz, 2009). The irony is that we know more today about nutrition than at any time in history (Tillotson, 2004). Economic theory might point to low prices as a culprit to overeating; US consumers spend less than eight percent of household expenditures on food at home (US Bureau of Labor Statistics, 2011). However, a review of research on the influence of fiscal policies on eating behavior found that the empirical evidence is weak and of low quality (Thow, Jan, Leederc, and Swinburn, 2010). Further, experimental data indicates fat taxes would have little impact on eating behavior, while subsidies of healthy foods would be costly; a 1% subsidy on fruits and vegetable would cost the US $1.3 million per life saved (Cash and Lacanilao, 2007). Who is most affected by nutrition related illness offers clues about the causes; obesity and chronic disease are associated with low fruit and vegetable consumption among the poor (Leone et al., 2012). African-Americans and Hispanics are more likely than Whites to be obese, and poverty significantly increases the likelihood of all categories of women to be obese (Ogden, Lamb, Carroll and Flegel, 2010). Given the high concentrations of poverty in both some urban and rural areas (US Census Bureau, 2013b), Mead (2008) points to the urban built environment as affecting access to fresh foods, while Gantner, Olson, Frongillo, and Wells (2011) identify similar problems of access to healthy foods in rural areas. Widener, Metcalf, and Bar-Yam (2012, 2013) showed that while both brick and mortar stores and mobile markets lead to increases in fruit and vegetable consumption, mobile markets have the advantage of covering a larger area. While this addresses accessibility, affordability still remains a problem. This might be the reason for contradictory findings of other studies of how mobile markets affect fruits and vegetables consumption. Tester, Yen and Laraia (2012) found in a 14-day study that the presence of a mobile fruit vendor increased children’s consumption of produce and reduced their consumption of unhealthy snacks. However, Philadelphia Greensgrow Project (2012) found only modest increases in farms sales and use by the targeted communities. Obstacles in reaching their intended customers related to timing, lack of variety, and lack of advertising. Abusabha, Namjoshi, and Klen (2011) showed a modest increase in vegetable consumption by seniors (from 2.0 to 2.6 servings per day); however, consumption of fruit was unaffected. Lewis and Zollinger (2012) studied how mobile markets affected personal health. They showed that while there was a modest increase in fruit and vegetable consumption in regular mobile markets shoppers, their health (defined in terms of obesity, blood pressure and blood sugar) remained unaffected over the six-month study period. Interestingly enough, participants believed their health has improved over the study period. The authors point out other benefits of mobile markets, specifically facilitating community gathering and providing information and tools to improve eating habits.

6
Despite the dearth of information about mobile markets, over 40 mobile markets that have sprung up around the US since 2010 as a strategy to provide healthy food choices to low food access communities (food deserts). Some have received support from federal agencies. The USDA AMS funded two mobile markets through cooperative agreements in 2011 to provide urban and rural food deserts with access to fresh, healthy food (US Department of Agriculture, 2012). Through the Farmers’ Market Promotion Program, USDA AMS funded competitive grants to 14 mobile market projects in 2012, 13 in 2011, and 4 in other years since 2008 (Agricultural Marketing Service, 2013). The goal of this cooperative agreement was to investigate whether mobile food markets may be effective in facilitating healthy food choices to their communities. The objectives of this research study were to: (1) understand who does and who does not use mobile markets and why, and (2) investigate whether mobile produce markets have the potential to alter attitudes and food choices in those communities, and if so, how. Method A focus group study was conducted at four sites selected by USDA AMS to reflect urban and rural communities, different ethnic backgrounds of customers, and differing strategies of market managers. Mobile markets had to have operated for at least one year at the site. A focus group is an ideal methodology to elicit perceptions (Kreuger, 1994). Participants are asked open-ended questions to encourage expression of their views, rather than limit answers to fixed responses, as with a questionnaire. Groups are guided in discussion by a facilitator to ensure that all are able to participate. By analyzing the discussion for common themes, consensus views, and points of disagreement, the researcher is able to identify views on topics that may be too subtle for survey questionnaires to pick up. The degree of (dis)agreement and forcefulness of views adds richness to the response set. Focus groups can aid in the design of a survey instrument by identifying appropriate questions and responses. Focus groups are a standard tool used in market research and are frequently used to examine food choices (Costa, Zepeda, and Sirieix, 2011; Philadelphia Greensgrow Project, 2012; Russell and Zepeda, 2008; Zepeda, Reznickova, and Russell, 2013). Eight focus groups were conducted: two focus groups of approximately ten participants each at each site. One group (shoppers) consisted of participants who shopped at the local mobile market and another (non-shoppers) of participants who lived near the mobile market, but did not shop there. The sites and dates of the focus groups were: Stevenson, WA (September, 2012); Chicago, IL (October, 2012); Madison, WI (April, 2013); and Washington, DC (July, 2013). A total of 82 people participated in the focus groups, which were facilitated by Dr. Zepeda and Ms. Reznickova and observed by staff from USDA AMS (see Appendix 1 for details). The focus group questions were constructed to elicit knowledge about recommended fresh produce consumption, perceptions of the mobile market, behavior with respect to purchasing fresh produce at the market or elsewhere, reasons for using or not using the mobile market, and barriers to purchasing, storing, and preparing fresh produce. The questions were put to the respondents and the facilitator encouraged each respondent to comment, allowing for group discussion and expression of differing opinions. The focus group questions were sequenced to build from general views to specific attitudes and behaviors (Table 1).

7
Table 1. Focus Group Questions All participants:
1. Please tell me about a typical dinner in your household. What foods do you eat? Who is at the meal? 2. Please tell me what is your goal for meal preparation? 3. Please tell me where do you get the food for your household? 4. Please tell me what fresh vegetables and fruits do you eat in your household? Where do you get them? Do you think your household eats enough fresh vegetables and fruits? Why or why not?
For mobile market users:
5. Please tell me how you heard about (insert name) mobile market? When did you start shopping there and why? 6. Please tell me how often you shop at (insert name) mobile market, what do you buy, and why? Can you get these things at other places you get food? Are these foods you bought before you started shopping at (insert name) mobile market? 7. Have your meals or the foods you eat changed since you started shopping at (insert name) mobile market? If so, how and why? 8. Have you changed the foods you select at other places (stores, restaurants, etc) since you started coming to the (insert name) mobile market? If so why? (If the mobile market is season: Have you changed the foods you select when the mobile market is not open?) 9. Are there foods you wish the (insert name) mobile market had but does not? If so, what? Are there foods the (insert name) mobile market has that you do not want? If so what? 10. What would you change about the (insert name) mobile market if you could? Why? 11. Please tell me what you think the reputation is of (insert name) mobile market and the people who work there? 12. Please tell me why you think more people don’t use (insert name) mobile market? 13. What do you think would encourage more people to use (insert name) mobile market? 14. What do think would encourage more people to eat more vegetables and fruits?
For non-users of mobile markets:
5. Please tell me if you have heard of (insert name) mobile market. If so, how did you hear about it? 6. Please tell me what you think the reputation is of (insert name) mobile market and the people who work there? 7. (Insert name) mobile market sells fresh produce in your community (insert place) on (insert day and time) and accepts cash and SNAP cards. Would the location and time be convenient for you? Why or why not? 8. Would you be interested in having more fresh produce available for you family? Why or why not? 9. Please tell me why you think more people don’t use (insert name) mobile market? 10. What do you think would encourage more people to use (insert name) mobile market? 11. What do think would encourage more people to eat more vegetables and fruits?

8
Each focus group was voice recorded and professionally transcribed, and the transcripts were coded for themes. Shoppers and non-shoppers responses to the focus group questions and a short questionnaire on eating habits and demographics administered just before the focus group commenced were compared (see Appendix 2 for the questionnaire). The questionnaire responses characterized the household and demographic attributes of the respondents as well as their eating habits, while theme codes from the transcripts were used to compare the two groups’ perceptions about the mobile markets and how they could be improved to attract more consumers. This qualitative case study, while not statistically generalizable, provides insights about strategies and policies that could assist these mobile markets to expand their customer base and can guide other future studies on mobile markets. Results Table 2 summarizes the characteristics of each research site (US Census, 2013a; 2013b) and the self-reported characteristics of the focus group participants. There was no statistical difference found at p=5% between the characteristic of shoppers and non-shoppers in the study by gender, race or SNAP usage. This implies that the two groups recruited at each site are similar. There were important differences across the four sites. The Stevenson, WA site is a rural town, largely White but despite the low median income of $30,912, there was a relatively low poverty rate (15%) and over 25% of households earned more than $100,000 annually (US Census, 2013c) implying the community was somewhat affluent. The Madison, WI mobile market served a mixed neighborhood in a small city, the only market site with Hispanic participants in the study, where median income of $32,000, well below the median income of Madison, $57,124 (City of Madison, 2012). The Chicago, IL and Washington, DC sites serve mainly low-income African-Americans. Although the median income for the Washington, DC site is the highest of all the locations, it is below the Washington DC median household income of $62,000 and the poverty rate is well above the DC average of 18% (US Census, 2013d) implying the research site is a poor neighborhood of Washington DC. Table 3 compares responses to the questionnaire by shopper and non-shopper participants. See Appendix 2 for responses by question. Responses showed that shoppers shopped more often 3.0 times in the last two weeks compared with 2.4 times for non-shoppers), lived closer to the mobile market (1.9 miles compared with 5.9 miles for non-shoppers) and consumed more fruit and vegetables (3.5 servings the previous day compared with 2.0 for non-shoppers). Non-shoppers also had more children, were more likely to like cooking, and have larger household sizes (1.9 adults and 0.9 children compared with 1.6 adults and 0.4 children for shoppers).

9
Table 2: Site and Participant Characteristics for Focus Groups of Shoppers and Non-Shoppers at Mobile Markets
Characteristic Gorge Grown (Stevenson, WA)
Fresh Moves (Chicago, IL)
Freshmobile (Madison, WI)
Arcadia (Washington, DC)
Community Typea
Rural town Urban Small city Urban
Ethnicity Profileb 94% White 86% African-American 19% African-American 28% Hispanic 97% African-American
Poverty Ratec
15% 40% 19% 39%
Median Household Incomeb
$30,912 $15,920 $32,000 $50,188
Shoppers Non-shoppers Shoppers Non-
shoppers Shoppers Non-shoppers Shoppers Non-
shoppers
Number 10 8 10 10 11 10 15 8
% Female 80% 75% 80% 70% 55% 70% 87% 63%
% White 100% 88% 10% 0% 10% 20% 0% 0%
% African-American 0% 0% 90% 100% 90% 60% 100% 100%
% Hispanic 0% 0% 0% 0% 0% 20% 0% 0%
% American Indian 0% 12% 0% 0% 0% 0% 0% 0%
% SNAP usersd 30% 25% 60% 80% 64% 40% 47% 38% aRural town has population of less than 2,500 (USDA, 2013a) b US Census Bureau (2013a) c US Census Bureau (2013b) dSNAP is the Supplemental Nutrition Assistance Program; it provides benefits to purchase food to eligible low income people (US Department of Agriculture, 2013b)

10
Table 3. Responses of Shoppers and Non-Shoppers to Pre-Focus Group Questionnaire
Question
Shoppers (n=46)
Non-shoppers (n=36)
Grocery shopping trips in the past two weeks
3.0 times 2.4 times
Distance from grocery store
4.4 miles 4.5 miles
Distance from mobile market 1.9 miles
5.9 miles
How many servings of fruit and vegetables did you have yesterday?
3.5 servings
2.0 servings
How many adults live in your household?
1.6 1.9
How many children live in your household?
0.4 0.9
Yes
No
Yes
No
Do you like to cook?a 65% 15 % sometimes 9% 67%
39% sometimes 0%
Do you use a SNAP card? 50% 50% 50% 47% Are you employed? 20% 80% 17% 83%
Are you a student?
4%
96%
17%
83%
Does anyone in your household suffer from overweight, obesity, type II diabetes, heart disease, stroke, or food allergies?
48% 50% 47% 50%
a The question “Do you like to cook?” offered three responses – “yes, sometimes, no.” The percentages reported sum to 100% for each group.
11
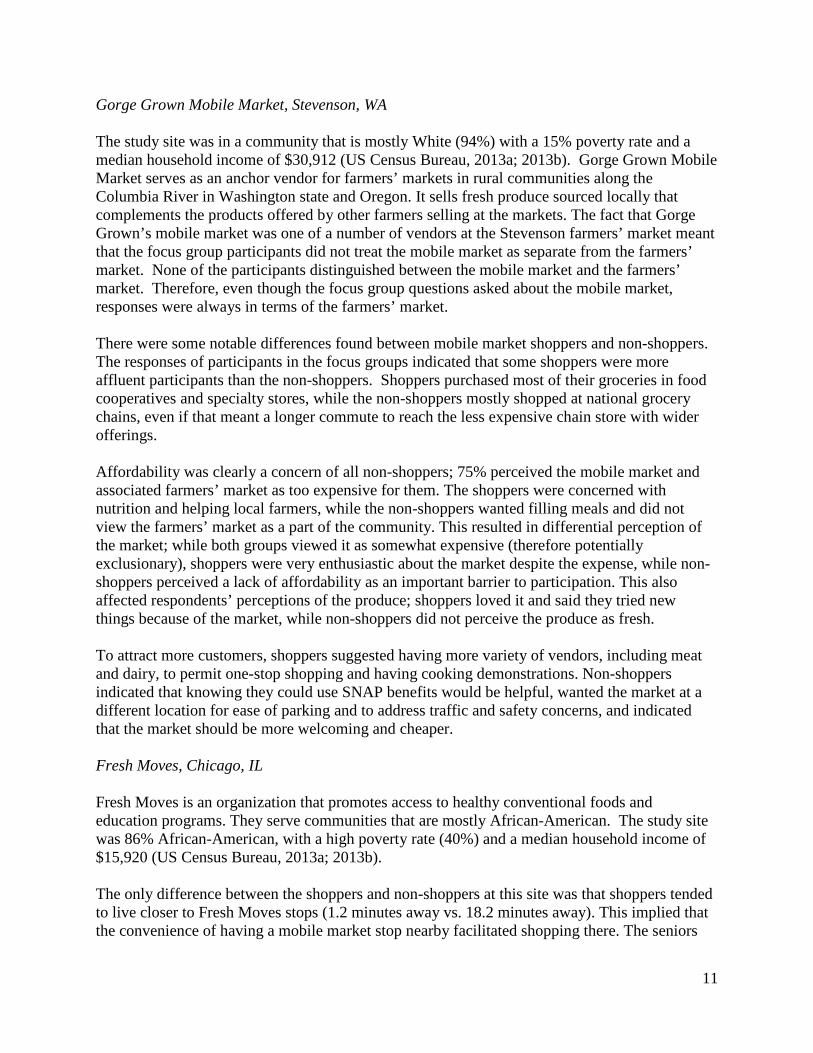
Gorge Grown Mobile Market, Stevenson, WA The study site was in a community that is mostly White (94%) with a 15% poverty rate and a median household income of $30,912 (US Census Bureau, 2013a; 2013b). Gorge Grown Mobile Market serves as an anchor vendor for farmers’ markets in rural communities along the Columbia River in Washington state and Oregon. It sells fresh produce sourced locally that complements the products offered by other farmers selling at the markets. The fact that Gorge Grown’s mobile market was one of a number of vendors at the Stevenson farmers’ market meant that the focus group participants did not treat the mobile market as separate from the farmers’ market. None of the participants distinguished between the mobile market and the farmers’ market. Therefore, even though the focus group questions asked about the mobile market, responses were always in terms of the farmers’ market. There were some notable differences found between mobile market shoppers and non-shoppers. The responses of participants in the focus groups indicated that some shoppers were more affluent participants than the non-shoppers. Shoppers purchased most of their groceries in food cooperatives and specialty stores, while the non-shoppers mostly shopped at national grocery chains, even if that meant a longer commute to reach the less expensive chain store with wider offerings. Affordability was clearly a concern of all non-shoppers; 75% perceived the mobile market and associated farmers’ market as too expensive for them. The shoppers were concerned with nutrition and helping local farmers, while the non-shoppers wanted filling meals and did not view the farmers’ market as a part of the community. This resulted in differential perception of the market; while both groups viewed it as somewhat expensive (therefore potentially exclusionary), shoppers were very enthusiastic about the market despite the expense, while non-shoppers perceived a lack of affordability as an important barrier to participation. This also affected respondents’ perceptions of the produce; shoppers loved it and said they tried new things because of the market, while non-shoppers did not perceive the produce as fresh. To attract more customers, shoppers suggested having more variety of vendors, including meat and dairy, to permit one-stop shopping and having cooking demonstrations. Non-shoppers indicated that knowing they could use SNAP benefits would be helpful, wanted the market at a different location for ease of parking and to address traffic and safety concerns, and indicated that the market should be more welcoming and cheaper. Fresh Moves, Chicago, IL Fresh Moves is an organization that promotes access to healthy conventional foods and education programs. They serve communities that are mostly African-American. The study site was 86% African-American, with a high poverty rate (40%) and a median household income of $15,920 (US Census Bureau, 2013a; 2013b). The only difference between the shoppers and non-shoppers at this site was that shoppers tended to live closer to Fresh Moves stops (1.2 minutes away vs. 18.2 minutes away). This implied that the convenience of having a mobile market stop nearby facilitated shopping there. The seniors

12
who shopped at the market talked about their difficulties in getting groceries, especially in the winter, and praised the mobile market for helping them, adding that having staples would be helpful. While there were no senior participants in the non-shopper group, the participants still recognized and discussed the role of the mobile market in helping senior citizens access food. Over half of the participants had families and were concerned about having enough to eat for their children and themselves. Both groups were very positive about the mobile market. The shoppers described the displays on the bus as neat and the staff as helpful. Both shoppers and non-shoppers were concerned with lack of awareness of Fresh Moves. The barriers to shopping at Fresh Moves included: not knowing they could shop there because they did not know what a mobile market was or confused it with a regular city bus that was parked, living far from the current stops, and not knowing what would be available on the bus or how much it cost. Some of the suggestions to counteract this lack of information were to use flyers, banners and a loudspeaker playing a jingle to announce the bus’s arrival. Despite being viewed positively by the community, Fresh Moves has faced financial difficulties and in August 2013 announced suspension of operations. Freshmobile, Madison, WI Freshmobile is a non-profit mobile market that was founded by an owner of a for-profit grocery store. Freshmobile benefits from the expertise, skills and infrastructure that the for-profit store provides, for example, all ordering and financial work is done by the grocery store staff. While Madison is an affluent small city, the communities served by Freshmobile are designated food deserts and have much larger minority communities than other neighborhoods in Madison. The study site is 19% African-American and 28% Hispanic, with a 19% poverty rate and median household income of $32,000 (US Census Bureau, 2013a; 2013b). The characteristics of shoppers and non-shoppers were similar. However, differences were found in their food goals. The majority of shoppers were concerned about health and vegetables were prominent when preparing meals, while non-shoppers organized their meals around meat. Both shoppers and non-shoppers appreciated the convenience of the market but were concerned about quality and affordability of the produce and service. Trust was a salient issue; shoppers recounted stories of being cheated by other mobile vendors or not receiving high quality produce. In addition, none of shoppers or non-shoppers were aware that Freshmobile was non-profit; they assumed it was a for profit business which led to them to expect that its prices should be comparable to those of national grocery chains. When informed that Freshmobile was a non-profit, non-shoppers were excited; they perceived this as someone caring about their well-being. All the non-shoppers said they would be willing to shop at Freshmobile; however, they would like more encouragement in form of flyers and word-of-mouth, either from a trusted source or from the mobile market staff. The participants were looking for high quality produce and excellent service and these things would encourage them to shop there. In addition, both groups suggested that promotions and free samples would encourage more people to shop there.

13
Arcadia Mobile Market, Washington, DC Arcadia Mobile Market is a part of a non-profit organization that promotes equity and sustainability of the local food system. The organization operates a farm to supply its mobile market and also to provide hands on experience as part of its youth education programs. The communities served by the mobile market are largely African-American and poor. The neighborhood of the study site is 97% African-American with a 38% poverty rate and a median household income of $50,188 (US Census Bureau, 2013a; 2013b). Participants for the study were recruited from an affordable housing complex for seniors and families, one of Arcadia’s stops. Both shoppers and non-shoppers focus groups, with the exception of two non-shopper participants, consisted of seniors. While both groups understood how fruits and vegetables relate to health, about 39% of all participants had no motivation to cook due to living alone. Both groups were enthusiastic about the market; the shoppers loved the experience of shopping at the brightly colored bus; the display outside the bus reminded them of a farmers’ market. In addition, they liked the produce, enjoyed trying new things, and appreciated the other local staples available, such as chocolate milk, meats, and baked goods. When told about the market, the non-shoppers liked the idea and all of them said they would shop there. Affordability appeared to be a problem for both groups, particularly at the end of the month when they could no longer afford to buy fresh produce. A big obstacle for participants was remembering when the bus came. They indicated they would like reminders both before the weekend when they did the majority of their grocery shopping and on the day the mobile market arrived. The participants indicated they would appreciate flyers with products and prices ahead of time so that they could plan their shopping and make comparisons to other stores. In addition, some participants, particularly those who lived in the family section of the building did not know that the Arcadia Mobile Market is for everyone and that they take Supplemental Nutrition Assistance Program (SNAP) payments. Suggestions for expanding the customer base included introducing more prominent signage to indicate that everyone is welcome and that SNAP cards are taken. Fruit and Vegetable Consumption Mead (2008) and Block, Chavez, Allen and Ramirez (2012) found that the rise of low food access or “food deserts” has made access to healthy foods difficult and costly. Work by Gantner, Olson, Frongillo and Wells (2011) and Tester, Yen and Laraia (2012) indicated that increasing availability of fresh produce can increase their consumption. Three theoretical frameworks can be used to explain why the lack of stores with healthy foods impedes healthy behaviors: Guagnano, Stern and Dietz’ Attitude Behavior Context (ABC) theory (1995); Zepeda and Deal’s (2009) Alphabet theory; and Wiedemann et al.’s (2009) Stage theories of health behavior. ABC theory was developed to explain the often-observed gap between attitudes and behaviors; it was used to examine how physical context influenced behaviors. Alphabet theory built on ABC’s framework to include knowledge, information seeking and habits as important additional factors to explain the gap. Stage theories proposed several cognitive stages one must pass through prior to engaging in behaviors and these are influenced by one’s environment. These theories all point to the importance of easy access to fruits and vegetables to facilitate healthy eating because such

14
behaviors become more convenient. The theories also indicate that access can alter perceptions and cognition regarding intentions and actions, further facilitating healthy behaviors. The role of mobile markets in affecting food behavior were corroborated by this study. Overall, shoppers ate significantly more servings of fruits and vegetables than non-shoppers (3.5 vs. 1.9; P>0.001). At each site shoppers ate more servings and the difference was significant for all sites except Washington, DC (Table 4). While not all their produce may have been purchased from the mobile market, the mobile market altered availability, facilitating access. Table 4. Fruit and Vegetable Consumption of Shoppers and Non-Shoppers By Study Sitea
Market and Site Shoppers (# servings)
Non-shoppers (# servings) P-value
Gorge Grown Stevenson, WA 6.0 3.3 0.08
Fresh Moves Chicago, IL 2.7 1.2 0.02
Freshmobile Madison, WI 2.5 1.3 0.03
Arcadia
Washington, DC 2.9 2.2 0.37 aFruit and vegetable consumption for day previous to the date of the focus group. The following comment illustrates why mobile markets may affect fruit and vegetable consumption: ‘In the last few years, my diet has changed fairly radically. I didn’t used to really care too much what I ate. … But moving towards the whole foods, you know, the closer you know where it’s prepared from, the better off you are. And so the farmer’s market, of course, plays into that.’(Shopper WA#5) Despite interest in eating more produce, on average, none of the participants met the Centers for Disease Control (2012) recommendation of 9 servings per day. Over half the participants acknowledged the disparity; 54% of participants asked said they would like to eat more fruits and vegetables. Obstacles and Solutions In coding the focus group transcripts, five majors themes were found that inhibited consumers from using mobile markets to increase their fruit and vegetable consumption. The themes were: perceptions; lack of knowledge or familiarity with mobile markets; affordability and timing of

15
the mobile markets; convenience; and value and service. Ultimately, all these factors affected perceptions of trust in the mobile market, and hence whether shoppers were interested in continuing to shop and whether non-shoppers might be convinced to shop at mobile markets. Each theme is discussed below, with quotes from the focus group to illustrate the participants’ concerns. Perceptions In general, participants seem to overestimate their fruit and vegetable consumption; 51% of 82 participants believed they ate enough fruits and vegetables, while only 8% of them ate five or more servings a day. This implies a gap in understanding that could be mitigated by information about the number of recommended servings and what a serving size is. Simple messages, such as ‘5 servings a day’ accompanied by pictures of serving sizes could be effective in correcting this misconception. The adoption by the USDA of visuals using a plate (US Department of Agriculture, 2013c) to depict nutrition recommendations addresses these concerns to some extent. The problem of course is that it presumes people eat three meals a day on a single plate of a standard size. This visual does not address the needs of those who snack, eat more or fewer meals, eat multiple courses, or do not use plates. In addition, the visual does not clearly answer two questions that participants articulated: how many servings of fruits and vegetables should I eat and what is a serving? In addition, fruits and vegetables were viewed as a luxury rather than a necessity, particularly for parents when feeding children. In Chicago,IL, 60% of all participants said their main goal when preparing a meal was that they – and their families – are full rather than the health effects of food.
‘I cook for all the kids… I keep them full and out of trouble.’ (Shopper IL#4) For seniors, the difficulty is a lack of motivation to cook when they live alone. In Washington, DC, 39% of the participants said they were not motivated to cook because they were used to cooking for large groups of people, but now lived alone. To illustrate:
‘Well, for me [the problem] is having the appetite to eat. .., since I'm alone, it's not like when I had my children with me and my grandkids, and I was cooking for them. I don't like cooking for myself anymore.’ (Shopper DC#8)
Emphasizing the value of fruits and vegetables to maintain health together with facilitating shared cooking or cooking events may overcome these obstacles and increase healthier eating. Lack of Knowledge about Mobile Markets In general, the majority of the participants believed people do not shop at mobile markets because they are simply not aware of them. Indeed, 90% of the non-shoppers in Wisconsin had not heard of the mobile market serving their neighborhood, but they believed people would shop there if they knew about it:

16
‘I think that people are not aware. They don’t just know because I really believe that if people seen this truck and it has fresh fruit on it, I think they would stop just [from] sheer curiosity.’ (Non-shopper WI#17)
Another obstacle is that many people do not know they can shop at the mobile markets; they may perceive the mobile market as a normal city bus or as a part of a program that is not for them:
‘And perhaps a lot of the family members don't know that they can come and buy stuff off the truck. ... So I say advertise, advertise, advertise.’ (Shopper DC#12)
The participants, particularly seniors, want to be reminded in advance when and where their mobile market was coming, but also what is on it and how much it costs so they could plan:
‘People don't want to go on the bus, get on there and pick up two or three items, and they cost an arm and a leg, you know. So they want to know what it's going to cost before they even get there to see if they can even afford it.’ (Non-shopper IL#12)
Overall, 54% of all participants wanted more advertising. They specifically requested flyers with locations and times, banners at stops informing everyone they can shop there and that they accept SNAP, and a loudspeaker announcements and jingles when the bus arriving in the neighborhood. High-tech recommendation systems, for instance smart phone apps, e-mails or websites are not recommended because during the recruitment, only one participant used email and many of the other 81 participants appeared to use pay-as-you-go phones strictly for calls. Affordability and Timing Affordability was a central theme in all focus groups; about 40% of all participants mentioned that affordability either prevented them or other people from shopping there:
‘I've only been down there once, and that was when they first started. And I just can't afford it.’ (Non-shopper WA#1)
This is illustrated by 88% of participants who reported hunting for bargains at national chain grocery stores. Affordability was an issue particularly at the end of the month when people ran out of money or SNAP benefits, as illustrated by the following comment:
‘Well, I get an ample amount [of fruits and vegetables], but toward the end of the month, when your little money and your stamps start dwindling, then your vegetables and your fruits dwindle too.’(Non-shopper DC#20)
The participants often mentioned that lower prices would mean more people buying fruits and vegetables:

17
‘I would change the prices to make it more affordable…if their prices is better than [national chain], … then more likely, more people would use the mobile [market].’(Shopper WI#2)
This implied that higher prices negatively affected fruit and vegetable consumption. This was particularly true at the end of the month and for mobile markets that could not redeem farmers’ markets coupons because the mobile market was not selling product sourced directly from farms. Extending farmers’ market coupons to all mobile markets would make produce more affordable. Implementing special coupons and promotions at the end of the month would be particularly helpful to increase produce consumption. Convenience Twenty-four percent of all participants considered mobile markets convenient. However, 33% of all participants wanted more stops at convenient times. Increasing the number of stops and including times when workers are likely to be home such as during the weekend could make mobile markets more convenient and therefore attract more people to buy fruits and vegetables. To illustrate the importance of convenience,
‘There are some people that can’t drive to get to certain stores to get fresh fruit or vegetables or anything… so then they end up going to rip-off joints that are close, like a gas station that’s charging you twice or three times the amount of what the item should be.’ (Non-shopper WI#20)
Another issue was the food offered. While both shoppers and non-shoppers appreciated that mobile markets could make produce more accessible, 27% of all participants wanted a variety of products; the shoppers would like to see more variety at the mobile markets, while the non-shoppers indicated if they were to shop there, they would expect a variety. This was important particularly for seniors who have difficulties carrying large amounts of groceries on public transport, and especially in winter. Providing staple foods to permit one-stop shopping could encourage greater use of mobile markets:
‘Because honestly, the reason why we shop at the bigger grocery stores is because it’s one-stop shopping. It would be nice if the farmer’s market kind of had a lot more to choose from.’ (Shopper WA#5)
Value and Service Quality of produce is important in defining value for 28% of the participants. Produce needs to look fresh and inviting. The participants recounted stories of trying new things simply because they looked so good. However, quality of produce can be negatively affected by perceptions about the mobile market. In Stevenson, WA, non-shoppers did not like the farmers’ market affiliated with the mobile market and therefore viewed all the produce as mediocre:
18
‘[F]rom an appearance standpoint [the food at the farmers’ market] should be extraordinary, should be better than what I would find in most places. And I haven't found that in the limited times I've been there… [This] certainly affects my attitude toward it.’ (Non-shopper WA#17)
On the other hand, the value of service was clearly apparent in Chicago, IL and Washington, DC. Thirty percent of the shoppers mentioned positive experiences with informative staff in a nice and clean environment. To illustrate the how service influences the perception of value:
‘It was just nice. I couldn't believe it. I said, oh, my, I said when they coming back? … And when I went up there, they helped you up on the bus.…When you get through shopping, they help you off the bus saying, thank you, thank you. It's really nice.’ (Shopper IL#8)
In addition, 27% of all participants indicated they would like to see samples and demonstrations; tasting would encourage them to purchase more fruits and vegetables:
‘You know how when you're shopping at a grocery store, and you may get all the way home, and the fruit wasn't as ripe as you thought it was going to be or as sweet or as juicy as you thought it was going to be? I would think like putting out a few samples out.’ (Non-shopper IL#20)
This implied that people expected quality and service from the mobile market. The produce needed to be of high quality to attract customers and to avoid rumors that could lead to a poor reputation. The staff needed to be welcoming, helpful, and knowledgeable about the produce. Providing samples and demonstrations could facilitate increased fruit and vegetable consumption. Conclusions and Recommendations For the participants in this study, mobile markets facilitated healthy eating in food deserts. On average, shoppers ate more fruits and vegetables than non-shoppers. However, neither shoppers nor non-shoppers ate the recommended USDA number of servings. Table 5 summarizes recommendations to help facilitate the effectiveness of mobile markets. To the extent possible, policy makers and funders should address these actions. Affordability is key; the participants shopped at national chain grocery stores and searched for bargains, promotions and coupons due to limited budgets. Mobile markets need to be competitive with such stores; they also need to be sensitive particularly at the end of the month. They can do this providing specials and discounts, especially at the end of the month. Policy makers at the national level can facilitate greater purchase of healthier foods by permitting farmers’ market food assistance (WIC Farmers’ Market and Senior Farmers’ Market vouchers) to be redeemed at all mobile markets.

19
Table 4. Summary of Recommendations to Increase Use of Mobile Markets in Low Access Areas
Provide simple guidelines about recommended servings of fruits and vegetables and develop simple illustrations of serving sizes
Promote shared cooking, offer cooking demonstrations and events
Extend farmers’ market food assistance, double vouchers, veggie RX and other programs to all mobile markets, not just those sourcing from farms, provide additional benefits at the end of the month
Expand weekend operations of mobile markets, increase variety of products, especially staples
Incentivize mobile markets to serve senior housing and schools
Emphasize customer convenience in setting hours and locations, and advertise and promote widely Develop programs for mobile markets to hire community staff and interns Utilize advertising and promotions to attract customers to mobile markets
While mobile markets are seen largely as convenient, adding stops on the weekend would allow more people to shop there. In addition, including staples among the items offered would both bring in more customers and make shopping easier, especially for seniors who have problems with transportation, particularly in the winter. Funding programs to operate on weekends and to expand products sold at mobile markets, especially local value-added products (e.g. baked goods and dairy products), as is done by Arcadia Mobile Market, can enhance both convenience and the perception that the market is attuned to customer preferences. Participants in this study were largely unaware of the missions of mobile markets. They were impressed when they understood that the mobile markets are non-profits that aim to improve food access, especially if they have programs that target senior housing and children at schools. Therefore, mobile markets can enhance their reputation by letting communities know they are non-profits and by including stops by schools and senior homes. Incentives for mobile markets to serve institutions for seniors and children might include access to Federal procurement programs, additional funding, or targeted fund raising. Further, mobile markets need to focus on publicity and advertising. Information about locations, times, products and prices provided in advance, using banners, flyers, loudspeakers and jingles will ensure that the entire prospective customers feel welcome. The AMS FMPP could be a source of funding for these activities, since such grant uses are clearly within its scope.
20
Finally, trust may be an issue in these vulnerable communities. Many have experienced or heard about being ripped-off. Since they have limited budgets, they are particularly sensitive about obtaining high quality produce; they cannot afford waste. The produce has to be high quality, at a competitive price and the service should be impeccable. This may require having more than one staff at the mobile market, providing information, samples and demonstrations, and of course keeping the mobile market neat and clean. Having a staff member or an intern from the community would also foster greater trust because the community could see one of their own as part of the mobile market. Policies and programs that foster training, service and offer internships to community members could be particularly useful to attracting more shoppers to mobile markets. Overall, these participants want what everyone wants: value, quality and service. However, most of the participants in this study face severe resource and infrastructure constraints in trying to eat healthier food. Mobile markets are part of the solution to address these constraints. Future Research Mobile market initiatives are springing up around the country, yet there is currently no database on the number or characteristics of mobile markets. Nor do we know how effective mobile markets are as a whole in providing access to fresh foods or in increasing farm sales. Future research to fill this gap would be beneficial to understand where and how mobile markets could improve healthy food access. In addition, evaluating the range of strategies that mobile markets use to promote access and sales as well as how consumers respond, could be useful to identifying best practices, how to attract more customers and to generate more sales. Of particular interest is to determine whether the higher consumption of fruits and vegetables by mobile market shoppers in this study is widespread across all areas served by mobile markets. Finally, future research could investigate how mobile markets facilitate fruit and vegetable consumption and for whom. Do mobile markets merely make it more convenient, or do they change perceptions and intentions about eating healthier foods? References Abusabha, R., Namjoshi, D., & Klen, A. (2011). Increasing access and affordability of produce improves perceived consumption of vegetables in low-income seniors. Journal of the American Dietetic Association, 111(10): 1549-1555. Agricultural Marketing Service (2013). Farmers’ markets and local food marketing, FMPP guidelines, grants and final reports. Accessed October 31, 2013. http://www.ams.usda.gov/AMSv1.0/ams.fetchTemplateData.do?template=TemplateV&navID=FMPPGuidelinesLinkFMPPHome&rightNav1=FMPPGuidelinesLinkFMPPHome&topNav=&leftNav=WholesaleandFarmersMarkets&page=FMPPSearchReports&resultType=&acct=fmpp
21
Block, D.R., Chavez, N., Allen, E. & Ramirez, D. (2012). Food sovereignty, urban food access, and food activism: Contemplating the connections through examples from Chicago. Agriculture and Human Values, 29: 203-215. Cash, S.B., & Lacanilao, R.D. (2007). Taxing food to improve health: Economic evidence and arguments. Agricultural Resource Economics Review, 36: 174–182. Centers for Disease Control and Prevention (2012). How many fruits and vegetables do you need? Accessed October 31, 2013 http://www.cdc.gov/nutrition/everyone/fruitsvegetables/howmany.html City of Madison (2012). Neighborhood Indicators. Accessed on May 16, 2013 http://madison.apl.wisc.edu/compare.php. Community Commons (2012). Mobile Markets. Accessed September 10, 2013 http://www.communitycommons.org/2012/11/mobile-markets-one-food-desert-solution/. Costa, S., Zepeda, L. & Sirieix, L. (2011). Exploring the social value of organic food. In Consumer 2011, conference of the International Journal of Consumer Studies, Bonn, Germany, 18-20 July 2011. Finkelstein, E.A, Trogdon, J.G., Cohen, J.W., & Dietz, W. (2009). Annual medical spending attributable to obesity: Payer- and service-specific estimates. Health Affairs, 28(5): w822-w831. Flegal, K.M., Carroll, M.D., Ogden, C.L., & Curtin, L.R. (2010). Prevalence and trends in obesity among US adults, 1999-2008. Journal of the American Medical Association, 303: 235-241. Gantner, L.A., Olson, C.M. Frongillo, E.A., & Wells, N.M. (2011). Prevalence of nontraditional food stores and distance to healthy foods in rural food environment. Journal of Hunger and the Environmental Nutrition, 6 (3): 279-293. Guagnano, G.A., Stern, P.C., & Dietz, T. (1995). Influences on attitude-behavior relationships: A natural experiment with curbside recycling. Environment and Behavior, 27(5): 699-718. Kreuger, R.A. (1994). Focus Group: A Practical Guide for Applied Research. Thousand Oaks, CA: Sage Publications Leone, L.A., Beth, D., Ickes, S.B., MacGuire, K., Nelson, E., Smith, R.A., Tate, D.F., & Ammerman, A.S. (2012). Attitudes towards fruit and vegetable consumption and farmers’ markets usage among low-income North Carolinians. Journal of Hunger and Environmental Nutrition, 7(1): 64-76. Lewis, C.K., & Zollinger, T.W. (2012). Garden on the Go demonstration study report. Indiana University Health.
22
Mead, N.M. (2008). Urban issues: The sprawl of food deserts. Environmental Health Perspectives, 116(8): A335. Ogden, C.L., Lamb, M.M., Carroll, M.D. & Flegal, K.M. (2010). Obesity and socioeconomic status in adults: United States, 2005–2008. Accessed September 9, 2013, http://www.cdc.gov/nchs/data/databriefs/db50.pdf. Philadelphia Greensgrow Project (2012). Greensgrow Camden neighborhood markets: Using mobile markets to provide healthy food retail outlets in food deserts and low-income areas of Camden City, New Jersey. Philadelphia: Greensgrow. Russell, W.S. & Zepeda, L. (2008). The adaptive consumer: Shifting attitudes, behavior change and CSA membership renewal. Renewable Agriculture and Food Systems, 23: 136-148. Tester, J.M., Yen, I.H. & Laraia, B. (2012). Using mobile fruit market vendors to increase access to fresh fruit and vegetables for school children. Preventing Chronic Disease 9, accessed September 9, 2013 http://www.cdc.gov/pcd/issues/2012/11_0222.htm. Thow, A.M., Jan, S., Leederc, S., & Swinburn, B. (2010). The effect of fiscal policy on diet, obesity and chronic disease: A systematic review. Bulletin of the World Health Organization, 88: 609–614. Tillotson, J.E. (2004). America’s obesity: Conflicting public policies, industrial economic development, and unintended human consequences. Annual Review of Nutrition, 24: 617-643. US Bureau of Labor Statistics (2011). Consumer expenditure survey 2009. Accessed July 6, 2011 http://www.bls.gov/cex/. US Census Bureau (2013a). Census tract data. Accessed August 1, 2013 http://www.census.gov/main/www/access.html. US Census Bureau (2013b). Poverty. Accessed September 9, 2013 http://www.census.gov/hhes/www/poverty/ US Census Bureau (2013c). Family income in last 12 months, Stevenson, WA. Accessed October 31, 2013 http://www.census.gov/easystats/ US Census Bureau (2013d). State and county quick facts: Washington DC. Accessed Octover 31, 2013 http://quickfacts.census.gov/qfd/states/11000.html US Department of Agriculture (2012). Agriculture Secretary Vilsack highlights Obama administration efforts to increase access to healthy food. Accessed September 9, 2013 http://www.usda.gov/wps/portal/usda/usdahome?contentid=2012/06/0185.xml&navid=NEWS_RELEASE&navtype=RT&parentnav=LATEST_RELEASES&edeployment_action=retrievecontent.

23
US Department of Agriculture (2013a) What is rural? Accessed October 31, 2013 http://www.ers.usda.gov/topics/rural-economy-population/rural-classifications/what-is-rural.aspx#.UnKSoiSKQ7B US Department of Agriculture (2013b) Supplemental Nutrition Assistance Program (SNAP) Accessed October 31, 2013 http://www.fns.usda.gov/snap Weidemann, A.U., Lippke, S., Reuter, T., Schuz, B., Ziegelmann, J.P., & Schwazer, R. (2009). Prediction of stage intakes in fruit and vegetable intake. Health Education Research, 24 (4), 596-607. Widener, M. J., Metcalf, S. S., & Bar-Yam, Y. (2012). Developing a mobile produce distrbution system for low-income urban residents in food deserts. Journal of Urban Health: 1-13. Widener, M. J., Metcalf, S. S., & Bar-Yam, Y. (2013). Agent-based modeling of policies to improve urban food access for low-income populations. Applied Geography, 40: 1-10. Xu, J., Kochanek, K.D., Murphy, S.L., & Tejada-Vera, B. (2010). Deaths: Final data for 2007. National Vital Statistics Reports, 58(19). Hyattsville, MD USA: National Center for Health Statistics. Accessed 15 October, 2010 http://www.cdc.gov/nchs/deaths.htm. Zepeda, L. & Deal, D. (2009).Organic and local food consumer behaviour: Alphabet theory. International Journal of Consumer Studies, 33(5): 697-705. Zepeda, L., Reznickova, A. & Russell W.S. (2013). CSA membership and psychological needs fulfillment: an application of self-determination theory. Agriculture and Human Values. Accessed February 2, 2013 http://link.springer.com/article/10.1007/s10460-013-9432-z/fulltext.html.

24
Appendix 1. Procedure Details
The human subjects Internal Review Board at the University of Wisconsin-Madison approved the procedure with slight variations in the details of recruitment to accommodate each site. Teleconferences between the USDA AMS program officers, the researchers, and representatives of each mobile market were held to provide the latter with information about the project, its purpose, who to contact if they have concerns or questions, and request permission to conduct research at their site. Each mobile market provided a site permission letter to indicate their willingness to participate in the study. With the assistance of the mobile market managers, the researchers identified a suitable venue and time for the focus groups. The researchers reserved the venues and recruited participants beginning at least two weeks prior to the designated time of the focus groups using posters, flyers and/or ads describing the research. Flyers to recruit shoppers were also distributed by the mobile market staff, while posters and flyers to recruit non-shoppers were placed in public places (e.g. café, community center, local newspaper). On-site, in-person recruiting and snowball recruiting were used; in the latter case, participants were asked to inform their friends. Potential participants contacted the researchers to screen for age (at least 18 years of age) and for being a shopper/non-shopper. Participants were offered $50 as an incentive for participation. Approximately 12 participants were recruited for each focus group to allow for attrition; the target for each group was 10. The total number of participants in the study was 82: 45 shoppers and 37 non-shoppers. Each focus group lasted approximately two hours. If the focus group was scheduled around a mealtime, participants were provided with refreshments. Prior to commencing, the researchers reviewed the approved informed consent script, asked for oral consent and provided the participants with a written copy for their records. Informed consent consisted of: contact information of the researchers and UW-Madison IRB, the purpose of the research, that it was voluntary, that participation involved no risks or benefits, that their responses were anonymous and confidential, permission to record, permission to quote them anonymously, and an opportunity to ask any questions. Participants filled out a short survey on demographics and food behaviors (See Appendix 2). The focus group discussion consisted of 12 open-ended questions; the participants answered in round-robin format and could choose not to answer. The format allowed everyone to express their opinions, while facilitating a discussion among participants and allowing the moderator to ask follow-up or probing questions. In one focus group, not all participants spoke English. The researcher therefore translated the questions into Spanish then translated their answers to the other participants. All responses were recorded on an audio recorder. During the focus group, a graduate student recorded observations and took notes to help with transcription and annotation of the transcripts. The focus group recordings were transcribed by a professional service, except for the discussion in Spanish, which was transcribed and translated by the researcher. The transcripts were then analyzed and coded to summarize responses and investigate further research questions. Quotes were selected to illustrate findings.

25
Appendix 2. Pre-Focus Group Questionnare and Summary of Results (n=82) Do you like to cook? (please, circle one): (n=79)
No (5%)
Sometimes (26%)
Yes (66%)
How many times have you gone grocery shopping in the past two weeks? (n=80)
Mean 2.7 ± 2.1
How far is the nearest grocery store to your home? (n=81)
Mean 5.0 ± 7.2 miles
How far is the {market name} mobile market from your home? (n=73)
Mean 3.7 ± 7.7 miles
Do you use a SNAP card? (circle one) (n=81)
Yes (50%)
No (50%)
How many servings of fruits and vegetables did you eat yesterday? (1 serving is a ½ cup for most fruits and vegetables, one piece of fruit, or one cup for salad greens) (n=77) Mean 2.9 ± 2.3
Are you employed? (circle one) (n=82)
Yes (18%)
No (82%)
If Yes, how many hours do you work per week? (n=15)
Mean 31.8 ± 12.9 hours
If Yes, how many hours do you commute to work per week? (n=11)
Mean 4.2 ± 5.9 hours

26
Are you a student? (circle one) (n=82)
Yes (10%)
No (90%)
If Yes, how many hours do you spend in classes and studying per week? (n=10)
Mean 10.3 ± 8.7 hours
If Yes, how many hours do you commute to your school per week? (n=8)
Mean 2.1 ± 1.7 hours
How many adults 18 or older are there in your household (including yourself)? (n=82)
Mean 1.7 ± 1.0
Age and gender of all adults in your household (n=80 for age, n=82 for gender)
Mean age of respondent 52 years
Gender of respondent 60 F; 22 M
Number of children (under 18 years) in your household: (n=82)
Mean 0.6 + 1.1
Does anyone in your household (including yourself) suffer from overweight, obesity, type II diabetes, heart disease, stroke, or food allergies? (circle one) (n=81) Yes (50%)
No (50%) How many household members are affected by these diseases? (n=40)
50 total