Embed Size (px)
Citation preview
Measuring Economic Policy Uncertainty
Scott R. Baker (Northwestern)Nick Bloom (Stanford & NBER)Steve Davis (Chicago & NBER)
AEA, January 2015

This paper tries to investigate two questions
• Uncertainty: Does policy uncertainty matter?
• News: Can text search create data (back to 1880s)?
2

We approach policy uncertainty methodically
1) Measuring policy uncertainty
2) Evaluating our measure
3) Estimating the impact of policy uncertainty

Our policy uncertainty index is based on computer search of Newspapers
• For 10 major US papers get monthly counts of articles with:{economic or economy}, and{uncertain or uncertainty}, and {regulation or deficit or federal reserve or congress or legislation or white house}
• Divide the count for each month by the count of all articles
• Normalize each to SD=1, then sum all 10 papers to get the U.S monthly index

Newspapers: • Boston Globe• Chicago Tribune • Dallas Morning News • Los Angeles Times• Miami Herald
• New York Times• SF Chronicle• USA Today• Wall Street Journal• Washington Post
5
Note: We use Access World News Newsbank Service when constructing a daily EPUIndex, because the daily index requires a higher density of news sources.
Constructing our US News-Based EPU Index

5010
015
020
025
0
1985
1987
1989
1991
1993
1995
1997
1999
2001
2003
2005
2007
2009
2011
2013
US News-based policy uncertainty index: Jan 1985-Aug 2014
Source: “Measuring Economic Policy Uncertainty” by Scott R. Baker, Nicholas Bloom and Steven J. Davis, all data at www.policyuncertainty.com. Data normalized to 100 prior to 2010.
GulfWar I
9/11
Clinton-Election
Gulf War II
Bush Election
Stimulus Debate
Lehman and TARP
Euro Crisis and 2010 Midterms
Russian Crisis/LTCM
Debt Ceiling; Euro Debt
Black Monday
Fis
cal C
liff
Shu
tdow
n

Note: Analysis uses Newsbank coverage of around 1000 US national and local newspapersSee Table 1 in the Baker, Bloom and Davis (2013) for a more detailed analysis.
Category EPU analysis – look for category terms alongside our economic policy uncertainty terms

Notes: Index of Policy-Related Economic Uncertainty composed of quarterly news articles containing uncertain or uncertainty, economic or economy, and policy relevant terms (scaled by the total number of articles) in 6 newspapers (WP, BG, LAT, NYT, WSJ and CHT). Data normalized to 100 from 1900-2011.
Can run the index back to 1900 using 6 newspapers(Jan 1900 – Dec 2012)
100
200
300
1900 1910 1920 1930 1940 1950 1960 1970 1980 1990 2000 2010
Po
licy
Un
cert
ain
ty In
dex
Versailles conference
9/11 and Gulf War II
Debt Ceiling
OPEC II
Lehman and TARP
Great Depression, New Deal and FDR
Truman-Deweyelection
Great Depression Relapse Gulf
War IBlack Monday
Start of WW I
OPEC I
Asian Fin. Crisis
Watergate
Assassination of McKinley
Gold Standard Act
Berlin Conference
McNary Haughen farm bill

010
020
030
0
2003 2005 2007 2009 2011 2013
India Economic Policy Uncertainty IndexIn
dia
Bas
ed P
olic
y U
nce
rtai
nty
Ind
exExchange Rate
Fluctuations and WorryLokpal Bill
Source: www.policyuncertainty.com. Data from 7 Indian newspapers (Economic Times, Times of India, Hindustan Times, Hindu, Statesman, Indian Express, and Financial Express)
Congress Party wins National Election
Bear Sterns
Lehman Bros
India-US Nuclear Deal
Price Hikes

010
020
030
040
0
1995
1996
1997
1998
1999
2000
2001
2002
2003
2004
2005
2006
2007
2008
2009
2010
2011
2012
2013
2014
China Economic Policy Uncertainty IndexC
hin
a B
ased
Po
licy
Un
cert
ain
ty In
dex
9/11
Political Transition and new National
Congress
Rising Interest Rates
Inflation and Export Pressure
Eurozone Fears and Protectionism
China Stimulus
China Deflation and Deficit
Source: www.policyuncertainty.com. Data until August 2014. Based on newspaper articles from the South China Morning Post.

5010
015
020
025
0
2003
2004
2005
2006
2007
2008
2009
2010
2011
2012
2013
2014
North Korean Economic Policy Uncertainty IndexP
olic
y U
nce
rtai
nty
Ind
ex
Source: www.policyuncertainty.com. Data from 0 North Korean newspapers

1992 10 1994 1 1995 4 1996 7 1997 10 1999 1 2000 4 2001 7 2002 10 2004 1 2005 4 2006 7 2007 10 2009 1 2010 4 2011 7 2012 10 2014 10
50
100
150
200
250
300
350
400
450
Orange Revolution in Ukraine
Duma elections and protests
against election fraud
Kizlyar hostage crisis;PM Chubais resigns
Cons
tituti
onal
Cr
isis
Russian financial
crisis
First Chechen
War
Second Chechen
War
Acting PM Gaidar resigns
Russian military
exits Chechnya
Timoshenko resigns;
Terror attack in Nalchik
Parliament dismissedIn Ukraine
Terror attacks in Nalchik & Stavropol
Med
vede
d el
ectio
n
Putin becomes
PM
Lehm
an B
roth
ers
Failu
re
Ukr
aine
Con
flict
Tape
r Tan
trum
Putin
ele
ction
Kiev Euromaidan;
Crimea annexation
12
Russian Economic Policy Uncertainty Index (beta)
Source: Data from Kommersant daily newspaper (1992-2014)

We approach policy uncertainty methodically
1) Measuring policy uncertainty
2) Evaluating our measure
3) Estimating the impact of policy uncertainty
4) Why policy uncertainty changes over time

A) Market Use
Market suggests informational value in the data
I) We have also tracked numerous institutions using the data like Goldmans, Citibank, JP Morgan, Blackrock, Wells Fargo, IMF, Fed, ECB etc (see www.policyuncertainty.com)
II) This has led Bloomberg, FRED, Reuters and Haver to stream the data for their financial and policy users

1020
3040
5060
VIX
(re
d)
5010
015
020
025
0E
co
no
mic
Po
licy
Un
cert
ain
ty In
de
x (B
lue)
1990 1992 1994 1996 1998 2000 2002 2004 2006 2008 2010 2012
9/11WorldCom & Enron
Gulf War II
Credit Crunch
Asian crisis
Gulf War I
Obama Election, Banking Crisis
Debt Ceiling
LTCM default
B) Comparison: stock market implied volatility (the VIX)
Correlation 1-month VIX and EPU index = 0.55Correlation 10-year VIX synthetic and EPU index = 0.73
Large interest
rate cuts
Clinton election
Source: www.policyuncertainty.com. Data until October 2012

C) Running Detailed Human Audits10 undergraduates read ≈ 9,098 newspaper articles to date using a 63-page audit guide to code articles if they discuss “economic uncertainty” and “economic policy uncertainty”
16

010
020
030
040
0
1900 1910 1920 1930 1940 1950 1960 1970 1980 1990 2000 2010year
Human index based on audit of 3727 articles (ave=34 per year) in the LA Times and New York Times (the two papers we could audit from 1900 to 2012) versus the historical index for these two papers.
Find humans and computers give similar results in large samples: yearly from 1900
Computer
Human
Correlation=0.837

050
100
150
200
250
1985 1990 1995 2000 2005 2010year
Human index based on audit of 3891 articles (34.7 per month) in the LA Times, New York Times, Miami Herald and SF Chronicle (the five papers we could audit from 1985 to 2012).
Computer
Human
Correlation=0.721
Find humans and computers give similar results in large samples: quarterly from 1985

The human-computer differences are uncorrelated with real outcomes: e.g. GDP growth
-.2
-.1
0.1
.2Y
ea
rly G
DP
gro
wth
-10
12
Co
mpu
ter
hu
man
EP
U %
diff
1900 1910 1920 1930 1940 1950 1960 1970 1980 1990 2000 2010
Computer human EPU % diff Yearly GDP growth
Yearly economic policy uncertainty index based on human audit of 3727 articles in the LA Times and New York Times (the two papers we could audit from 1900 to 2012) in a 3-year moving average to yield an average of 121 articles per year.
Correlation=0.071

010
020
030
040
0
1985 1990 1995 2000 2005 2010
Papers sorted into 5 most ‘Republican’ or ‘Democratic’ groups using the media slant measure from Gentzkow & Shapiro (2010).
D Bias test: compare 5 most Republican and 5 most Democrat papers – they looks similar
Reagan, Bush I
Bush IIClinton Obama

We approach policy uncertainty methodically
1) Measuring policy uncertainty
2) Evaluating our measure
3) Estimating the impact of policy uncertainty
- Firm-level regressions
- Macro VARs

Microdata: Firm-level estimates exploit differences in industry exposure to government
Use the Federal Registry of Contracts and match this to Compustat firms (using Compustat parent & D&B subsid names)
Generate average industry contracts/revenue (1999 to 2012)

Yit = Fi + Pt + α*Expj*Govt + β*Expj*EPUt + εi,t
Microdata: Run firm level panel regressions
Firm stock price volatility
Firm fixed effects
Period fixed effects
Firm government exposure × government expenditure(1st moment effect)
Firm government exposure × policy uncertainty(2nd moment effect)
i=firm, j=industry, t=quarterEstimated firm by quarter 1996-2012, standard-errors clustered by j
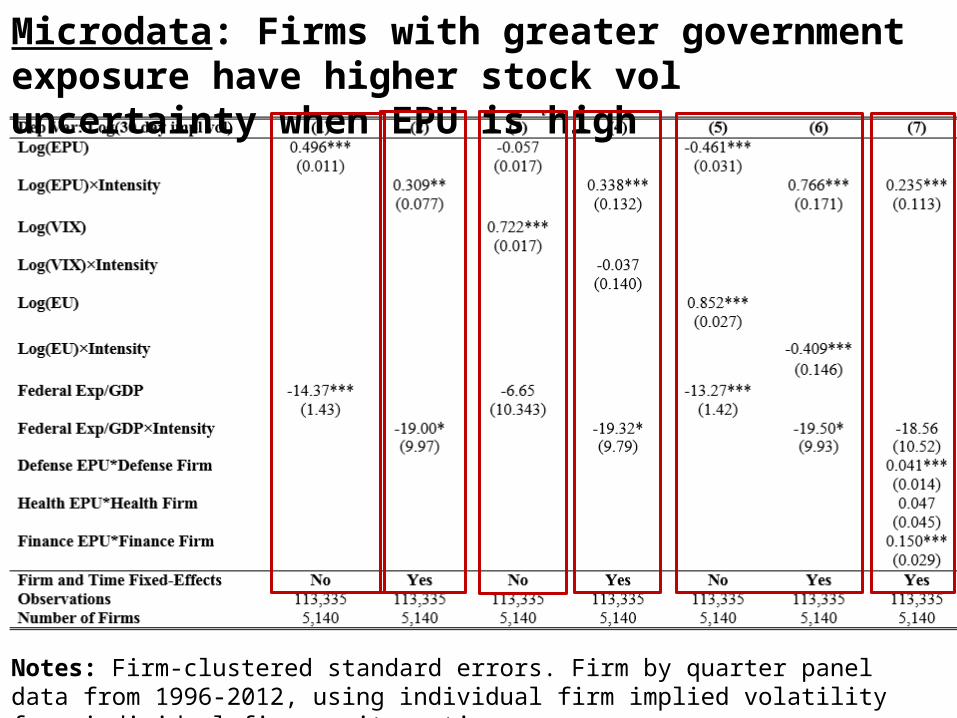
Microdata: Firms with greater government exposure have higher stock vol uncertainty when EPU is high
Notes: Firm-clustered standard errors. Firm by quarter panel data from 1996-2012, using individual firm implied volatility from individual firm equity options.

Microdata: Stock vol uncertainty results are very robust to different measures, samples and controls
Notes: Firm-clustered standard errors. Firm by quarter panel data from 1996-2012, using individual firm implied volatility from individual firm equity options.

Microdata: Firms in sectors with higher government exposure cut investment & hiring when EPU is high
Notes: Firm-clustered standard errors. Firm by quarter panel data for investment and firm by year for employment from 1985-2012.

27
Magnitude for Investment and Employment v. large
in exposed sectors (health, defense & construction)
• Consider EPU increase from 2005/6 to 2011/12 (84%) for firm with govt. exposure of 0.25 (health, defense & constr.).
• Results suggest reduce investment by 9% (similar to average recessionary drop in NIPA investment of 8.5%)
• Results suggest reduce employment by 12% (much larger than average recessionary drop in employment of 2%)

We approach policy uncertainty methodically
1) Measuring policy uncertainty
2) Evaluating our measure
3) Estimating the impact of policy uncertainty
- Firm-level regressions
- Macro VARs

VAR for US industrial production and employment after a 2005/6 to 2011/12 sized EPU shock
Ind
ust
rial
Pro
du
ctio
n, (
%)
Months after the economics policy uncertainty shock
Notes: The impulse response function for Industrial Production and Employment to a rise in the policy-related uncertainty index from the 2005-2006 average value to the 2011-2012 average value. The central (black) solid line is the mean estimate, the dashed (red) outer lines are the one SE bands. Estimated using a monthly Cholesky Vector Auto Regression on: the EPU index, log(S&P 500), federal funds rate, log employment, log industrial production. Monthly data from 1985M1 to 2012M12, using 3 lags.
Em
plo
ymen
t Im
pac
t, (
%)
-1.5
-1
-.5
0.5
1
0 6 12 18 24 30 36year
-.6
-.4
-.2
0.2
0 6 12 18 24 30 36year

-1.5
-1-.
50
.5
0 6 12 18 24 30 36year
VAR robustness
Months after the policy uncertainty shockNotes: This shows the impulse response function for GDP and employment to an increase in the policy-related uncertainty index from the 2005-2006 average to the 2011-2012 average. Estimated using a monthly Cholesky Vector Auto Regression (VAR) of the uncertainty index, log(S&P 500 index), federal reserve funds rate, log employment and log industrial production with 3 lags unless otherwise specified. Data from 1985 to 2012, except for the pre-1985 data spec which uses EPU and IP data from 1920 to 1984.
Ind
ust
rial
Pro
du
ctio
n Im
pac
t(%
dev
iati
on
)
Baseline Bivariate (EPU and industrial production)
Six months of lags
1920-1984 historical data
Adding EU(after EPU)
Adding VIX(after EPU)
Reverse bivariate (industrial production & EPU)

11 Country Panel VAR, with Country & Period FEsIn
du
stri
al P
rod
uct
ion
, (%
)
Months after the economics policy uncertainty shock
Notes: Shows the impulse response function for Industrial Production and employment to an increase in the policy-related uncertainty index from the 2005-2006 average value to the 2011-2012 average value. The central (black) solid line is the mean estimate while the dashed (red) outer lines are the one-standard-error bands. Estimated using a monthly Cholesky Vector Auto Regression (VAR) with 3 lags on the EPU index, log(S&P 500 index), unemployment rate, and log industrial production, plus a full set of country, year and month fixed-effects. Country data weighted by the number of newspapers used to make the EPU series. Fit to monthly data from 1985M1 to 2012M12 where available. Estimated on data from Canada, China, France, Germany, India, Italy, Japan, Russia, Spain, UK and the USA.U
nem
plo
ymen
t Im
pac
t, (
%)
-1.5
-1
-.5
0
0 6 12 18 24 30 36year
0.1
.2.3
.4
0 6 12 18 24 30 36year

-1.5
-1-.
50
0 6 12 18 24 30 36year
11 Country Panel VAR robustness
Months after the policy uncertainty shock
Ind
ust
rial
Pro
du
ctio
n Im
pac
t(%
dev
iati
on
)
Baseline
Bivariate (EPU and industrial production)
Six months of lags
Adding stock volatility
Reverse bivariate (industrial production & EPU)
Dropping stock-price
Notes: XXXX This shows the impulse response function for GDP and employment to an increase in the policy-related uncertainty index from the 2005-2006 average to the 2011-2012 average. Estimated using a monthly Cholesky Vector Auto Regression (VAR) of the uncertainty index, log(S&P 500 index), federal reserve funds rate, log employment and log industrial production with 3 lags unless otherwise specified. Data from 1985 to 2012, except for the pre-1985 data spec which uses EPU and IP data from 1920 to 1984.
No country or time FEs

Conclusions
1. Policy uncertainty fluctuates at a high frequency, driven by the business cycle, the political factors, & shocks (e.g. wars)
2. Policy uncertainty appears to have risen since the 1960s (maybe from political polarization & larger government)
3. Firm-level (and VAR) evidence suggests EPU can:• Substantially increase stock-volatility and reduce hiring &
investment, in defense, healthcare & construction• Moderately reduce overall output and employment

Data available at: www.policyuncertainty.com
Finally, should note all the data is online

Back-Up

Future Work: working on firm-level surveys
Projecting ahead over the next twelve months, please provide the approximate percentage change in your firm's SALES LEVELS for:
• The LOWEST CASE change in my firm’s sales levels would be: -9 %• The LOW CASE change in my firm’s sales levels would be: -3 %• The MEDIUM CASE change in my firm’s sales levels would be: 3 %• The HIGH CASE change in my firm’s sales levels would be: 9 %• The HIGHEST CASE change in my firm’s sales levels would be: 15 %
Numbers in red are the average response from the pilot on 300 firms
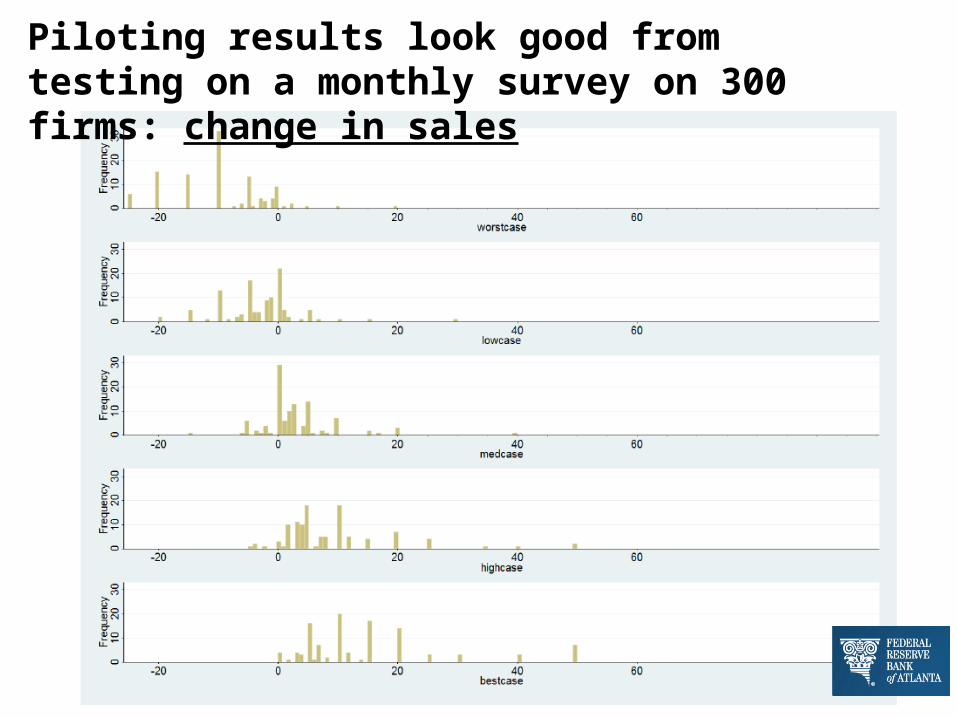
Piloting results look good from testing on a monthly survey on 300 firms: change in sales

Please assign a percentage likelihood to these SALES LEVEL changes you selected above (values should sum to 100%)
• 10 % : The approximate likelihood of realizing the LOWEST CASE change• 18 % : The approximate likelihood of realizing the LOW CASE change• 40 % : The approximate likelihood of realizing the MEDIUM CASE change• 23 % : The approximate likelihood of realizing the HIGH CASE change• 9 % : The approximate likelihood of realizing the HIGHEST CASE change
Numbers in red are the average response from the pilot on 300 firms
Can also ask about probabilities

Piloting results look good from testing on a monthly survey on 300 firms: probabilities

Notes: Data from “The buzz: Links between policy uncertainty and equity volatility”, by Krag Gregory and Jose Rangel, Goldman Sachs, November 12, 2012.
Correlation EPU and 1 month=0.578Correlation EPU and 10 years=0.855
1020
3040
5060
5010
015
020
025
0E
cono
mic
pol
icy
unce
rtai
nty
2002 2004 2006 2008 2010 2012
Implied volatility
1 Month Implied Volatility (♦)
10 Year Implied Volatility (+)
Economic Policy
Uncertainty (•)
Stock market data: More similar to 10 year index of implied volatility on the S&P500 (correlation 0.73)

Jan-85
Jan-86
Jan-87
Jan-88
Jan-89
Jan-90
Jan-91
Jan-92
Jan-93
Jan-94
Jan-95
Jan-96
Jan-97
Jan-98
Jan-99
Jan-00
Jan-01
Jan-02
Jan-03
Jan-04
Jan-05
Jan-06
Jan-07
Jan-08
Jan-09
Jan-10
Jan-11
Jan-12
Jan-13
0
20
40
60
80
100
120
140
160 Monetary Fiscal Health Security Regulation
The key sources of policy uncertainty from 1985
Note: This quarterly chart shows the 5 most important sources of economic policy uncertainty based on frequency counts of newspaper articles.
GulfWar I
Clinton Election
Gulf War II
9/11
Lehman and TARP
Black Monday
Fiscal cliff, Europe and DebtCeiling
Gingrich Shutdown
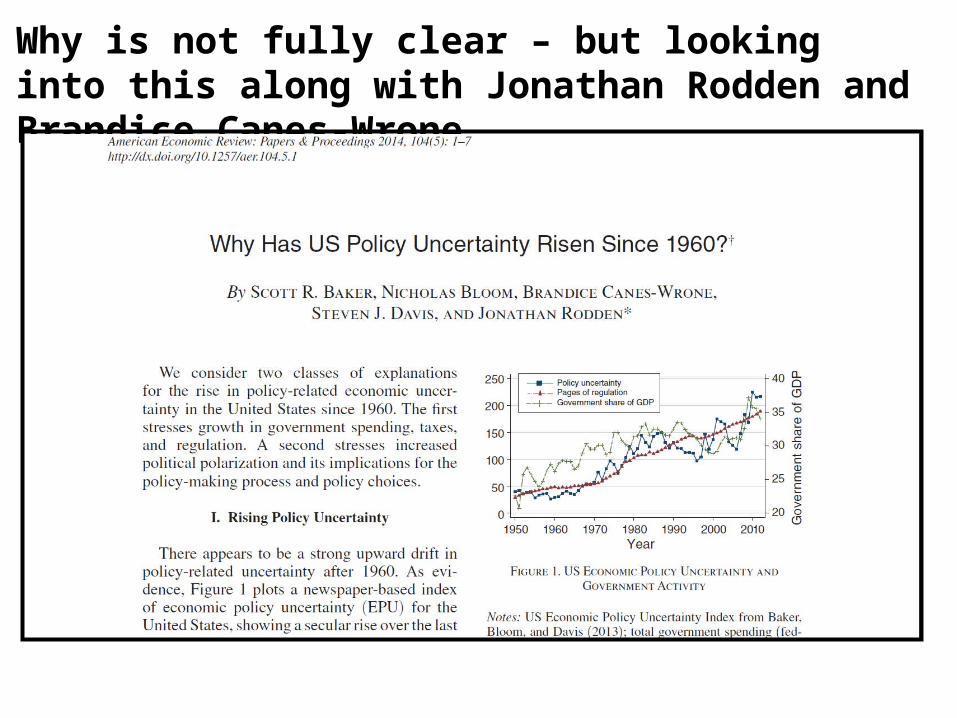
Why is not fully clear – but looking into this along with Jonathan Rodden and Brandice Canes-Wrone

Notes: Frequency of the triple of “economy/economic”, “uncertain/uncertainty” and one of a collection of financial market terms (stock price, equity price, stock market) in 10 major US papers and normalized by the total number of articles, by month and paper. Both series scaled to same mean. Each series set to mean of 100 over entire period.
43
Correlation=0.733
Also tested by fitting events we know - VIX

44
Note: Plots the frequency of the word “uncertain” in each quarter of the Federal Open Market Committees’ (FOMC) Beige Book. Data from 1983Q4 (when the Beige book started) to 2013Q1. The Beige Book is an overview of economic conditions of about 15,000 words in length prepared two weeks before each FOMC meeting. The count of “Policy Uncertainty” uses a human audit to attribute each mention of the word uncertain to a policy context (e.g. uncertainty about fiscal policy) or a non-policy context (e.g. uncertainty about GDP growth). See the paper for full details.
05
10
15
20
25
30
35
40
45
50
1983
1985
1987
1989
1991
1993
1995
1997
1999
2001
2003
2005
2007
2009
2011
2013
Uncertainty Policy Uncertainty
Surveys: e.g. compare to the FOMC Beige Book’s mentions of uncertainty and policy uncertainty
Correlation with our EPU index=0.72

1990 Q4 - 1991 Q1
Gulf War I
1993 Q2 - 1993 Q3
Clinton Tax Reforms
2001 Q4 - 2002 Q2
9/11 Attacks
2002 Q4 - 2003 Q2
Gulf War II
2004 Q2 - 2004 Q4
Bush/Kerry Election
2008 Q3 - 2009 Q4
Lehman's and recession
2010 Q1 - 2013 Q1
Debt-ceiling crisis
1983 Q3 – 2013 Q1 Overall Average
Overall Economic Uncertainty 11 8.8 7.7 13.5 5.2 10.2 15.8 5.5Economic Policy Uncertainty 5.5 6.3 1.2 4.8 2.8 0.8 6.8 1.7All Fiscal Matters 1 5.5 1.5 0 0 0.4 3.3 1.0
Taxes Only 0 3.3 0.2 0 0 0.3 1.4 0.4Spending Only 0.5 1 1 0 0 0.2 1.2 0.3
Monetary Policy 0 0 0 0 0 0 0 0Health Care 0 2 0 0 0 0.2 0.5 0.1National Security and War 5.3 0.3 0 2 0 0 0.1 0.2Financial Regulation 0 0 0 0 0 0.2 1.2 0.2Sovereign debt, currency crisis 0 0 0 0 0 0 0.8 0.1U.S. Elections and Leadership Changes 0 0 0 0.2 2.2 0 0.9 0.2Other Specified Policy Matters 0 0.5 0.7 0 0.2 0 0.5 0.2Politics, Unspecified 0.5 1 0 3 0.7 0 1.6 0.3Sum of Policy & Politics Categories 6.8 9.3 2.2 5.2 3.0 0.8 10.0 2.5
Beige Book breakdown also points to similar factors