Embed Size (px)
Citation preview

Introduction: the aim of the paperStatistical Inference: the theoryStatistical Inference: the results
The conclusion of the paperFuture research
Measuring Cultivation Parcels with GPS: aStatistical Evidence
Gabriele [email protected]
June 12, 2009
Gabriele PALMEGIANI [email protected] Measuring Cultivation Parcels with GPS: a Statistical Evidence

Introduction: the aim of the paperStatistical Inference: the theoryStatistical Inference: the results
The conclusion of the paperFuture research
Contents
1 Introduction: the aim of the paperStudying the statistical relevance of measuring cultivationparcels with GPS respect to the traditional method usingcompass and meter
2 Statistical Inference: the theoryUncoditional Inference approachConditional Inference approach
3 Statistical Inference: the resultsPreliminary workThe Unconditional Inference resultThe Conditional Inference result
4 The conclusion of the paper
5 Future research
Gabriele PALMEGIANI [email protected] Measuring Cultivation Parcels with GPS: a Statistical Evidence
Introduction: the aim of the paperStatistical Inference: the theoryStatistical Inference: the results
The conclusion of the paperFuture research
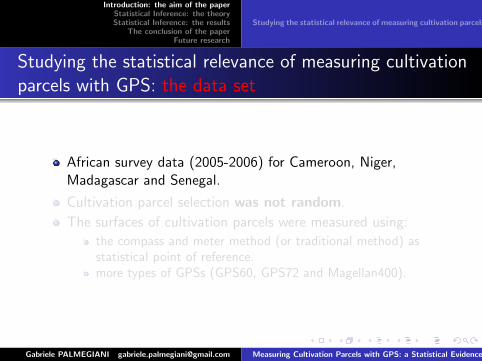
Studying the statistical relevance of measuring cultivation parcels with GPS respect to the traditional method using compass and meter
Studying the statistical relevance of measuring cultivationparcels with GPS: the data set
African survey data (2005-2006) for Cameroon, Niger,Madagascar and Senegal.
Cultivation parcel selection was not random.
The surfaces of cultivation parcels were measured using:
the compass and meter method (or traditional method) asstatistical point of reference.more types of GPSs (GPS60, GPS72 and Magellan400).
Gabriele PALMEGIANI [email protected] Measuring Cultivation Parcels with GPS: a Statistical Evidence

Introduction: the aim of the paperStatistical Inference: the theoryStatistical Inference: the results
The conclusion of the paperFuture research
Studying the statistical relevance of measuring cultivation parcels with GPS respect to the traditional method using compass and meter
Studying the statistical relevance of measuring cultivationparcels with GPS: the data set
African survey data (2005-2006) for Cameroon, Niger,Madagascar and Senegal.
Cultivation parcel selection was not random.
The surfaces of cultivation parcels were measured using:
the compass and meter method (or traditional method) asstatistical point of reference.more types of GPSs (GPS60, GPS72 and Magellan400).
Gabriele PALMEGIANI [email protected] Measuring Cultivation Parcels with GPS: a Statistical Evidence

Introduction: the aim of the paperStatistical Inference: the theoryStatistical Inference: the results
The conclusion of the paperFuture research
Studying the statistical relevance of measuring cultivation parcels with GPS respect to the traditional method using compass and meter
Studying the statistical relevance of measuring cultivationparcels with GPS: the covariates of interest
The covariates of interest (all expressed in squared meters) are:
S 1 = Compass and meter cultivation parcel surface.
S 21 1 = Garmin60 (GPS60) cultivation parcel surface.
S 22 1 = Garmin72 (GPS72) cultivation parcel surface.
S 24 1 = Magellan400 (MAG400) cultivation parcel surface.
We shall interested in the following differences:
1 c g60diff = The difference between compass cultivation parcel surfaceand Garmin60 cultivation parcel surface.
2 c g72diff = The difference between compass cultivation parcel surfaceand Garmin72 cultivation parcel surface.
3 c m400diff = The difference between compass cultivation parcel surfaceand Magellan400 cultivation parcel surface.
Gabriele PALMEGIANI [email protected] Measuring Cultivation Parcels with GPS: a Statistical Evidence

Introduction: the aim of the paperStatistical Inference: the theoryStatistical Inference: the results
The conclusion of the paperFuture research
Studying the statistical relevance of measuring cultivation parcels with GPS respect to the traditional method using compass and meter
Studying the statistical relevance of measuring cultivationparcels with GPS: the main matter
The cultivation parcel selection was not random. Indeed, sampleshave not been generated by a random mechanism (intentionalselection exists). It implies that:
Common statistical tests, such as t-tests, cannot work wellsince they assume randomness.
The lose of accurancy may become greater when samplesare smaller.
The statistical inference cannot have nothing to do with thesampling (we must take care of the nonrandomness of thesamples).
Gabriele PALMEGIANI [email protected] Measuring Cultivation Parcels with GPS: a Statistical Evidence
Introduction: the aim of the paperStatistical Inference: the theoryStatistical Inference: the results
The conclusion of the paperFuture research
Uncoditional Inference approachConditional Inference approach
Statistical Inference: the theory
Basically, there are two ways to do statistical inference:Unconditional (or simple) Inference
randomness of parcel selection is assumed.we may assume normality (parametric approach) or not(nonparametric approach) of the differences.we may assume paired samples (pairing is effective when twomeasurements are strongly correlated) unpared samples(measurements are uncorrelated - they cannot influence eachother).
Conditional Inferencerandomness of parcel selection is not assumed.parametric statistical tables (such as t or F tables) are notvalid, because they are based on theoretical distributions whichassume randomness. Empirical distributions of the teststatistic should be used instead.the resampling is the tool to depart from theoreticaldistributions to empirical distributions.Gabriele PALMEGIANI [email protected] Measuring Cultivation Parcels with GPS: a Statistical Evidence

Introduction: the aim of the paperStatistical Inference: the theoryStatistical Inference: the results
The conclusion of the paperFuture research
Uncoditional Inference approachConditional Inference approach
Statistical Inference: the Unconditional Inference
The Unconditional inference approach can be done according to this table:
We found strong correlationbetween couples ofmeasurements, it implies thatpairing is effective, then samplesmust be treated as paired.
Then, to study the statisticalrelevence of measuring cultivationparcels with GPS, we may useboth parametric andnonparametric tests. Since thedata set is continuous, we shallhave to deal with paired t-testand the Wilcoxon Sign Rank testrespectively.
Gabriele PALMEGIANI [email protected] Measuring Cultivation Parcels with GPS: a Statistical Evidence

Introduction: the aim of the paperStatistical Inference: the theoryStatistical Inference: the results
The conclusion of the paperFuture research
Uncoditional Inference approachConditional Inference approach
Statistical Inference: the Unconditional Inference
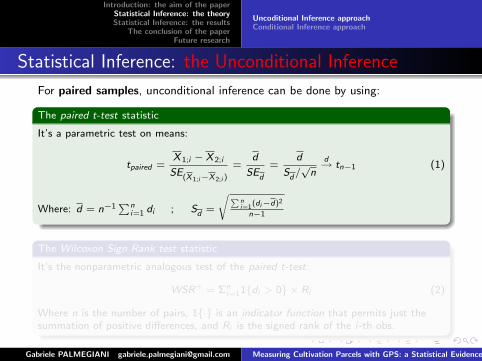
For paired samples, unconditional inference can be done by using:
The paired t-test statistic
It’s a parametric test on means:
tpaired =X 1;i − X 2;i
SE(X 1;i−X 2;i )
=d
SEd
=d
Sd /√
n
d→ tn−1 (1)
Where: d = n−1∑n
i=1 di ; Sd =
√ ∑ni=1(di−d)2
n−1
The Wilcoxon Sign Rank test statistic
It’s the nonparametric analogous test of the paired t-test:
WSR+ = Σni=11{di > 0} × Ri (2)
Where n is the number of pairs, 1{·} is an indicator function that permits just thesummation of positive differences, and Ri is the signed rank of the i-th obs.
Gabriele PALMEGIANI [email protected] Measuring Cultivation Parcels with GPS: a Statistical Evidence
Introduction: the aim of the paperStatistical Inference: the theoryStatistical Inference: the results
The conclusion of the paperFuture research
Uncoditional Inference approachConditional Inference approach
Statistical Inference: the Unconditional Inference
For paired samples, unconditional inference can be done by using:
The paired t-test statistic
It’s a parametric test on means:
tpaired =X 1;i − X 2;i
SE(X 1;i−X 2;i )
=d
SEd
=d
Sd /√
n
d→ tn−1 (1)
Where: d = n−1∑n
i=1 di ; Sd =
√ ∑ni=1(di−d)2
n−1
The Wilcoxon Sign Rank test statistic
It’s the nonparametric analogous test of the paired t-test:
WSR+ = Σni=11{di > 0} × Ri (2)
Where n is the number of pairs, 1{·} is an indicator function that permits just thesummation of positive differences, and Ri is the signed rank of the i-th obs.
Gabriele PALMEGIANI [email protected] Measuring Cultivation Parcels with GPS: a Statistical Evidence

Introduction: the aim of the paperStatistical Inference: the theoryStatistical Inference: the results
The conclusion of the paperFuture research
Uncoditional Inference approachConditional Inference approach
Statistical Inference: the Conditional Inference
When the random sampling assumption is not satisfied, statisticalinference can be done through resampling methods:
Randomization tests: Also known as permutation tests.The aim is to make inference by estimating the empiricaldistribution of the test statistic (called the permutationdistribution).
Jackknife: The aim is to estimate the population distributionby deleting one observation at time (standard error and biasestimation).
Bootstrap: The aim is to estimate the distribution of apopulation by resampling with replacement (standard errorand bias estimation).
Because we are interested in inference and not in estimators’reliability, we shall have to dealing with permutations tests.
Gabriele PALMEGIANI [email protected] Measuring Cultivation Parcels with GPS: a Statistical Evidence

Introduction: the aim of the paperStatistical Inference: the theoryStatistical Inference: the results
The conclusion of the paperFuture research
Preliminary workThe Unconditional Inference resultThe Conditional Inference result
The preliminary work
Working on differences, as preliminary work we have checked the satisfaction of allassumptions for applying correctly a t-test. We found:
t-test assumptions Features found
1) Normality (measurements must be normal 1a) c g60diff can be considered near normal.or near normal distributed) 1b) c g72diff can be considered near normal.
1c) c m400diff cannot be considered normal.2) Independence (measurements cannot be 2a) It is satisfied, because measurementsinfluence each other) cannot influence each other.3) Random Sampling (measurements must be We may assume that the selection was:random variables) (random selection avoids 3a) Random→ t-tests work wellconscious or unconscious bias) 3b) Not random→ t-tests do not work well
→ use permutation tests4) Variance Homogeneity (measurements We must assume that samples are paired:must have the same variance) → tests on variances have not any sense
→ the standard deviation of paired differences Sd
is assumed as the only measure of variability5) No Outliers (all possible outliers must be 5a) Some evidence of outliers remains.deleted before the applied analysis)
So, the features found suggest the conditional inference approach.
Gabriele PALMEGIANI [email protected] Measuring Cultivation Parcels with GPS: a Statistical Evidence

Introduction: the aim of the paperStatistical Inference: the theoryStatistical Inference: the results
The conclusion of the paperFuture research
Preliminary workThe Unconditional Inference resultThe Conditional Inference result
The results: the paired t-test
Paired t-test
Panel: Adata: S.1 and S.21.1tpaired = 0.7262; df = 87; p-value = 0.4697alter. hypothesis: true difference in means is not equal to 095 percent confidence interval: [-30.61026 ; 65.85185]mean of the differences: 17.62080
Panel: Bdata: S.1 and S.22.1tpaired = 3.9084; df = 125; p-value = 0.0001514alter. hypothesis: true difference in means is not equal to 095 percent confidence interval: [50.44549 ; 153.94531]mean of the differences: 102.1954
Panel: Cdata: S.1 and S.24.1tpaired = 5.8224; df = 125; p-value = 4.601e-08alter. hypothesis: true difference in means is not equal to 095 percent confidence interval: [95.06151 ; 192.96658]mean of the differences: 144.0140
In Panel A, traditional method and Garmin60 methodare compared. Since the p-value is greater than thesignificance level (0.4697 > 0.05), we cannot rejectthe null hypothesis that the true difference in means isequal to zero, then we can conclude stating that parcelestimates using Garmin60 are not statistically differentfrom parcel estimates using traditional method.
In Panel B, traditional method and Garmin72 methodare faced toward. Since the p-value is now smaller thanthe significance level (0.0001514 < 0.05), we canreject the null hypothesis and we can conclude statingthat parcel estimates using Garmin72 are statisticallydifferent from parcel estimates using traditionalmethod.
In Panel C, traditional method and Magellan400method are compared. Since the p-value is smaller than
the significance level (4.601e−08 < 0.05), we canreject the null hypothesis and we can conclude statingthat parcel estimates using Magellan400 arestatistically different from parcel estimates usingtraditional method.
In panel B and C, the mean of the differences ispositive, it implies that parcel estimates usingtraditional method are larger than parcel estimatesusing GPS72 and MAG400.
Gabriele PALMEGIANI [email protected] Measuring Cultivation Parcels with GPS: a Statistical Evidence

Introduction: the aim of the paperStatistical Inference: the theoryStatistical Inference: the results
The conclusion of the paperFuture research
Preliminary workThe Unconditional Inference resultThe Conditional Inference result
The results: the paired t-test
Summarizing, the paired t-test states that:
Paired t-test: the results
1) Statistical equivalency:* traditional method is statistically equivalent to the Garmin60 method.* traditional method is statistically different to the Garmin72 method.* traditional method is statistically different to the Mag400 method.
2) Parcel estimates:* using traditional method are larger than parcel estimates using Garmin72 method.* using traditional method are much more larger than parcel estimates using Mag400 method.
Here, randomness and normality are supposed, but these assumptions are not satisfied
by the data set. We need: first, to relax the assumption of normality mainteining
randomness (Wilcoxon Sign Rank test (WSR)), second, to relax both the assumption
of normality and randomness (paired t-permutation test).
Gabriele PALMEGIANI [email protected] Measuring Cultivation Parcels with GPS: a Statistical Evidence
Introduction: the aim of the paperStatistical Inference: the theoryStatistical Inference: the results
The conclusion of the paperFuture research
Preliminary workThe Unconditional Inference resultThe Conditional Inference result
The results: the WSR test
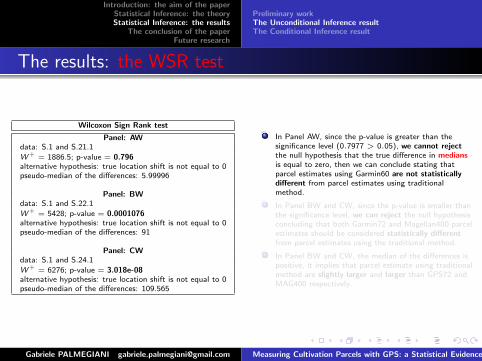
Wilcoxon Sign Rank test
Panel: AWdata: S.1 and S.21.1
W + = 1886.5; p-value = 0.796alternative hypothesis: true location shift is not equal to 0pseudo-median of the differences: 5.99996
Panel: BWdata: S.1 and S.22.1
W + = 5428; p-value = 0.0001076alternative hypothesis: true location shift is not equal to 0pseudo-median of the differences: 91
Panel: CWdata: S.1 and S.24.1
W + = 6276; p-value = 3.018e-08alternative hypothesis: true location shift is not equal to 0pseudo-median of the differences: 109.565
In Panel AW, since the p-value is greater than thesignificance level (0.7977 > 0.05), we cannot rejectthe null hypothesis that the true difference in mediansis equal to zero, then we can conclude stating thatparcel estimates using Garmin60 are not statisticallydifferent from parcel estimates using traditionalmethod.
In Panel BW and CW, since the p-value is smaller thanthe significance level, we can reject the null hypothesisconcluding that both Garmin72 and Magellan400 parcelestimates should be considered statistically differentfrom parcel estimates using the traditional method.
In Panel BW and CW, the median of the differences ispositive, it implies that parcel estimate using traditionalmethod are slightly larger and larger than GPS72 andMAG400 respectively.
Gabriele PALMEGIANI [email protected] Measuring Cultivation Parcels with GPS: a Statistical Evidence

Introduction: the aim of the paperStatistical Inference: the theoryStatistical Inference: the results
The conclusion of the paperFuture research
Preliminary workThe Unconditional Inference resultThe Conditional Inference result
The results: the WSR test
Summarizing, we WSR test states that:
Wilcoxon Sign Rank test: the results
1) Statistical equivalency:* traditional method is statistically equivalent to the Garmin60 method.* traditional method is statistically different to the Garmin72 method.* traditional method is statistically different to the Magellan400 method.
2) Parcel estimates:* using traditional method are slightly larger than parcel estimates using Garmin72 method.* using traditional method are larger than parcel estimates using Magellan400 method.
Here, normality is relaxed, but randomness is mainteined. The second step is to relax
randomness too. We will provide that, in the conditional inference approch.
Gabriele PALMEGIANI [email protected] Measuring Cultivation Parcels with GPS: a Statistical Evidence
Introduction: the aim of the paperStatistical Inference: the theoryStatistical Inference: the results
The conclusion of the paperFuture research
Preliminary workThe Unconditional Inference resultThe Conditional Inference result
Comparing the results
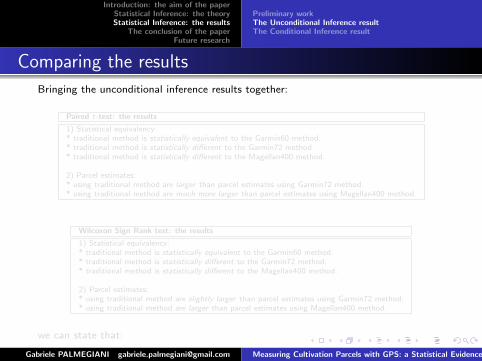
Bringing the unconditional inference results together:
Paired t-test: the results
1) Statistical equivalency:* traditional method is statistically equivalent to the Garmin60 method.* traditional method is statistically different to the Garmin72 method.* traditional method is statistically different to the Magellan400 method.
2) Parcel estimates:* using traditional method are larger than parcel estimates using Garmin72 method.* using traditional method are much more larger than parcel estimates using Magellan400 method.
Wilcoxon Sign Rank test: the results
1) Statistical equivalency:* traditional method is statistically equivalent to the Garmin60 method.* traditional method is statistically different to the Garmin72 method.* traditional method is statistically different to the Magellan400 method.
2) Parcel estimates:* using traditional method are slightly larger than parcel estimates using Garmin72 method.* using traditional method are larger than parcel estimates using Magellan400 method.
we can state that:
Gabriele PALMEGIANI [email protected] Measuring Cultivation Parcels with GPS: a Statistical Evidence

Introduction: the aim of the paperStatistical Inference: the theoryStatistical Inference: the results
The conclusion of the paperFuture research
Preliminary workThe Unconditional Inference resultThe Conditional Inference result
Comparing the results
Bringing the unconditional inference results together:
Paired t-test: the results
1) Statistical equivalency:* traditional method is statistically equivalent to the Garmin60 method.* traditional method is statistically different to the Garmin72 method.* traditional method is statistically different to the Magellan400 method.
2) Parcel estimates:* using traditional method are larger than parcel estimates using Garmin72 method.* using traditional method are much more larger than parcel estimates using Magellan400 method.
Wilcoxon Sign Rank test: the results
1) Statistical equivalency:* traditional method is statistically equivalent to the Garmin60 method.* traditional method is statistically different to the Garmin72 method.* traditional method is statistically different to the Magellan400 method.
2) Parcel estimates:* using traditional method are slightly larger than parcel estimates using Garmin72 method.* using traditional method are larger than parcel estimates using Magellan400 method.
we can state that:
Gabriele PALMEGIANI [email protected] Measuring Cultivation Parcels with GPS: a Statistical Evidence

Introduction: the aim of the paperStatistical Inference: the theoryStatistical Inference: the results
The conclusion of the paperFuture research
Preliminary workThe Unconditional Inference resultThe Conditional Inference result
The results
... we can state that:
Unconditional Inference Result
The nonparametric unconditional inference approach based onWSR test supports the parametric conclusions from the pairedt-test:
On the statistical equivalency hand, only Garmin60 is foundstatistically equivalent to the traditional method.
On the parcel estimates hand, the traditional method tends toproduce larger parcels estimates respect to all GPSsmeasurements methods.
Gabriele PALMEGIANI [email protected] Measuring Cultivation Parcels with GPS: a Statistical Evidence

Introduction: the aim of the paperStatistical Inference: the theoryStatistical Inference: the results
The conclusion of the paperFuture research
Preliminary workThe Unconditional Inference resultThe Conditional Inference result
The permutation distribution of paired t-statistic
Generating sample replicates without replacement from the observed samples, we haveestimated the permutation distribution function of the paired t-statistic:
These histogram estimates are theempirical distribution functions of pairedt-test statistic worked out conditionallyto the data at hand.
Under the null hypothesis (that sampleshave the same distribution), the empiricalp-value of the test will be the area of thehistogram estimate outside the absolutevalue interval of the observed statistic(this area is emphasised in gold brown).
A smooth estimate of these histogramdensities can be obtained by using anappropriated Kernel function.
Gabriele PALMEGIANI [email protected] Measuring Cultivation Parcels with GPS: a Statistical Evidence

Introduction: the aim of the paperStatistical Inference: the theoryStatistical Inference: the results
The conclusion of the paperFuture research
Preliminary workThe Unconditional Inference resultThe Conditional Inference result
The result: the permutation paired t-test
Permutation paired t-test
Panel: ARdata: S.1 and S.21.1
Observed test statistic: θ̂ = 0.7262; Empirical p-value = 0.472alternative hypothesis; HA : F 6= 0
Panel: BRdata: S.1 and S.22.1
Observed test statistic: θ̂ = 3.9084; Empirical p-value = 0.001alternative hypothesis; HA : F 6= 0
Panel: CRdata: S.1 and S.24.1
Observed test statistic θ̂ = 5.8224; Empirical p-value = 0.001alternative hypothesis; HA : F 6= 0
In Panel AR, the empirical p-value isworked out for the differences betweentraditional method and Garmin60method. Since it is greater than thesignificance level (0.472 > 0.05) wecannot reject the null hypothesis, thenwe can conclude that parcel estimateusing Garmin60 are not “conditionally”statistical different from parcel estimatesusing traditional method.
In Panels BR and CR, the empiricalp-values are smaller than the significancelevel (0.001 < 0.05), then we can rejectthe null hypothesis, stating that parcelestimate using Garmin72 or Magellan400are “conditionally” statistical differentfrom parcel estimates using traditionalmethod.
Gabriele PALMEGIANI [email protected] Measuring Cultivation Parcels with GPS: a Statistical Evidence

Introduction: the aim of the paperStatistical Inference: the theoryStatistical Inference: the results
The conclusion of the paperFuture research
Preliminary workThe Unconditional Inference resultThe Conditional Inference result
Comparing the results
By comparing the paired t-test with its resampling test analogous:
Paired t-test Permutation paired t-test
Panel: A: data S.1 and S.21.1
tpaired = 0.7262; df = 87; p-value = 0.4697 θ̂ = 0.7262; Empirical p-value = 0.472HA : µ 6= 0 HA : F 6= 095 percent confidence interval: [-30.61 ; 65.851]mean of the differences: 17.62080
Panel: B: data S.1 and S.22.1
tpaired = 3.9084; df = 125; p-value = 0.0001514 θ̂ = 3.9084; Empirical p-value: 0.001HA : µ 6= 0 HA : F 6= 095 percent confidence interval: [50.445; 153.945]mean of the differences: 102.1954
Panel: C: data S.1 and S.24.1
tpaired = 5.8224; df = 125; p-value = 4.601e-08 θ̂ = 5.8224; Empirical p-value: 0.001HA : µ 6= 0 HA : F 6= 095 percent confidence interval: [95.061;192.966]mean of the differences: 144.0140
... taking into account these last two tables, we can state that:
Gabriele PALMEGIANI [email protected] Measuring Cultivation Parcels with GPS: a Statistical Evidence

Introduction: the aim of the paperStatistical Inference: the theoryStatistical Inference: the results
The conclusion of the paperFuture research
Preliminary workThe Unconditional Inference resultThe Conditional Inference result
... we can state that:
Conditional Inference Result
On the statistical equivalency hand, empirical p-values produce the sameconclusion of the theoretical ones: only cultivation parcel estimates usingGarmin60 are found statistically equivalent to the traditional method.
On the parcel estimates hand, nothing can be state about the largenessof the cultivation parcels using the conditional approach, then theunconditional inference results remain valid.
... then, collecting the two main findings:
Gabriele PALMEGIANI [email protected] Measuring Cultivation Parcels with GPS: a Statistical Evidence

Introduction: the aim of the paperStatistical Inference: the theoryStatistical Inference: the results
The conclusion of the paperFuture research
Preliminary workThe Unconditional Inference resultThe Conditional Inference result
... collecting the two main findings:
Unconditional Inference Result
On the statistical equivalency hand, only Garmin60 is found statisticallyequivalent to the traditional method.
On the parcel estimates hand, the traditional method tends to producelarger parcels estimates respect to all GPSs measurements methods.
Conditional Inference Result
On the statistical equivalency hand, empirical p-values produce the sameconclusion of the theoretical ones: only cultivation parcel estimates usingGarmin60 are found statistically equivalent to the traditional method.
On the parcel estimates hand, nothing can be state about the largenessof the cultivation parcels using the conditional approach, then theunconditional inference results remain valid.
... we can conclude stating that:
Gabriele PALMEGIANI [email protected] Measuring Cultivation Parcels with GPS: a Statistical Evidence

Introduction: the aim of the paperStatistical Inference: the theoryStatistical Inference: the results
The conclusion of the paperFuture research
... the final conclusion
... because the GPSs methods are globally cheaper than traditionalmethod using compass and meter, it’s strongly recommended theuse of GPS60 to reduce the costs of the agricultural surveys.
Gabriele PALMEGIANI [email protected] Measuring Cultivation Parcels with GPS: a Statistical Evidence

Introduction: the aim of the paperStatistical Inference: the theoryStatistical Inference: the results
The conclusion of the paperFuture research
Future research
For the upcoming papers:1 We suggest to take care about the random mechanism which has generated the
samples. When randomness is not satisfied, we recommend permutation tests.2 We advise to develop this paper: changing the statistical aim or/and changing
the permutation procedure.
Changing the statistical aim
We may study the statistical equivalency taking into account of smaller andbigger parcels separately (find out, if exists, the equivalency surface threshold).
We may study the statistical equivalency for the time requested to do themeasurements (find out, if exists, the equivalency time threshold).
Changing the permutation procedure
We may consider permutation tests which take care of any differences of thetwo samples, not only in means or in medians (Kolmogorov-Smirnov test).
We may compare more than two samples at time (multivariate permutationtests (MPT)). The main type of MPT is based on nearest neighbors.
Gabriele PALMEGIANI [email protected] Measuring Cultivation Parcels with GPS: a Statistical Evidence

Introduction: the aim of the paperStatistical Inference: the theoryStatistical Inference: the results
The conclusion of the paperFuture research
... thank you!!!
Gabriele PALMEGIANI [email protected] Measuring Cultivation Parcels with GPS: a Statistical Evidence