Embed Size (px)
Citation preview

MEASURING CRASHWORTHINESS: MAKE/MODEL RATINGS AND THE INFLUENCE OF AUSTRALIAN
DESIGN RULES FOR MOTOR VEHICLE SAFETY
Max Cameron, Caroline Finch, Stuart Newstead and Tri Le Monash University Accident Research Centre, Victoria, Australia
Andrew Graham and Michael Griffiths Roads and Traffic Authority, New South Wales, Australia
ABSTRACT
Maria Pappas and Jack Haley NRMA Ltd., New South Wales, Australia
This paper updates and extends the methods in a previous paper which gave crashworthiness ratings for makes/models of Australian cars manufactured during 1 982-90. The new results used logistic regression to take into account a larger number of factors which were found to be strongly related to the injury risk and injury severity of drivers. The data covered 220,000 drivers involved in towaway crashes in New South Wales during 1 987-92, and a total of 45,000 drivers injured in crashes in Victoria and New South Wales during the same period . The crashworthiness ratings measured the risk of a driver being killed or admitted to hospital when involved in a tow-away crash. The ratings were able to identify 26 makes/models manufactured during 1 982-92 which have superior or inferior crashworthiness compared with the average vehicle.
The relationship between crashworthiness and year of manufacture was investigated using the same analysis methods and an expanded data set including pre-1 982 vehicles. The data covered 424,000 drivers involved in towaway crashes and 1 02,000 injured drivers. The crashworthiness of passenger cars in Australia showed the greatest improvements for those manufactured over the years 1 970 to 1979 during which a number of new Australian Design Rules aimed at occupant protection took effect. There was a 47% reduction in the risk of serious injury for drivers involved in tow-away crashes while driving the post-1 979 cars compared with those manufactured during the 1 960's.
- 297 -
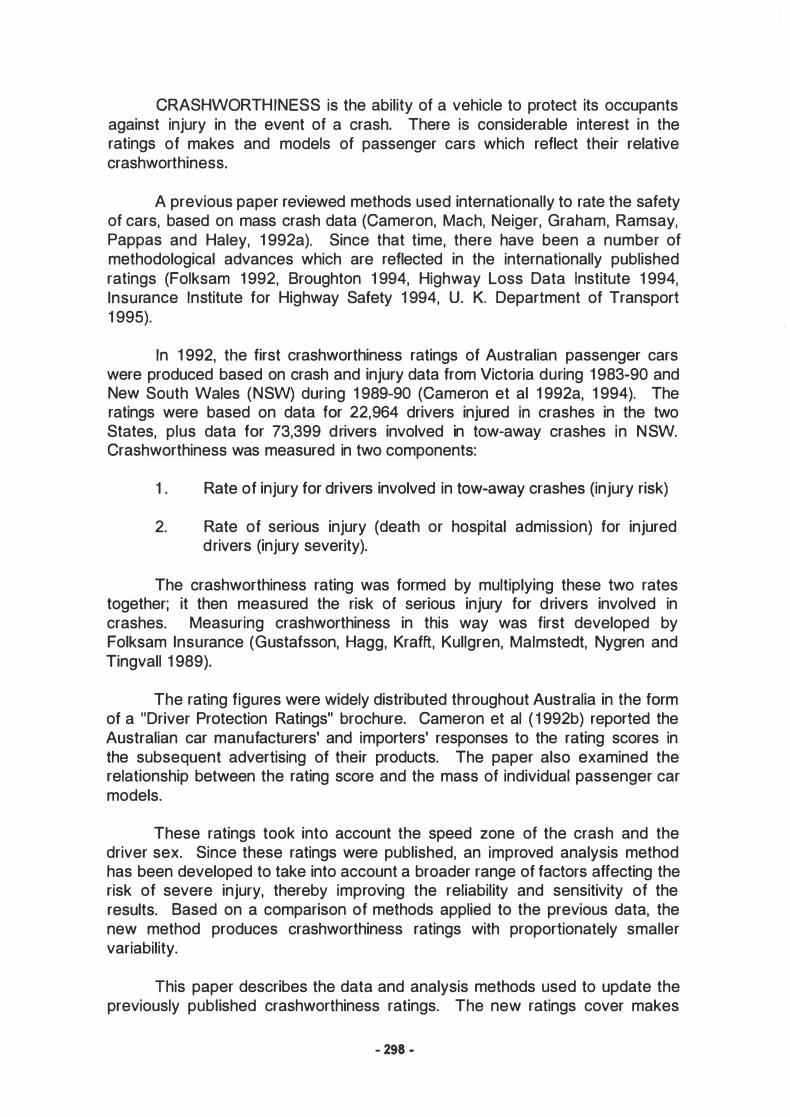
CRASHWORTHINESS is the ability of a vehicle to protect its occupants against injury in the event of a crash. There is considerable interest in the ratings of makes and models of passenger cars which reflect their relative crashworthiness.
A previous paper reviewed methods used internationally to rate the safety of cars, based on mass crash data (Cameron, Mach, Neiger, Graham, Ramsay, Pappas and Haley, 1 992a). Since that time, there have been a number of methodological advances which are reflected in the internationally published ratings (Folksam 1 992, Broughton 1 994, Highway Loss Data Institute 1 994, lnsurance Institute for Highway Safety 1 994, U. K. Department of Transport 1 995).
In 1 992, the first crashworthiness ratings of Australian passenger cars were produced based on crash and injury data from Victoria during 1 983-90 and New South Wales (NSW) during 1 989-90 (Cameron et al 1 992a, 1 994). The ratings were based on data for 22,964 drivers injured in crashes in the two States, plus data for 73,399 drivers involved in tow-away crashes in NSW. Crashworthiness was measured in two components:
1 . Rate of injury for drivers involved in tow-away crashes (injury risk)
2. Rate of serious injury (death or hospital admission) for injured drivers (injury severity).
The crashworthiness rating was formed by multiplying these two rates together; it then measured the risk of serious injury for drivers involved in crashes. Measuring crashworthiness in this way was first developed by Folksam lnsurance (Gustafsson, Hagg, Krafft, Kullgren, Malmstedt, Nygren and Tingvall 1 989).
The rating figures were widely distributed throughout Australia in the form of a "Driver Protection Ratings" brochure. Cameron et al ( 1 992b) reported the Australian car manufacturers' and importers' responses to the rating scores in the subsequent advertising of their products. The paper also examined the relationship between the rating score and the mass of individual passenger car models.
These ratings took into account the speed zone of the crash and the driver sex. Since these ratings were published, an improved analysis method has been developed to take into account a broader range of factors affecting the risk of severe injury, thereby improving the reliability and sensitivity of the results. Based on a comparison of methods applied to the previous data, the new method produces crashworthiness ratings with proportionately smaller variability.
This paper describes the data and analysis methods used to update the previously published crashworthiness ratings. The new ratings cover makes
- 298 -

and models of passenger vehicles manufactured during 1 982-92 and crashing in Victoria or NSW during 1 987-92. The results, given in the appendix, rate passenger vehicles in terms of the risk of the driver being killed or admitted to hospital when involved in a tow-away crash.
This paper also describes an investigation of the relationship between crashworthiness and year of manufacture of passenger cars sold in Australia during 1 964 to 1 992. These years of manufacture were of interest because a number of Australian Design Rules aimed at car occupant protection came into effect during the 1970's. The results are displayed in Figure 1 given later in this paper.
lt should be noted that none of the analysis described in this paper addresses the "aggressivity" of specific models of passenger cars, ie. the threat of injury to pedestrians or occupants of other cars in the event of a collision (Broughton 1 994, U. K. Department of Transport 1 995).
DATA
The crash and injury data used for the update of the crashworthiness ratings were identical in tormat to those used and described previously (Cameron et al 1 992a, 1 994), but also covered crashes during 1 991 and 1 992. The Victorian data were derived from 13,943 Transport Accident Commission claims for injury compensation by drivers of 1 982-92 model cars and station wagons which crashed during 1 987-92, and whose claim records could be matched with Victoria Police accident reports.
The NSW data covered 221 ,971 drivers of 1 982-92 model light passenger vehicles involved in Police reported crashes during 1987-92 which resulted in death or injury or a vehicle being towed away. As well as cars and station wagons, the files covered four-wheel drive vehicles, passenger vans, and light commercial vehicles. Of the 221 ,971 drivers involved in tow-away crashes, 3 1 , 1 27 were injured. When the data on the injured drivers from the two States were combined, there were data on 45,070 injured drivers available for analysis.
The makes and models of the crashed vehicles manufactured during 1 982-92 were derived by processes which involved matching the crash records with the State vehicle register using the registration number, and then decoding information held on the register. The processes were the same as those outlined previously (Cameron et al 1 992a, 1 994).
For the investigation of the relationship between crashworthiness and year of manufacture, cars manufactured prior to 1 982 were also considered. For this analysis, the data covered 423,612 drivers of cars, station wagons and taxis manufactured in 1 964-92 who were involved in tow-away crashes in NSW during 1 987-92. The data also covered 1 01 ,955 drivers of these vehicles who were injured in crashes in Victoria or NSW during the same years.
- 299 -

ANALYSIS
OVERVIEW - The crashworthiness rating (C) is a measure of the risk of serious injury to a driver of a car when it is involved in a crash. This risk can be considered to be the product of two probabilities:
i) the probability that a driver involved in a crash is injured (injury risk), denoted by R;
ii) the probability that an injured driver is killed or admitted to hospital (injury severity), denoted by S.
That is c = R x S .
To produce the updated crashworthiness ratings, each of the two components of the rating were obtained by logistic regression modelling techniques. Such techniques are able to simultaneously adjust for the effect of a number of factors (such as driver age and sex, number of vehicles involved, etc.) on probabilities such as the injury risk and injury severity.
LOGISTIC MODEL - The logistic model of a probability, P, is of the form:
logit(P) = In(�) = ß0 + ß,X1+.„ +ßi.Xk = f(X) . 1 - P
That is, the log of the odds ratio is expressed as a linear function, f , of k associated variables, X1, i = 1, . . . , k . Estimates of the parameter coefficients of the logit function, ie. the ß1 , can be obtained by maximum likelihood estimation (Hosmer & Lemeshow, 1 989). The extension of this model to include interaction terms is straightforward.
LOGISTIC MODELS FOR EACH COMPONENT - To obtain crashworthiness ratings reflecting vehicle factors alone, it was necessary to develop logistic models of each of the crashworthiness components separately to identify possible factors, other than vehicle design, that might have influenced the crash outcomes. This was done initially without considering the type of car in the models as the aim was to determine which other factors were most likely to have an influence across a broad spectrum of crashes.
Logistic models were obtained separately for injury risk (R) and injury severity (S) because it was likely that the various factors would have different levels of influence on these two probabilities. The factors considered during this stage of the analysis for both injury risk and injury severity were:
• sex: driver sex (male, female) • age: driver age (�25 years; 26-59 years; �60 years) • speedzone: speed limit at the crash location (�75 km/h; �80 km/h) • nveh: the number of vehicles involved (one vehicle; > 1 vehicle)
- 300 -

These variables were available in both the Victorian and NSW crash data. Other variables (eg. whether or not the vehicle collided with a fixed object) were highly correlated with these variables, or were only available from one source and their inclusion would have drastically reduced the number of cases that could have been included in the analysis.
All data were analysed using the LR procedure of the BMDP statistical package (BMDP, 1 988). Estimates of the coefficients of the logit function, ß;. i = 1, „ . ,k , together with their associated standard errors, were obtained by maximum likelihood estimation. For both injury risk and injury severity, a stepwise procedure was used to identify which factors and their interactions made a significant contribution to these probabilities. All possible first order interactions were considered. A hierarchal structure was imposed so that if an interaction between two variables was included in the model then the corresponding main effects would also be included. The resultant logistic regression models were referred to as the "covariate" models.
ASSESSING CAR MODEL DIFFERENCES - lnjury risk and injury severity for individual vehicle models were estimated after adding a variable representing car model to the respective logistic "covariate" models. The car model variable was forced into the logistic equation and individual car model coefficients were computed to represent deviations of that car from the average.
lt was important to ensure that the logistic model adequately described the data and did not yield individual car model coefficients that were imprecise or unstable. For this reason, individual car models with small frequencies were pooled with similar car models, if appropriate, or they were excluded from the analysis. Car models were excluded if, after pooling models, either there were less than 1 00 involved vehicles or there were less than 30 injured drivers.
After exclusion, the regression analyses were performed on 87 individual car models (or pooled similar models). The variable representing car model was therefore categorical with 87 nominal levels. The choice of the design for the logistic model allowed the injury risk and injury severity estimates for each car model to be compared with the overall (average) rating for all models considered.
COMBINING INJURY RISK AND INJURY SEVERITY COMPONENTS -
For a given model of car, j, the crashworthiness rating, Ci , was calculated as:
where
Ri denotes the injury risk for car model j
S1 denotes the injury severity for car model j.
- 301 -

Each of the crashworthiness components can be thought of as a binomial probability, which is estimated by the logistic regression procedure as described above. lf we let Ri and S1 denote the logistic estimates of injury risk and injury severity, respectively, then it is straightforward to show that
and
where
( A ) ( A A ) R1 ( 1 -RJ sj ( 1 - sJ Rj ( 1 -RJ A 2 sj ( 1 - sJ A 2
Var C. = Var RS. = · + . S. + · R . 1 1 1 n. m. n. 1 m. 1 J 1 J J
n1
is the number of cars of model j used to estimate � m
i is the number of cars of model j used to estimate S1 • The 95% confidence interval for the combined rate is
Because each of the two estimated crashworthiness components have been adjusted for the effect of other factors by logistic regression prior to their incorporation into the combined ratings, the resultant crashworthiness rating is also adjusted for the influence of these factors.
RELATIONSHIPS WITH YEAR OF MANUFACTURE - For this analysis, the year of manufacture of the cars, station wagons and taxis replaced the car model in the logistic modelling process. There were considerable variations across years of manufacture of the crash-involved vehicles in terms of the mix of driver ages and, to a somewhat lesser extent, of driver sex. There were also considerable variations in terms of the mix of speed zones and the crash type (number of vehicles involved). These variables were considered in the separate logistic models for injury risk and injury severity when investigating the relationship of crashworthiness with year of manufacture.
RESULTS
ESTIMATING INJURY RISK - The logistic regression model of the injury risk component of the crashworthiness ratings of 1 982-92 model vehicles was estimated from the data on 221 ,971 drivers involved in tow-away crashes in NSW. Because of missing values of some of the factors to be included in the logistic regression, analysis was performed on data relating to only 1 82,61 6 involved drivers.
Both driver sex and speedzone were significantly associated with injury risk and were included in the logistic regression as both main effects and an interaction term. No other variable or interaction term significantly improved the fit of the logistic model. The final "covariate" model for injury risk was
- 302 -

log(_B_) = -1.41 + 0. 281 · sex + 0.492 · speedzone - 0.028 · sex · speedzone 1 - R
ESTIMATING INJURY SEVERITY - The injury severity component was based on 45,070 drivers of 1 982-92 model vehicles who were injured in crashes in Victoria or NSW during 1 987-92. Because of missing values of some of the associated crash factors, logistic regression was performed on data relating to only 33,543 injured drivers.
The analysis identified a number of important factors - driver sex, driver age, speedzone and nveh. In addition, significant interactions were found between sex and age, sex and nveh, and age and nveh. No other variable or interaction term significantly improved the fit of the logistic model. The final "covariate" model for injury severity was
log(�) = -0. 93 + 0. 092 · sex - 0. 249 · age(1) + 0. 414 · age(2) + 0. 338 · speedzone 1 - S
+O. 229 · nveh + 0. 1 1 7 · sex · age(1) - 0. 151 · sex · age(2) - 0. 005 · age(1) · nveh -0. 060 · age(2) · nveh - 0. 208 · speedzone · nveh
The driver age variable had three categories and so two contrasts were set up in the regression analysis to handle this variable. Age(1 ) refers to the comparison of drivers aged 26-59 years with those aged <26 years whereas age(2) compares older drivers (>59 years) to the 26-59 year olds.
CRASHWORTHINESS RATINGS - The crashworthiness rating for each car model was obtained by multiplying the individual injury risk and injury severity estimates. The appendix gives the crashworthiness ratings and the associated 95% confidence intervals for the 87 car models included in the analyses. The appendix also indicates the overall ranking of the crashworthiness ratings from 1 (lowest or best crashworthiness rating) to 87 (highest or worst crashworthiness rating).
Each crashworthiness rating is an estimate of the true risk of a driver being killed or admitted to hospital in a tow-away crash and, as such, each estimate has a level of uncertainty about it. This uncertainty is indicated by the confidence limits. There is 95% probability that the confidence interval will cover the true risk of serious injury (death or hospital admission) to the driver of the particular model of vehicle.
The ratings in the appendix exclude those models where the width of the confidence interval exceeded 7, or the ratio of the confidence interval width to the rating score exceeded 2. 1 . This second criterion was necessary because smaller confidence intervals tended to occur for the lower rating scores, but the confidence intervals were relatively wide in proportionate terms.
- 303 -

COMPARISONS WITH THE ALL MODEL AVERAGE RATING - The confidence limits can be used to judge whether the true risk of death or hospital admission for a driver of a specific model car involved in a tow-away crash is significantly different from the overall average for all models, ie. 2.66 per 1 00 involved drivers. An upper limit below the average is indicative of superior crashworthiness, whereas a lower limit above the average suggests inferior crashworthiness. Other models also have crashworthiness ratings at the low or high end of the scale, but their confidence limits overlap the all model average. Although such models may also have superior or inferior crashworthiness characteristics, the data base did not contain sufficient numbers of these models for the data to represent scientific evidence that this is the case.
Fifteen models had ratings representing evidence of superior crashworthiness because their upper confidence limits were less than the average rating. Five of these were large cars and a further six were luxury models. Two were classified as medium cars and one was a relatively old small car. The remaining model was a commercial panel van based on one of the large passenger car models displaying superior crashworthiness. The specific models were (in order of estimated risk of serious driver injury in a crash, from lowest to highest):
• BMW 5 Series (1 983-92 years of manufacture) • Saab 900 Series ( 1 983-92) • Peugeot 505 (1 983-92) • Honda Accord (1 986-89) • Volvo 200 Series ( 1 982-92) • Toyota Crown/Cressida (1 982-85) • Honda Prelude (1 983-92) • Ford Falcon Panel Van ( 1 982-92) • Ford Telstar I Mazda 626 (1 988-91 ) • Ford Falcon EA Sedan (1 988-91 ) • Holden Commodore VNNP (1 988-92) I Toyota Lexcen ( 1989-92) • Ford Falcon X-series Wagon ( 1 982-88) • Mitsubishi Magna (1 985-90) • Ford Falcon X-series Sedan ( 1 982-88) • Toyota Corolla ( 1982-84).
Eleven models had ratings representing evidence of inferior crashworthiness because their lower confidence limits were greater than the average rating. Seven were small cars, three were light commercial vehicles, and the remaining model was a pooled family of passenger vans. The specific models were (in order of estimated risk of serious driver injury in a crash, from highest to lowest):
• Subaru Sherpa/Fiori (1 989-92) • Suzuki Mighty Boy (1 985-88) • Holden Carry (1 985-90) I Suzuki Scurry (1 985-87) • Subaru Brumby (1 982-92)
- 304 -

• Daihatsu Handivan ( 1 982-90) • Suzuki Hatch ( 1 982-89) • Daihatsu Charade ( 1 982-86) • Holden Barina ( 1 985-88) I Suzuki Swift ( 1 985-88) • Honda Civic ( 1 984-87) • Nissan PulsarNector (1 982-86) I Holden Astra ( 1 982-86) • Mitsubishi passenger vans ( 1982-92).
CRASHWORTHINESS RELA TED TO YEAR OF MANUFACTURE - The analysis was performed on 423,612 drivers of 1 964-92 model vehicles involved in tow-away crashes in NSW, and 1 01 ,955 injured drivers of the same models from Victoria and NSW. The "covariate" models from this larger set of data were somewhat more complex than those obtained when crashes and injuries from the 1 982-92 model vehicles were considered (see earlier results), perhaps reflecting the effects of the considerable variations in driver age and sex, speed zone at the crash location, and crash types in vehicles manufactured over the full period 1964 to 1 992.
Fig. 1 - Crashworthiness by year of manufacture (with 95% confidence limits), and commencement years of Australian Design Rules (ADRs) for motor vehicle
safety aimed at occupant protection
.r; III
6.00
s 5.00 c -� �� 4.00 :::J -·cc ·- GI e e 3.oo GI GI ä:; � III 0
.... > 0 .E 2.00 � :.c 11 1.00 e
0..
/ . I f I 1 r l I ! 1 1 Awra� · 3 1 '
- - - - - - - - - - - - - - - - - - - - - - - -{ -! - - - - - - - - - - - - - - - - - - - - - - - - - - - - - ·
III 0:: �
! ! 1 1 1 1 ! 1 1 ! ! ! 1 1 1 0.00 -l-t--+-t--l--+-+--�--+--i--l--+--�--+--i--l--+--+---i--+-+--+--1---1---11--+-t---l
64 65 66 67 68 69 70 71 72 73 74 75 76 77 78 79 80 81 82 83 84 85 86 87 88 89 90 91 92 Year of manufacture
There was a general and significant improvement in vehicle crashworthiness with increasing year of manufacture over the years considered (Figure 1 ). Specifically however, little improvement can be seen in the years 1 964 to 1 969 followed by rapid improvement over the period 1 970 to 1 979 with a plateau from 1 980 to 1 985. There is some visual evidence of a decreasing trend in the period after 1 985 although this trend is not statistically significant. The relatively wide confidence intervals observed on the estimates for the years of
- 305 -

manufacture 1 964 to 1969 and 1992 are a reflection of the smaller numbers of crashes involving vehicles manufactured in these years appearing in the data.
To summarise the magnitude of the improvement in crashworthiness seen in vehicles during the 1 970's, the average crashworthiness estimate for the 1 980-92 year vehicles was compared with the average for those manufactured during 1 964-69. This showed a 47% reduction in the risk of serious injury for drivers involved in tow-away crashes while driving the post- 1 979 vehicles compared with those manufactured during the 1 960's.
Drivers of vehicles manufactured during 1 970 to 1 979 could be expected to have benefited from the commencement of a number of Australian Design Rules (ADRs) for motor vehicle safety which previous research has shown to be effective in providing occupant protection (Cameron 1 987), namely:
• ADR 4 (seat belts fitted in front seats) from 1/1/69 • ADR 2 ("anti-burst" door latches and hinges) from 1/1/71 • ADR 1 OA ("energy-absorbing" steering columns) from 1/1171 • ADR 22 (head restraints) from 1/1/72 • ADR 1 OB (steering columns with limited rearward displacement) from
1/1/73 • ADR 48 (inertia reel seat belts fitted in front seats) from 1/1/75 • ADR 22A (minimum-height adjustable head restraints) from 1/1/75 • ADR 29 (side door strength) from 1/1177.
In addition, the following ADRs introduced over the same period could also be expected to have provided increased injury protection for drivers:
• ADR SA (seat belt anchorage points for front seats) from 1/1/69 • ADR 3 (strengthened seat anchorages) from 1/1/71 • ADR 8 (safety glass in windscreens and side windows) from 1 /7/71 • ADR 1 1 ("padded" sun visors) from 1/1/72 • ADR 14 ("breakaway" rear vision mirrors) from 1/1/72 • ADR 21 ("padded" instrument panels) from 1/1/73 • ADR 4A (improved seat belt buckles), effective from 1 /4174 • ADR 58 (improved location of seat belt anchorages) from 1/1/75 • ADR 4C (dual-sensing locking retractor inertia reel seat belts) from
1/1/76.
The years of implementation of these ADRs are shown on Figure 1 for comparison with the crashworthiness estimates for the vehicles manufactured during the 1 970's. Legislation for compulsory wearing of fitted seat belts, which was introduced in all Australian States and Territories during the early 1 970's, was an important adjunct to the ADRs which required the fitting of seat belts in new cars. The years after 1 978 were characterised by relatively few new ADRs for occupant protection in passenger vehicles, so it is not surprising that crashworthiness appeared to plateau after 1 979.
- 306 -

CONCLUSIONS
The expansion of the crash data base through the addition of four years crash data from NSW and two years from Victoria, and the use of an improved method of analysis, has resulted in more up-to-date, extensive and reliable estimates of the crashworthiness of individual vehicle models than those published previously. The crashworthiness ratings and their associated confidence limits have identified 26 models of passenger cars, four-wheel drive vehicles, passenger vans and light commercial vehicles which have superior or inferior crashworthiness characteristics compared with the average vehicle.
The crashworthiness of passenger cars in Australia has improved over the years of manufacture from 1 964 to 1 992. The improvements have not been regular each year and showed the greatest gains in those cars manufactured over the years 1 970 to 1 979 during which a number of new Australian Design Rules aimed at occupant protection took effect. There was an estimated 47% reduction in the risk of serious injury for drivers involved in tow-away crashes while driving the post-1 979 vehicles compared with those manufactured during the 1 960's.
The results and conclusions presented in this paper are based on a number of assumptions and qualifications. In particular it should be noted that other factors not collected in the data (eg. crash speed) may have d iffered between the models and across years of manufacture, and thus may have affected the results. In addition, vehicle safety was measured only in terms of the injury protection afforded to drivers occupying the cars of specific models and years of manufacture, and did not take into account the threat of injury to pedestrians or occupants of other cars.
ACKNOWLEDGMENTS AND DISCLAIMER
The work described in the first part of this paper was funded through Monash University Accident Research Centre's baseline research program, for which grants were received from Australian Road Research Board, Department of Justice, Royal Automobile Club of Victoria Ltd. , Transport Accident Commission, and VIC ROADS, and by a grant from the NSW Roads and Traffic Authority and NRMA Ltd. Any republication of the crashworthiness ratings whether by way of summary or reproduction of the appendix tables or otherwise is prohibited unless prior written consent is obtained from the Monash University Accident Research Centre and any conditions attached to that consent are satisfied.
The work described in the second part of this paper related to crashworthiness and year of manufacture was funded by a grant from the Royal Automobile Club of Victoria Ltd. No conditions have been attached to the republication of the results related solely to year of manufacture.
- 307 -

REFERENCES
BROUGHTON, J. ( 1 994), "The theoretical basis for comparing the accident record of car models". Project Report 70, Safety and Environment Resource Centre, Transport Research Laboratory, Crowthorne, Berkshire, U.K.
BMDP (1 988), "BMDP Statistical Software Manual Volume 2" (W. J. Dixon, chief editor). University of California Press, Berkeley.
CAMERON, M.H . ( 1 987), "The effectiveness of Australian Design Rules aimed at occupant protection". Proceedings, Seminar on Structural Crashworthiness and Property Damage Accidents. Department of Civil Engineering, Monash University.
CAMERON, M.H. , MACH, T., NEIGER, D. , GRAHAM, A. , RAMSAY, R. , PAPPAS, M. , and HALEY, J . (1 992a), "Vehicle Crashworthiness Ratings In Australia". Proceedings, International Conference on the Biomechanics of Impacts, Verona , ltaly, pp. 1 05-1 1 9.
CAMERON, M.H. , MACH, T., NEIGER, D., GRAHAM, A. , RAMSAY, R., PAPPAS, M., and HALEY, J . (1 992b), "Vehicle Crashworthiness Ratings from Victoria and New South Wales Crash Data". Road and Transport Research, Vol. 1 , No. 3, pp. 4-1 8.
CAMERON, M.H . , MACH, T., NEIGER, D . , GRAHAM, A. , RAMSAY, R. , PAPPAS, M. , and HALEY, J . (1 994), ''Vehicle Crashworthiness Ratings In Australia". Accident Analysis and Prevention, Vol. 26, No. 4, pp. 521-533.
DEPARTMENT OF TRANSPORT (1 995), "Cars: Make and Model: The Risk of Driver lnjury and Car Accident Rates in Great Britain: 1 993". Transport Statistics Report. London: Her Majesty's Stationery Office.
FOLKSAM (1 992), "Safe and dangerous cars: 1 991-1 992". Folksam Research, Folksam lnsurance Group, Stockholm.
GUSTAFSSON, H. , HAGG, A., KRAFFT, M . , KULLGREN, A., MALMSTEDT, B. , NYGREN, A. , and TINGVALL, C. (1 989), "Folksam Car Model Safety Rating 1 989-90". Folksam lnsurance Group, Stockholm.
HIGHWAY LOSS DATA INSTITUTE (1 994), "lnjury, Collision, and Theft Losses by Make and Model". Highway Loss Data Institute, Arlington, Virginia, USA.
HOSMER, D.W., and LEMESHOW, S. ( 1989), "Applied Logistic Regression". Wiley, New York.
INSURANCE INSTITUTE FOR HIGHWAY SAFETY (1 994), "Special lssue: Driver Death Rates by Vehicle Make and Series". Status Report, Vol. 29, No. 1 1 . lnsurance Institute for Highway Safety, Arlington, Virginia, USA.
- 308 -

w
0
CO
AP
PE
ND
IX
Cra
sh
wo
rth
lne
ss
Ra
tin
gs
of
198
2-9
2 M
od
els
of
Ca
rs l
nv
olv
ed
In
Cra
sh
es
Du
rln
g 1
98
7-9
2
AU. M
ODEL
AVER
AGE
2.6
8
2.60
2.7
3
All M
ODEL
AVER
AGE
2.6
8
li.SJ
ei�W
l.iif
iill
lww!
'4rB
tli�1
•W
11WIP.
l%�ffl
l1wJ
J.fJL
miR
{$"E
��
2
.60
Btm
lfit.fil
tlfi[
Kt1Y
ffi&f
$f.tf:l
fil4t1
�il
l�lfäl.i
itili
\t�?±1
flt,lfü
i]l
!t ill
f:l'.1s�f.
%{iflit
t!f8
2
.73
To
yota
Holde
n
CO
RO
LLA
NO
VA
F
ord
For
d
For
d
Holde
n
To
yota
For
d
Mitsubish
i
For
d
Nis
san
Ho
lde
n
FAL
CO
N E
AIEB
WA
GO
N
FA
LC
ON
EA SE
DA
N
FAL
CO
N E
B S
ED
AN
CO
MM
ODO
RE
VNNP
LE
XC
EN
FA
LC
ON
X S
ER
IES
WA
GO
N
MAG
NA
FA
LC
ON
X S
ER
IES
SE
DA
N
SKY
LIN
E
CO
MM
OD
OR
E VH-
VL
8a
-112
8a
-111
91-
92
88
-92
89
-92
82
-88
85
-90
82
-88
82
-90
82
-88
1.7
9
1.94
1.1
9
2.1
1
2.1
5
2.1
5
2.1
1
2.3
7
2.5
0
12
15
17
18
20
21
22
35
39
o.ee
1.
43
0.7
2
1.7
4
1.7
8
1.8
5
1.9
8
1.7
1
2.3
0
2.7
0
2.4
4
3.2
9
2.4
9
2.5
3
2.4
8
2.3
5
3.0
3
2.7
0
a1
:411;
mrrll
f&w1
1,.t
t!�mi
nmr
m1w1
l11J1'n
l11+
a.11
1s1
ü1B
ifl
lfl
Peugeot
For
d
Ma
zda
Nis
san
For
d
To
yota
Holde
n
Mtts
ubi
shl
Nis
san
Toy
ota
Subaru
Mit
sub
ish
i
Nis
san
For
d
Ma
zda
Nis
san
Holden
Maz
da
Nis
san
To
yota
Nis
san
50
5
TE
LS
TA
R
62
8
PIN
TA
RA
CO
RSA
IR
CA
MR
Y
AP
OL
LO
NIM
BU
S
ST
AN
ZA
CO
RO
NA
1800
/LE
ON
E
SIG
MAIS
CO
RP
ION
PIN
TA
RA
TE
LS
TA
R
62
9
BL
UE
BIR
D
CAM
IRA
82
9 P
RAIR
IE
CA
MR
Y
GAZ
EL
LE
83
-92
88
-91
88
-91
89
-92
89
-92
87
-92
89
-92
82
-91
82
-83
83
-87
82
-90
82
-87
118-88
83
-87
83
-88
82
-88
83
-89
82
113
-88
83
-88
114-8
11
1.23
1.1
5
2.1
2
2.3
0
2.3
2
2.34
2.3
5
2.4
1
2.60
2.6
1
2.7
2
2.7
1
2.M
3.1
7
3.3
2
4.1
1
4.1
1
3
14
19
31
32
33
34
38
42
„
48
411
57
84
87
78
79
0.1
5
1.13
1.2
4
1.11
8
0.8
7
0.7
2
2.0
1
1.90
2.2
7
1.8
7
2.3
7
2.3
8
2.8
1
1.6
9
0.11
5
2.4
3
2.3
11
2.3
0
2.5
7
3.00
2.7
3
3.9
7
3.98
2.8
9
3.0
11
2.9
4
3.5
0
3.0
7
3.1
7
3.2
7
4.6
5
5.7
11
5.7
9
5.9
4
To
yota
Maz
da
Mitsubishi
Mit
sub
ishi
To
yota
Nis
san
Ho
lden
For
d
For
d
Ma
zda
Holde
n
CO
RO
LLA
32
3
LA
N C
ER
CO
RD
IA
CO
RO
LLA
PU
LSARNE
CT
OR
AS
TR
A
LAS
ER
/ME
TE
OR
LAS
ER/M
ET
EO
R
32
3
BA
RIN
A
Su
zukl
SV
VIFT
Mit
subi
shi
CO
LT
Nis
san
P
UL
SAR/VEC
TO
R
Holden
AS
T RA
Holden
Hond
a
Ho
lde
n
Hyundal
Honda
Nis
san
Holde
n
Hond
a
Da
lha
tsu
For
d
Hold
en
Su
zukl
Da
iha
tsu
Su
zukl
Da
iha
tsu
Su
ba
ru
GE
MIN
I
CM
C
GE
MIN
I
EX
CE
L
CM
C
PU
LSARN
EC
TO
R
AS
T RA
CM
C
CHA
RA
DE
LAS
ER/M
ET
EO
R
BA
RIN
A
SWI
FT
CH
AR
AD
E
HAT
CH
HA
ND
IVA
N
SH
ER
PAI
FIO
RI
119
-92
119
-92
112
-84
90-9
2
811
-92
83
-89
115
-88
118
-90
88
-90
90
112
-119
82
-88
89
-92
89
-92
82
-90
87
8
7
112
-84
1111
-92
115
-87
116
-92
112
-83
112
-88
114-8
8
114-8
7
88
-92
91-
92
85
-88
85
-88
82
-88
82
-89
82
-90
89
-92
2.1
7
2.1
9
2.1
9
2.2
6
2.7
2
2.n
2.7
9
2.8
0
2.8
8
2.9
0
2.9
6
2.11
3.0
2
3.0
7
3.2
8
3.2
9
3.3
3
3.6
1
3.8
0
3.8
7
4.0
3
4.1
7
4.8
0
5.1
1
5.7
5
6.6
2
23
25
28
28
45
47
49
50
51
53
58
60
81
62
65
68
68
73
74
75
77
110
81
82
83
87
1.4
0
1.7
11
0.2
5
0.9
1
1.6
0
2.3
4
2.1
5
1.8
4
2.8
4
1.8
7
2.5
1
1.9
7
2.4
9
1.6
8
2.3
3
2.3
4
1.5
11
3.1
2
2.7
2
2.5
1
1.9
4
3.2
7
3.5
4
3.3
5
3.1
4
3.7
3
2.IM
2.5
9
4.1
3
3.6
1
3.8
4
3.2
0
3.4
3
3.9
7
3.0
9
4.1
3
3.4
1
4.0
1
3.5
4
4.4
8
4.2
3
4.2
4
5.0
11
4.1
0
4.8
11
5.2
2
8.1
3
5.0
7
8.0
5
6.9
7
8.3
5
9.5
1

w
...
0
AP
PE
ND
IX
Cra
sh
wo
rth
lne
ss
Ra
tin
gs
of
198
2-9
2 M
od
els
of
Ca
rs l
nv
olv
ed
In
Cra
sh
es
Du
rln
g 1
98
7-9
2
All
MO
DE
L A
VE
RA
GE
2.
66
2.60
2.
73
lll
lif.li
�J.JJW
�B
111f
ftftf
ll�T
§l�1t
tlJ�!
1!�!
1il
\l�t
Vffi.l
ll!t
i��il
&f&I
�
BM
W
Saab
Honda
Ra
nge Rover
V
otvo
Votvo
Mercedes
Benz
F
ord
Toy
ota
Honda
Ford
Honda
BM
W
Maz
da
Toyota
Maz
da
5 S
ER
IES
900
AC
CO
RD
700S
ER
IES
200S
ER
IES
200S
ER
IES
300
SE
RIE
S
FA
IRLA
NE
N &
LTD
D
CR
OWN/
CR
ES
SID
A
PR
ELU
DE
FAIR
LAN
E Z
& LT
D F
AC
CO
RD
3 S
ER
IES
829
CE
LICA
RX
7
Alf• Romeo
33
83-8
2
83-8
2
116-118
82-9
2
83-9
1
82-9
2
88-9
2 83
-92
88-8
2
82-8
5
83-9
2
82-8
8
82-8
5
82-9
2
82-90
112-8
5
112-8
5
112-9
2
1.12
1.2
1
ua
1.59
U1
1.11
1.65
1.70
1.78
1.71
2.21
2.46
2.13
2.82
2.80
3.3
4
3.51
2 4 5 8 7 11 8 10
11
30
38
43
58
5-4
88
71
0.08
0.00
0.3
4
0.40
0.48
0.82
0.60
0.58
0.94
0.119
1.6
9
1.4
7
1.5
9
1.8
8
1.11
3
1.4
1
1.2
4
2.1
8
2.44
2.82
2:78
2.75
2.30
2.69
2.82
2.57
2.63
2.117
3.45
3.87
3.114
3.97
5.26
5.82
�--
�E.Ea
ltt
Wilft
itrfl
lf�Rl
!l•
l!:�
llf�l
&liil
ltlill
N
issa
n Ford
Mits
ubishi
Toyo
l8
Toyota
Dai
hats
u
Suz
ukl
PA
TR
OL
MAV
ER
ICK
PAJ
ER
O
LAN
DC
RU
ISE
R
4RU
NN
ER/
HIL
UX
RO
CKY
F70/7
5
SIE
RR
A
82-9
2 1111
-82
83-8
2
82-9
2
112-8
2
87-8
2
112-8
2
1.M
2.24
2.47
2.59
3.53
3.17
18
27
37
40
70
78
1.15
1.2
2
1.114
2.1
3
1.0
8
2.82
2.73
3.27
3.1
0
3.04
5.89
5.1
2
All
MO
DE
L A
VE
RA
GE
2.
68
2.60
2.
73
mii
Hllfl�
IW.�
lliV
ftlf[
tilittt
l�Wi�I
��!l.1
1 1;11!1
f.t��tJ
�lii�l@
.�1i2i
t�f�t
�i:!J
1ffill�ililli
1tt��tlJ
l�itilil
�
Toy
ota
TARA
GO
Mits
ubishi
P
AS
SE
NG
ER
VAN
S
113-9
0
112-9
2
2.89
3.59
52
72
2.1
2
2.88
3.67
4.3
1
mJlt
li lb
�l
�tiil
;IB
i@i����1�
1filtt1&
®1W�B
�l·R:rifl
il�i
lfil11fu���
�i�!�fil
flii��
®.�1it
ji ��t��
fil@f�����
i&ff ill�1i�
Ford
Nis
san
Ford
Nis
san
Holden
Nis
san
Toy
ota
Hold
en
Subar
u
Holden
Suz
ukl
Suz
ukl
FALC
ON
PA
NE
L V
AN
NA
VA
RA
FALC
ON
UT
E
XFN
UT
E
RO
DE
O
720
UT
E
HIA
CE
/LIT
EA
CE
SH
UIT
LE
BR
UM
BY
CA
RR
Y
SC
UR
RY
MIG
HTY
BO
Y
112-9
2
116-92
82-9
2 88
-92
82-9
2
82-8
5
82-9
2
82-9
1
82-9
2
85·9
0 85
-87
85-8
8
1.83
2.18
2.27
2.59
2.90
2.97
3.07
5.79
5.90
6.57
13
24
29
41 55
59
83
114
85
86
1.0
4
1.2
4
1.6
8
1.55
1.7
8
2.37
0.8
5
3.77
2.86
3.77
2.62
3.1
1
2.87
3.63
4.0
4
3.58
5.29
7.81
8.95
9.37