Embed Size (px)
Citation preview

Nutrition Assistance Program Report Series The Office of Analysis, Nutrition and Evaluation
Special Nutrition Programs Report No. CN-04-CFABT
Measuring Competitive Foods in Schools: An Inventory Approach
United States Food and Department of Nutrition Agriculture Service
May 2004

“The U.S. Department of Agriculture (USDA) prohibits discrimination in all its programs and activities on the basis of race, color, national origin, gender, religion, age, disability, political beliefs, sexual orientation, or marital or family status. (Not all prohibited bases apply to all programs) Persons with disabilities who require alternative means for communication of program information (Braille, large print, audiotape, etc.) should contact USDA’s TARGET Center at (202) 720-2600 (voice and TDD)” To file a complaint of discrimination, write USDA, Director, Office of Civil Rights, Room 326-W, Whitten Building, 14th and Independence Avenue, SW, Washington, DC 20250-9410 or call (202) 720-5964 (voice and TDD). USDA is an equal opportunity provider and employer.

Measuring Competitive Foods in Schools: An Inventory Approach
Authors: Mary Kay Crepinsek Nancy Cole Joanna Golding Submitted by: Submitted to: Abt Associates, Inc. Office of Analysis, Nutrition and Evaluation 55 Wheeler Street USDA, Food and Nutrition Service Cambridge, MA 02138 3101 Park Center Drive 10th Floor Alexandria, VA 22302-1500 Project Director: Mary Kay Crepinsek Project Officer: Patricia McKinney This study was conducted under Contract number 53-3198-2-026/43-3198-3-3705 with the Food and Nutrition Service. This report is available on the Food and Nutrition Service web site: http://www.fns.usda.gov/oane. Suggested Citation: U.S. Department of Agriculture, Food and Nutrition Service, Office of Analysis, Nutrition and Evaluation, Measuring Competitive Foods in Schools: An Inventory Approach. Mary Kay Crepinsek, Nancy Cole, Joanna Golding. Project Officer, Patricia McKinney. Alexandria, VA: 2004.
United States Food and Department of Nutrition Agriculture Service
May 2004Special Nutrition Programs
Report No. CN-04-CFABT
Acknowledgments
The Feasibility Study to Develop a Methodology to Monitor the Impact of Changes in Competitive Food Policies was a fast-paced, six-month research project that required assistance from three schools. The authors are indebted to all of the school staff who provided information for the study, including cafeteria managers and other school food service staff, teachers, principals, and School Food Authority directors. We also greatly appreciate the efforts of the SFA directors, principals, and state Child Nutrition directors who helped facilitate the collection of information in their sites. Without the cooperation and hard work of all of these individuals, the study could not have been completed. The authors also wish to recognize other staff members at Abt Associates Inc. who played important roles on the project. Neil Berquist entered survey data, and helped research the nutrient composition of new foods. Patty Connor led the coding and nutrient analysis effort, and contributed to the final report. Ellie Lee created the analytic database, and Lisa Litin conducted the food and nutrient analyses. Susan Byers Paxson was responsible for production of all study documents. Gail Langeloh, a nutritionist and independent consultant, participated in the design, implementation, and analysis phases of the study. She also contributed to the final report. Pat McKinney served as the federal project officer for the Office of Analysis, Nutrition, and Evaluation, Food and Nutrition Service. She and other reviewers at FNS provided valuable input throughout the study.


Contents i
Contents
Executive Summary ............................................................................................................................. 1 Background ................................................................................................................................. 1 Purpose of the Study ................................................................................................................... 1 Data Collection and Analysis Plan.............................................................................................. 2 Key Findings for Three Schools ................................................................................................. 3 Implementation of the Data Collection Plan ..................................................................... 3 Competitive Food Policies and Practices .......................................................................... 4 Competitive Foods Offered and Sold................................................................................ 5 Proposed Methodology for Examining the Impact of Changes in Competitive Food Policies .. 7 Conclusions................................................................................................................................. 8 Chapter 1: Introduction...................................................................................................................... 9 Overview of the Study .............................................................................................................. 10 Study Goals and Objectives ............................................................................................ 11 Schools Recruited for the Study...................................................................................... 11 Organization of the Report........................................................................................................ 13 Chapter 2: Design and Implementation of the Data Collection Plan ........................................... 15 Data Collection Instruments...................................................................................................... 15 Principal Survey and SFA Director Survey .................................................................... 17 School Foods Data Collection Instruments ..................................................................... 17 Data Collection Procedures....................................................................................................... 20 Advance Meetings with School Staff.............................................................................. 22 Training and Technical Assistance ................................................................................. 22 Survey Completions ........................................................................................................ 23 State Director Interviews................................................................................................. 24 Debriefing Meetings........................................................................................................ 24 Data Preparation and Data Entry in Nutrient Database................................................... 24 Data Collection Issues............................................................................................................... 25 Overall Burden ................................................................................................................ 25 Data Collection Period .................................................................................................... 28 Identifying Respondents.................................................................................................. 28 Tracking Number of Items Sold in Vending Machines .................................................. 29 Designing Cafeteria Instruments to Collect Data on All Foods ...................................... 30 Summary ................................................................................................................................... 32 Findings from Data Collection........................................................................................ 32 Limitations ...................................................................................................................... 34 Chapter 3: Competitive Foods in the School Environment: Policies and Practices in Three
Schools ............................................................................................................................ 37 Food Venues ............................................................................................................................. 38 Food Venues Available in School Cafeterias.................................................................. 38 Food Venues Available Outside Cafeterias..................................................................... 40 Availability of Food and Beverages by Time of Day ............................................................... 41 Policies About Types of Food Available .................................................................................. 42

ii Contents
Operation and Administration of Food Venues.........................................................................43 Operation of Food Venues Available During the School Day ........................................43 Operation of Food Venues Available Outside the School Day .......................................45 Overall Administration of Food Venues..........................................................................46 Exclusive Beverage Contract.....................................................................................................46 SFA Pricing Strategies for Competitive Foods .........................................................................47 Other Sources of Food...............................................................................................................49 Off-Campus Eating Establishments...........................................................................................50 Nutrition Initiatives ...................................................................................................................51 Summary....................................................................................................................................53 Chapter 4: Competitive Foods in the School Environment: Nutritional Characteristics ..........55 Foods Offered and Sold.............................................................................................................56 Number and Types of Food Offered................................................................................57 Foods Most Commonly Sold ...........................................................................................60 Nutrient Composition of Competitive Foods ............................................................................63 Food Energy and Macronutrients ....................................................................................64 Micronutrients..................................................................................................................67 Food Guide Pyramid Servings of Competitive Foods...............................................................70 Foods Meeting FDA Labeling Criteria......................................................................................72 Foods of Minimal Nutritional Value .........................................................................................74 Summary....................................................................................................................................77 Unweighted Tables ....................................................................................................................79 Weighted Tables........................................................................................................................97 Chapter 5: Methodology for Assessing the Impact of Competitive Food Policies .....................113 Overall Design Considerations................................................................................................113 Cross-Sectional Design..................................................................................................114 Longitudinal Design ......................................................................................................115 Measuring Competitive Food Policies ....................................................................................116 Identifying the Respondent............................................................................................116 Defining Food Sources ..................................................................................................117 Lack of Clear Policies....................................................................................................118 Measuring Nutritional Outcomes ............................................................................................119 Analyzing Nutritional Outcomes.............................................................................................120 What Is the Impact of Changes in Competitive Food Policies on the Nutritional Quality of Competitive Foods Available at School? .............................................121 Do Competitive Foods “Crowd Out” the Selection of USDA Reimbursable Meals? ...121 How Much Do Competitive Foods Add to (or Subtract from) Total Food Energy,
Key Nutrients, Added Sugars, and Fat Served to Students During the School Day?.......................................................................................................................122
Conclusions .............................................................................................................................125 References .......................................................................................................................................127 Appendix A: Instrument Design and Data Quality Issues .......................................................... A-1 Principal Survey ..................................................................................................................... A-1 Data Quality.................................................................................................................. A-1

Contents iii
Item Nonresponse..........................................................................................................A-1 Instrument Design Issues ..............................................................................................A-2 Recommendations .........................................................................................................A-2 SFA Director Survey...............................................................................................................A-2 Data Quality ..................................................................................................................A-2 Item Nonresponse..........................................................................................................A-3 Instrument Design Issues ..............................................................................................A-3 Recommendations .........................................................................................................A-3 Cafeteria Survey......................................................................................................................A-4 Data Quality ..................................................................................................................A-4 Item Nonresponse..........................................................................................................A-5 Instrument Design Issues ..............................................................................................A-6 Recommendations .........................................................................................................A-7 Inventory of Snack Bar Prepackaged Food and Beverage Items ............................................A-7 Data Quality/Item Nonresponse ....................................................................................A-7 Instrument Design Issues ..............................................................................................A-7 Inventory of School Store Food and Beverage Items .............................................................A-8 Data Quality ..................................................................................................................A-8 Item Nonresponse..........................................................................................................A-8 Inventory of Vending Machine Items .....................................................................................A-8 Data Quality ..................................................................................................................A-8 Item Nonresponse..........................................................................................................A-9 Appendix B: Validation Study Findings........................................................................................ B-1 Collection of Validation Data ................................................................................................. B-1 A la Carte-Only and Snack Bar Items ........................................................................... B-1 School Store Items ........................................................................................................ B-2 Validation Results ................................................................................................................... B-2 Appendix C: Nutrient Database Issues.......................................................................................... C-1 Entry Procedures ..................................................................................................................... C-1 Entry Issues............................................................................................................................. C-3 Brand Name and Flavor Specificity .............................................................................. C-3 Missing Foods ............................................................................................................... C-3 Ice Cream Amounts....................................................................................................... C-5 Comparison of FIAS Nutrients with Replacement Values............................................ C-5 Summary of FIAS Entry Issues..................................................................................... C-6 Comparison of FIAS Data to Label Nutrition Information..................................................... C-8 Appendix D: Reimbursable Meal Menus ......................................................................................D-1 Appendix E: Competitive Foods Available During the School Day............................................ E-1 Appendix F: Competitive Foods Available Outside the School Day............................................F-1 Appendix G: Instruments

Executive Summary 1
Executive Summary
Background
The present epidemic of overweight and obesity among children has focused increased attention on the foods available to children at school. The U.S. Department of Agriculture (USDA) sets standards for the nutritional quality of meals served daily to 28 million children as part of the National School Lunch Program (NSLP) and to 8 million children as part of the School Breakfast Program (SBP). In a large number of schools, however, foods and beverages are available to students as alternatives to the federally reimbursed meals, as a la carte items in school cafeterias; as items from vending machines, snack bars, and school stores; or as part of special profit-making events (Wechsler et al., 2001). These “competitive foods” tend to be high in calories, fat, and added sugars, and low in essential nutrients. Thus, the availability of competitive foods may undermine the nutritional goals of the USDA school meal programs. Under current regulations, USDA has only limited ability to influence foods that compete with reimbursable meals. Regulation 7 CFR 210.11 prohibits the sale of foods of minimal nutritional value, including beverages, in school food service areas during meal periods. USDA is unable, however, to regulate the availability and nutritional quality of competitive foods outside of the school food service area and outside of meal periods. As a result of this lack of regulatory power, recent efforts to influence competitive foods have come in the form of initiatives to encourage changes in the school nutrition environment, and a proposal to Congress to offer financial incentives to schools that offer healthful food options in competitive food venues. Some states have passed legislation to limit the types of food that can be sold at school. The availability of competitive foods in schools has changed over time and will continue to change in response to calls for more healthful food options for schoolchildren. Currently, USDA lacks a mechanism for monitoring these changes. With an interest in monitoring these changes, the USDA Food and Nutrition Service (FNS) contracted with Abt Associates Inc. to design and test a data collection plan for obtaining information on competitive food policies and the nutritional characteristics of all foods offered and served in schools. That field experience is described in this report, along with analyses of collected data and recommendations for a methodology for use in ongoing monitoring of the impact of changes in competitive food policies. Purpose of the Study
The Feasibility Study to Develop a Methodology to Monitor the Impact of Changes in Competitive Food Policies had two main goals:
1. Design and test a plan for collecting and analyzing data about competitive food policies and all foods offered and served to students at school; and
2. Provide a methodology for assessing the impact of changes in competitive food policies on the nutritional quality of all foods served at school.
To achieve the first goal, data collection instruments and procedures were developed and data were collected from three schools during May of 2003. The study collected data about the availability of

2 Executive Summary
competitive foods (locations and time periods), school nutrition policies, and financial arrangements related to the availability of competitive foods, and descriptions of all food and beverage items offered and served to students during the school day. Data about competitive foods were entered in a nutrient analysis system, and food group and nutrient analyses of these items were conducted. Lessons learned from the data collection and analyses were then used to address the second goal of the study. Recommendations include a description of overall design considerations, methodological and operational issues involved in collecting information about competitive food policies and competitive foods offered and served, alternative outcome measures, and methods of analysis. Data Collection and Analysis Plan
This feasibility study collected data from three secondary schools purposively selected from two states (Massachusetts and Virginia). The schools included two high schools and one middle school, all having multiple food venues. In addition to cafeteria service, all three schools have vending machines, one high school has a snack bar, and both high schools have school stores. Information about the school nutrition environment and school nutrition policies was collected through mail surveys of principals and SFA directors. The Principal Survey collected data about the availability of competitive foods (number and types of food venues, locations, times of availability); operation and administration of food venues; school policies about competitive foods; off-campus eating; use of food for fundraising; and nutrition initiatives. The SFA Director Survey collected information about a la carte service and pricing strategies; food service-operated vending machines; district policies about competitive foods; and exclusive beverage contracts. Both surveys also asked about the amount of profit earned and use of profits from competitive food sales.1 Data on reimbursable school meals and all competitive foods offered and served to students was collected through food lists and inventories completed by cafeteria staff and other school personnel who operate food venues. For each food and beverage item, data were collected on manufacturer, brand, and name of the item; package or serving size; recipe, if prepared from scratch; and the number served or sold during the data collection week. Most of the burden of collecting data for both reimbursable meals and competitive foods fell on the cafeteria staff. Several strategies were implemented to reduce this burden, including the introduction of an “inventory approach” for tracking food selections and sales. The inventory approach was used for prepackaged foods and beverages. Cafeteria staff simply counted the number of cases and individual items on hand at the beginning and end of the data collection week, and they recorded deliveries. In addition, data collection forms allowed for counts of total food servings, rather than requiring separate tracking of servings in reimbursable meals versus a la carte. The inventory approach was well suited to the tracking of sales of individual items in vending machines stocked by school staff. It was unclear, however, how best to obtain these data for machines operated and stocked by outside distributors. Data collection, therefore, was attempted by
1 The Principal and SFA Director Survey data were revised and supplemented, based on information obtained by the
researchers during on-site training and debriefing visits to the schools.

Executive Summary 3
multiple methods: SFA directors and principals were asked for available invoices, study forms were sent to distributors, and researchers contacted distributors directly. All respondents were compensated for the time spent on data collection activities. Analysis of data on foods offered and served was limited to competitive foods and beverages available “a la carte only”, and in snack bars, vending machines, and school stores available to students during the school day.2 Mean food energy, nutrients, and servings from each of the five main Food Guide Pyramid food groups were calculated using the USDA Survey Nutrient Database and Pyramid Servings Database, respectively. Nutritional characteristics were reported for broadly defined groups of food—baked goods/desserts, beverages, bread/grain products, candy, frozen desserts, salads, and snacks—as well as for subgroups (e.g., cookies, fruit juice, pretzels). Key Findings for Three Schools
This feasibility study was designed to test a data collection and analysis plan. Findings include lessons learned from implementation of the data collection plan, as well as a demonstration of the types of qualitative and quantitative data that can be obtained about school nutrition policies and the nutritional characteristics of competitive foods available during the school day. All results are suggestive and cannot be generalized to a larger population due to the small sample and purposive selection of schools in the study. Implementation of the Data Collection Plan
Principal and SFA Director Surveys
• SFA directors found the survey easy and were motivated to provide complete surveys.
• School principals did not have knowledge of all food operations within their schools, and did not have time to investigate the answers to survey questions.
• Respondents to both surveys sometimes misinterpreted the questions about competitive food policies, due to a lack of formal policies at the SFA and school levels.
Food Lists and Inventories
• Schools used different methods of food delivery to sell similar foods. For example, the same items sold in cafeteria vending machines at one school were offered on the a la carte line at another school. As a result, all competitive foods offered in the cafeteria were grouped together for nutrition analyses.3
• It was feasible to use an inventory approach to collect data on prepackaged foods and beverages. The approach was well accepted by school staff because it was straight-forward and moved data collection activities outside of meal periods. Validation data
2 Vending machines not available during the school day were excluded from analysis, and foods served a la carte and
also in reimbursable meals were excluded.
3 The alternative was to group foods by sources of competitive foods, such as a la carte, snack bars, and vending machines. We concluded that cafeteria foods should be grouped together because different methods of delivery might be primarily related to space and staffing constraints. Foods available outside the cafeteria, such as in school stores, were grouped separately.

4 Executive Summary
collected for one day during the data collection period indicated that school staff accounted for 95 percent of all competitive food items offered.
• Collection of data on all foods offered and served in both reimbursable meals and competitive food venues imposed significant burden on the cafeteria managers/staff. We attempted to obtain estimates of this burden, but the data were not of high quality.
• Reporting of servings data was a very burdensome task, regardless of whether the task was implemented using the traditional daily servings approach or a weekly inventory approach. This burden introduced potential bias due to (a) reporting of “portions prepared” rather than “portions served” for reimbursable meal components, (b) changes in stocking procedures, and (c) missing data from food venues operated by non-food service organizations.
• Data on foods offered and sold in vending machines operated by non-school personnel (i.e., machines filled by distributors) were difficult to obtain. Invoices did not contain sales information for individual items, and only one of four distributors contacted directly responded to requests for data.4
Competitive Food Policies and Practices
Availability of Competitive Foods
• More competitive food items were offered in school cafeterias (a la carte, snack bar, vending machines) than in venues located outside the cafeteria. (The only food venues outside the cafeterias and available during the school day were school stores.)
• Competitive foods were available during lunch periods in all three schools.
• School stores and vending machines in the cafeteria offered competitive foods before classes in the two high schools. None of the schools provided a la carte cafeteria service during the breakfast period.
• Carbonated soft drinks were not available during the school day. School stores sold candy and other “foods of minimal nutritional value” in the high schools, but were open for limited time periods.
Operation of Competitive Food Venues
• The school food service department was responsible for all of the competitive food venues in the cafeterias (a la carte, snack bar, vending machines).
• In the high schools, academic clubs and athletic departments ran the food venues located outside the cafeteria and available during school (school stores), as well as those available only after school (vending machines).
• Purchasing and stocking for one or more vending machines in all three schools was handled by outside distributors (Coca-Cola, Pepsi, and smaller local companies).
4 It is important to note that three of the distributors operated vending machines only available after school. The missing
vending machine data from the fourth distributor affected nutrition analyses for one machine in only one school (the middle school).
Executive Summary 5
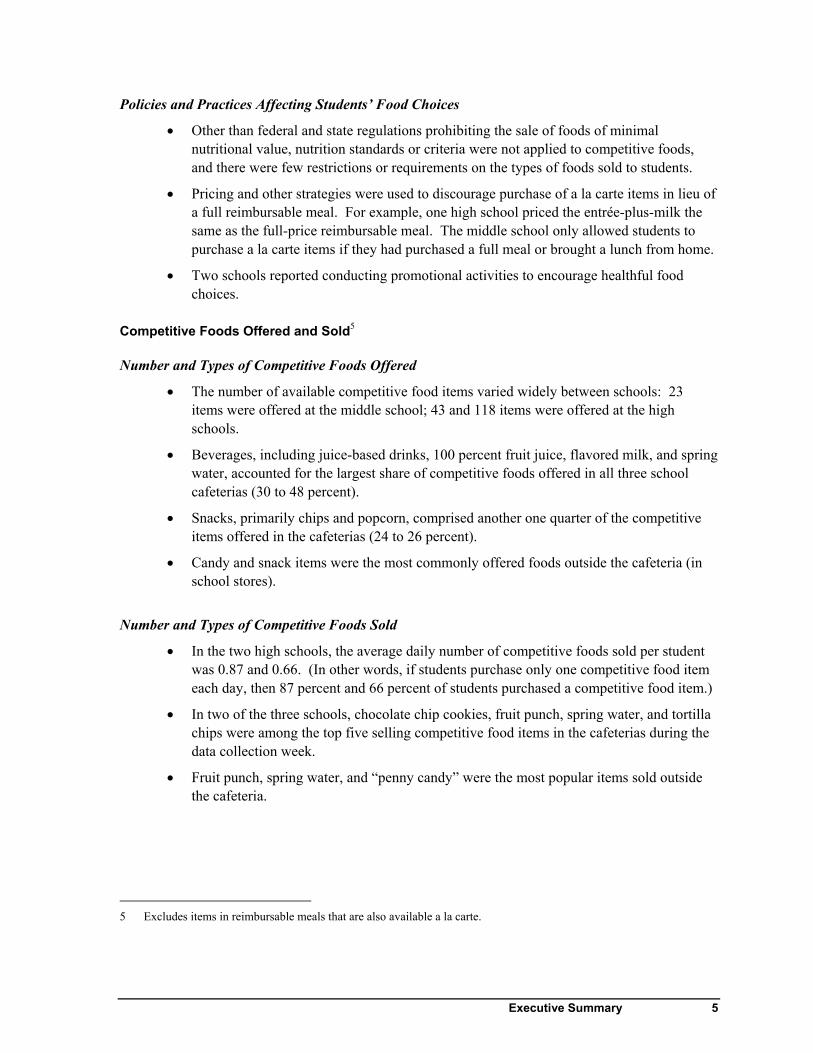
Policies and Practices Affecting Students’ Food Choices
• Other than federal and state regulations prohibiting the sale of foods of minimal nutritional value, nutrition standards or criteria were not applied to competitive foods, and there were few restrictions or requirements on the types of foods sold to students.
• Pricing and other strategies were used to discourage purchase of a la carte items in lieu of a full reimbursable meal. For example, one high school priced the entrée-plus-milk the same as the full-price reimbursable meal. The middle school only allowed students to purchase a la carte items if they had purchased a full meal or brought a lunch from home.
• Two schools reported conducting promotional activities to encourage healthful food choices.
Competitive Foods Offered and Sold5
Number and Types of Competitive Foods Offered
• The number of available competitive food items varied widely between schools: 23 items were offered at the middle school; 43 and 118 items were offered at the high schools.
• Beverages, including juice-based drinks, 100 percent fruit juice, flavored milk, and spring water, accounted for the largest share of competitive foods offered in all three school cafeterias (30 to 48 percent).
• Snacks, primarily chips and popcorn, comprised another one quarter of the competitive items offered in the cafeterias (24 to 26 percent).
• Candy and snack items were the most commonly offered foods outside the cafeteria (in school stores).
Number and Types of Competitive Foods Sold
• In the two high schools, the average daily number of competitive foods sold per student was 0.87 and 0.66. (In other words, if students purchase only one competitive food item each day, then 87 percent and 66 percent of students purchased a competitive food item.)
• In two of the three schools, chocolate chip cookies, fruit punch, spring water, and tortilla chips were among the top five selling competitive food items in the cafeterias during the data collection week.
• Fruit punch, spring water, and “penny candy” were the most popular items sold outside the cafeteria.
5 Excludes items in reimbursable meals that are also available a la carte.
6 Executive Summary
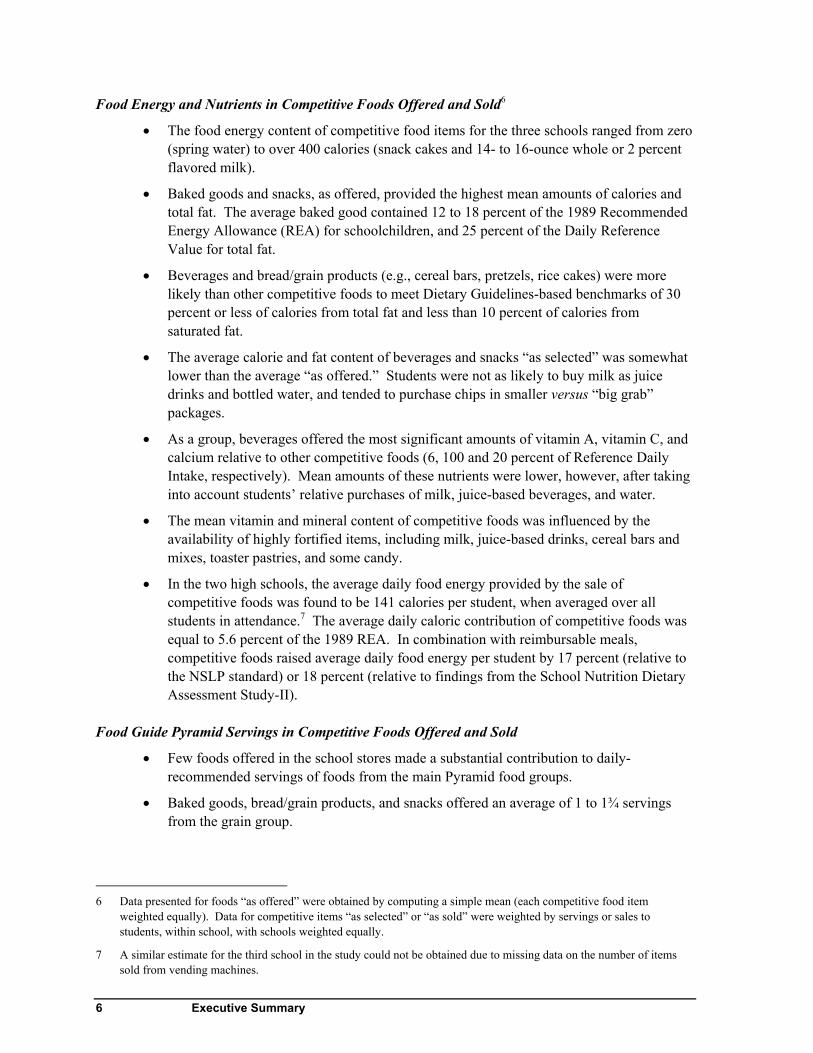
Food Energy and Nutrients in Competitive Foods Offered and Sold6
• The food energy content of competitive food items for the three schools ranged from zero (spring water) to over 400 calories (snack cakes and 14- to 16-ounce whole or 2 percent flavored milk).
• Baked goods and snacks, as offered, provided the highest mean amounts of calories and total fat. The average baked good contained 12 to 18 percent of the 1989 Recommended Energy Allowance (REA) for schoolchildren, and 25 percent of the Daily Reference Value for total fat.
• Beverages and bread/grain products (e.g., cereal bars, pretzels, rice cakes) were more likely than other competitive foods to meet Dietary Guidelines-based benchmarks of 30 percent or less of calories from total fat and less than 10 percent of calories from saturated fat.
• The average calorie and fat content of beverages and snacks “as selected” was somewhat lower than the average “as offered.” Students were not as likely to buy milk as juice drinks and bottled water, and tended to purchase chips in smaller versus “big grab” packages.
• As a group, beverages offered the most significant amounts of vitamin A, vitamin C, and calcium relative to other competitive foods (6, 100 and 20 percent of Reference Daily Intake, respectively). Mean amounts of these nutrients were lower, however, after taking into account students’ relative purchases of milk, juice-based beverages, and water.
• The mean vitamin and mineral content of competitive foods was influenced by the availability of highly fortified items, including milk, juice-based drinks, cereal bars and mixes, toaster pastries, and some candy.
• In the two high schools, the average daily food energy provided by the sale of competitive foods was found to be 141 calories per student, when averaged over all students in attendance.7 The average daily caloric contribution of competitive foods was equal to 5.6 percent of the 1989 REA. In combination with reimbursable meals, competitive foods raised average daily food energy per student by 17 percent (relative to the NSLP standard) or 18 percent (relative to findings from the School Nutrition Dietary Assessment Study-II).
Food Guide Pyramid Servings in Competitive Foods Offered and Sold
• Few foods offered in the school stores made a substantial contribution to daily-recommended servings of foods from the main Pyramid food groups.
• Baked goods, bread/grain products, and snacks offered an average of 1 to 1¾ servings from the grain group.
6 Data presented for foods “as offered” were obtained by computing a simple mean (each competitive food item
weighted equally). Data for competitive items “as selected” or “as sold” were weighted by servings or sales to students, within school, with schools weighted equally.
7 A similar estimate for the third school in the study could not be obtained due to missing data on the number of items sold from vending machines.

Executive Summary 7
• Among the beverages offered, milk and 100 percent fruit juice offered close to two servings from the dairy and fruit groups, respectively. As selected, however, the mean servings of fruit and dairy were considerably lower (less than ½ serving each).
• Although baked goods and beverages contributed positively to the grain, fruit, and dairy groups, they also contained the highest mean amounts of added sugars (7 teaspoons).
Proposed Methodology for Examining the Impact of Changes in Competitive Food Policies
There are two reasons to monitor competitive foods available in schools: to assess the nutritional quality of available foods, and to evaluate the impact of changes in competitive food policies. One goal of this feasibility study was to recommend a methodology for evaluating the impact of changes in competitive food policies, informed by the lessons learned from implementation of the data collection plan. The impact of changes in competitive food policies may be evaluated by the outcome measures listed below.
1. Changes in the nutritional quality of competitive foods available at school.
2. Changes in the percent of students receiving reimbursable meals. (In other words, do competitive foods “crowd out” the selection of USDA reimbursable meals?)
3. Changes in the contribution of competitive foods to total food energy, key nutrients, added sugars, and fat served to students during the school day.
Measuring the impact of changes in competitive food policies, however, requires longitudinal data on both policies and competitive foods offered and sold at individual schools. The current feasibility study was not designed to measure the impact of changes in competitive food policies; data were collected from only three schools at a single point in time. Instead, the study demonstrated the measurement of “baseline” outcomes (presented above under “Findings”). One of the key recommendations of this study is that the impact of changes in competitive food policies should be assessed by a focused collection of data on competitive foods, rather than collecting data on all foods offered and served during the school day, as was done for this study. This recommendation is based on both implementation and methodological concerns.
• Implementation issues: Collection of data on all foods offered and served during the school day (competitive foods and reimbursable meals) was found to pose a large burden on respondents. In contrast, limiting data collection to competitive foods reduces both the numbers and types of foods included in the data collection. Competitive foods consist largely of prepackaged foods and beverages, and this study was successful in implementing a newly developed inventory approach to collect data on prepackaged items.
• Methodological issues: This study demonstrated that the contribution of competitive
foods to total energy served to students during the school day can be assessed using readily available benchmarks (and the same is true for other key nutrients). Two

8 Executive Summary
alternative benchmarks are (1) the National School Lunch Program (NSLP) standards for reimbursable meals, and (2) the findings of the School Nutrition Dietary Assessment Study (SNDA-II).
The main limitations of the proposed approach are:
• It is not possible, using the inventory approach, to identify separately competitive food sales during the school day and sales after the school day, for venues available in both time periods.
• It is difficult to obtain data from vending machines operated by non-school personnel.
• By focusing data collection on competitive foods, rather than collecting data on all foods available at school, it is not possible to investigate the relationship between the availability of competitive foods and the nutritional quality of reimbursable meals, if this interaction exists.
Conclusions
This feasibility study developed and implemented a plan for collecting data to describe school nutrition policies and the nutritional characteristics of all foods offered and served to students during the school day. Findings indicate that, for the three schools surveyed, there is little in the way of formal policies about competitive foods at either the school or district levels. If this is more generally observed, future monitoring efforts should assess observable practices that could be verified by an outside observer. Alternatively, future surveys should allow for open-ended narrative responses so that the distinction between policy and practice can be determined. It may also be preferable to rely primarily on SFA directors and cafeteria managers for information on competitive food practices, rather than principals. They were the most knowledgeable respondents in this study, and were motivated to provide complete surveys. Despite the introduction of some innovations in the data collection methodology and use of incentives, the burden of collecting information simultaneously on both reimbursable meals and competitive foods was problematic for school food service staff. This burden raises questions about the quality of the data that can be obtained on all school foods (for purposes of nutritional analysis) in a self-administered survey. On the other hand, this study demonstrated that the inventory approach was well accepted and produced high quality data on prepackaged competitive foods. Thus, one of the key outcomes of this study is the recommendation that the impact of changes in competitive food policies be assessed by focusing data collection on only those competitive foods offered outside of the reimbursable meal programs. Three main limitations of the recommended data collection methodology were identified: (1) missing data from food venues not operated by school personnel, (2) the inability to distinguish between competitive food sales during and after the school day, and (3) the inability to identify interactions between competitive food availability and the nutritional quality of reimbursable meals. To address these limitations, future studies might request that respondents collect data on vending machine items and sales from vendors during stocking, and investigate the possibility of collecting data over a period without any after-school events. To reduce the burden of collecting servings data for all foods, on-site assistance for school food service staff at the points of sale may be necessary. These and other potential solutions could be investigated further within a larger study design.

Chapter 1: Introduction 9
Chapter 1 Introduction
The U.S. Department of Agriculture (USDA) sets standards for the nutritional quality of reimbursable meals served to schoolchildren.1 Aside from reimbursable meals, however, USDA has limited ability to influence food and beverages available to K-12 students during the school day. In a large number of schools, foods are available to students as alternatives to reimbursable meals, as a la carte items in school cafeterias; items from vending machines, snack bars, and school stores; or as part of special profit-making events. Some students may leave the school during meal periods and obtain food from off-campus eating establishments. Additionally, one half of all school districts contract with companies that buy rights to sell soft drinks at schools in the district (Wechsler et al., 2001). The current epidemic of overweight and obesity among children, and the goals of Healthy People 2010,2 has focused increased attention on the foods available to children during the school day. One concern is that the nutritional goals of the USDA school meal programs may be undermined by the availability of “competitive foods”.3 Although the impact of competitive foods on the overall nutritional quality of schools foods is unknown, the following statements pertain: (1) competitive foods are frequently of lower nutrient density (i.e., low in nutrients relative to food energy content) than components of a reimbursable meal; (2) their availability may send a conflicting message to students about the value of healthful foods; and (3) they divert student participation in, and thus income from, the reimbursable meal programs, jeopardizing their financial status and ability to make improvements (Cline and White, 2000; USDA, 2001). Only one tool is currently available to USDA to reduce the influence of foods that compete with reimbursable meals. The requirement of Section 10(a) of the Child Nutrition Act (42 U.S.C. 1799(1)) directs USDA to regulate the service of foods in competition with reimbursable meals. This regulation (7 CFR 210.11) prohibits the sale of foods of minimal nutritional value (FMNV), including beverages, in the food service area during school meal periods. Federal regulations allow states and local School Food Authorities (SFAs) to impose additional restrictions.4 USDA is not, however, currently able to regulate the availability and nutritional quality of competitive foods available to students outside of the school food service area and outside of meal periods. As a result of this lack
1 In 1995, the Department launched the School Meals Initiative (SMI), which includes nutrition standards for the
National School Lunch Program (NSLP) and School Breakfast Program (SBP). The standards call for school meals to provide on average, one third of students’ daily nutrition needs for food energy and key nutrients at lunch and one fourth at breakfast. They also include goals for fat and saturated fat that are consistent with the Dietary Guidelines for Americans recommendations (USDHHS/USDA, 1995).
2 Healthy People 2010 is a set of health goals and objectives developed under the direction of the Secretary of Health and Human Services. Healthy People 2010 Objective 19.15 focuses specifically on the school environment, calling for USDA to work to “increase the proportion of children and adolescents, ages 6 to 19 years, whose intake of meals and snacks at school contributes proportionally to good overall dietary quality” (USDHHS, 2000).
3 USDA defines competitive foods as any “foods offered at school, other than meals served through USDA’s school meal programs—school lunch, school breakfast, and after-school snack programs” (USDA, 2001).
4 Information compiled by FNS in September 2002 indicates that competitive food policies in 32 of 50 states (64 percent) are the same as the USDA regulation, without additional restrictions. Eighteen states specify additional provisions that further restrict the sale of and/or income from all foods sold in competition with reimbursable meals (USDA, 2002).

10 Chapter 1: Introduction
of regulatory power, recent efforts to influence competitive foods have come in the form of initiatives to encourage changes in the school environment. To foster healthy school nutrition environments, USDA launched two initiatives that support the development of healthful eating habits among schoolchildren. Changing the Scene: Improving the School Nutrition Environment and Eat Smart. Play Hard provide resources for schools to promote healthy eating and physical activity (USDA, 2000). USDA (Team Nutrition) is also collaborating with the Centers for Disease Control (CDC) to develop materials for schools to use in improving the school nutrition environment. At the same time, states are working to implement the Action Goals of the national Action for Healthy Kids initiative (AFHK, 2003). To further promote a healthy school food environment, USDA recently proposed to offer financial incentives to schools to “offer healthful food options in vending machines, school canteens, and their a la carte menu service.” In recent testimony to Congress, USDA Undersecretary Bost described this USDA proposal to “establish a Healthy School Environment that supports the President’s HealthierUS and No Child Left Behind initiatives” (USDA, 2003). The proposed program recognizes the importance of influencing competitive foods in schools. Undersecretary Bost described an incentive system based on the four keystones of HealthierUS:
• Nutrition—Eat a nutritious diet; • Physical fitness—Be physically active each day; • Prevention—Get preventive screening; and • Avoid risk behaviors—Make healthy choices.
The current feasibility study is related to recent initiatives to improve the school food environment. Information about the availability and nutritional quality of competitive foods in schools is needed by USDA, states, and policymakers to evaluate Changing the Scene and other initiatives and policy changes regarding competitive foods. Furthermore, in working to put an incentive system into operation, FNS will need data to inform the development of criteria for identifying healthful food options, and a methodology to monitor changes in the school environment. Overview of the Study
The feasibility study5 addresses USDA’s interest in developing an approach that could be used on an ongoing basis to monitor the impact of changes in competitive food policies. This study designed and tested a data collection plan for obtaining information on competitive food policies and on all foods offered and served in schools. That field experience is described in this report, along with analyses of collected data. Based on the findings of the field experience, recommendations are presented for a methodology for use in monitoring the impact of changes in competitive food policies.
5 The study was referred to as the “Study of Foods in the School Environment” on all correspondence and instruments
completed by respondents.

Chapter 1: Introduction 11
Study Goals and Objectives
This feasibility study had two main goals:
1. Design and test a plan for collecting and analyzing data about competitive food policies and all foods offered and served to students at school; and
2. Provide a methodology for assessing the impact of changes in competitive food policies on the nutritional quality of all foods served at school.
To achieve the first goal, the study developed data collection instruments and procedures, and collected data from three schools during May 2003. Data collection included mail surveys of school principals and SFA directors, and self-administered school food lists and inventories completed by cafeteria and other school staff for a one-week period. Abt Associates staff provided on-site training and technical assistance, collected one day of data for validation purposes, and conducted in-person debriefing meetings with respondents. Issues were identified and analyses conducted on competitive foods available to students during the school day. Although foods may be sold on school property after school hours or during weekend sporting or other events, they were not the focus of this study.6 The data collection and analysis plan met the following specific objectives:
• Provide information on the locations and times competitive foods are available, school food policies, and financial arrangements related to the availability of competitive foods.
• Conduct food group and nutrient analyses for each source of competitive foods (a la carte only,7 snack bars, school stores, vending machines).
• Identify the potential problems and issues surrounding the collection and analysis of data using the data collection instruments designed for this study.
Lessons learned from the implementation of the study design were then used to address the second goal of the study: provide recommendations for a methodology for analyzing the impact of changes in competitive food policies. These recommendations include a description of overall design considerations, methodological and operational issues involved in collecting information about competitive food policies and competitive foods offered and served, alternative outcome measures, and methods of analysis. Schools Recruited for the Study
Three schools were recruited to participate in the study; they were not randomly selected, and are not representative of any larger population of schools. Table 1.1 shows the characteristics of the three schools that participated in the study. The three schools are located in Massachusetts and Virginia.8
6 There is one exception—data were collected about foods and beverages sold in vending machines only available after
school in one of the participating schools. Information on these items is presented in an appendix to this report. 7 The analyses of a la carte foods in this study were limited to those foods not also included in reimbursable meals; these
items are referred to as “a la carte-only” foods. 8 Schools in Massachusetts were targeted for the study so that data collection would occur in close proximity to Abt
headquarters in Cambridge. One school in Virginia was included to provide a site in close proximity to FNS headquarters so that the project officer could participate in debriefings.

12 Chapter 1: Introduction
Massachusetts and Virginia provided different environments, in terms of regional food preferences and also in terms of the state policy for competitive foods in schools. All states operate within the USDA policy limiting the availability of FMNV in the school cafeteria during school meal periods. Massachusetts has not supplemented the USDA policy. Virginia expanded the USDA policy to restrict the sale of FMNV anywhere in the school during school meal periods. Table 1.1 Schools Recruited for the Feasibility Study School 1 2 3
Location Massachusetts Massachusetts Virginia Grade span 6-8 9-12 9-12 Total enrollment 570 3,626 1,518 Percent free/reduced 89% 41% 7% Competitive foods:
A la carte foods (including meal components)
Yes Yes
A la carte foods (non-reimbursable items)
Yes Yes
Snack bar Yes School store Yes Yes Vending machines (outside contract)
Yes Yes Yes
Vending machines (food service)
Yes Yes
Cafeteria checkouts POS (LunchBox) POS (LunchBox) POS (Café Terminal) Menu planning system Assisted Nutrient
Standard Menu Planning
Traditional Food-Based
Enhanced Food-Based
On-site food preparation Yes Yes Yes Number of cafeterias 1 2 1 Food service management company
Yes
School breakfast (SBP) Yes (universal-free) Yes No The three schools include one middle school and two high schools. The focus on secondary schools was intended to provide more complex settings for testing the feasibility of data collection relative to elementary schools. The schools vary in size, the percent of students with free and reduced price lunch eligibility, the type of menu planning system, and the number of competitive food sources. All schools have on-site kitchens, serve a la carte foods, and have vending machines; one school has a snack bar, and two have a school store. Operation of the vending machines varies. Two of the schools have some vending machines operated by the school food service and some by contract with an outside distributor. The school food service

Chapter 1: Introduction 13
in the third school does not operate any vending machines. All three schools use POS systems; two serve breakfast, with one school serving universal free breakfast. Organization of the Report
The remaining chapters in this report present the following information:
• Chapter 2 describes the design and implementation of data collection instruments and procedures, and summarizes the main data collection problems and successes.
• Chapter 3 presents the results of the surveys of competitive food policies and practices.
• Chapter 4 presents analyses of the nutritional characteristics of competitive foods offered and sold in the three schools.
• Chapter 5 provides a discussion of the operational and methodological issues involved in collecting data and analyzing the impact of changes in competitive food policies. Recommendations, informed by the findings of this feasibility study, are provided for large-scale monitoring.
Appendices provide additional analyses, detailed tables, and the data collection instruments.

Chapter 2: Design and Implementation of the Data Collection Plan 15
Chapter 2 Design and Implementation of the Data Collection Plan
The main charge for this study was to develop data collection instruments and methods to test the feasibility of capturing two types of information:
1. Information about student access to competitive foods in the school environment, and
2. Information about the types and nutritional characteristics of foods offered and sold to students—both within and outside school cafeterias.
Instruments and procedures used for previous studies of the school meal programs provided a starting point for the study design, but prior studies did not collect quantitative information about foods available at school in addition to reimbursable meals.1 This chapter describes the instruments and procedures used for the study, the data collection issues that were anticipated and addressed during the design and implementation of the data collection plan, and findings from the fielding of the instruments. Instrument design and data quality issues, as well as some recommendations for future testing, are discussed in Appendix A. Data Collection Instruments
The instruments developed for this study are described in Table 2.1. The Principal Survey and SFA Director Survey collected data about the school food environment and policies related to the availability of competitive foods during the school day. The Cafeteria Survey contained seven data collection instruments to collect data on all foods served in the school food service area, including reimbursable meals and a la carte foods. The “other competitive foods” instruments collected data about foods and beverages available from alternative food sources that may be located anywhere on school property.
1 Instruments to collect detailed food descriptions, portion sizes, and numbers of items sold in reimbursable meals and a
la carte were developed and pre-tested by Abt Associates staff for the second School Nutrition Dietary Assessment Study (SNDA-II). The time required to collect these data was prohibitive, especially in secondary schools, when combined with the same task for reimbursable meals. As a result, detailed data collection for a la carte foods was dropped from the study.

16 Chapter 2: Design and Implementation of the Data Collection Plan
Table 2.1 Data Collection Instruments Category / Instrument Topics Description
Principal Survey Competitive food availability (locations, hours, types of foods); school policies for competitive food; off-campus eating; use of food for fundraising; nutrition initiatives.
SFA Director Survey A la carte food service; food service-operated vending
machines; district policies for competitive foods; exclusive beverage contracts; menu planning; pricing strategies for competitive foods.
Cafeteria Survey 1. Daily Meal Counts Form Reimbursable meal counts for each day, by meal price
eligibility category; a la carte sales for the week. 2. Every Day Cafeteria Foods Form Foods served every day: full description of food item and
either the count of servings per day (reimbursable and a la carte) or check that food is on the Inventory of Prepackaged Foods or the Self-Serve Bar Form.a
3. Cafeteria Foods Form Foods not served every day: full description of food item and count of servings per day (reimbursable and a la carte), or check that food is entered on the Self-Serve Bar Form.
4. Inventory of Every Day Prepackaged Foods
Prepackaged foods served daily and requiring no preparation, including prepackaged condiments. Full description of food item, starting inventory, deliveries, and ending inventory.
5. Self-Serve Bar Form Salad bar and other self-serve food bar items (e.g., condiment bar, sandwich bar): full description of item and portion size (if pre-portioned) or starting amount, amount added, and amount leftover, for one day.
6. Recipe Forms For foods prepared from scratch or by combining two or more foods or ingredients, and listed on the Cafeteria, Every Day Foods, or Self-Serve Bar Forms. Full description of ingredients, amount used, servings prepared, and preparation methods.
7. Food Outside Meal Periods Checklist
List of all foods and beverages sold in the cafeteria outside of the breakfast and lunch meal periods during the target week. Includes the times of day the items are available to students.
Other competitive foods forms 1. Inventory of Prepackaged Snack
Bar Items Description and inventory of all prepackaged foods and beverages requiring no preparation and sold at snack bar.b
2. School Store Food and Beverage Inventory Form
Description and inventory of all foods and beverages sold at school store.
3. Vending Machine Inventory Form Description and inventory of all foods and beverages sold in vending machines.
a If either the inventory or self-serve forms are used, the respondent need only list the name of the food on the cafeteria foods forms.
b For snack bars offering prepared items, a snack bar foods form is used to record counts of servings.

Chapter 2: Design and Implementation of the Data Collection Plan 17
Principal Survey and SFA Director Survey
The Principal Survey and SFA Director Survey were designed as mail surveys with telephone follow-up. The surveys have a similar structure, with a series of questions about each source of competitive foods (a la carte, vending machines, snack bar/canteen/food cart, school store, other sources). The instruments contain skip patterns so that, for the most part, the SFA Director responded to questions about food service-operated venues while principals responded to questions about non-food service-operated venues. Both respondents, however, were asked about a la carte foods, because a la carte policies may vary within SFA. The format of questions about competitive food sources differed slightly on the two instruments. Principals were asked about competitive food policies and practices “at your school”; SFA directors were asked about district-level competitive food policies and practices, and the types of schools for which they apply (e.g., elementary, middle, or high schools). In addition, principals were asked about school policies and practices (mealtime policies, school initiatives, etc.), and SFA directors were asked about SFA operations (a la carte pricing strategies, availability of nutrition information, etc.). The main data elements collected in the Principal and SFA Director Surveys are listed in Table 2.2. School Foods Data Collection Instruments
The school foods forms were used to collect data about all foods offered and served, during the school day, for a one-week period (the “target week”). These forms have two basic structures:
1. Servings approach (designed for prepared foods). This type of form is used to describe and count the number of items selected by students on a daily basis.
2. Inventory approach (designed for prepackaged foods). This type of form is used to describe and count the number of items selected by students using an inventory approach for the target week (i.e., respondents record starting and ending inventory and all deliveries).
The two approaches were intended to be used in combination for cafeteria foods (reimbursable and a la carte) and for snack bars offering both prepared and prepackaged items; only the inventory approach is used for school stores and vending machines. Cafeteria Survey The Cafeteria Survey is comprised of seven forms (see Table 2.1). This survey collected data on all foods and beverages offered and served in reimbursable meals or a la carte in the cafeteria during a one-week period. The main focus was to obtain sufficient detail to describe the types of foods available, the types of foods selected, and the nutrient content of those foods. Detailed data are collected for both the breakfast period (where offered) and lunch periods. Qualitative data about foods offered between meals were collected via data collection checklists.2 The primary respondent for the Cafeteria Survey was the cafeteria manager or other food service staff person.
2 The checklist approach was chosen because (1) it was not known whether cafeteria foods are offered to students outside
regular meal periods, and (2) space on the data collection forms was extremely limited.

18 Chapter 2: Design and Implementation of the Data Collection Plan
Table 2.2 Data Collected by Principal and SFA Director Surveys Topic Questions on Principal Survey Questions on SFA Director Survey Questions about competitive food sources Food venues Number, type, location, and times
competitive foods are available for sale; restrictions on vending machine access.
Sources of competitive foods under the responsibility of the school food service, by school type.
Standards for foods
Rules governing the types of compe-titive foods available to students at school (e.g., nutrition standards, price criteria, prohibited or required foods).
District-level rules governing the types of competitive foods available to students (e.g., nutrition standards, price criteria, prohibited or required foods).
Operation of food venues
Purchasing and stocking arrangements for vending machines in the school
Purchasing and stocking arrangements for vending machines under the responsibility of the school food service.a
Exclusive contracts
Whether school covered by “pouring rights” contractb
Exclusive beverage contracts covering any schools in district
Availability of sales data
Documentation of product sales (number sold) from vending machines and school stores, if available.
Documentation of product sales (number sold) from vending machines under the responsibility of the school food service.
Profits Amount of profit earned from non-food service-operated competitive food sales, and use of profits.
Amount of profit earned from food service-operated competitive food sales, and use of profits.
Other topics (specific to each survey) Parties responsible for determining
competitive food availability (hours, location, types of food).
Mealtime policies. Open campus policies and types of
nearby off-campus eating establishments.
Types and frequency of fundraisers that sell food or beverages.
Initiatives and activities to promote healthful food choices.
Daily student attendance for target week.
A la carte pricing strategies. Availability of nutrition information for
competitive foods. Use of computerized systems for
cafeteria operations. Use of branded foods (e.g., McDonald’s,
Pizza Hut, Subway) for a la carte sales. Food service management company
involvement in competitive food sales. Menu planning system used for
reimbursable meals. a Includes vending machines for which the food service staff purchase and stock food and beverage items, as well as
those under contract with an outside distributor.
b A long-term contract with a beverage company that establishes the company as a sole source vender for some types of beverages.

Chapter 2: Design and Implementation of the Data Collection Plan 19
The Cafeteria Survey was packaged in a single booklet containing the multiple data collection forms.
A separate instruction manual provided detailed guidelines and sample completed forms. The booklet and instruction manual were packaged with recipe forms and reference guides in a large accordion folder, with labeled pockets to assist respondents in locating and organizing materials.3 Color-coded forms, color printing, tabs, and other special formatting features were used to create an attractive, user-friendly package. For this study, the Every Day Cafeteria Foods Form used for prior studies was modified to reduce burden. Respondents list the foods offered every day on this form. They enter the number of servings of prepared foods on a daily basis, but servings of prepackaged items need not be tracked on a daily basis; instead, the form contains a checkbox to indicate that the item is tracked on an inventory form. This approach reduces the number of foods that must be tracked daily to determine servings. The Cafeteria Foods Form collects information on prepared and prepackaged items not served every day. The inventory approach was not used for these foods. This form was not substantially modified from versions used in prior studies. Both cafeteria foods forms request complete food descriptions, including, for pre-prepared items, brand name, manufacturer, and product code. This information was intended to be used, in conjunction with bid lists or other documents obtained from the SFA director, to determine whether additional information on nutrient content is required when entering the food in a nutrient analysis system. Most pre-prepared food items used for school food service are not included in nutrient databases. The Inventory of Every Day Prepackaged Foods was developed and used to track servings of prepackaged items for the week.4 This form called for the starting inventory of items on Monday (or the previous Friday, end of day), deliveries during the week, and the ending inventory on Friday.5 Determination of starting and ending inventories, and transcription of delivery invoices, may be performed outside of normal cafeteria hours, potentially easing the burden that this type of data collection places on cafeteria staff during meal preparation and serving hours. It was not expected that this approach could be used in schools that share a stockroom with other food sources in the school (e.g., snack bar, vending machines), or in schools where inventory may be transferred out to other schools in the district during the target week. The remaining forms for the Cafeteria Survey (forms 5 through 7 in Table 2.1) have been used or tested for other studies (SNDA-II or the Integrated Study of School Meal Costs and Outcomes) and were not substantially modified for this study.
3 The Recipe Forms are bound separately to allow respondents to attach copies of their recipes in lieu of re-copying them
onto study forms. The Product Code Guide provides guidelines for identifying and recording manufacturer product codes, and the foods for which a product code is needed. The Daily Reminder List provides tips for getting organized, and a summary of day-by-day activities for the target week.
4 Foods requiring some preparation, including simple heating, are not considered candidates for the inventory method, because some portions removed from the package may be wasted.
5 The daily average servings can then be computed from the weekly total during analysis.

20 Chapter 2: Design and Implementation of the Data Collection Plan
Other Competitive Foods Forms New data collection instruments were developed for snack bars, school stores, and vending machines. It was expected that school food service staff would complete these forms if the school food service operates these food venues; otherwise, the school principal (or, in two cases, the SFA director) was asked to designate a respondent prior to the data collection period (for example, the principal would provide contact information so that the faculty supervisor for the school store could be recruited). The Inventory of Vending Machine Items and Inventory of School Store Food and Beverage Items collected information on prepackaged snack and beverage items for a one-week period. Instructions emphasized the need for respondents to enter the complete food name, manufacturer, brand, and package size for each item offered at the food venue. For vending machines, it was assumed that principals, SFA directors, or other school personnel could obtain information on the number of items sold for machines contracted out to distributors. The availability of this information is discussed later in this chapter. The procedures for snack bars differed from vending machines and school stores. The inventory approach was used for vending machines and school stores because the majority of items typically sold through these venues are commercially available, individually packaged snacks and beverages. If a school prepared items from scratch for sale in a vending machine or school store, they would be asked to attach a recipe for the items. For snack bars, however, food preparation was expected to be more common; therefore, both a foods form (based on servings approach, with request for product code and recipes if needed) and an inventory form were provided for collection of snack bar information. These forms are similar to the every day foods and inventory forms used for foods served in the school cafeteria. Separate forms are completed for each vending machine, school store, and snack bar in the school, so that competitive foods offered and served can be analyzed by location. The locations of all competitive food sources were requested on the data collection forms. Forms for each type of competitive food source were bound together with a page of instructions and a sample completed form. It was requested that the inventories of competitive foods be completed for the same target week as the Cafeteria Survey, whenever possible. Data Collection Procedures
The data collection effort for the feasibility study spanned an eight-week period from mid-April to mid-June 2003.6 This time frame included the scheduling of data collection activities with respondents; advance meetings with school food service staff prior to finalizing the instruments; on-site training, technical assistance, and collection of validation data by Abt Associates staff; completion of surveys and school foods forms by SFA and school staff; and debriefing meetings with all respondents. State Child Nutrition (CN) directors were also interviewed by telephone during this period. Table 2.3 lists all data collection activities for the study.
6 The target week for data collection in all three schools was May 19-23, 2003.

Chapter 2: Design and Implementation of the Data Collection Plan 21
Table 2.3 Data Collection Activities School #1 School #2 School #3 Advance meeting with school staff
Yes Yes No
On-site training:
Time spent training 70 min 90 min 90 min Number trained 2 5 4
On-site technical assistance:
Time spent reviewing forms 15 min 85 min 25 min Time spent talking with respondents
15 min 45 min 30 min
Validation data collected by Abt Associates staff
Yes Yesa Yes
Instruments completed and respondent(s):
SFA Director Survey SFA Director SFA Director SFA Director Principal Survey Principal and teacher Headmaster Assistant Principal Cafeteria Survey Cafeteria manager Food service staff
person (not manager), assisted by manager and other staffperson
Cafeteria manager
Vending Machine Inventory (food service)
N/A Cafeteria manager and other food service staffperson
Cafeteria manager
Vending Machine Inventory (outside contract)
Pending (beverage distributor)
Pending (beverage, snack, and ice cream distributor)
Athletic director (items offered—no sales information)
Snack Bar Forms N/A Food service staff persons (not manager)
N/A
School Store Inventory N/A Faculty supervisor for student-run store (items offered and “sold”)
Faculty supervisor for student-run store
State CN director interview conductedb
Yes Yes Yes
Debriefing meetings completed Yes, all respondents Yes, except with
headmaster, store supervisor
Yes, all respondents
N/A = not applicable
a These data could not used; respondent provided food and beverage information for a week prior to the target week.
b Brief telephone interview—no formal instrument was developed.

22 Chapter 2: Design and Implementation of the Data Collection Plan
Advance Meetings with School Staff
Advance meetings were held with school staff in two of the three schools.7 The advance meetings provided an opportunity to meet the respondents, learn more about school food service operations and locations of competitive food venues, obtain feedback on the draft data collection instruments, and discuss a strategy for obtaining information about vending machines stocked by an outside distributor. During the meeting with the SFA director and cafeteria manager, Abt Associates staff reviewed typical menus, production records, and point-of-service (POS) system reports generated by the food service staff to identify information that might be useful in completing the study forms. For example, reimbursable meal counts were readily available on daily POS system reports. Training and Technical Assistance
On the Thursday prior to the target week, one member of the Abt Associates study team visited each of the schools to train respondents on completing the school foods forms. Actual training time ranged from a little more than an hour at the middle school (School #1) to approximately 1½ hours at the high schools. The SFA directors and cafeteria managers participated in all three trainings. At School #2, snack bar staff, the person responsible for reimbursable meal and a la carte meal counts/ production records, and their field supervisor were also trained.8 At School #3, the training included the athletic director responsible for vending machines outside the cafeteria and a marketing teacher who runs the school store. For all three schools, the majority of training time was devoted to reviewing the instructions and procedures for the Cafeteria Survey (about 1 hour). During the target week, Abt Associates staff visited each school on Tuesday or Wednesday to review the study forms completed thus far, answer questions, provide additional training, if needed, and collect validation data. The middle school cafeteria manager (School #1) had been out on Monday of the target week, so there was little recorded in her survey to review. This was unfortunate because there were omissions and problems with the data from this school that might have been rectified if caught early on. As with the training visits, most of the time spent during the technical assistance visits was devoted to the Cafeteria Survey (30 minutes to 2 hours).9 There were fewer questions and problems with the competitive foods inventory forms at this point in the data collection. Validation Data On the day that technical assistance visits took place in the three schools, Abt Associates staff collected information to validate, qualitatively, the information respondents provided on study forms. Using the same forms, study staff listed all items sold a la carte only, in vending machines, at the snack bar, and in school stores. They also documented (to the extent they could be identified) package size and price. The main purpose of validation was to corroborate the identity of competitive foods, provide a way to check that school staff provided a comprehensive list of items available, and document the ability of an outside observer to collect these data without disrupting school operations.
7 The third school was identified late in the recruitment phase of the study, so an advance meeting could not be
scheduled at this school. 8 The faculty supervisor for the student-run school store (head of the business education department) at the
Massachusetts high school was not trained, because he would not agree to complete the study form. At the time of the training visit, he provided an invoice for a typical weekly food order, which he said represented the items sold the previous week. These data were treated as valid for purposes of analysis.
9 At all schools, there was a need to review the options for recording condiments.

Chapter 2: Design and Implementation of the Data Collection Plan 23
The most common problem with the collection of these data was identifying package sizes for some vending machine items because items are not always fully visible. In addition, some a la carte, school store, and snack bar foods were accessible only with the assistance of school staff, and prices were not always posted. Results of the validation analysis are reported in Appendix B. During the same school visit, also for validation purposes, a random one-third sample of all competitive food items was purchased from each of the food venues. The labels from purchased items were used for comparison with the nutrient information obtained from the nutrient database.10 This analysis is reported as part of Appendix C. Survey Completions
Principal and SFA Director Surveys were mailed (or hand-delivered, during training visit) to principals and SFA directors the week prior to the target data collection week. A cover letter asked respondents to return the surveys within two weeks of receipt in the prepaid overnight delivery envelope provided. Two of the three principals, and one SFA director were contacted by telephone when their surveys were not received on time (or prior to scheduled debriefing meetings). All school foods data collection booklets were distributed to respondents during the pre-target week training visit.11 Respondents were asked to return the completed booklets within one week of the last day of the target week. SFA directors were asked to collect and return the Cafeteria Surveys and other forms completed by school food service personnel by prepaid overnight delivery; other school personnel completing competitive foods forms were provided with separate return mailers. Two SFA directors returned the materials on or close to the due date (Cafeteria Surveys and one Vending Machine Inventory). Abt Associates staff obtained the remaining materials on the day of the debriefing meeting at the schools. The main problem in obtaining completed survey forms was encountered for vending machines operated by outside distributors. In order to obtain complete information on vending machine items, the SFA directors in Schools #1 and #2 contacted the outside distributors who stock machines located in the school cafeterias. The SFA director for School #1 worked through the business manager for the city, because the city held a contract with a major beverage distributor. The SFA director for School #2 contacted his local distributor directly. In both cases the SFA director provided the distributor with a copy of the Inventory of Vending Machine Items form and asked that they either complete the form for a one-week period or provide the information in whatever format it was available. The athletic director in School #3 was also asked to contact his distributors (one local and one national distributor), but it was not clear that he actually did so. After several follow-up requests by study staff, the requested data were received from one of the SFA directors (from one of the four distributors).12 10 Beverages were not purchased, primarily because the Nutrition Facts information was thought to be readily available
locally or on-line. 11 Ideally, the Cafeteria Survey would be mailed to respondents two weeks in advance of the target week. This allows
additional time for respondents to review the instruction booklet and sample completed forms prior to the training visit. The same lead time may not be needed for the other foods forms, because only one type of form is involved and instructions are relatively brief.
12 Abt Associates staff also attempted to collect information from vending machine distributors, but with little success. One local distributor reported that they only tracked certain categories of snack items in their machines (e.g., chips, cookies), and that this information is considered proprietary. Coca-Cola Enterprises is able to report sales for
24 Chapter 2: Design and Implementation of the Data Collection Plan
State Director Interviews
During the data collection period, brief telephone interviews were conducted with the Massachusetts and Virginia state CN directors to collect information about state policies and initiatives related to competitive foods. They were also asked about the availability of nutrition information for commodity diversion products used in their states. Debriefing Meetings
The Abt Associates project director and one other member of the study team debriefed respondents during in-person meetings at all three schools. FNS staff attended the debriefing for School #3 (in Virginia). All respondents participated in the debriefing meetings, except the headmaster and school store supervisor at School #2.13 During the meetings, each respondent was asked to confirm or estimate the time required to complete the questionnaire or school foods forms. They were also asked about the clarity of questions and instructions, the reasonableness of the questions or task, problems encountered, and suggestions for improving the questionnaires/data collection forms. Additional, instrument-specific topics were also explored with each respondent. Key findings from the debriefing meetings are discussed in the section on data collection issues and in Appendix A. Data Preparation and Data Entry in Nutrient Database
Upon receipt, Abt Associates staff reviewed the surveys and all school foods instruments for legibility and completeness. The Principal and SFA Director Surveys were essentially complete, except for some item non-response. To the extent possible, missing data and clarifications were obtained from respondents during the debriefing meetings. If these meetings had not taken place, follow-up calls would have been made to most of the respondents. After editing and assigning school identification numbers, responses to the Principal and SFA Director Surveys were entered into an Excel database. Project nutritionists reviewed the Cafeteria Surveys and noted problems, but editing was limited to the forms containing a la carte-only foods.14 For the three schools in the study, this included the Inventory of Every Day Prepackaged Foods Forms (two schools) and the Every Day Cafeteria Foods Form (one school).15 Because of the short period of time for data preparation and analysis, study staff relied primarily on the validation data and on-line sources (rather than follow-up telephone calls) to supplement respondents’ descriptions of the competitive food and beverage items. Again, debriefing
individual items by machine (product name, size, units sold—not price), but could not do so on an ongoing basis. Their smaller distributors may not have the same capability. Coca-Cola agreed to fax the information for the target week for School #1, but it was never received. Calls made to the local distributor in Virginia for Pepsi were not returned.
13 The headmaster had not completed the Principal Survey when the debriefing meeting was initially scheduled. Subsequent efforts to meet or interview him by telephone after receiving his completed survey proved unsuccessful. The faculty supervisor for the school store was not asked to participate in the debriefing because he did not complete the study form.
14 Data on reimbursable meals collected in the Cafeteria Survey were not entered, in accordance with guidance provided by FNS in the Statement of Work for the feasibility study. Because time and resources were limited, the study was designed to focus on identifying the issues involved with the collection and analysis of a la carte-only foods.
15 None of the a la carte-only foods were part of a self-serve bar or prepared from a recipe, and none of the schools sold a la carte items outside of meal periods.

Chapter 2: Design and Implementation of the Data Collection Plan 25
meetings also provided the opportunity to clarify some data with cafeteria staff, such as questions about how servings and inventory data were obtained. Follow-up calls were made to both cafeteria staff and SFA directors to obtain nutrient information,16 and missing bulk packaging and package size information. The competitive foods data were coded using the Food Intake and Analysis System (FIAS), maintained by the University of Texas’ Health Science Center. Data entry procedures and issues for the nutrient data are discussed in Appendix C. Data Collection Issues
The main challenges anticipated during the design of the data collection plan were:
• Overall burden; • Determining the data collection period; • Identifying appropriate respondents; • Tracking the numbers of foods sold in vending machines; and • Designing cafeteria instruments to collect data on all foods.
Some of these challenges are obviously related (for example, the performance of new instruments depends on identification of appropriate respondents). The following sections discuss each of these challenges and how they were addressed during the study design and implementation. Appendix A includes a detailed discussion of the quality of the data collected and design issues that impacted data quality. It also provides some recommendations about instrument design that should be considered prior to future testing. Overall Burden
It was anticipated that the burden of collecting data on all school foods and competitive food policies and practices would be great. Specific ways in which burden was addressed are discussed in the section below on designing cafeteria instruments to collect data on all foods. In addition, all respondents were offered compensation for the time spent completing the instruments and participating in the debriefing meetings, as follows:
• Principal and SFA Director Surveys: each $50 • Cafeteria Survey: $200 • Inventories of Competitive Foods: each $50
The estimated response burden for each instrument used in the feasibility study is provided in Table 2.4. Overall, the principals and SFA directors did not find the surveys to be too long, whereas the cafeteria staff were required to devote a large amount of time and effort to complete the survey, especially for staff also completing one of the other competitive foods forms.
16 Nutrient information was needed for only one pre-prepared item: ready-to-bake chocolate chip cookies. The
manufacturer and product code were provided, but the item could not be located on line.

26 Chapter 2: Design and Implementation of the Data Collection Plan
Table 2.4 Respondent Estimates of Data Collection Burden, in Hoursa School #1 School #2 School #3 Principal Survey Total hours 2.33 2.33 1.25
Gathering info 0.75 0.0 0.0 Consulting with other staff 1.25 1.0 0.25 Completing questionnaire 0.33 1.33 1.0
Total number of respondents 2.0 1.0 1.0 SFA Director Survey Total hours 1.0 1.83 0.33
Gathering info 0.5 0.33 0.0 Consulting with other staff 0.25 0.0 0.0 Completing questionnaire 0.33 1.5 0.33
Total number of respondents 1.0 1.0 1.0 Cafeteria Survey Total hours 6.0 47.0 11.75
Prior to target weekb 1.0 12.0 4.0 During target week 5.0 35.0 7.75
Total number of respondents 1.0 3.0 1.0 Snack Bar Inventory Total hours N/A 7.83 N/A
Prior to target weekb 1.0 During target week 6.83
Total number of respondents N/A 2.0 N/A Vending Machine Inventory Total hours N/A 7.0c 5.83
Prior to target weekb 0.0 1.0 During target week 7.0 4.83
Total number of respondents N/A 2.0 1.0 School Store Inventory Total hours N/A N/A 1.83
Prior to target weekb 0.0 During target week 1.83
Total number of respondents N/A 1.0 1.0 All Instruments Total hours 9.33 66.0 21.0 Total number of (unique) respondents 4.0 8.0 4.0 a Excludes time spent collecting data for foods available after school only.
b Excludes training time.
c Excludes time spent by outside vending distributor.
N/A = not applicable/available

Chapter 2: Design and Implementation of the Data Collection Plan 27
Principal and SFA Director Surveys Although none of the principals felt the survey was too long (1¼ to 2-1/3 hours), the high school principals found it more difficult than the middle school respondents. One high school (assistant) principal noted that she did not know the answers to many of the questions about her school. The headmaster of the second high school reported that he did not have time to “research” the answers to questions he could not answer, such as vending machine profits and policies about a la carte foods. SFA directors found the survey “easy” and relatively brief (20 minutes to just under 2 hours). One director commented that the survey seemed overly focused on sales from vending machines relative to a la carte items sold in the cafeteria. Another was surprised the survey did not include any questions about SFA director opinions, or about why certain foods are selected to be sold. Cafeteria Survey and Inventories of Competitive Foods Most of the data collection burden for this study falls on the cafeteria staff. Cafeteria managers are responsible for preparing and serving reimbursable and a la carte meals for large numbers of students within short periods of time. In addition, the cafeteria manager may be responsible for purchasing and stocking items for vending machines, a snack bar or canteen, or food carts/kiosks. The Cafeteria Survey required a total amount of time that ranged from 6 hours for the middle school to 47 hours for the larger high school (School #2) (see Table 2.4). The latter estimate may not be reliable. The main respondent did not keep a daily log of time spent during the target week, and reported spending 12 hours prior to the target week reading instructions. Based on probing by study staff during the debriefing, Abt’s estimate of the maximum burden for this school is closer to 30 hours. This is still considerably more time than was reported by the manager in the second high school (about 12 hours). Both schools offered a large number of entrée choices, but the school that spent the most time completed more recipe forms, a self-serve bar form, and forms for breakfast as well as lunch. Still, the Cafeteria Survey for School #3 included all of the a la carte-only foods, whereas for School #2 these were recorded by another respondent on the snack bar forms. Two cafeteria managers had to take the Cafeteria Survey home because they did not have time to complete it during the school day. The third Cafeteria Survey respondent (School #2) came to work early and stayed late each day of the target week, and enlisted the help of two other staff for an hour each day. In addition, the manager at School #1 had to be paid overtime, in accordance with union rules. Cafeteria managers in the two high schools found the Inventory of Every Day Prepackaged Foods form time-consuming to complete, citing multiple deliveries coming in during the course of the week. Milk was in fact delivered daily. According to the data recorded on the forms, however, other items were delivered on only one or two days during the target week. The Inventory of Prepackaged Snack Bar Items, completed only for School #2, was considered particularly burdensome due to the large number of items offered at the snack bar. Respondents felt that taking the inventory and recording deliveries was “a two-person job”. The total time required to complete the form, excluding SFA director time, was approximately 8 hours.17 This burden was found to impact the choices available to students: the respondent reported during the debriefing that 17 The SFA director set up an initial spreadsheet so that cafeteria staff would not have to write out the product names.
This form was used instead of the study forms, and led to problems that are discussed in Appendix A.

28 Chapter 2: Design and Implementation of the Data Collection Plan
she tried to avoid opening new cases of items on Friday because she didn’t want to have to count individual packages for the ending inventory. The Inventory of Vending Machine Items seemed to work quite well for the two high schools with food service-operated vending machines (Schools #2 and 3). Respondents reported that the forms were easy to complete; the data collection burden was similar in both schools—6 to 7 hours for two machines. One school restocked items on a daily basis, and the other restocked on only three days of the target week. The test of the Inventory of School Store Food and Beverage Items was based on only one respondent. The faculty supervisor for the school store in School #3 found the form easy to complete, and did so in just under 2 hours. Unfortunately, because this was a testing week at the school, she did not place any orders or receive the usual weekly deliveries, so the burden estimate may be low. Note that burden for some of the other competitive food sources may be underestimated because of the time of year the study was conducted. The cafeteria managers were not replenishing stock to the extent they would have been earlier in the school year. In addition, respondents in both high schools reported that student food sales were lower than usual due to end-of-school-year activities, including testing periods, during which breakfast and snacks were served by parent-teacher organizations. Data Collection Period
The standard method used to analyze the nutrient content of reimbursable school meals is based on the average nutrient content of the foods offered and sold over a five-day (one-week) data collection period. This study used the same one-week time period for competitive foods in order to capture the variability in student selections across days of the week, and the possible relationship between competitive food selections and reimbursable meal offerings. One exception to the five-day period was for vending machines stocked by outside distributors. Sales data for these machines were requested for “whatever time period it was available”. One distributor provided two weeks of sales data for vending machines in School #2. These data revealed that sales were quite variable from week to week, possibly because the machines ran out of stock of some items during the period. Identifying Respondents
While designing the data collection plan, it was not always clear who the most appropriate respondent would be for each instrument or data item.18 This was a particular issue in the larger schools with multiple sources of competitive foods for which several different district or school personnel were responsible. For school food service-operated venues (a la carte, snack bar, and vending machines in the cafeteria), the SFA directors and cafeteria managers were the primary contacts with Abt Associates and they designated appropriate respondents.
18 For example, prior to the initial contact with the school, it is not possible to know the persons responsible for vending
machines located outside the cafeteria and school stores.

Chapter 2: Design and Implementation of the Data Collection Plan 29
For non-food service operated food venues (school stores and certain vending machines), it was assumed that principals could be consulted to determine potential respondents. Principals were not always willing, however, to get involved with the recruitment of these staff. For questions about the school environment and school food policies, the study relied largely on school principals. It was assumed that principals would be best able to answer (or obtain the answers to) these questions, but they had difficulty with many questions on the Principal Survey. Findings for the small sample of schools in this study indicate that principals were not always aware of the types, locations, and policies concerning competitive foods available to students (especially in the high schools). The degree to which principals were motivated to obtain the information from more knowledgeable district or school personnel varied. Both the Principal Survey and SFA Director Survey included questions to determine whether any other personnel needed to be consulted when completing the questionnaire. Two principals reported consulting with the cafeteria managers; one SFA director consulted with the cafeteria manager and one SFA director consulted with the city business manager (about the exclusive beverage contract). Tracking Number of Items Sold in Vending Machines
Of particular interest for this study was the ability to track the sales of individual items in vending machines available during the school day. The inventory approach could be adopted for this task in schools where the school food service or other school staff stock the machines. A major question, however, was how feasible or difficult it would be to obtain sales data for machines that are not stocked by school staff. Thus, the study was designed to explore multiple potential sources of information on the types and sales of foods and beverages stocked in these machines. These included attempts to have distributors complete the inventory forms, requests for copies of relevant documents from distributors (through the principal and SFA director surveys), and direct contacts by Abt Associates staff with distributors. This feasibility study found that information on the types of products and number sold from vending machines operated by outside distributors was not readily available. It could only be obtained from one of four distributors contacted. The SFA directors for two schools each spent an hour making telephone contacts to the distributors to obtain the necessary information. The SFA director for School #2 was successful in obtaining the data for four vending machines. The distributor recorded on the Inventory of Vending Machine Items form the slot number, item description, price, package size, and the number of each item added to the machines during a two-week period. Because the drivers replace what has been sold during the previous week, it seemed reasonable to assume that these data were representative of sales and could be used in the analysis.19 Although it was not working during the target week, the distributor reported that the drivers typically use a scanning device that performs an electronic inventory of the items in the vending machines prior to restocking. Apparently this device is currently being used by only 1 to 2 percent of vending distributors nationwide.
19 There was some evidence that sales varied over the two weeks from one of the machines; therefore, an average of the
numbers sold during this period was used in the analysis.

30 Chapter 2: Design and Implementation of the Data Collection Plan
The athletic director at School #3 is responsible for six vending machines (these were available to students after school only). He was able to partially complete the vending inventory form, recording the slot numbers, names, and package sizes of the items in the machines,20 but was unable to obtain information from his two distributors about the number of individual items sold. The statements the athletic director receives on a monthly basis include total sales (in dollars). For one machine, the statement also includes the total number of units sold (e.g., 180 snacks), and for the beverage machines, the total number of cases sold. The athletic director indicated that the distributor decides which items go into the machines, and restocks only once every two weeks. As noted earlier, efforts by Abt Associates staff to obtain information from the vending distributors were not successful. Designing Cafeteria Instruments to Collect Data on All Foods
In designing data collection instruments for this study, four main features were implemented to reduce the burden on cafeteria managers:21
1. Collection of servings data combined an “inventory approach” with the traditional “servings approach” used for reimbursable meals;
2. Data collection did not require separate tracking of servings in reimbursable meals versus a la carte;
3. The requirement that cafeteria staff collect labels and nutrition information for pre-prepared food items was eliminated; and
4. Plans were made to discuss alternative methods of data collection with school staff during advance meetings.
The main findings are:
• Collecting detailed data simultaneously about reimbursable meals and a la carte (and other competitive foods) was extremely burdensome for school cafeteria staff. It could not be accomplished without considerable overtime or working on their “own time”, especially at the high school level.
• Cafeteria Survey data quality was a major problem for two of the three schools. The most significant issues for one school (#1) were omissions of reimbursable items from all meal component categories, plus condiments; recording the number of portions prepared versus number served; and incomplete/inaccurate information recorded for the inventory of prepackaged a la carte only items. The second school (#2) also recorded the amount prepared versus served for many foods, and sometimes expressed the amount in terms
20 This information was recorded while the driver was filling the machines; that made it possible to “see” the package
sizes for most of the items. 21 The use of daily menu forms, preprinted with meal component categories and descriptions of commonly offered foods,
similar to those designed for the Integrated Study, was considered to reduce burden further. Their use was rejected for two reasons: (1) the preprinted forms were still undergoing testing, and (2) use of the blank forms would allow for comparisons of the data collection burden due to a la carte foods with that observed for SNDA-II.

Chapter 2: Design and Implementation of the Data Collection Plan 31
of cases, gallons, pounds, etc., instead of individual portions. Incomplete food descriptions were a problem, to varying degrees, in all three schools.
• Cafeteria managers in two of the three schools had significant difficulty and were unsuccessful at providing manufacturer product codes for pre-prepared foods (as an alternative to collecting labels), which are needed to obtain nutrition information.
Inventory Approach The “inventory method” for obtaining information on the number of competitive items sold was well accepted by food service staff. Three inventory forms were used in the cafeteria by one or more schools: Inventory of Every Day Prepackaged Foods, Inventory of Vending Machine Items, and Inventory of Prepackaged Snack Bar Items.22,23 Although the inventory approach saved time during the busy meal periods, data collection in the cafeteria was still time-consuming. The inventory method was found to have one limitation—this data collection method may mask day-to-day variations in food offerings that are due to shortfalls in stock. Most competitive foods are “everyday items”—that is, the intention is to offer them every day. Stocks of foods run out during the week, however, influencing the choices faced by students on any particular day. Respondents noted that some of the stock “run out” observed in this study was due to the timing of data collection at the end of the school year. Separate Tracking of Reimbursable Meal and a la Carte Servings The second feature of the data collection plan was that, for foods served in reimbursable meals and also offered a la carte, cafeteria staff were not asked to separately track reimbursable and a la carte servings. For these foods, the cafeteria manager could report the total number of servings when completing the cafeteria foods forms. Based on experience in previous studies, this feature was expected to be integral to the feasibility of collecting data on all foods offered in the cafeteria.24 Separate counts of servings were not needed for the two main goals of this study, as discussed in Chapter 5. Furthermore, separate tracking of servings is not possible in many schools. Putting special procedures in place to do so would impose an enormous burden that might interfere with operations and influence the foods available to students during the data collection period.25 Eliminating Labels and Nutrition Information The third way in which the data collection burden was intended to be reduced for cafeteria staff was by eliminating the task of providing product labels and nutrition information for pre-prepared items
22 Two of the three schools used the inventory method for milk, which was available both as part of the reimbursable
meal and a la carte. The middle school manager felt more comfortable including milk on the daily Cafeteria Foods Forms because “it goes with the meal,” thus, she used the servings method for milk. Because milk is typically ordered and delivered daily in many schools, it is not clear whether the inventory method is less burdensome than the servings approach for this item.
23 The only a la carte-only item that was not tracked on the Inventory of Every Day Prepackaged Foods form was a ready-to-bake chocolate chip cookie, because theoretically any wasted servings could not be accounted for using the inventory method. (In reality, this item is so popular that it usually sells out completely, so there is no waste.)
24 Some schools may be able to separately count the numbers of items served in reimbursable meals and items sold a la carte. None of the schools in the feasibility study would have been able to do this without putting special (manual) procedures in place, and not without disrupting usual operations.
25 There was concern that cafeteria staff might offer fewer choices or choose not to restock some food items if they were unable to keep track as they replenished stocks.

32 Chapter 2: Design and Implementation of the Data Collection Plan
listed on the cafeteria foods forms. (Nutrient information is needed to establish a definitive match with items in the nutrient database, or to enter new items in the database.) Cafeteria staff were instead asked to provide the manufacturer’s product codes, but only for specially formulated school food service items (e.g., Rib-BQs, commodity chicken patties) and foods with a nutritional claim (e.g., vitamin-fortified juice, low-fat cheese, Super Donuts). Rather than burdening cafeteria staff with the collection of product labels, it was assumed that this information could be obtained in a centralized fashion after the data collection week, either on-line or from SFA directors.26 Alternative Methods of Data Collection Alternative methods for obtaining detailed information about foods served in the school cafeteria were also explored. During the instrument development phase of the study, Abt Associates staff reviewed production records kept by cafeteria managers and found they contained useful information, which would have to be duplicated on the study forms. One school’s production records were quite detailed, with food descriptions, recipe codes, manufacturer names and product codes, portion sizes, and complete production information (numbers prepared, leftover, and used) for each food item served. On the other hand, food descriptions on records kept by another school were incomplete for purposes of nutrient analysis, and production information for similar foods was combined (e.g., hamburger and cheeseburger, kielbasa and hotdog). At two of the three schools, the production information for milk was not separated out by flavor or fat content (e.g., servings of chocolate skim and whole milk were counted together). Thus, it was preferable to proceed with all schools completing the study forms, transcribing information from production records, when appropriate. The use of POS system reports was also explored, as a possible source of information on the number of a la carte items sold and/or the numbers of students purchasing a la carte items throughout the week. Neither of the two systems used in the three schools were set up to provide a count of the students who made a la carte purchases. Both systems did provide counts for any food or group of foods for which there was a separate register key. Most of the register keys in all three schools, however, were assigned to groups of a la carte items by type or price (e.g., cookies @ $0.75, chips @ $0.50). Therefore, the POS system reports used in the three schools could not be substituted for counts of servings or inventories collected on study forms. Summary
This chapter describes the data collection instruments and procedures used for the study, and discusses problems and successes encountered with the collection of data. This section summarizes the main findings from the fielding of the data collection instruments, and the limitations of what can be learned from the sample of three schools. Findings from Data Collection
The findings of the data collection portion of the study are summarized below:
26 This is similar to the process Abt Associates has used in past studies when required labels or nutrition information were
not provided or not available through the cafeteria manager. This centralized process also recognizes that the most efficient way to collect nutrition information in a future national study is to centralize the process (because many schools serve the same items).

Chapter 2: Design and Implementation of the Data Collection Plan 33
Data Collection Instruments • Respondents to the Principal and SFA Director survey had difficulty with the format of
the questions about competitive food policies. These questions were sometimes misinterpreted due to a lack of formal policies at the SFA and school levels.27
• Respondents to the Principal and SFA Director Surveys were generally unable to respond to questions about profit earned from competitive food operations.
• Instruments should be revised to collect detailed information about each vending machine. The current survey collected information on each topic in the aggregate (number of machines by location, hours, operation, food items), and it was not possible to provide a comprehensive description of each individual machine.
• A data collection period of one-week may not be sufficient for obtaining data on competitive food selections. Compared to the components of the reimbursable meal, competitive foods are more likely to run out of stock during a week. As a result, the data on selections can be highly variable from week-to-week depending on whether stocks are replenished on a timely basis.
• The Cafeteria Survey presented problems regarding the accounting for condiments, the accuracy of servings data, and obtaining manufacturers’ product codes. These issues would have required significant follow-up if the data on reimbursable meals had been included in the analysis.
Burden
• Data collection imposed significant burden on the cafeteria managers/staff. Cafeteria staff at the two high schools spent 18 and 45 hours completing data forms for the target week. Respondents reported that data collection had to be done outside of work hours, with assistance of other staff, or as paid overtime.
• In addition to the time burden, two of the three schools had difficulty with the data collection process. Future studies may need to plan for more and better timed technical assistance.
Response Issues
• The Principal Survey had significant item non-response, especially regarding competitive food policies and financial arrangements.
• The Principal Survey yielded data that did not agree with on-site observations by Abt staff observations (e.g., the existence of vending machines and what is in them).
• The Principal Survey would have required extensive telephone follow-up to obtain completed surveys had debriefing visits not been scheduled to follow-up with respondents.
• SFA directors were knowledgeable about food policies and motivated to complete the survey; there was no item non-response from SFA directors.
27 Due to the lack of information about the prevalence and variety of competitive food policies at the district and school-
level, future surveys should included more opportunity for open-ended narrative responses on these topics.

34 Chapter 2: Design and Implementation of the Data Collection Plan
• The study forms for the snack bar and school store inventories were not used by some of the respondents because of perceived burden. This led to incomplete data from these food venues.
• Inventory data for vending machines operated by non-school personnel (i.e., machines filled by distributors) were difficult to obtain. For this study, only one of four distributors responded to requests for data.
• Validation of competitive food data showed that school staff accounted for nearly all competitive food items on the cafeteria and inventory forms. Across all food venues, only 5 percent of offered items were not entered on forms, suggesting that missing data was not a large problem.
Data Entry Issue
• Obtaining accurate nutrient data requires significant effort beyond data entry of product names in a nutrient database. More than 10 percent of the competitive food and beverage items seen in this study were new products or had brand-specific fortifications.
Limitations
The testing of instruments and procedures was limited in several ways by the small sample included in this feasibility study:
• All three schools had just one serving location for lunch and a la carte sales. As a result, the data collection instruments and procedures were not tested in a school environment with multiple serving locations and storage areas.
• All three schools used POS systems, so the burden estimates do not represent the experiences of respondents in schools that rely on manual systems for tracking meal counts and a la carte sales. This study did not find, however, that POS systems, as used in the sample schools, were particularly helpful in reducing the burden of reporting servings of individual food items, either for reimbursable meals or competitive food service.
• The study was unable to test the Foods Outside Meal Periods Checklist. None of the three schools offered a la carte foods or beverages for sale to students outside of the breakfast or lunch periods.
• The study was unable to test the collection of data from canteens, concession stands, and snack bars that offer prepared foods (in addition to prepackaged snack and beverage items). Prepared foods impose greater burden on data collection because these foods may need to be described by completing recipe forms, although the process is similar to that required for reimbursable meals.
• The study had limited opportunity to test the feasibility of obtaining nutrition information for specially formulated school foodservice items. These items were not sold a la carte-only. Information was collected for these items when offered as components of the reimbursable meal, but by design, the study did not enter these data into a nutrient

Chapter 2: Design and Implementation of the Data Collection Plan 35
database. The issue to be investigated in further studies is the ability to accurately identify products from the food descriptions provided by cafeteria managers.28
28 Requesting manufacturer product codes in lieu of collecting labels for components of the reimbursable meal was not
particularly successful. Recommendations for future data collection include (a) request purchasing specifications from SFA directors, and emphasize that cafeteria managers provide complete food descriptions; (b) request nutrient informa-tion from SFA directors when it is not available on-line (SFA directors reported that they keep this information on file or can obtain it easily from distributors); (c) obtain nutrition information for commodity diversion products from state CN agencies.

Chapter 3: Competitive Foods: Policies and Practices 37
Chapter 3 Competitive Foods in the School Environment: Policies and Practices in Three Schools
This feasibility study tested an approach for collecting data about the school environment, school policies, and financial arrangements related to the availability of competitive foods. Two survey instruments were fielded to collect these data: the Principal Survey and SFA Director Survey. The instruments were discussed in Chapter 2, and an assessment of the success of the instruments was provided in that chapter. This chapter presents a picture of school food policies and practices in three schools. The Principal Survey and SFA Director Survey are the primary data sources. The survey data were revised and supplemented, however, based on information obtained during on-site training and debriefing visits to the schools. In addition, the narrative provided in this chapter includes information obtained from the Cafeteria Survey and the inventories of competitive foods, thus allowing a rich picture of the school environment found at the three sample schools. It is important to recognize that the schools were not randomly selected, and are not representative of schools nationwide. Supplementing and revising the survey data with information from the site visits allows for the most complete and accurate presentation of school environments for the purpose of this report. For future monitoring efforts, however, it may not be feasible to conduct on-site interviews in all schools. Chapter 5 provides recommendations for improved surveys that may be tested for future data collection efforts. The Principal and SFA Director Surveys collected information about four sources of competitive foods:
• A la carte • Snack bars • Vending machines • School stores
In addition, the SFA Director Survey included questions about menu planning, computer systems, pouring rights contracts, availability of nutrition information for competitive foods sold by the school food service, and whether pricing strategies were used by the school food service to encourage healthful food choices. The Principal Survey included additional questions about off-campus eating establishments, use of foods for fundraising activities, and school initiatives to increase healthful food choices. The two surveys had minimal overlap: the Principal Survey asked for school information, whereas the SFA Director Survey primarily asked for district-level information (with some questions specific to the sample school). With this structure, information was obtained about competitive food policies at the district and school levels. Information about state policies was obtained via telephone conversations with the Massachusetts and Virginia state CN directors.

38 Chapter 3: Competitive Foods: Policies and Practices
The primary goal of this chapter is to characterize the availability of competitive foods, the operation of food venues where students may obtain competitive foods, and the formal policies that influence the school food environment—albeit based on a small sample of schools. Food Venues
Table 3.1 provides a summary of the food venues available to students at the three sample schools. At all three schools, food is available in the cafeteria from reimbursable meal service, a la carte service (including snack bars), and vending machines. There are no food venues located outside the cafeteria in School #1 (the middle school). At Schools #2 and #3, students may also obtain food outside the cafeteria from the school store, and from vending machines available only after school. Food Venues Available in School Cafeterias
In all three schools, reimbursable meals are served in the cafeteria. Cafeterias contain multiple serving locations and food venues, described as follows:
• School #1 (middle school). Students form a single line to pick up a reimbursable meal; after selecting the reimbursable lunch, students can purchase a la carte snack items at a separate register. A single vending machine is located in the cafeteria.
• School #2 (high school). Reimbursable lunch offerings are set up as food stations in the cafeteria. In addition, the cafeteria has a separate snack bar and seven vending machines.
• School #3 (high school). Cafeteria has three lines where students can purchase the same items, including reimbursable lunches and/or a la carte items. Two vending machines are located in the cafeteria.
A la carte foods are offered during lunch (but not breakfast) at all three schools. A la carte foods may be components of the reimbursable meal or “a la carte-only foods” that are never sold as part of a reimbursable meal. As shown in Table 3.1, two of the three schools allow a la carte purchase of reimbursable meal entrees and other meal components; School #2 does not allow a la carte purchase of reimbursable entrees alone. Additional rules governing the purchase of a la carte items are:
• School #1. Students may purchase a la carte items only after the purchase of a reimbursable meal, or if they bring a bag lunch.
• School #2. Components of the reimbursable meal can only be purchased a la carte as a complete meal, with the exception of milk and juice, which can be purchased individually.
• School #3. French fries may only be purchased a la carte after a reimbursable meal has been taken and when an additional entrée is purchased.
A la carte-only foods are available in all three schools: at a separate register in School #1, from a snack bar in School #2, and on the line in School #3. In School #1, a la carte-only foods include prepackaged snacks, such as chips, doughnuts, cupcakes; and beverages, such as spring water, sports drinks, and juice-based drinks. In School #2, a la carte-only foods include salads, ice cream, and snacks such as chips, cookies, snack cakes, and granola bars; beverages include milk, juice drinks, and spring water. School #3 sells a la carte-only foods that include ice cream and snacks, such as

Chapter 3: Competitive Foods: Policies and Practices 39
pretzels, popcorn, cookies, and snack cakes; and beverages, including spring water and juice-based drinks.
Table 3.1 Description of Food Venues Available to Students
School #1 School #2 School #3 School cafeterias Cafeteria service for reimbursable meals and a la carte
1 cafeteria, single line
2 cafeterias, food stations
1 cafeteria, 3 lines
Breakfast hours 7:00 am -8:00 am
6:50 am -7:30 am
N/A
Lunch hours 10:30 am -1:00 pm
(4 periods)
10:18 am -12:48 pm
(6 periods)
11:39 am -1:45 pm
(4 periods)
Components of reimbursable lunch offered a la carte?
Entrees yes no yes Other components yes yes yes
A la carte only availability
During breakfast no no N/A During lunch yes yes yes Outside meal periods no no no Location in cafeteria On the line
(separate register)
Separate snack window
On the line
Restrictions Purchased only with
reimbursable meal or bag
lunch
none none
Vending machines 1 7 2 Outside cafeterias Vending machines
Number available during school – – – Number available only after school – 3 6
School store
Number of stores – 1 1 Availability N/A Before classes
and during lunch Before classes
N/A = not applicable
Sources: Principal and SFA Director Surveys, and on-site observations.
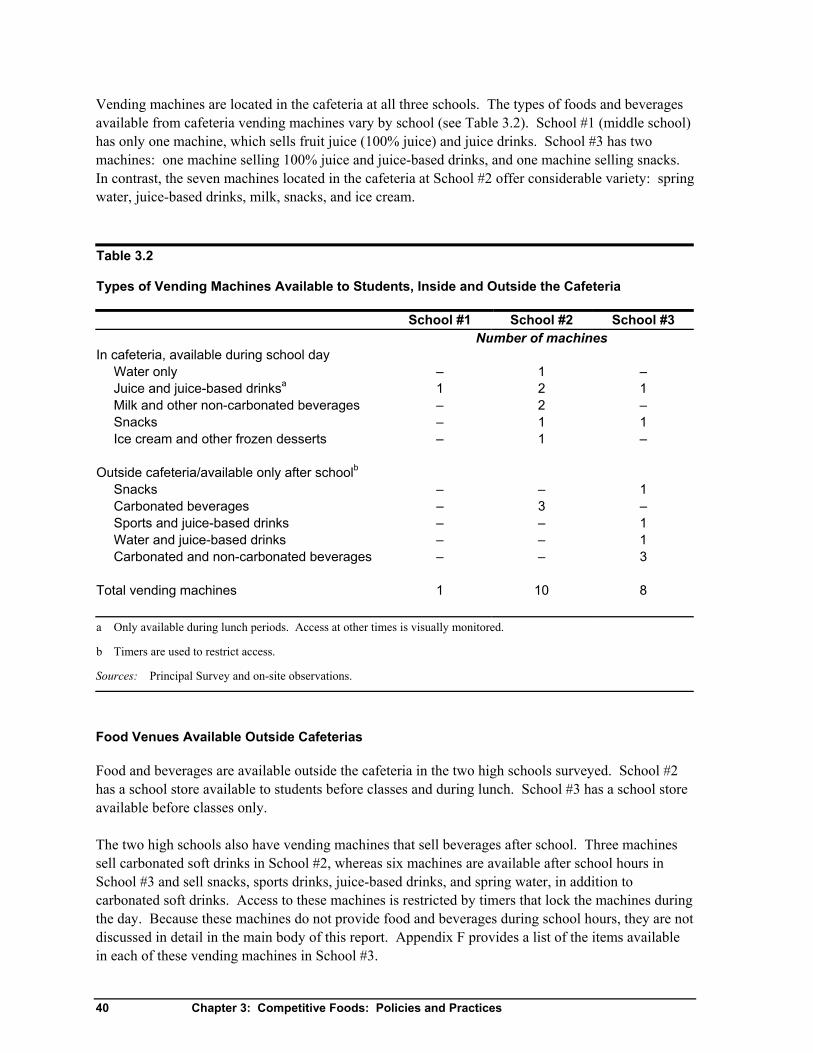
40 Chapter 3: Competitive Foods: Policies and Practices
Vending machines are located in the cafeteria at all three schools. The types of foods and beverages available from cafeteria vending machines vary by school (see Table 3.2). School #1 (middle school) has only one machine, which sells fruit juice (100% juice) and juice drinks. School #3 has two machines: one machine selling 100% juice and juice-based drinks, and one machine selling snacks. In contrast, the seven machines located in the cafeteria at School #2 offer considerable variety: spring water, juice-based drinks, milk, snacks, and ice cream. Table 3.2 Types of Vending Machines Available to Students, Inside and Outside the Cafeteria
School #1 School #2 School #3 Number of machines In cafeteria, available during school day
Water only – 1 – Juice and juice-based drinksa 1 2 1 Milk and other non-carbonated beverages – 2 – Snacks – 1 1 Ice cream and other frozen desserts – 1 –
Outside cafeteria/available only after schoolb
Snacks – – 1 Carbonated beverages – 3 – Sports and juice-based drinks – – 1 Water and juice-based drinks – – 1 Carbonated and non-carbonated beverages – – 3
Total vending machines 1 10 8
a Only available during lunch periods. Access at other times is visually monitored.
b Timers are used to restrict access.
Sources: Principal Survey and on-site observations.
Food Venues Available Outside Cafeterias
Food and beverages are available outside the cafeteria in the two high schools surveyed. School #2 has a school store available to students before classes and during lunch. School #3 has a school store available before classes only. The two high schools also have vending machines that sell beverages after school. Three machines sell carbonated soft drinks in School #2, whereas six machines are available after school hours in School #3 and sell snacks, sports drinks, juice-based drinks, and spring water, in addition to carbonated soft drinks. Access to these machines is restricted by timers that lock the machines during the day. Because these machines do not provide food and beverages during school hours, they are not discussed in detail in the main body of this report. Appendix F provides a list of the items available in each of these vending machines in School #3.

Chapter 3: Competitive Foods: Policies and Practices 41
Availability of Foods and Beverages by Time of Day
Table 3.3 shows the periods of the day when food and beverages are available from each food venue. School #1 has the least number of food venues available, and students have the least access during the day to those foods. Reimbursable meals are offered for both breakfast and lunch, and a la carte and vending machine items are available during lunch. The principal in School #1 reported that students are not allowed access to vending machine items during breakfast, or at any time outside of lunch periods. The vending machine is visually monitored by cafeteria and other school staff. Students in the two high schools have access to foods during meal times and throughout the day. At School #2, students can obtain food during breakfast time from the cafeteria reimbursable meal service, vending machines, and the school store. These same sources are available during lunch, along with a la carte service at the snack window. In addition, vending machines located in the cafeteria may be accessed throughout the school day. School #3 does not offer reimbursable breakfasts, but food is available before classes from vending machines located in the cafeteria and from the school store. Throughout the remainder of the day, School #3 looks much like School #2, with the exception that the school store does not operate during the lunch period.
Reimbursable meals
A la carte
Scho
ol #
1
Vending in cafeteria
Reimbursable meals A la carte Vending in cafeteria Vending outside cafeteria
Scho
ol #
2
School store
Reimbursable meals A la carte Vending in cafeteria Vending outside cafeteria
Scho
ol #
3
School store Source: Principal Survey.
Table 3.3 Types of Food Available to Students, by Time of Day
Before Classes
Before Lunch
During Lunch
After Lunch
After Classes

42 Chapter 3: Competitive Foods: Policies and Practices
Policies About Types of Food Available
Access to food and beverages during the school day is determined by both the times that food venues are available and also by the types of products offered for sale. As discussed in Chapter 1, USDA regulations prohibit the sale of foods of minimum nutritional value (FMNV) in school cafeterias during meal periods. State policy in Virginia (School #3) supplements federal regulations in three ways: Virginia regulations prohibit FMNVs from being sold anywhere in schools during meal periods, and in addition, prohibit the sale of iced or hot coffee or tea at all times and allow the sale of non-carbonated water anytime. There are no supplementary state policies in Massachusetts regarding competitive foods in schools. This feasibility study sought information about district and school-level policies related to competitive foods. The SFA Director Survey included questions about the use of nutrition standards for approving a la carte items; and about district policies that prohibit or require foods or beverages for sale a la carte, beyond policies specified by federal or state regulations. The Principal Survey included the same questions regarding school-level policies. Table 3.4 shows that nutrition standards are not used in any of the three schools to approve food and beverage items offered in the a la carte service, vending machines, or school stores. With respect to prohibitions and restrictions on certain food items, however, the three schools surveyed had different approaches. School #1 prohibits certain products from the a la carte service and vending machines; School #2 requires that a la carte service include certain items and permits only candy to be sold in the school store; and School #3 has no restrictions or requirements, other than the Virginia state policy. School #1 reported that coffee, tea, caffeinated beverages, soft drinks, candy, and gum are prohibited from a la carte service. During the debriefing, however, it became clear that no formal policies prohibit these foods, as was discussed in Chapter 2. In School #2 there are no foods prohibited from a la carte service or vending machines. In this school the principal reported a policy to sell only candy in the school store; it is likely that this policy is related to the logistics of stocking and displaying food in the store.1 Data from the school store, however, showed an inventory of snack items (chips), in addition to candy. In School #3 there are no foods prohibited from a la carte service or vending machines; the principal did not know whether any foods are prohibited from being sold in the school store.
1 This policy may also be in place to avoid competition between the school store and the school food service for sale of
other snack items.

Chapter 3: Competitive Foods: Policies and Practices 43
Table 3.4 School Policies Governing the Types of Competitive Foodsa
School #1 School #2 School #3 Nutrition standards applied to food items?
A la carte no no no
Vending machines no no no
School stores N/A no don’t know Foods prohibited from being sold
A la carte Coffee, tea, caffeinated beverages, carbonated soft drinks, candy, gum
none none
Vending machines Coffee, tea, caffeinated beverages, candy, gum
none none
School stores N/A Only candy is allowed
don’t know
Foods required to be sold
A la carte none Water, 100% juice, milk
none
Vending machines none none none
School stores N/A none don’t know a Respondents were asked about school policies in addition to USDA and state regulations or guidelines.
N/A = not applicable
Sources: Principal and SFA Director Surveys.
Operation and Administration of Food Venues
This study collected data about the operation and administration of competitive food venues, including information about the organization responsible for the venue, the purchasing and stocking arrangements, the use of profits, and the persons responsible for approving key aspects of operation (see Table 3.5). These issues are important for the feasibility study because they help us understand the persons within a school who have knowledge of the competitive food operations, and vested interests in those operations. As discussed in Chapter 2, the school principals had difficulty responding to the survey and future survey efforts may need to consider alternative respondents. Operation of Food Venues Available During the School Day
In all three schools, the school food service is responsible for most of the “competitive” foods and beverages available during the school day. All schools have a la carte service operated by the school food authority (SFA). The profits from a la carte sales go into a school food service general fund, and the profits are used to subsidize reimbursable meals.
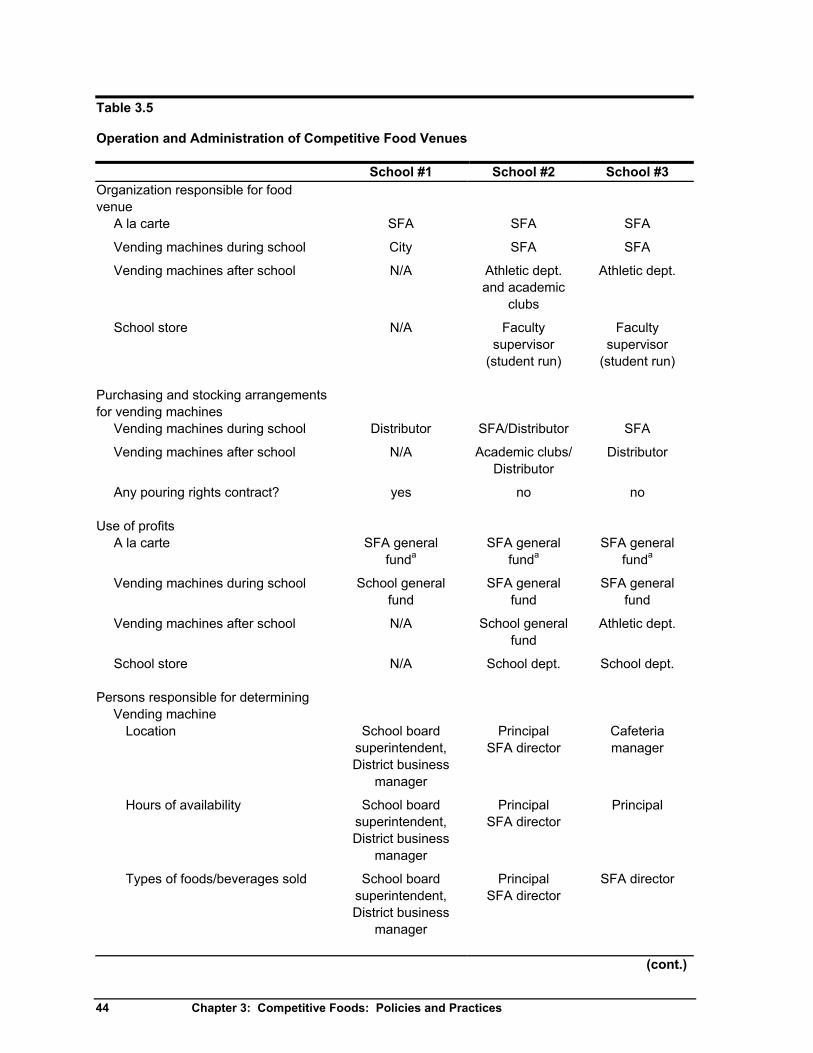
44 Chapter 3: Competitive Foods: Policies and Practices
Table 3.5 Operation and Administration of Competitive Food Venues
School #1 School #2 School #3 Organization responsible for food venue
A la carte SFA SFA SFA
Vending machines during school City SFA SFA
Vending machines after school N/A Athletic dept. and academic
clubs
Athletic dept.
School store N/A Faculty supervisor
(student run)
Faculty supervisor
(student run) Purchasing and stocking arrangements for vending machines
Vending machines during school Distributor SFA/Distributor SFA
Vending machines after school N/A Academic clubs/ Distributor
Distributor
Any pouring rights contract? yes no no Use of profits
A la carte SFA general funda
SFA general funda
SFA general funda
Vending machines during school School general fund
SFA general fund
SFA general fund
Vending machines after school N/A School general fund
Athletic dept.
School store N/A School dept. School dept. Persons responsible for determining
Vending machine Location School board
superintendent, District business
manager
Principal SFA director
Cafeteria manager
Hours of availability School board superintendent, District business
manager
Principal SFA director
Principal
Types of foods/beverages sold School board superintendent, District business
manager
Principal SFA director
SFA director
(cont.)

Chapter 3: Competitive Foods: Policies and Practices 45
Table 3.5 Operation and Administration of Competitive Food Venues
School #1 School #2 School #3 Persons responsible for determining
School store Location N/A Principal Faculty
supervisor (marketing teacher)
Hours of availability N/A Principal Faculty supervisor (marketing teacher)
Types of foods/beverages sold N/A Principal Faculty supervisor (marketing teacher)
a A la carte profits are used to subsidize USDA reimbursable meals in all three schools.
N/A = not applicable
Sources: Principal and SFA Director Surveys.
School food service also operates cafeteria vending machines at schools #2 and #3. The school food service purchases and stocks items for all cafeteria vending machines in School #3; the school food service stocks three vending machines and a local distributor stocks four machines in the cafeteria of School #2. Profits from these machines go to a general SFA fund. In School #1, SFA food operations are supplemented by a single non-SFA food venue—the single vending machine in the cafeteria. This machine is operated by the city, under a citywide exclusive beverage contract. The distributor purchases and stocks this machine and the profits from sales are added to a general school fund. The details of this contract are discussed in the next section. In schools #2 and #3, the only non-SFA food venues available during the school day are the school stores. In both schools, the stores are student-run operations managed by a faculty supervisor. The profit from school stores goes to the business education and marketing departments. Operation of Food Venues Available Outside the School Day
Schools #2 and #3 have non-SFA-operated vending machines for use after school hours. These machines are operated by the athletic department and academic clubs in School #2, and by the athletic department in School #3. The purchasing and stocking of most after-school machines is contracted out with distributors in School #2, but academic clubs stock some of the machines; in School #3, purchasing and stocking is done by distributors. The distributors operating these after-school machines include large companies such as Coca-Cola and Pepsi, and a smaller local company. Profits from these machines go to a general school fund in School #2, and to the athletic department in School #3.

46 Chapter 3: Competitive Foods: Policies and Practices
Overall Administration of Food Venues
The day-to-day operation of food venues, described above, is possible only after a responsible party authorizes the installation and operation of a particular venue. As shown in Table 3.5, decisions related to vending machine location, hours, and contents involve many people. In School #1 the school board, superintendent, district business manager, and food service director were all involved in determining the location, hours of availability, and content of the vending machine. In School #2 those decisions were made jointly by the principal and the food service director; whereas in School #3 the cafeteria manager made location decisions, the principal made decisions about hours of availability, and the food service director makes decisions about the types of food and beverages available in the machines. In contrast to vending machines, school stores appear to operate somewhat autonomously. Decisions related to school store location, hours, and contents were made by the principal in School #2, and by the faculty supervisor in School #3. Exclusive Beverage Contract
One school in our sample, School #1, has a vending machine operated under an exclusive beverage contract (a.k.a., pouring rights contract) (Table 3.6). The contract is between the Coca-Cola Company and the city; all schools and city buildings are included in the contract. The three-year contract covers all carbonated beverages, non-carbonated beverages, fruit juices, and water sold through vending machines in the school district. Revenue from vending machine sales under the exclusive beverage contract is equal to 48 percent of sales, and payment is made to the school district. Non-monetary compensation is made in the form of items awarded to the athletic department. Although this contract does not include incentives, other types of pouring rights contracts might include incentives (e.g., a lump sum payment for exceeding sales goal). The SFA director for School #1 reported that after entering into the contract the number of vending machines in the district increased, but the number of other venues selling beverages remained the same (i.e., no snack bars or concessions were added to sell the particular beverages covered under the contract). The principal at School #1 was not aware of the beverage contract.

Chapter 3: Competitive Foods: Policies and Practices 47
Table 3.6 Characteristics of Exclusive Beverage Contract at School #1 Beverage company: Coca Cola Other participants in contract: Elementary schools
Middle schools High schools Other city buildings
Contracting agent: City Terms of contract:
Time period 3 years
Beveragesa Carbonated beverages Non-carbonated beverages Fruit juices Water
Payments: Percent of sales paid to school district 48% Non-monetary payments Athletic equipment Fixed annual commission N/A
Incentives: Payment for exceeding sales target N/A Payment for each machine placed N/A
Impact of beverage contract on school district:
Did number of vending machines increase? yes
Did number of other venues selling beverages increase?
no
a These beverages are covered by the city contract; carbonated beverages, however, are not supplied to middle school vending machines.
N/A = not applicable
Source: SFA Director Survey.
SFA Pricing Strategies for Competitive Foods
As noted above, most foods and beverages available to students during the school day are operated by the SFA. As a result, SFAs may influence the food and beverage choices of students through the choice of items they offer for sale, and also through pricing strategies. The SFA Director Survey included questions about overall strategies for pricing a la carte items, and strategies for pricing a la carte items relative to reimbursable meals. SFA directors were also asked about pricing strategies for vending machine items. Responses are shown in Table 3.7.
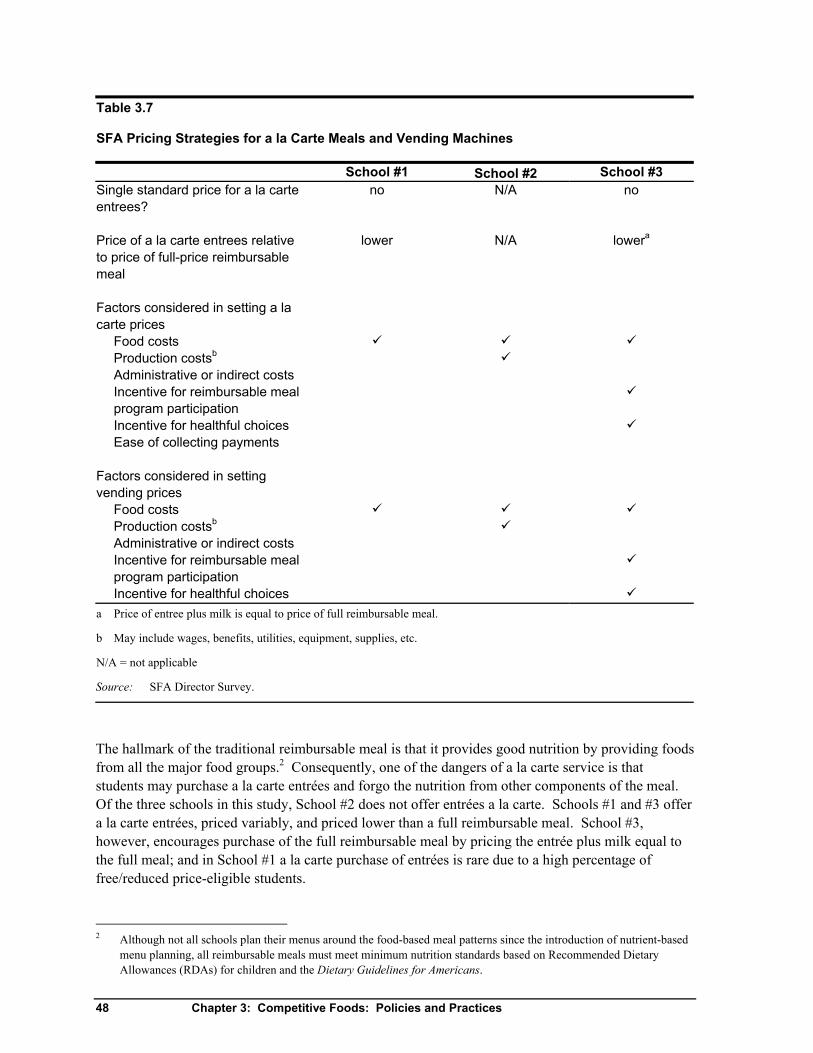
48 Chapter 3: Competitive Foods: Policies and Practices
Table 3.7 SFA Pricing Strategies for a la Carte Meals and Vending Machines School #1 School #2 School #3 Single standard price for a la carte entrees?
no N/A no
Price of a la carte entrees relative to price of full-price reimbursable meal
lower N/A lowera
Factors considered in setting a la carte prices
Food costs Production costsb Administrative or indirect costs Incentive for reimbursable meal program participation
Incentive for healthful choices Ease of collecting payments
Factors considered in setting vending prices
Food costs Production costsb Administrative or indirect costs Incentive for reimbursable meal program participation
Incentive for healthful choices a Price of entree plus milk is equal to price of full reimbursable meal.
b May include wages, benefits, utilities, equipment, supplies, etc.
N/A = not applicable
Source: SFA Director Survey.
The hallmark of the traditional reimbursable meal is that it provides good nutrition by providing foods from all the major food groups.2 Consequently, one of the dangers of a la carte service is that students may purchase a la carte entrées and forgo the nutrition from other components of the meal. Of the three schools in this study, School #2 does not offer entrées a la carte. Schools #1 and #3 offer a la carte entrées, priced variably, and priced lower than a full reimbursable meal. School #3, however, encourages purchase of the full reimbursable meal by pricing the entrée plus milk equal to the full meal; and in School #1 a la carte purchase of entrées is rare due to a high percentage of free/reduced price-eligible students.
2 Although not all schools plan their menus around the food-based meal patterns since the introduction of nutrient-based
menu planning, all reimbursable meals must meet minimum nutrition standards based on Recommended Dietary Allowances (RDAs) for children and the Dietary Guidelines for Americans.

Chapter 3: Competitive Foods: Policies and Practices 49
Pricing strategies may be applied to other a la carte items, in addition to entrées, and to vending machine items. Among all the factors that could be used as the basis for pricing, however, only food costs are considered when setting a la carte and vending prices in School #1. School #2 considers both food and production costs in setting prices for a la carte and vended items. School #3 considers food costs, incentives for participation in USDA reimbursable meals, and incentives for healthy choices. Notably, responses about pricing factors differed across the three districts, but were exactly the same for a la carte and vended items within districts. An example of a Virginia incentive for choosing healthful food options is their pricing of a la carte french fries. Students can only purchase extra french fries after they have purchased a complete reimbursable meal, and the extra fries must then be purchased with another entrée. The price of a la carte fries is set at the price of a reimbursable meal. This pricing policy is set in order to encourage healthier eating along with the french fries; this policy, however, may be unintentionally encouraging students to overeat, or may lead to more plate waste. Other Sources of Food
In addition to foods sold a la carte, in vending machines, and at school stores, there may be other sources of food sold to or provided for students (see Table 3.8). For example, it seems likely that parents might provide treats for birthdays or other special occasions in some schools. In our survey of three principals, each principal reported that parents and teachers are not permitted to offer students food or beverages in the classroom. The debriefing discussions revealed, however, that at least two principals misinterpreted the question; teachers have discretion to serve food in the classroom (such as pizza parties), and parents and students may bring in food for special occasions. In addition, bringing food into the classroom may be more common in elementary or middle schools, and therefore may not be captured by the sample of middle and high schools in this study. Another source of food may be fundraisers in the schools. All three schools report that foods are allowed for fundraising and that there are no restrictions on the types of foods used for fundraising. In all three schools, student clubs and service organizations use food for fundraising. Candy and baked goods are used in fundraisers in schools #1 and #2, and candy and other purchased baked goods, such as doughnuts and muffins, are used in fundraisers in School #3. The reported frequency of fundraisers varied quite a lot between the three sampled schools. In School #1, fundraisers are never conducted during breakfast periods and rarely during lunch periods (less than once per month). Compared with School #1, fundraisers are reported as more frequent in both high schools. In School #2 fundraisers are held one or two times per month during breakfast and during lunch. In School #3 fundraisers are held one or two times per week in the morning, before classes.

50 Chapter 3: Competitive Foods: Policies and Practices
Table 3.8 Other Foods During the School Day: Availability and School Policies
School #1 School #2 School #3 Foods in the classroom
Parents/Teachers permitted to offer students food/beverages in classroom?
no no no
Foods used for fundraisers
Does school allow foods to be used for fundraising?
yes yes yes
Any restrictions on types of foods used for fundraising?
no no no
Organizations using food for fundraising
Student clubs/ Service
organizations
Student clubs/ Service
organizations, music or art dept.,
parent-teacher organizations
Student clubs/ Service
organizations
Types of foods Baked goods, candy
Baked goods, candy
Candy, purchased donuts, bagels,
muffins
Frequency of food fundraisers
During breakfast/Before classes
never 1 or 2 times per month
1 or 2 times per week
During lunch less than once per month
1 or 2 times per month
never
Source: Principal Survey.
Off-Campus Eating Establishments
Off-campus eating establishments are a potential source of food and beverages for some school students. The opportunity for students to eat off-campus is affected by school policy and the presence of off-campus eating establishments. In all three schools principals reported that students cannot leave campus during lunch or free periods. Students may still access off-campus eating establishments before or after school, however, and some students are likely to leave campus and access these establishments despite school policy. Table 3.9 shows the number of off-campus eating establishments within walking distance and within driving distance of each school. School #1 is within walking distance of one restaurant and two convenience stores. School #1 did not report the number of stores within driving distance because students are not of driving age. At School #2 many fast food restaurants, other restaurants, and convenience stores are located both within walking and driving distance. The principal in School #3 reported two fast food restaurants, three other restaurants, and two food markets are within walking

Chapter 3: Competitive Foods: Policies and Practices 51
distance of the school. There are more than 12 off-campus eating establishments within driving distance of the school, with over three fast food restaurants, over three other restaurants, five food markets, and one food court. Table 3.9 Off-Campus Eating Establishments: Availability and School Policies School #1 School #2 School #3
Number of establishments Within walking distance
Fast food restaurants — many 2 Other restaurants, cafeterias, diners
1 many 3
Food markets, grocery, or convenience stores
2 many 2
Lunch wagons or push carts — — — Food courts — — — Other — — —
Within driving distance, beyond walking distance
N/Aa
Fast food restaurants many 3 or more Other restaurants, cafeterias, diners
many 3 or more
Food markets, grocery, or convenience stores
many 5
Lunch wagons or push carts — — Food courts — 1 Other — —
Are students allowed to leave school campus
During lunch period no no no During free periods N/Ab no no
a Students are not of driving age.
b Students do not have free periods.
N/A = not applicable
— = zero
Nutrition Initiatives
Principals were asked to indicate whether their school was implementing any of the school food environment initiatives shown in Table 3.10. Principals in schools #1 and #2 reported that promotional activities are conducted to encourage healthful food choices among students. The principal in School #3 encourages teachers and parent groups to raise funds by selling non-food items, although, as noted above, fundraisers selling food are still allowed. All three schools appear to

52 Chapter 3: Competitive Foods: Policies and Practices
make an effort to either avoid advertising of less nutritious foods and beverages or, at least, not market them more highly than reimbursable school meals. Table 3.10 Nutrition Initiatives Implemented by the Schools
School #1 School #2 School #3 School has a health or nutrition advisory council made up of school staff, students, and parents that provides input about types of foods available
School food service staff participate in making decisions and policies that affect types of foods available outside of school meal programs
School groups are encouraged to raise funds by selling non-food items.
Food is not used by teachers or other school staff as a reward or punishment (e.g., withholding snacks for misbehavior) for students
Parents are encouraged to provide healthful food choices for bag lunches brought from home
School has nutrition criteria for foods and beverages offered at parties, celebrations, and social events held after school or on weekends.
Foods and beverages sold outside the school meal program are not more highly marketed than reimbursable school meals.
School conducts promotional activities to encourage healthful food choices, and does not permit advertising of less nutritious foods and beverages.
School bans soda, other soft drinks, or sweetened fruit beverages (less than 100% juice) that may be sold to students in school or on school grounds.
Source: Principal Survey.
Two of the three principals reported that food is not used by teachers or other school staff to reward or punish students. During debriefing discussions, however, it was learned that teachers do use candy, pizza, and other foods to reward students in both schools. None of the schools has a health or nutrition advisory council, and only one principal reported that the school food service is involved in decision-making about the types of foods sold outside the school meal programs. (Presumably, the principals interpreted this as foods sold in venues not operated by the SFA.)

Chapter 3: Competitive Foods: Policies and Practices 53
The state CN directors were also asked about Massachusetts’ and Virginia’s involvement in state and local initiatives to promote a healthy environment in schools. Both states have held meetings to communicate the goals of Action for Healthy Kids to SFA directors. Massachusetts has also been conducting regional training sessions using Changing the Scene materials. SFA directors, superintendents, and principals are invited and must agree to attend as a team. Virginia has recently developed monthly health and nutrition-related activities for schools that will be disseminated soon. Although principals were not asked directly about these initiatives, they did not indicate their involvement in the open-ended response option provided on the survey. Summary
Information collected about the school food environments shows that, in the three schools surveyed, the school food service is responsible for most food offered to students outside of the reimbursable meal service. SFAs operate a la carte service, snack bars, and vending machines in school cafeterias. Aside from school food service operations, food and beverages are available on a limited basis during the school day—in school stores with restricted hours, and from fundraising activities that are held on an ad hoc basis. Unfortunately, although SFAs are in charge of most competitive food offered to students, they have not used nutrition standards to evaluate the foods offered and thereby ensure the availability of healthful food options. In addition, only one of the three SFAs reported use of pricing strategies to encourage healthful choices. Information presented in Chapter 4 and the appendices confirms the availability of many high-calorie, high-fat snack options from school food service operations. In debriefings with school food service staff, they discussed the need to sell items that students will buy—both to satisfy their customers and to generate revenue to subsidize the reimbursable meal program. The need to generate revenue through competitive food sales is less important in schools serving a high percentage of free and reduced-price meals. The information provided in this chapter also shows that the middle school differs from high schools in many important ways. There are fewer food venues at the middle school, and food and beverages are not available outside of meal periods.

Chapter 4: Competitive Foods: Nutritional Characteristics 55
Chapter 4 Competitive Foods in the School Environment: Nutritional Characteristics
This chapter provides a description of the food and nutrient composition of competitive foods offered to and selected by students during the school day in the three sample schools. The data for these analyses were obtained from a survey of cafeteria foods (the Cafeteria Survey) and inventories of other sources of competitive food (vending machines, school stores, etc.). The instruments and an assessment of their success were discussed in Chapter 2. Cafeteria managers, other school food service staff, school store supervisors, and a vending distributor provided detailed information about all foods and beverages available to students. The information included:
• Manufacturer, brand, and name of each item; • Package size or serving size; and • Numbers of each item sold during the target week.
Competitive foods from all sources available during the school day were included. The analysis of a la carte service was limited to food and beverages served only on an a la carte basis and not in reimbursable meals.1 The approach to analysis and reporting of nutritional characteristics was twofold. First, data were combined across the three schools and the various venues offering competitive food items. This provides an overall picture of the average food and nutrient composition of all competitive foods offered in the school environment during the school day (in the three sample schools). Second, separate analyses were conducted for the items available within the cafeteria and outside the cafeteria. This grouping was used because USDA has the ability to regulate foods available in the cafeteria during meal periods. Nutrient analyses for this study are fundamentally different from prior studies of school foods. Prior studies analyzed the nutrient content of reimbursable meals, presenting information about mean nutrient composition relative to USDA standards for school meals. The standards for school lunch are the same as national recommendations for healthful eating applied to a full-day diet, divided by three. Unlike school menu analyses, no similar standards for individual foods exist. It was therefore important to examine several dimensions of the nutritional composition of competitive foods, and to select reasonable, available benchmarks to facilitate interpretation of the findings. The nutritional characteristics of competitive foods assessed for this study include:
1 There were several reasons for this approach. First the issues involved in analyzing reimbursable meal items have
already been identified, and data on their nutritional characteristics are available from prior studies (e.g., SNDA-I and SNDA-II). Second, to reduce burden, cafeteria staff were not asked to report servings data separately for foods offered both in reimbursable meals and a la carte. Sales data for these items, therefore, were not available. Finally, data processing and nutrient analysis of all foods was not a requirement for the feasibility study, due to the brief period of the project.

56 Chapter 4: Competitive Foods: Nutritional Characteristics
• Mean amounts of food energy (calories) and macronutrients: total fat, saturated fat, carbohydrate, protein, sodium, and dietary fiber;
• Mean percentages of calories from total fat and saturated fat;
• Mean amounts of micronutrients: vitamin A, vitamin C, thiamin, riboflavin, niacin, vitamin B6, calcium, and iron;
• Mean numbers of Food Guide Pyramid servings: grains, vegetables, fruit, dairy, and meat; and
• Mean amounts of discretionary fat and added sugars. The average nutrient content of competitive foods was also analyzed relative to criteria used for product labeling, as specified in the U.S. Food and Drug Administration’s Food Labeling Guide. The criteria used were applied to each item to determine whether it could be classified as “free” or “low” in calories, total fat, saturated fat, cholesterol, and sodium. In addition, each competitive food item was evaluated to determine if the item fits the definition of a food of minimum nutrition value (FMNV). The average nutritional characteristics are shown for broadly defined groups of foods (e.g., beverages, baked goods/desserts, snacks), and for subgroups (e.g., 100% fruit juice, cookies, chips). Separate tables present unweighted data (each competitive food item weighted equally) and weighted data (items weighted by servings or sales, within school, with schools weighted equally). These tables have been placed at the end of the text to make the chapter easier to navigate. To help interpret the nutrient data presented in the tables, findings are discussed relative to the contribution competitive foods make to Daily Values (DVs). DVs are the dietary reference values FDA has adopted for use on food labels, to assist consumers in planning a healthful diet.2 The DVs for nutrients, as well as Food Guide Pyramid servings recommendations, are included at the beginning of the corresponding sections in this chapter. The chapter begins with a discussion of the number and types of competitive foods offered to students in each of the three schools, and the top selling items in each school. The remaining sections of the chapter discuss various aspects of the nutritional composition of the competitive foods offered and sold to students, and their relative contribution to reference values. Appendix E provides detailed tables of the nutritional characteristics of all competitive food items available during the school day, by school and source. Foods Offered and Sold
Table 4.1 provides a review of the sources, locations, and time periods competitive foods are available to students during the school day. All three schools offer a la carte-only and vended foods and beverages in the cafeteria during lunch. Schools #2 and #3 also offer food and beverages outside the lunch period (vending machines), and outside the cafeteria in school stores. Competitive foods are not available outside the cafeteria or outside the lunch period in School #1. 2 DVs comprise two sets of reference values: Daily Reference Values (DRVs), for macronutrients, and Reference Daily
Intakes (RDIs) for vitamins and minerals (USFDA, 1993).

Chapter 4: Competitive Foods: Nutritional Characteristics 57
Table 4.1 Sources of Competitive Foods Available to Students During the School Day
School #1 School #2 School #3 During
Lunch Outside Lunch
During Lunch
Outside Lunch
During Lunch
Outside Lunch
In cafeteria A la carte only Snack bar Vending machine (food
service)
Vending machine (outside contract)
Outside cafeteria School store Sources: Principal and SFA Director Surveys.
Number and Types of Foods Offered
Data on the number and types of competitive food and beverage items offered show the amount of choice available to students when selecting a snack, meal alternative, or beverage at school. As shown in Table 4.2, the total number of food and beverage items available in cafeterias varies considerably by school. As expected, fewer competitive foods are available at the middle school (School #1) than the high schools. Of the 23 items offered at School #1, about half are fruit juice and juice-based drinks available in the vending machine. The a la carte service at this school also offers juice-based drinks, plus a sports drink and spring water. A la carte food items include several types of baked goods, chips, and a cereal bar. School #2 offers the largest number of items (118) overall, with approximately equal proportions available in vending machines and at the a la carte snack window. Beverages, mainly juice, juice-based drinks and flavored milk, comprise one third of all items. A wide variety of baked goods, frozen desserts, and snacks are offered, with especially large selections of chips (18 items) and ice cream novelties (18 items). Two types of salad are also available, with a choice of dressing (including one low-fat dressing). Beverages are more likely to be found in vending machines in School #2, whereas the largest selection of snacks and baked goods are sold at the a la carte snack window. Forty-three competitive food items are available in the cafeteria at School #3—only a third as many available at School #2. Note also that in School #3 some of the same items offered a la carte are stocked in the vending machines. The number of unique items available to students is therefore somewhat fewer than the totals shown in Table 4.2. The largest selection of items in School #3 was observed among the frozen desserts, which are only sold on the a la carte line. School #3 also offers baked goods, fruit juice and juice-based drinks, and snacks such as chips and popcorn.

58 C
hapter 4: Com
petitive Foods: Nutritional C
haracteristics
Table 4.2 Numbers of Competitive Foods Available in the Cafeteria During the School Day, Overall and by Source
School #1 School #2 School #3
Category/Food Total A la Carte Vending Machine Total
Snack Bar
Vending Machine Total A la Carte
Vending Machine
All items 23 18 15 118 58 60 43 27 16 Baked goods/Dessert 5 5 13 10 3 7 4 3 Cookies 1 1 8 6 1 1 1 — Doughnuts 2 2 — — — — — — Pastries (danish, toaster pastries, pies) 1 1 2 — 2 2 1 1 Snack cakes 1 1 3 3 — 4 2 2 Beverages 11 6 5 39 7 32 13 7 6 Fruit juice, 100% 2 — 2 4 — 4 1 — 1 Iced tea drinks, fortified — — — 2 — 2 — — — Juice-based drinks, 11.5-12 oz 3 — 3 — — 10 — — — Juice-based drinks, 16-20 oz 3 3 — 3 — 3 — — — Juice-based drinks, fortified, 11.5-12 oz — — — 14 4 — 10 5 5 Juice-based drinks, fortified, 16-20 oz 1 1 — — — — 1 1 — Milk, flavored, skim or 1% fat, fortified — — — 2 — 2 — — — Milk, flavored, whole or 2% fat, fortified — — — 9 2 7 — — — Milk, whole — — — 1 — 1 — — — Sports drinks 1 1 — — — — — — — Spring water 1 1 — 2 1 1 1 1 — Yogurt drinks — — — 2 — 2 — — — Bread or grain products 1 1 14 10 4 1 1 Cereal bars/Cereal mixes 1 1 1 1 — — — Crackers/Cracker sandwiches — — 6 4 2 — — Granola bars — — 5 4 1 — — Pretzels — — 1 — 1 1 1 Rice or corn cakes — — 1 1 — — — (cont.)

C
hapter 4: Com
petitive Foods: Nutritional C
haracteristics 59
Table 4.2 Numbers of Competitive Foods Available in the Cafeteria During the School Day, Overall and by Source
School #1 School #2 School #3
Category/Food Total A la Carte Vending Machine Total
Snack Bar
Vending Machine Total A la Carte
Vending Machine
Frozen desserts 22 9 13 11 11 Ice cream 18 8 10 10 10 Non-dairy frozen desserts 4 1 3 1 1 Salads 2 2 Side saladsa 2 2 Snacks 6 6 28 20 8 11 4 7 Chips 5 5 18 11 7 7 2 5 Fruit roll-ups/Fruit snacks — — 5 5 — — — — Chips, baked or reduced fat 1 1 4 3 1 — — — Popcorn — — 1 1 — 4 2 2 a Six varieties of salad dressing are offered with the salads.
Sources: Cafeteria Survey and Inventories of Snack Bar and Vending Machine Items.

60 Chapter 4: Competitive Foods: Nutritional Characteristics
In School #3, a larger variety of items is available a la carte than in the vending machines. Based on the inventory and validation data, it was also observed that six of the slots in the vending machine were never filled during the target week. It was not clear if this was typical or related to decreased ordering that week because of the proximity of data collection to the end of the school year. Students have the option of selecting food and beverages generally considered healthful at all three schools. Spring water and 100% fruit juice are available at all three schools, and Schools #1 and #2 offer baked or reduced-fat chips. School #2 offers skim or 1% fat milk as an alternative to higher fat options. Other potentially more healthful snack options available at Schools #2 and #3 include pretzels, rice cakes, and frozen 100% fruit juice bars. Table 4.3 shows the number of competitive food items available outside the cafeteria. Food and beverages are only available outside the cafeteria at the two high schools, in their school stores. The available data suggest that both school stores carry a similar number of items (about 40), but the mix of selections differs.3 The vast majority of foods available in the store at School #2 are candy items (88 percent). Beef jerky and chips are also sold; beverages and gum are not available. In contrast, the store at School #3 offers toaster pastries, cereal bars, sandwich crackers, juice drinks, and water, in addition to candy, gum, and chips. According to the store manager at School #3, because the school does not have a breakfast program and the store is open before school, some students purchase their breakfast from this food venue. Foods Most Commonly Sold
Servings data from the Cafeteria Survey and inventories of competitive foods were used to identify the types and numbers of items actually purchased by students during the target week. These data were not available for all foods, for example, neither the SFA director nor study staff could obtain information on the number of beverages sold from the vending machine in School #1 during the target week. Table 4.4 shows the number and percentage of items for which sales data were available overall, and for each school. It is important to recognize the extent of missing data, especially for School #1, when interpreting findings for the types of foods purchased by students and their nutrient composition. Tables 4.5 and 4.6 present the five top selling foods and beverages at each school, both inside and outside the cafeteria. Interestingly, despite differences between schools in the number and variety of choices available in the cafeterias, there are some striking similarities with regard to the foods and beverages sold most frequently. Fruit punch, the top seller at the middle school, is also among the five top-selling items at the two high schools. The other most commonly purchased beverage is spring water, the second highest seller at both high schools. Chips, especially Doritos, were among the most popular items sold in Schools #1 and #2, and chocolate chip cookies were purchased frequently at both School #1 and School #3.
3 Note that data from School #2 were incomplete. The validation data collection revealed that the school store at School
#2 offered a total of 59 items. In addition to the types of foods shown in Table 4.3, granola bars and cookies were also available for sale.

Chapter 4: Competitive Foods: Nutritional Characteristics 61
Table 4.3 Numbers of Competitive Foods Available Outside the Cafeteria During the School Day Category/Food School #1 School #2 School #3 All items 41 39 Baked goods/Dessert 2 Pastries (danish, toaster pastries, pies) 2 Beverages 3 Juice-based drinks, 16-20 fl oz 2 Spring water 1 Bread or grain products 5 Cereal bars/Cereal mixes 4 Crackers/Cracker sandwiches 1 Candy 36 22 Candy with chocolate 6 3 Candy with chocolate, single piece or pop 2 1 Candy without chocolate 11 3 Candy without chocolate, single piece or pop 17 2 Chewing gum — 13 Snacks 5 7 Chips 4 6 Meat snacks (jerky) 1 1
Source: Inventory of School Store Food and Beverage Items.
Table 4.4 Competitive Food Sales During the School Day
During Target Week
School Number of Products Percent of Items with
Sales Data Number of Items
Sold School #1 23 57% 1,102 School #2 159 91 12,232 School #3 82 96 4,257 Total 264 89% 17,591

62 Chapter 4: Competitive Foods: Nutritional Characteristics
Table 4.5 Top Five Selling Competitive Food Items Available Inside the Cafeteriaa
School Source Food Category Product Package
Size Number
Soldb School #1 A la carte Beverages Snapple fruit punch 20 fl oz 216 A la carte Snacks Doritos Cool Ranch 1.75 oz 122 A la carte Snacks Cheetos Curls 1.75 oz 122 A la carte Snacks Doritos Nacho 1.75 oz 122 A la carte Baked goods/Dessert Grandma's chocolate chip cookies 2.75 oz 120 School #2 Snack bar Bread or grain
products Goldfish crackers, cheddar 1.5 oz 585
Vending Beverages Spring water 16 fl oz 373 Snack bar Snacks Doritos Cool Ranch 1.75 oz 368 Snack bar Snacks Lays Classic potato chips 1.75 oz 305 Vending Beverages Veryfine fruit punch 11.5 oz 254 School #3 A la carte Baked goods/Dessert Chocolate chip cookie (school-
baked) 2.5 oz 1,526
A la carte Beverages Spring water 16.9 fl oz 811 Vending Beverages Veryfine fruit punch 11.5 fl oz 108
A la carte Frozen desserts Chocolate chip ice cream sandwich 4.5 oz 79
A la carte Frozen desserts Snickers ice cream bar 2.0 oz 72 a Sales data were not available for vended beverages in School #1.
b Total for target week.
Sources: Cafeteria Survey and Inventories of Snack Bar and Vending Machine Items.
Table 4.6 Top Five Selling Competitive Food Items Available Outside the Cafeteria
School Source Food Category Product Package
Size Number
Solda School #2 School store Candy Neon laser straw .11 oz 1,200 School store Snacks Slim Jim .33 oz 600 School store Candy Jolly Rancher pop 1 pop 300 School store Candy Charms sweet and sour pop 1 pop 240 School store Candy Charms fluffy cotton candy pop 1 pop 240 School #3 School store Beverages Hawaiian Punch Juicy Red 20 fl oz 88 School store Candy Air Heads watermelon 0.55 oz 74 School store Candy Winterfresh gum 5 sticks 61 School store Beverages Hawaiian Punch Green Berry 20 fl oz 55 School store Beverages DejaBlue purified water 20 fl oz 49 a Total for target week. Data for School #2 were taken from invoices for previous week’s order.
Source: Inventory of School Store Food and Beverage Items.
Chapter 4: Competitive Foods: Nutritional Characteristics 63
There are also some differences in the items sold at the sample schools. The most commonly purchased item at School #2 was goldfish crackers, which are not offered at either of the other two schools. In addition, although both high schools offer ice cream novelties, they appear to be top sellers only in School #3. At School #3 the top-selling item overall (chocolate chip cookies) is almost twice as likely to be purchased as the top-selling beverage (spring water), and nine times as likely to be purchased as the next most popular food (ice cream cookie sandwich). Students clearly have a strong preference for the chocolate chip cookies at School #3, which are served warm. Finally, although some food and beverage items generally considered healthful are available in the cafeterias at all three schools (e.g., 100% fruit juice, lower fat snack chips, skim or 1% fat milk), they are not among the items students are most likely to purchase. Outside the cafeteria, in the school store, students at School #2 are buying candy—especially the single piece or lollipop types (see Table 4.6).4 The other top-selling competitive food item in School #2 is beef jerky. Most likely, students buy more than one of these items; but this could not be confirmed, because sales cannot be tracked for individual students. The top-selling items at the school store in School #3 include fruit punch, candy (not chocolate), gum, and bottled water. Sales of fruit punch may have been higher than usual during the data collection week. The store supervisor reported that the school was participating in a contest that would award $3,000 to the school store that sold the most Hawaiian Punch during the month. The price of the punch had been lowered to $0.75 to encourage sales. Nutrient Composition of Competitive Foods
The food energy, macronutrient, and micronutrient composition of competitive foods available during the school day are presented in this section. Mean nutrient values for all foods as offered are discussed first, followed by the nutrient composition of foods as served. All nutrient values are reported on a per-package basis. To determine nutrients as served (or selected), the average nutrient content of items in each school was weighted, using available data on actual sales to students; each school’s data were then weighted equally in combining results across schools. As shown in Table 4.4, sales data were missing for about 40 percent of the competitive items offered in School #1. It was not possible to impute values for these items (fruit juice and juice-based drinks); rather than drop the school from the analysis altogether, however, results are tabulated using the data available. The weighted data are therefore biased by the exclusion of vended beverages at School #1. The potential impact on findings would be an underestimate of the weighted mean amounts of nutrients such as vitamins A and C, and an overestimate of calcium, fat, and sodium. Tables 4.7 through 4.13 present results of unweighted analyses, and Tables 4.14 through 4.16 show weighted results.
4 One reason some items sell is low cost. The range of prices is greater for items available outside versus inside the
cafeteria.

64 Chapter 4: Competitive Foods: Nutritional Characteristics
Food Energy and Macronutrients
Competitive foods were analyzed for food energy (calorie) and seven macronutrients (Tables 4.7 and 4.14). The text discussion, however, is limited to calories, total fat, saturated fat, and sodium. These dietary components are most likely to contribute to problems with overweight or obesity, or have been shown to be problematic in children’s diets.5 The DRVs for the macronutrients analyzed for this study are shown below.
• Total fat: 65 g • Saturated fat: 20 g • Carbohydrate: 300 mg • Protein: 50 g • Cholesterol: 300 mg • Sodium: 2,400 mg • Dietary fiber: 25 g
The 1989 REAs for children age 7 to 18 are used as a point of reference when discussing the food energy content of competitive foods.6 All Food Available During School Day Food energy. The mean food energy, or caloric content, of competitive foods overall ranges from zero (spring water) to just over 400 calories. Foods in the 400-calorie range include snack cakes and whole or 2% fat flavored milk (14- to 16-ounce size). One serving of these items provides as much as 20 percent of the average food energy allowance (1989 REA) for children age 7 to 10, and from 13 to 18 percent of REA for boys and girls age 11 to 18. As a group, baked goods and desserts are highest in calories (mean of 363 calories) among all competitive foods available during the school day. Their average caloric content exceeds that of other snacks and beverages by more than 130 calories (60 percent). Candy and gum, on average, are lowest in calories (mean of 142 calories or 5 to 7 percent of REA). This can be attributed in part to the relatively low fat content of candy items without chocolate, and the small size of many of the items sold. The relative ranking of the mean caloric contribution of baked goods/desserts and candy/gum remains the same when weighted by student selections. Changes in the average caloric content as a result of the weighted analysis were not nutritionally significant, amounting to only 2 percent or less of REA. Total fat and saturated fat. Not surprisingly, baked goods/desserts also contain the most total fat (16 g, on average) and a substantial amount of saturated fat (mean of 4 g). This group of competitive food items provides about one fourth of the DRV for fat and one fifth the DRV for saturated fat. Snacks and salad with dressing also contribute substantial amounts of total fat (mean of 13 g for both
5 Prior studies of schoolchildren’s dietary intake have found they consume in excess of the Dietary Guidelines
recommendations for fat and saturated fat, and more than the National Research Council’s recommendation for sodium (Gleason and Suitor, 2001). They also show that a substantial number of children consume large amounts of soda and juice-based drinks high in added sugar. At the same time, many children fail to consume enough fruit and vegetables, and low intakes of some vitamins and minerals are a particular concern for teenage girls.
6 Average energy requirements for children age 7 to 10 are 2,000 calories; for children age 11 to 18 the range is from 2,200 to 3,000 calories per day (NRC, 1989).

Chapter 4: Competitive Foods: Nutritional Characteristics 65
groups, or 20 percent of DRV), and frozen desserts offer the most saturated fat (5.5 g, or 28 percent of DRV, on average). Alternatively, beverages and candy/gum offer the least fat, with both groups providing no more than 5 percent of the DRV for either total fat or saturated fat. There was little change in the mean fat or saturated fat content (or percent of DRV) of competitive foods when examined as selected, for any of the major food categories. The largest difference was a drop in the average saturated fat for beverages of 6.5 percent DRV. This is consistent with the finding that fruit punch was one of the top-selling items in all three schools, whereas milk was not among the items most commonly purchased. Percent of calories from fat and saturated fat. When measured relative to caloric content, the fat and saturated fat composition of competitive foods look similar to mean amounts. Compared to other food groups, salads with dressing have the largest share of calories from total fat (77 percent), and frozen desserts contain the greatest percentage of calories from saturated fat (24 percent). Beverages, as a group, derive the smallest percentages of calories both from total and saturated fat (6 percent and 3.5 percent, respectively).7 This is representative of results of analyses of the percentage of calories from fat and saturated in competitive foods both as offered and as selected. Tables 4.8 and 4.9 show, for each school, the number and percentage of competitive food items with 30 percent or less of calories from total fat and less than 10 percent of calories from saturated fat. These benchmarks are the same as the Dietary Guidelines-based standards for the maximum percent of calories from fat in saturated fat in school meals. Although not typically applied to foods, they offer one way of identifying items that might enhance or detract from achieving total daily intakes consistent with the Dietary Guidelines. Among the competitive foods offered in the cafeteria, beverages were most likely to meet the total fat and saturated fat benchmarks at all three schools (72 to 100 percent of beverage items). The beverages with more than 30 percent of calories from fat and 10 percent or more of calories from saturated fat include flavored and whole milk, which were offered only in School #2. None of the snacks or baked goods available at Schools #1 and #3, and only a small share at School #2, contains 30 percent or fewer calories from total fat. More snacks and baked goods offered meet the less-than-10 percent cutoff for saturated fat, but this varies by school. Frozen desserts available at Schools #2 and #3 are least likely to contain either 30 percent or fewer calories from total fat or less than 10 percent of calories from saturated fat. Outside the cafeteria, almost all of the baked goods, beverages, and bread/grain products meet the total fat and saturated fat benchmarks. These items are small in number and are offered only at School #3. In addition, a large share of the candy (including gum) selections available at both School #2 and School #3 offer 30 percent or fewer calories from total fat and less than 10 percent of calories from saturated fat. Sodium. The mean amount of sodium in competitive foods ranges from a low of 2 mg for chewing gum to 729 mg for pretzels (approximately 30 percent of DRV for sodium) (see Tables 4.7 and 4.14). Salad with dressing has the highest average sodium content (364 mg), followed by snacks (312 mg) and bread/grain products (296 mg). One serving from these food groups provides from 12 to 15 7 Results for beverages are somewhat misleading, because the fat contents of milk and other, non-dairy beverages, are so
different.

66 Chapter 4: Competitive Foods: Nutritional Characteristics
percent of the sodium DRV. Candy and gum combined contain only 28 mg sodium, on average. Frozen desserts and beverages also provide relatively small amounts of sodium (means of 58 and 100 mg, respectively, which are less than 5 percent of DRV). There are only minor shifts in the relative ranking of competitive foods when the analysis of the amount of sodium is weighted by student selections. For example, bread/grain products are second to salads in mean sodium content (380 mg and 406 mg, respectively) instead of snacks (279 mg). Food Inside the Cafeteria Food energy. The food energy and macronutrient composition of competitive foods available in school cafeterias looks much the same as for all food venues combined. Most of the highest calorie items are available in the cafeteria, including snack cakes, doughnuts, and pastries (367 to 414 calories), as well as milk (300 to 407 calories). At the same time, there are numerous choices with considerably fewer calories. For example, rice cakes and non-dairy frozen desserts (e.g., frozen 100% juice bars) have less than 100 calories, on average (5 percent or less of REA), and many items provide fewer than 200 calories (or 7 to 10 percent of REA): cereal bars/mixes, popcorn, pretzels, fruit rollups, reduced-fat chips, and salads. Although some beverages, especially in 16- to 20-ounce sizes, tend to be more caloric, others offer less than 200 calories: water, 100% fruit juice, iced tea, some juice-drinks (11.5- to 12-ounce), and sports drinks. The calorie content of competitive beverage choices in the cafeteria is somewhat lower when examined as served versus as offered. Total fat and saturated fat. As for all foods, the foods available in the cafeteria that contain the most total fat are snack cakes, doughnuts, cookies, and chips (15 to 23 g of fat, on average). Whole and 2% fat milk contain the highest mean amounts of total fat among the available beverages (14 to 16 g). One serving of these competitive items provides from 21 to 35 percent of the DRV for total fat. Generally, the items with the most fat also have the highest amounts of saturated fat.8 In the case of whole milk, it also has the most saturated fat relative to calories (30 percent of calories) of all items offered. Students are purchasing the higher fat baked goods and beverages, as evidenced by the small increases in mean fat content for these items after weighting (chocolate chip cookies were among the top sellers). They are also more likely to select chips with less fat, that is, those in smaller packages—not necessarily the reduced-fat varieties. This may relate to issues of price or convenience, rather than a consideration of nutritional quality. Percent of calories from fat and saturated fat. Aside from the salads mentioned above, many competitive foods provide more than 30 percent of calories from total fat. These are generally the same items highest in mean total fat, but also include popcorn, ice cream, and crackers. The higher fat items tend to provide more than 10 percent of calories from saturated fat, ranging from 11 percent for crackers to 30 percent for whole milk. Of note is the relatively high saturated fat content of granola bars: 20 percent of calories compared to 32 percent of calories from total fat. After weighting by student selections, somewhat more foods have average percentages of calories from fat and saturated fat that exceed these benchmarks.
8 One notable exception is the salads with dressing, where the largest share of total fat is unsaturated.

Chapter 4: Competitive Foods: Nutritional Characteristics 67
A number of the competitive items offered in the cafeteria contain little to no fat, including water, yogurt drinks (skim-milk based), juice and sports drinks, non-dairy frozen desserts, rice cakes, pretzels, and fruit rollups/snacks. These items also derive the lowest percentages of total calories from fat and saturated fat relative to other selections (when examined as offered and as served). Although baked or reduced-fat chips are about 50 percent lower in total fat than their “regular” counterparts, they still provide 8 g (12 percent of DRV for fat) and almost 40 percent of total calories as fat. The reduced-fat chips, however, do contain substantially less saturated fat as a percent of calories than the regular varieties. Sodium. Students can select food items with as much as 30 percent of the DRV for sodium, such as pretzels (mean of 729 mg). Doughnuts, chips, and crackers are other higher sodium options, providing from 16 to 18 percent of the sodium DRV. Some of the lower sodium choices available include 100% fruit juice, water, and non-dairy frozen desserts. These items provide as little as 10 to 15 mg sodium. Even ice cream contributes less than 5 percent of the DRV for sodium (mean of 66 mg). With the exception of a decrease in mean sodium for chips (about 4 percent of DRV), these findings are consistent regardless of whether data are examined as offered or as served. The lower mean sodium value for chips as selected can be attributed to less frequent purchases of chips in 3- to 4-ounce packages versus the 1- to 2-ounce sizes. Food Outside the Cafeteria Food energy. The food energy and macronutrient content of competitive foods offered outside the cafeteria, in school stores, is shown in Tables 4.7 and 4.14. Items that can only be purchased outside the cafeteria include candy and gum, and meat snacks (beef jerky). Gum is relatively low in calories (mean value of 97 calories is for full packages, ranging from 5 to 17 sticks), and contributes virtually nothing else nutritionally. The caloric content of candy varies, however, mainly due to differences in package size. Candy with and without chocolate provides as much as 10 percent of the REA (211 to 245 calories). Beef jerky is relatively low in calories (mean of 76 calories), although more than half of the calories are from total fat and about one quarter are from saturated fat. There are no important differences between the mean calories as offered and as sold for items outside the cafeteria. Total fat and saturated fat. Sources of fat and saturated fat differ somewhat for items available outside compared with inside the cafeteria. For example, chips and chocolate candy provide the most fat among the selections offered at school stores (12 to 13 g, or about 20 percent of DRV for total fat). These items are also the biggest contributors of saturated fat. Chocolate candy, with a mean saturated fat content of 5 g (25 percent of DRV), derives about 45 percent of its calories from total fat and 18 percent from saturated fat. This does not change when weighted by student sales. Sodium. Competitive foods are available in school stores with mean sodium values just over 400 mg, or 17 to 18 percent of the DRV (toaster pastries and beef jerky). Lower sodium items are found mainly among the candy and gum selections. The increase in mean sodium for the cereal bar/mixes group when analyzed as sold (136 mg, or 6 percent of DRV), reflects student purchases of the highest sodium option in this food category (cereal snack mix). Micronutrients
Competitive foods were analyzed for their micronutrient content, specifically, vitamins and minerals for which standards exist for school meals (vitamins A and C, calcium, and iron), and selected B

68 Chapter 4: Competitive Foods: Nutritional Characteristics
vitamins (thiamin, riboflavin, niacin, and vitamin B6).9 The mean nutrient values for each food category are shown in Tables 4.10 and 4.15. In addition, findings are discussed relative to the contribution competitive foods make to RDIs.10 RDIs for the nutrients assessed are as follows:
• Vitamin A: 5,000 IU • Vitamin C: 60 mg • Thiamin: 1.5 mg • Riboflavin: 1.7 mg • Niacin: 20 mg • Vitamin B6: 2 mg • Calcium: 1,000 mg • Iron: 18 mg
Results for B vitamins are included in tables but not discussed in detail. All Food Available During School Day Vitamin A. The mean vitamin A content of competitive foods accessible during the school day varies across food categories. Salads with dressing contribute the most significant amounts of vitamin A (mean of 250 µg retinol equivalents (RE)), whereas candy/gum contain virtually no vitamin A. As a group, beverages also provide substantial amounts of vitamin A (97 µg RE, on average), especially milk and juice drinks with added vitamin A. Salads and beverages offer an average of 17 percent and 6 percent of the RDI for vitamin A, respectively.11 None of the other food groups offer vitamin A at levels greater than 5 percent of the RDI. After weighting by student selections, frozen desserts contribute more vitamin A, on average, than beverages. This reflects a small reduction (approximately 4 percent of RDI) in the mean vitamin A content of beverages. Students are less likely to select milk and juice-based drinks fortified with vitamin A than other beverages. Vitamin C. Beverages and salads are also the main source of vitamin C in competitive foods. The mean amount of vitamin C in beverages overall (58 mg) approximates 100 percent of the RDI. Salads with dressing provide about one fourth as much vitamin C as beverages (mean of 16 mg, or 27 percent of RDI). The only other group of items that contributes an amount of vitamin C that exceeds 5 percent of the RDI is snacks (mean of 7 mg, or 12 percent of RDI for vitamin C). Although beverages as selected remain the most important source of vitamin C, the mean contribution drops by 18 percent of the vitamin C RDI. Calcium. In contrast to findings for vitamins A and C, most of the categories of competitive foods provide calcium in amounts over 5 percent of the RDI. The exceptions are candy/gum and snacks.
9 The B vitamins included in the analysis represent those used to identify FMNV and/or used to fortify certain juice-
based beverages available as competitive items. 10 RDIs are a population-weighted average of the RDAs for vitamins and minerals for healthy individuals over 4 years
old. RDIs were chosen over the age- and gender-specific RDAs because SFA directors and others making decisions about foods to offer students may not have this information readily available. FMNVs are also determined by their relative contribution to the RDI.
11 Note that the RDI for vitamin A is expressed as International Units (IU), whereas vitamin A values in the tables appear as retinol equivalents (RE). Reported percentages of RDA for vitamin A are based on the following conversion: 1 µg RE = 3.33 IU vitamin A.

Chapter 4: Competitive Foods: Nutritional Characteristics 69
Beverages offer by far the most calcium of all items. The average calcium content of the available beverages is 198 mg, or almost 20 percent of the calcium RDI. Bread/grain products, baked goods, salads, and frozen desserts offer from 58 to 72 mg calcium (6 to 7 percent of RDI). As expected, the mean calcium content of beverages decreases after taking into account students’ relative purchases of milk and non-dairy beverages. The change amounts to a mean of 134 mg calcium, or 13 of RDI. Iron. The grain-based items are the only substantial sources of iron among all competitive foods offered. Baked goods and bread/grain products, either processed with enriched flour or whole grains, provide an average of 2 mg iron or 11 percent of the iron RDI. Salads with dressing are the only other foods offered with more than 5 percent of the RDI for iron (1 mg iron, or 5.5 percent of RDI). Results for iron are similar whether examined as offered or selected. Food Inside the Cafeteria Vitamin A. The micronutrient composition of competitive foods for sale in the cafeteria differs little from the micronutrient picture for all foods combined. Major sources of vitamin A include salads, milk, particularly fortified skim or 1% lowfat milk, and juice-based drinks with added vitamin A. The vitamin A contribution for these beverages averages 19 percent and 14 percent of RDI, respectively. As mentioned above, students are not purchasing these beverages as often as alternative beverage choices. Vitamin C. Fruit juice (100% juice), whether examined as offered or as selected, is still the richest source of vitamin C available in the cafeteria (178 to 233 percent of RDI), despite fortification of some of the other beverage choices. Calcium. There is a small reduction in the mean calcium and iron contributed by bread/grain products in the cafeteria. It appears that the cereal bars/mixes offered here are substantially lower in calcium and iron content than their calcium- and iron-fortified counterparts for sale in the school stores. Nonetheless, the most important sources of calcium are milk and 100% fruit juice, which are only available in the cafeteria. The milk choices provide from 583 to 817 mg calcium, on average, (58 to 82 percent of RDI) and 100% fruit juice contributes a mean of 185 mg calcium (18 percent of RDI). The relative contributions of calcium from fruit juice and milk remain the same when weighted by student selections. Iron. In the cafeteria, baked goods/desserts offer the most iron (when examined as offered and as selected). Snack cakes contain the highest mean amount of iron at 2.3 mg (13 percent of RDI). One reason why the baked goods contain more iron than other grain-based items is their size. For example, most snack cakes and pastries for sale weigh between 3 and 4 ounces, whereas cereal and granola bars, crackers, and pretzels weigh from 1 to 2 oz. Food Outside the Cafeteria Vitamin A. The micronutrients provided by foods available outside the cafeteria are limited, and generally reflect the offerings of a few items that have been fortified. In contrast to foods and beverages offered in the cafeteria, the only substantial contributor of vitamin A in the school store (as offered and as sold) is toaster pastries (mean of 299 µg RE, or 20 percent of RDI). These items are also fortified with B vitamins and iron, at approximately 20 percent of the RDI for these nutrients. Toaster pastries also contain about 400 calories per serving, or 13 to 20 percent of the REA.

70 Chapter 4: Competitive Foods: Nutritional Characteristics
Vitamin C. Juice drinks (Hawaiian punch) are the single significant source of vitamin C offered outside the cafeteria. A 20-ounce serving offers three times the RDI for vitamin C (and 290 calories). Some candy items also provide vitamin C, specifically, fruit-flavored candies that have been fortified with vitamin C (e.g., Skittles, Starburst fruit chews and sours, taffy). Calcium and iron. Few competitive food items offered outside the cafeteria provide nutritionally important amounts of calcium or iron. In addition to the toaster pastries noted above, fortified cereal bars and cereal mixes are the exceptions. The mean calcium and iron values for these items are 133 mg and 4.8 mg, respectively. On average, the cereal bars/mixes available offer 13 percent of the RDI for calcium, and 27 percent of the RDI for iron. They also contain about 5 percent of the RDI for vitamin A, and from 85 to 213 calories. After weighting, the average calcium (and vitamin A) value for cereal bars/mixes drops slightly, and iron increases more substantially (about 8 percent of the iron RDI). This reflects the finding that students were more likely to select a cereal snack mix, with almost half the RDI for iron, than cereal bars. Food Guide Pyramid Servings from Competitive Foods
Dietary guidance for health promotion includes daily recommendations for foods to eat from each of the five main Food Guide Pyramid food groups. The analyses presented in this section (Tables 4.11 and 4.16) show the mean number of servings contributed by competitive foods to the grain, vegetable, fruit, dairy, and meat/meat substitute groups. Competitive foods were also analyzed for mean amounts of discretionary fat and added sugars.12 Results for the relative amounts of discretionary fat roughly parallel the findings for total fat presented above, so they are not discussed in detail here. To provide a context for interpreting the Pyramid servings analysis, the daily-recommended numbers of servings for each of the main Food Guide Pyramid groups are reviewed below. The ranges of servings shown are based on calorie levels of 1,600 to 2,800 calories per day.
• Grain group: 6 to 11 servings • Vegetable group: 3 to 5 servings • Fruit group: 2 to 4 servings • Dairy group: 2 to 3 servings • Meat group: 5 to 7 ounces
Food Pyramid recommendations also include guidelines for maximum daily intakes of discretionary fat and added sugars:
• Discretionary fat: 53 to 93 g • Added sugars: 6 to 18 teaspoons
These recommendations are intended to apply to children age 7 and above (USDA/ARS, 2000).
12 Discretionary fat includes all “excess” fat from the five major food groups beyond amounts that would be consumed if
only the lowest fat forms were eaten, as well as fats added to foods in preparation or at the table. Added sugars include sugar and sweeteners eaten separately or used as ingredients in processed or prepared foods. They do not include naturally occurring sugars, such as lactose in milk or the fructose in fruit (USDA/ARS, 2000).

Chapter 4: Competitive Foods: Nutritional Characteristics 71
All Food Available During School Day A large share of the competitive foods available to students during the school day offers little in the way of main Pyramid food group servings. Some foods and beverages, however, do make a positive contribution. The types of foods that contribute at least one-half serving of a food from a Pyramid food group are discussed here. Main food groups. Foods contributing to the grain group fall mainly in the baked goods, bread/grain products, and snack categories. These foods provide, on average, between 1 and 1¾ servings of grains. Salads with dressing provide an average of 1½ vegetable servings, and beverages contribute to both the fruit and dairy groups. Overall, beverages provide a mean of ½ serving of both fruit and dairy, although milk and 100% fruit juice offer considerably more (about 2 servings from the dairy and fruit groups, respectively). Because students were not as likely to select milk or fruit juice as other beverages, however, the weighted mean number of servings for beverages drops below ½ serving of both dairy and fruit. Added sugars. Baked goods and beverages contain the highest amounts of added sugars among all competitive foods offered, averaging about 7 teaspoons each (more than the daily recommended maximum for a 1,600 calorie diet). The added sugar content of breads/grains and snacks is considerably lower (means of 1½ and ½ teaspoons, respectively), and salads with dressing contain less than 1/2 teaspoon added sugar. The effect of considering student selection patterns in the analysis is to reduce mean discretionary fat, but increase the added sugar contribution from beverages. Food Inside the Cafeteria Main food groups. The contribution to daily recommended Pyramid servings from competitive foods available in the cafeteria is essentially the same as for all foods, as described above. Foods are available that provide from 1 to 2 servings from the grain group, ½ to 1½ servings from the vegetable group, and 1 to 2 servings from each of the fruit and dairy groups. There are no significant sources of meat/meat substitutes offered outside the meal programs in the cafeteria. These findings represent results of analyses for competitive foods both as offered and as selected. Foods in the cafeteria that offer the most servings from the grain group include pretzels (mean of 2.6 servings) and pastries (mean of 2.1 servings). On the other hand, the items that provide the most whole grain servings, on average, are rice/corn cakes (1½ servings), popcorn (1¼ servings), and granola bars and regular chips (each 1 serving) (data not shown). Chips—primarily potato chips—are also the only competitive foods in the cafeteria, other than salads, that make a contribution to the vegetable group. Regular and baked or reduced fat chips provide between ½ and ¾ servings of white potato from the vegetable group (data not shown). Added sugars. The main sources of added sugars in the competitive beverages available in the cafeteria are juice-based drinks and sports drinks (9 to 13 teaspoons, on average). These beverages also contain from 0 to 1 serving of fruit, much less than an average of almost 2¼ servings of fruit from 100% juice. Conversely, although yogurt drinks contain almost 7½ teaspoons added sugar, they contribute an important amount of fruit (mean of 1½ servings) and almost ½ serving of dairy. Baked goods and non-dairy frozen desserts also offer substantial amounts of added sugar, ranging from 5 to 9 teaspoons. Crackers, granola bars, salads, and chips offer lower sugar options among the items available in the cafeteria. Except for beverages, weighting by student selections does not change the relative amounts of added sugars for any of these competitive foods.

72 Chapter 4: Competitive Foods: Nutritional Characteristics
Food Outside the Cafeteria Main food groups. Few foods available outside the cafeteria make a positive contribution to daily servings of Pyramid food groups, when examined both as offered and as sold. The only item among the candy and gum offerings that approximates a ½-serving contribution to any of the Pyramid food groups is chocolate candy (specifically, Twix caramel cookie bar with ½ grain serving). Chocolate candy also provides one of the highest amounts of discretionary fat among all items offered in the school stores. One item available in both high schools provides a small amount (½ ounce) of meat/ meat substitutes: beef jerky. As discussed earlier, this food also contains significant amounts of fat and saturated fat relative to calories, and a substantial amount of sodium. Foods available in the school stores that offer at least 1 serving from one of Pyramid groups include toaster pastries, which contribute an average of 3 servings of grain, and cereal bars/mixes, which provide 1 grain serving. The chips offered in school stores contribute almost 1 serving of vegetable (white potato). Added sugars. Among the items available outside the cafeteria, the major contributors of added sugar include juice-based drinks (mean of 16 teaspoons) and candy without chocolate (mean of 12 teaspoons). Note that the juice drinks available outside the cafeteria at 16- to 20 ounces contain more sugar, on average, than those offered in the cafeteria. Lower sugar options in the school stores include gum (some of which is sugar-free), chips, cereal bars, and crackers. This is does not vary when the analysis takes into account student sales. Foods Meeting FDA Labeling Criteria
In addition to examining food groups and nutrient composition, competitive foods were analyzed relative to FDA criteria for nutrient content claims. FDA defines three categories for nutrient content labeling claims: “free”, “low”, and “reduced”. The first two categories were applied to study data; these categories are defined by absolute standards—for example, the number of grams of fat per serving or per reference amount.13 The “reduced” category was not used for this study because it is defined relative to an appropriate reference product, and it was beyond the scope of the study to apply those standards. The FDA nutrient content claims criteria used are listed below.14 Calories
• Calorie free: less than 5 calories per reference amount and per labeled serving
• Low calorie: 40 calories or less per reference amount (and per 50 g if reference amount is small)
Total fat
• Fat free: less than 0.5 g per reference amount and per labeled serving
• Low fat: 3 g or less per 100 g per reference amount (and per 50 g if reference amount is small)
13 The reference amount is the amount customarily consumed per eating occasion, as defined by FDA (21 CFR 101.12).
A small reference amount is a reference amount of 30 g or less or 2 tablespoons or less (USFDA, 1999). 14 FDA also specifies criteria for labeling claims about sugars. The criterion for “sugar free” requires that the product
have less than 0.5 mg total sugars per labeled serving. Because the nutrient database used for the feasibility study does not provide values for total sugars, this criterion could not be utilized.

Chapter 4: Competitive Foods: Nutritional Characteristics 73
Saturated fat • Saturated fat free: less than 0.5 g saturated fat and less than 0.5 g trans fatty acids per
reference amount and per labeled serving
• Low saturated fat: 1 g or less per reference amount and not more than 15 percent of calories from saturated fat
Cholesterol
• Cholesterol free: less than 2 mg per reference amount and per labeled serving
• Low cholesterol: not more than 20 mg per reference amount (and per 50 g if reference amount is small)
Note: cholesterol claims are only allowed when food contains 2 g or less saturated fat per reference amount.
Sodium
• Sodium free: less than 5 mg per reference amount and per labeled serving
• Low sodium: not more than 140 mg per reference amount (and per 50 g if reference amount is small)
Table 4.12 shows the proportions of competitive foods that meet the FDA labeling criteria for calories, total fat, saturated fat, cholesterol, or sodium. The analysis used the same broad food categories shown in tabulations of nutrient composition and Pyramid food groups; some foods within these categories, however, were combined due to small numbers of items. Foods meeting multiple labeling criteria are identified in the detailed tables in Appendix E. All Food Available During School Day Calories. The only competitive food available during the school day that meets the calorie-free criterion is spring water. None of the items offered is considered low-calorie, according to FDA labeling criteria. A 40-calorie cutoff may be too limiting for purposes of evaluating competitive foods and beverages (e.g., rice/corn cakes are generally considered low calorie yet contain more than 40 calories per serving). Total fat. Competitive foods identified as fat-free include most of the beverage selections (80 percent overall), about half of the candy/gum choices (48 percent), and 15 percent of all frozen desserts. Few of the remaining items in these food categories meet the low-fat criterion, although about one fourth of bread/grain products (24 percent) and a small share of the snacks (9 percent) offered are low fat. None of the baked goods/desserts meet the FDA definitions for fat free or low fat. Saturated fat. With regard to saturated fat, beverages and candy/gum are among the foods most likely to be low in saturated fat. Over 80 percent of the items in these food categories meet the low saturated fat criterion. Additionally, more than half (52 percent) of the bread/grain products are low in saturated fat. In contrast, much smaller proportions (less than 20 percent) of baked goods, snacks, and frozen desserts are low in saturated fat. Cholesterol. All candy and gum, and most bread/grain products and beverages (90 and 83 percent) are either cholesterol-free or low-cholesterol. For all other food categories, the percentage of

74 Chapter 4: Competitive Foods: Nutritional Characteristics
cholesterol-free or low-cholesterol items is lower, ranging from 42 to 58 percent. In all cases, findings for cholesterol claims vary considerably within food categories. For example, among the beverages available, all juice and juice-based drinks are cholesterol-free, but none of the dairy items are cholesterol-free, and only 21 percent are low-cholesterol. Results are similar for the non-dairy frozen dessert and ice cream items. In the snacks category, all of the fruit rollups/snacks are cholesterol-free, but not all of the chips or the beef jerky.15 Note that FDA limits cholesterol claims to foods that have no more than 2 g of saturated fat per reference amount. This explains why all baked and reduced fat chips meet the cholesterol-free criterion, but not the regular chips or popcorn. Sodium. Few competitive foods overall meet the FDA criterion for sodium-free, although a substantial share of items can be classified as low-sodium. Low-sodium items may be found among the frozen desserts (91 percent), beverages (76 percent), and candy/gum (72 percent) categories. Salads with dressing and the vast majority of snacks are not considered low-sodium, according to FDA criteria. Food Inside the Cafeteria Other than eliminating the candy and gum, there are only minor shifts in the percentages of competitive foods that meet FDA labeling criteria when the criteria are applied to only those items available in the cafeteria. The most notable change is seen for snacks, where slightly more (6.5 percent) items in the cafeteria are low in saturated fat compared to all foods available at school. This difference is mainly attributable to meat snacks (beef jerky), which are only available outside the cafeteria. Food Outside the Cafeteria Given the different mix of competitive items available inside and outside the cafeteria, the disparities in the share of items meeting FDA labeling criteria between the two locations are not surprising. With regard to total fat, all of the beverages (n=3) offered in school stores are fat-free, compared with about 80 percent in the cafeterias. The difference is due to milk and yogurt-based drinks offered only in the cafeteria. Additionally, none of the snacks available outside the cafeteria is either fat-free or low fat—fruit rollups or similar items are not sold in the stores. The majority of fat-free or low-fat candy/gum items in the school stores are either chewing gum or candy without chocolate. A fairly large proportion of items available in the school stores can be classified as low in saturated fat and cholesterol-free, including pastries. This finding can be explained, in part, by the relatively small number of selections among food categories other than candy, gum, and snacks. Foods that do not meet the saturated fat and cholesterol criteria include beef jerky, crackers, and most chocolate candy; chips and popcorn cannot be classified as low in saturated fat, and only 40 percent of the items offered are cholesterol-free. Foods of Minimal Nutritional Value
USDA policy on competitive foods prohibits the sale of FMNVs, including beverages, in the food service area during school meal periods (7 CFR 210.11). These regulations do not prohibit the sale of
15 In addition, one of two salads with dressing (Caesar salad) did not meet the cholesterol criteria.

Chapter 4: Competitive Foods: Nutritional Characteristics 75
FMNVs outside the food service area during meal periods or at any other time during the school day. As noted in Chapter 3, however, Virginia policy prohibits the sale of FMNVs during meal periods anywhere in the school. FMNVs are defined in two ways: (1) based on their nutrient composition relative to RDIs, and (2) in terms of specific categories of foods. The regulations are as follows:
1. In the case of artificially sweetened foods, a food that provides less than 5 percent of the RDIs for each of eight specified nutrients per serving; and
2. In the case of all other foods, a food that provides less than 5 percent of the RDI per 100
calories and per serving. The eight nutrients to be assessed for this purpose are protein, vitamin A, vitamin C, niacin, riboflavin, thiamin, calcium, and iron.
The categories of FMNV are soda water, water ices, chewing gum, certain candies, hard candy, jellies and gums, marshmallow candies, fondant, licorice, spun candy, and candy coated popcorn.
Although the USDA regulations effectively prohibit chewing gum, many types of candy, and carbonated soft drinks, they do not address the sale of all types of candy or sports drinks, and allow such items as fortified juice-based drinks high in sugar content. They also do not specifically mention whether non-carbonated water is a FMNV. Because Virginia policy allows water to be sold at any time during the school day, it was not classified as a FMNV for this analysis. An analysis was conducted to identify the number of FMNV items available during the school day at all three schools. Table 4.13 shows the results for each source of competitive foods and for all sources combined. As expected, FMNVs are generally only available outside the cafeteria in the school stores. The exceptions are a handful of foods sold in the cafeteria at School #2:
• Fruit roll-ups • Italian ices • Popsicles
Note that the analysis for FMNV items was based on nutrient values derived from the FIAS nutrient database. Results may have been different if the classifications were made from nutrient values provided by the manufacturer or listed on the Nutrition Facts label for the item. For example, the package labels for fruit roll-ups show that both sizes have 25 percent of the RDI for vitamin C (15 mg), whereas FIAS values are only 1 mg vitamin C for these foods.16 With regard to the competitive foods available outside the cafeteria in School #2, approximately 37 percent of all items (foods only) offered in the store are FMNV items. That estimate rises to 52 percent when weighted by student sales data. In contrast, more than 40 percent of all school store items at School #3 are FMNV items; this drops to 28 percent of store items after factoring in what students are actually purchasing.
16 In addition, manufacturers may request and be granted a waiver for their particular brand of fruit roll-up.

76 C
hapter 4: Com
petitive Foods: Nutritional C
haracteristics
Table 4.13 Foods of Minimum Nutritional Value (FMNV) Available During the School Daya
Foods and Beverages Combined Foods Beverages
School/Source
Number FMNV Items
Percent of All Items
from Source
Weighted Percent of All Itemsb
Number FMNV Items
Percent of All Foods
from Source
Weighted Percent of All Itemsb
Number FMNV Items
Percent of All Beverages
from Source
Weighted Percent of All Itemsb
School #1 A la carte 0 0% 0% 0 0% 0% 0 0% 0% Vending machine 0 0 0 0 0 0 0 0 0 All sources 0 0 0 0 0 0 0 0 0 School #2 Snack bar 2 3.5% 2.5% 2 3.9% 2.6% 0 0% 0% School store 15 36.6 51.7 15 36.6 51.7 0 0 0 Vending machine 2 3.4 1.1 2 7.1 3.7 0 0 0 All sources 19 12.1 24.8 19 15.8 30.3 0 0 0 School #3 A la carte 0 0% 0% 0 0% 0% 0 0% 0% School store 16 42.1 27.6 16 44.4 34.1 0 0 0 Vending machine 0 0 0 0 0 0 0 0 0 All sources 16 20.0 6.1 16 24.2 7.2 0 0 0 a Excludes water.
b Weighted by total sales during target week.
Sources: Cafeteria Survey and Inventories of Competitive Foods..

Abt Associates Inc. Chapter 4: Competitive Foods: Nutritional Characteristics 77
Competitive foods sold in the school stores that did not meet the definition for FMNVs were taffy and other newer candies (e.g., Skittles, Air Heads), and Hawaiian fruit punch. Taffy is not listed among the types of candy categorically considered an FMNV, and it contains 6 percent of the RDI for vitamin C per piece; Skittles contain 68 percent of RDI for vitamin C per package; and 20 ounces of Hawaiian punch has 300 percent of RDI for vitamin C and 5 percent of the RDI for calcium. Summary
This chapter examined the number, types, and nutritional characteristics of competitive foods offered and selected by students in three schools. Seven main food categories and 34 subcategories were used to summarize findings. The number of available competitive foods varied between the schools, with fewer offered at the middle school. Beverages, snacks, and frozen desserts accounted for most of competitive items offered in the cafeterias. Candy and snack items were the most commonly offered foods outside the cafeteria, in school stores. Based on available data, fruit punch, chocolate chip cookies, tortilla chips, and spring water were the most popular items sold to students. Nutritional characteristics of the competitive food items were examined with the following measures:
• Mean food energy, macronutrient, and micronutrient content • Percent of items with ≤ 30% of calories from total fat/< 10% from saturated fat • Mean servings of Food Guide Pyramid main food groups • Percent of items meeting FDA regulations for labeling claims • Percent of items meeting USDA criteria for food of minimal nutritional value (FMNV).
As expected, competitive food offerings included a large number of items with substantial amounts of food energy, total fat, and added sugar. Some lower calorie, lower fat items were also available, and FMNV were found mainly in school stores. The mean vitamin and mineral content of competitive foods was influenced by the availability of highly fortified food and beverage items. After weighting to take into account student selection patterns, the average calorie and fat content of beverages and snacks was somewhat lower, as were the number of servings of dairy and fruit. Students were not as likely to buy milk as juice drinks and bottled water. Mean values of nutrients and Pyramid servings were difficult to interpret, except relative to some benchmarks. We chose to discuss the nutrient content of the various categories and subcategories of items in relation to Daily Values and FDA criteria for nutrition labeling claims. Both of these benchmarks can be easily observed on product labels and may influence choices made by students. To be useful for monitoring purposes, criteria for classifying items as “healthful” or “less healthful” could be developed based on the mean percent of Daily Value for food energy and key nutrients in a single serving (package).17 Use of FDA labeling criteria for this purpose has some drawbacks: the criteria are somewhat complex to apply, they are probably too stringent for identifying low calorie items (less than 40 calories), and they do not always apply to the full package size.
17 Ideally, the criteria would consider food energy and nutrient content together, along with fat, added sugar, and possibly
sodium content.

78 Chapter 4: Competitive Foods in the School Environment Abt Associates Inc.
The competitive food items were also analyzed in relation to the Dietary Guidelines recommendations for daily intake of total fat and saturated fat. Although not typically applied to individual foods, these benchmarks can help identify food and beverage items that make a positive contribution toward meeting fat and saturated fat goals for the day. They are also the basis for standards for the fat and saturated fat content of USDA reimbursable schools meals. One of the Ten Keys to Promote Healthy Eating in Schools included with the Changing the Scene materials recommends that food sold in addition to NSLP meals are “from the five major food groups of the Food Guide Pyramid.” Many of the foods analyzed for this study contained only a fraction of a serving from one or more of these food groups. In addition, some foods that contributed one or more servings of a Pyramid group were also among the highest in calories and fat (e.g., baked goods). Although criteria for healthful competitive food items could be established based on relative contribution to daily-recommended servings of Pyramid groups, it seems likely that food energy and/or fat content would also need to be assessed. Finally, USDA may want to consider revising the categories of FMNV to include sports drinks and taffy.

Abt Associates Inc. Chapter 4: Competitive Foods: Nutritional Characteristics 79
Unweighted Tables

———————————————————————————————————————————————————Table 4.7Food Energy and Macronutrient Composition of Competitive Foods Available During the School Day, AllSchools and Sources
———————————————————————————————————————————————————
Food Available Inside and Outside the School Cafeteria
Numberof items
Meancaloriesper item
Mean amount per item Mean percent ofcalories from
Totalfat(g)
Satura-ted fat
(g)
Carbo-hydrate
(g)
Protein(g)
Choles-terol(mg)
Sodium(mg)
Dietaryfiber(g)
Totalfat
Saturatedfat
Baked goods/dessertAll items ....................................... 27 362.7 15.8 3.8 53.0 4.0 16.7 265.5 1.6 38.5 9.5Cookies ......................................... 10 306.4 15.0 4.6 42.0 3.5 6.0 235.0 1.7 42.7 13.0Doughnuts .................................... 2 380.6 22.9 5.0 41.6 4.2 40.4 414.6 1.5 53.9 11.6Pastries (danish, toaster pastries,
pies) ........................................ 7 378.9 12.2 2.1 63.5 4.8 24.7 336.5 2.0 28.2 5.0Snack cakes ................................. 8 414.3 18.2 4.0 60.7 3.9 17.0 204.2 1.2 38.6 8.6
BeveragesAll items ....................................... 66 225.0 2.5 1.5 48.8 3.4 10.0 99.8 0.7 5.9 3.5Fruit juice, 100% juice .................. 7 179.4 0.4 0.0 43.3 1.6 0.0 11.9 0.6 2.3 0.3Iced tea drinks, fortified ................ 2 130.0 0.0 0.0 33.0 0.0 0.0 9.9 0.0 0.0 0.0Juice-based drink, fortified, 16-20
fl oz ......................................... 2 237.2 0.0 0.0 58.2 0.0 0.0 345.0 0.0 0.0 0.0Juice-based drinks, 11.5-12 fl oz .. 4 170.0 0.0 0.0 43.4 0.2 0.0 62.8 0.3 0.4 0.0Juice-based drinks, 16-20 fl oz ..... 8 272.0 0.0 0.0 69.5 0.2 0.0 87.9 0.5 0.3 0.0Juice-based drinks, fortified,
11.5-12 fl oz ............................ 23 208.0 0.0 0.0 52.6 0.6 0.0 54.6 0.4 0.2 0.0Milk, flavored, skim or 1% fat,
fortified .................................... 2 313.9 6.2 3.8 54.7 16.6 21.2 271.2 2.7 16.9 10.3Milk, flavored, whole or 2% fat,
fortified .................................... 9 407.3 14.3 8.9 56.0 15.0 57.4 258.8 1.6 31.3 19.5Milk, whole .................................... 1 299.8 16.3 10.2 22.7 16.1 66.4 239.1 0.0 48.9 30.5Sports drinks ................................. 1 150.0 0.0 0.0 37.8 0.0 0.0 240.0 0.0 0.0 0.0Spring water ................................. 5 0.0 0.0 0.0 0.0 0.0 0.0 15.2 0.0 0.0 0.0Yogurt drinks ................................ 2 240.0 0.0 0.0 59.5 4.9 16.0 77.3 2.8 0.0 0.0
Bread or grain productsAll items ....................................... 21 173.4 6.0 2.1 26.7 3.8 0.9 295.8 0.8 29.0 10.1Cereal bars/cereal mixes .............. 6 157.1 4.2 0.9 27.7 3.4 0.2 209.1 0.6 23.6 4.8Crackers/Cracker Sandwiches ..... 7 210.2 9.7 2.7 26.3 4.4 2.6 415.9 0.6 40.8 11.2Granola bar ................................... 5 160.8 5.8 3.8 24.6 3.6 0.0 102.5 1.1 31.5 20.1Pretzels ......................................... 2 162.0 1.5 0.3 33.7 3.9 0.0 729.3 1.4 8.2 1.8Rice or corn cakes ........................ 1 99.1 0.8 0.1 20.7 2.5 0.0 74.3 0.8 7.3 1.1
Candy/gumAll items ....................................... 58 142.1 3.0 1.0 30.7 0.7 0.7 28.0 0.2 14.9 5.4Candy with chocolate ................... 9 245.2 12.3 5.0 30.7 3.5 3.7 82.7 1.3 44.7 18.5Candy with chocolate, single
piece or pop ............................ 3 63.2 2.5 1.5 10.3 0.5 1.7 9.0 0.1 35.8 21.6Candy without chocolate .............. 14 211.1 2.1 0.5 49.5 0.2 0.0 34.1 0.0 8.1 1.8Candy without chocolate, single
piece or pop ............................ 19 86.2 1.2 0.3 19.8 0.1 0.0 18.2 0.0 11.9 2.7Chewing gum ................................ 13 96.6 0.1 0.0 30.8 0.0 0.0 2.1 0.0 1.1 0.2
Frozen dessertsAll items ....................................... 33 188.3 9.5 5.5 24.6 2.9 21.7 57.5 0.5 41.5 23.6Ice cream ...................................... 28 204.3 11.2 6.4 24.6 3.2 25.6 65.8 0.6 48.8 27.8Non-dairy frozen desserts ............ 5 99.2 0.0 0.0 25.1 0.7 0.0 11.3 0.0 0.4 0.0
Salads with dressingAll items ....................................... 2 150.1 12.8 2.2 6.5 3.5 21.0 364.4 1.6 76.8 12.9Side salads ................................... 2 150.1 12.8 2.2 6.5 3.5 21.0 364.4 1.6 76.8 12.9
SnacksAll items ....................................... 57 232.5 13.1 3.0 26.5 3.1 0.9 311.8 2.0 49.3 11.7
Source: Cafeteria Survey and and Inventories of Competitive Foods.
—————————————————————————————————————————————————————————————————— Chapter 4: Competitive Foods: Nutritional Characteristics 81

———————————————————————————————————————————————————Table 4.7Food Energy and Macronutrient Composition of Competitive Foods Available During the School Day, AllSchools and Sources — Continued
———————————————————————————————————————————————————
Food Available Inside and Outside the School Cafeteria
Numberof items
Meancaloriesper item
Mean amount per item Mean percent ofcalories from
Totalfat(g)
Satura-ted fat
(g)
Carbo-hydrate
(g)
Protein(g)
Choles-terol(mg)
Sodium(mg)
Dietaryfiber(g)
Totalfat
Saturatedfat
SnacksChips ............................................ 40 265.8 16.2 3.7 27.9 3.5 0.5 346.5 2.1 55.0 12.9Chips - baked or reduced fat ........ 5 182.7 8.1 0.9 25.1 2.2 0.0 254.6 2.0 38.9 4.4Fruit roll-ups/fruit snacks .............. 5 167.6 1.6 0.4 38.6 0.1 0.0 125.6 1.6 8.2 2.1Meat snacks (jerky) ...................... 2 76.1 4.8 2.0 2.0 6.2 8.9 410.5 0.3 56.2 23.8Popcorn ........................................ 5 142.8 8.4 2.2 14.8 2.9 2.5 237.6 2.8 52.8 14.2
Source: Cafeteria Survey and and Inventories of Competitive Foods.
—————————————————————————————————————————————————————————————————— Chapter 4: Competitive Foods: Nutritional Characteristics 82

———————————————————————————————————————————————————Table 4.7Food Energy and Macronutrient Composition of Competitive Foods Available During the School Day, AllSchools and Sources — Continued
———————————————————————————————————————————————————
Food Available In the School Cafeteria
Numberof items
Meancaloriesper item
Mean amount per item Mean percent ofcalories from
Totalfat(g)
Satura-ted fat
(g)
Carbo-hydrate
(g)
Protein(g)
Choles-terol(mg)
Sodium(mg)
Dietaryfiber(g)
Totalfat
Saturatedfat
Baked goods/dessertAll items ....................................... 25 359.0 16.2 4.0 51.4 3.9 18.0 251.9 1.6 39.8 10.0Cookies ......................................... 10 306.4 15.0 4.6 42.0 3.5 6.0 235.0 1.7 42.7 13.0Doughnuts .................................... 2 380.6 22.9 5.0 41.6 4.2 40.4 414.6 1.5 53.9 11.6Pastries (danish, toaster pastries,
pies) ........................................ 5 367.0 12.8 2.4 59.3 4.7 34.5 296.7 1.9 30.1 5.6Snack cakes ................................. 8 414.3 18.2 4.0 60.7 3.9 17.0 204.2 1.2 38.6 8.6
BeveragesAll items ....................................... 63 226.6 2.6 1.6 48.8 3.5 10.4 99.9 0.7 6.2 3.7Fruit juice, 100% juice .................. 7 179.4 0.4 0.0 43.3 1.6 0.0 11.9 0.6 2.3 0.3Iced tea drinks, fortified ................ 2 130.0 0.0 0.0 33.0 0.0 0.0 9.9 0.0 0.0 0.0Juice-based drink, fortified, 16-20
fl oz ......................................... 2 237.2 0.0 0.0 58.2 0.0 0.0 345.0 0.0 0.0 0.0Juice-based drinks, 11.5-12 fl oz .. 4 170.0 0.0 0.0 43.4 0.2 0.0 62.8 0.3 0.4 0.0Juice-based drinks, 16-20 fl oz ..... 6 265.8 0.1 0.0 68.2 0.2 0.0 71.8 0.5 0.4 0.0Juice-based drinks, fortified,
11.5-12 fl oz ............................ 23 208.0 0.0 0.0 52.6 0.6 0.0 54.6 0.4 0.2 0.0Milk, flavored, skim or 1% fat,
fortified .................................... 2 313.9 6.2 3.8 54.7 16.6 21.2 271.2 2.7 16.9 10.3Milk, flavored, whole or 2% fat,
fortified .................................... 9 407.3 14.3 8.9 56.0 15.0 57.4 258.8 1.6 31.3 19.5Milk, whole .................................... 1 299.8 16.3 10.2 22.7 16.1 66.4 239.1 0.0 48.9 30.5Sports drinks ................................. 1 150.0 0.0 0.0 37.8 0.0 0.0 240.0 0.0 0.0 0.0Spring water ................................. 4 0.0 0.0 0.0 0.0 0.0 0.0 14.6 0.0 0.0 0.0Yogurt drinks ................................ 2 240.0 0.0 0.0 59.5 4.9 16.0 77.3 2.8 0.0 0.0
Bread or grain productsAll items ....................................... 16 174.2 6.2 2.4 26.7 3.5 1.1 307.6 0.8 29.4 11.5Cereal bars/cereal mixes .............. 2 141.0 3.7 0.7 26.9 1.1 0.0 161.5 0.1 23.8 4.7Crackers/Cracker Sandwiches ..... 6 213.0 9.7 2.8 27.0 4.3 2.9 425.6 0.7 40.2 11.4Granola bar ................................... 5 160.8 5.8 3.8 24.6 3.6 0.0 102.5 1.1 31.5 20.1Pretzels ......................................... 2 162.0 1.5 0.3 33.7 3.9 0.0 729.3 1.4 8.2 1.8Rice or corn cakes ........................ 1 99.1 0.8 0.1 20.7 2.5 0.0 74.3 0.8 7.3 1.1
Frozen dessertsAll items ....................................... 33 188.3 9.5 5.5 24.6 2.9 21.7 57.5 0.5 41.5 23.6Ice cream ...................................... 28 204.3 11.2 6.4 24.6 3.2 25.6 65.8 0.6 48.8 27.8Non-dairy frozen desserts ............ 5 99.2 0.0 0.0 25.1 0.7 0.0 11.3 0.0 0.4 0.0
Salads with dressingAll items ....................................... 2 150.1 12.8 2.2 6.5 3.5 21.0 364.4 1.6 76.8 12.9Side salads ................................... 2 150.1 12.8 2.2 6.5 3.5 21.0 364.4 1.6 76.8 12.9
SnacksAll items ....................................... 45 245.2 13.5 3.0 29.0 3.1 0.7 321.2 2.2 47.3 10.8Chips ............................................ 30 285.7 17.2 3.9 30.4 3.8 0.6 378.8 2.2 54.3 12.8Chips - baked or reduced fat ........ 5 182.7 8.1 0.9 25.1 2.2 0.0 254.6 2.0 38.9 4.4Fruit roll-ups/fruit snacks .............. 5 167.6 1.6 0.4 38.6 0.1 0.0 125.6 1.6 8.2 2.1Popcorn ........................................ 5 142.8 8.4 2.2 14.8 2.9 2.5 237.6 2.8 52.8 14.2
Source: Cafeteria Survey and and Inventories of Competitive Foods.
—————————————————————————————————————————————————————————————————— Chapter 4: Competitive Foods: Nutritional Characteristics 83

———————————————————————————————————————————————————Table 4.7Food Energy and Macronutrient Composition of Competitive Foods Available During the School Day, AllSchools and Sources — Continued
———————————————————————————————————————————————————
Food Available Outside the School Cafeteria
Numberof items
Meancaloriesper item
Mean amount per item Mean percent ofcalories from
Totalfat(g)
Satura-ted fat
(g)
Carbo-hydrate
(g)
Protein(g)
Choles-terol(mg)
Sodium(mg)
Dietaryfiber(g)
Totalfat
Saturatedfat
Baked goods/dessertAll items ....................................... 2 408.9 10.6 1.6 74.0 4.9 0.0 436.0 2.2 23.4 3.5Pastries (danish, toaster pastries,
pies) ........................................ 2 408.9 10.6 1.6 74.0 4.9 0.0 436.0 2.2 23.4 3.5
BeveragesAll items ....................................... 3 193.6 0.0 0.0 49.0 0.0 0.0 96.6 0.4 0.0 0.0Juice-based drinks, 16-20 fl oz ..... 2 290.5 0.0 0.0 73.5 0.0 0.0 136.0 0.6 0.0 0.0Spring water ................................. 1 0.0 0.0 0.0 0.0 0.0 0.0 17.8 0.0 0.0 0.0
Bread or grain productsAll items ....................................... 5 170.9 5.4 1.2 26.9 4.7 0.4 257.8 0.7 27.8 5.9Cereal bars/cereal mixes .............. 4 165.2 4.4 0.9 28.1 4.6 0.3 232.9 0.8 23.6 4.9Crackers/Cracker Sandwiches ..... 1 193.7 9.6 2.1 22.0 5.0 0.8 357.6 0.4 44.7 10.0
Candy/gumAll items ....................................... 58 142.1 3.0 1.0 30.7 0.7 0.7 28.0 0.2 14.9 5.4Candy with chocolate ................... 9 245.2 12.3 5.0 30.7 3.5 3.7 82.7 1.3 44.7 18.5Candy with chocolate, single
piece or pop ............................ 3 63.2 2.5 1.5 10.3 0.5 1.7 9.0 0.1 35.8 21.6Candy without chocolate .............. 14 211.1 2.1 0.5 49.5 0.2 0.0 34.1 0.0 8.1 1.8Candy without chocolate, single
piece or pop ............................ 19 86.2 1.2 0.3 19.8 0.1 0.0 18.2 0.0 11.9 2.7Chewing gum ................................ 13 96.6 0.1 0.0 30.8 0.0 0.0 2.1 0.0 1.1 0.2
SnacksAll items ....................................... 12 184.6 11.9 3.0 17.4 3.1 1.6 276.4 1.4 56.8 15.1Chips ............................................ 10 206.3 13.4 3.2 20.4 2.4 0.1 249.6 1.6 57.0 13.4Meat snacks (jerky) ...................... 2 76.1 4.8 2.0 2.0 6.2 8.9 410.5 0.3 56.2 23.8
Source: Cafeteria Survey and and Inventories of Competitive Foods.
—————————————————————————————————————————————————————————————————— Chapter 4: Competitive Foods: Nutritional Characteristics 84

———————————————————————————————————————————————————Table 4.8Number and Percent of Competitive Food and Beverage Products with no more than 30% of Calories fromFat
School #1 School #2 School #3
Total itemsTotal fat ≤ 30%
Total itemsTotal fat ≤ 30%
Total itemsTotal fat ≤ 30%
Number Percent Number Percent Number Percent
In the cafeteriaBaked goods/dessert 5 0 0.0 13 4 30.8 7 0 0.0Beverages ................ 11 11 100.0 39 31 79.5 13 13 100.0Bread/grain products 1 1 100.0 14 5 35.7 1 1 100.0Frozen desserts ........ – – – 22 6 27.3 11 1 9.1Salads with dressing – – – 2 0 0.0 – – –Snacks ...................... 6 0 0.0 28 5 17.9 11 0 0.0
Outside the cafeteriaBaked goods/dessert – – – – – – 2 2 100.0Beverages ................ – – – – – – 3 3 100.0Bread/grain products – – – – – – 5 4 80.0Candy ....................... – – – 36 28 77.8 22 19 86.4Snacks ...................... – – – 5 0 0.0 7 0 0.0
– No items in category.
Source: Cafeteria Survey and and Inventories of Competitive Foods.
———————————————————————————————————————————————————Table 4.9Number and Percent of Competitive Food and Beverage Products with less than 10% of Calories fromSaturated Fat
School #1 School #2 School #3
Total itemsSaturated fat < 10%
Total itemsSaturated fat < 10%
Total itemsSaturated fat < 10%
Number Percent Number Percent Number Percent
In the cafeteriaBaked goods/dessert 5 3 60.0 13 8 61.5 7 6 85.7Beverages ................ 11 11 100.0 39 28 71.8 13 13 100.0Bread/grain products 1 1 100.0 14 6 42.9 1 1 100.0Frozen desserts ........ – – – 22 4 18.2 11 1 9.1Salads with dressing – – – 2 0 0.0 – – –Snacks ...................... 6 3 50.0 28 16 57.1 11 2 18.2
Outside the cafeteriaBaked goods/dessert – – – – – – 2 2 100.0Beverages ................ – – – – – – 3 3 100.0Bread/grain products – – – – – – 5 5 100.0Candy ....................... – – – 36 28 77.8 22 19 86.4Snacks ...................... – – – 5 0 0.0 7 3 42.9
– No items in category.
Source: Cafeteria Survey and and Inventories of Competitive Foods.
—————————————————————————————————————————————————————————————————— Chapter 4: Competitive Foods: Nutritional Characteristics 85

———————————————————————————————————————————————————Table 4.10
Micronutrient Composition of Competitive Foods Available During the School Day, All Schools and Sources
———————————————————————————————————————————————————
Food Available Inside and Outside the School Cafeteria
Number ofitems
Mean amount per item
VitaminA
(RE)
VitaminC
(mg)
Thiamin(mg)
Riboflavin(mg)
Niacin(mg)
VitaminB6
(mg)
Calcium(mg)
Iron(mg)
Baked goods/dessertAll items ....................................... 27 65.4 0.5 0.2 0.2 2.4 0.2 63.4 2.1Cookies ......................................... 10 18.6 0.4 0.1 0.2 1.5 0.0 19.9 1.8Doughnuts .................................... 2 20.4 0.1 0.2 0.2 1.4 0.0 33.6 1.9Pastries (danish, toaster pastries,
pies) ........................................ 7 209.6 0.9 0.3 0.4 5.2 0.5 136.6 2.5Snack cakes ................................. 8 9.0 0.2 0.2 0.2 1.5 0.0 61.3 2.3
BeveragesAll items ....................................... 66 96.9 57.6 0.1 0.2 1.0 0.2 197.6 0.7Fruit juice, 100% juice .................. 7 33.7 106.5 0.2 0.0 0.8 0.2 184.7 1.3Iced tea drinks, fortified ................ 2 0.0 60.0 0.0 0.0 4.0 0.4 100.0 0.0Juice-based drink, fortified, 16-20
fl oz ......................................... 2 215.6 70.1 0.6 0.0 0.2 0.0 21.6 0.2Juice-based drinks, 11.5-12 fl oz .. 4 3.3 40.1 0.0 0.0 0.1 0.0 26.4 0.7Juice-based drinks, 16-20 fl oz ..... 8 19.2 67.8 0.0 0.1 0.2 0.0 36.3 1.1Juice-based drinks, fortified,
11.5-12 fl oz ............................ 23 146.2 82.3 0.1 0.1 1.7 0.2 54.8 0.7Milk, flavored, skim or 1% fat,
fortified .................................... 2 284.4 17.3 0.2 0.8 0.6 0.2 684.0 1.3Milk, flavored, whole or 2% fat,
fortified .................................... 9 153.0 4.4 0.2 0.8 0.5 0.2 816.7 0.7Milk, whole .................................... 1 151.3 4.6 0.2 0.8 0.4 0.2 582.7 0.2Sports drinks ................................. 1 0.0 0.0 0.0 0.0 0.0 0.0 0.0 0.3Spring water ................................. 5 0.0 0.0 0.0 0.0 0.0 0.0 10.2 0.0Yogurt drinks ................................ 2 51.1 60.0 0.1 0.3 0.7 0.4 250.0 0.7
Bread or grain productsAll items ....................................... 21 29.2 2.0 0.2 0.1 1.8 0.1 58.0 2.0Cereal bars/cereal mixes .............. 6 92.7 6.4 0.2 0.2 2.5 0.2 89.8 3.4Crackers/Cracker Sandwiches ..... 7 7.7 0.3 0.2 0.2 2.0 0.1 76.6 1.5Granola bar ................................... 5 0.4 0.4 0.1 0.0 0.6 0.1 22.1 1.2Pretzels ......................................... 2 0.0 0.0 0.2 0.3 2.2 0.0 15.3 1.8Rice or corn cakes ........................ 1 1.8 0.0 0.0 0.0 1.6 0.0 2.3 0.5
Candy/gumAll items ....................................... 58 2.1 5.3 0.0 0.0 0.2 0.0 10.6 0.1Candy with chocolate ................... 9 12.9 0.2 0.0 0.0 1.1 0.0 45.1 0.5Candy with chocolate, single
piece or pop ............................ 3 2.2 0.0 0.0 0.0 0.0 0.0 15.8 0.0Candy without chocolate .............. 14 0.0 14.2 0.0 0.0 0.0 0.0 4.3 0.1Candy without chocolate, single
piece or pop ............................ 19 0.0 5.6 0.0 0.0 0.0 0.0 2.7 0.0Chewing gum ................................ 13 0.0 0.0 0.0 0.0 0.0 0.0 3.7 0.0
Frozen dessertsAll items ....................................... 33 50.8 1.8 0.0 0.1 0.3 0.0 71.6 0.5Ice cream ...................................... 28 58.8 0.6 0.0 0.2 0.4 0.0 83.7 0.5Non-dairy frozen desserts ............ 5 6.1 8.8 0.0 0.0 0.0 0.0 4.1 0.2
Salads with dressingAll items ....................................... 2 250.4 15.7 0.0 0.1 1.0 0.0 64.3 1.0Side salads ................................... 2 250.4 15.7 0.0 0.1 1.0 0.0 64.3 1.0
Source: Cafeteria Survey and and Inventories of Competitive Foods.
—————————————————————————————————————————————————————————————————— Chapter 4: Competitive Foods: Nutritional Characteristics 86

———————————————————————————————————————————————————Table 4.10
Micronutrient Composition of Competitive Foods Available During the School Day, All Schools and Sources— Continued
———————————————————————————————————————————————————
Food Available Inside and Outside the School Cafeteria
Number ofitems
Mean amount per item
VitaminA
(RE)
VitaminC
(mg)
Thiamin(mg)
Riboflavin(mg)
Niacin(mg)
VitaminB6
(mg)
Calcium(mg)
Iron(mg)
SnacksAll items ....................................... 57 6.8 7.4 0.0 0.0 1.0 0.1 32.9 0.7Chips ............................................ 40 7.2 4.7 0.0 0.1 1.3 0.2 39.4 0.8Chips - baked or reduced fat ........ 5 4.5 0.0 0.0 0.0 1.0 0.1 25.9 0.3Fruit roll-ups/fruit snacks .............. 5 5.4 46.4 0.0 0.0 0.0 0.1 9.2 0.4Meat snacks (jerky) ...................... 2 0.0 0.0 0.0 0.0 0.3 0.0 3.7 1.0Popcorn ........................................ 5 10.5 0.0 0.0 0.0 0.4 0.0 23.5 0.5
Source: Cafeteria Survey and and Inventories of Competitive Foods.
—————————————————————————————————————————————————————————————————— Chapter 4: Competitive Foods: Nutritional Characteristics 87

———————————————————————————————————————————————————Table 4.10
Micronutrient Composition of Competitive Foods Available During the School Day, All Schools and Sources— Continued
———————————————————————————————————————————————————
Food Available In the School Cafeteria
Number ofitems
Mean amount per item
VitaminA
(RE)
VitaminC
(mg)
Thiamin(mg)
Riboflavin(mg)
Niacin(mg)
VitaminB6
(mg)
Calcium(mg)
Iron(mg)
Baked goods/dessertAll items ....................................... 25 46.7 0.5 0.2 0.2 2.3 0.1 66.4 2.0Cookies ......................................... 10 18.6 0.4 0.1 0.2 1.5 0.0 19.9 1.8Doughnuts .................................... 2 20.4 0.1 0.2 0.2 1.4 0.0 33.6 1.9Pastries (danish, toaster pastries,
pies) ........................................ 5 174.0 1.1 0.3 0.3 5.6 0.5 180.5 2.1Snack cakes ................................. 8 9.0 0.2 0.2 0.2 1.5 0.0 61.3 2.3
BeveragesAll items ....................................... 63 101.4 54.5 0.1 0.2 1.0 0.2 205.3 0.7Fruit juice, 100% juice .................. 7 33.7 106.5 0.2 0.0 0.8 0.2 184.7 1.3Iced tea drinks, fortified ................ 2 0.0 60.0 0.0 0.0 4.0 0.4 100.0 0.0Juice-based drink, fortified, 16-20
fl oz ......................................... 2 215.6 70.1 0.6 0.0 0.2 0.0 21.6 0.2Juice-based drinks, 11.5-12 fl oz .. 4 3.3 40.1 0.0 0.0 0.1 0.0 26.4 0.7Juice-based drinks, 16-20 fl oz ..... 6 23.6 29.5 0.0 0.1 0.2 0.0 32.0 1.0Juice-based drinks, fortified,
11.5-12 fl oz ............................ 23 146.2 82.3 0.1 0.1 1.7 0.2 54.8 0.7Milk, flavored, skim or 1% fat,
fortified .................................... 2 284.4 17.3 0.2 0.8 0.6 0.2 684.0 1.3Milk, flavored, whole or 2% fat,
fortified .................................... 9 153.0 4.4 0.2 0.8 0.5 0.2 816.7 0.7Milk, whole .................................... 1 151.3 4.6 0.2 0.8 0.4 0.2 582.7 0.2Sports drinks ................................. 1 0.0 0.0 0.0 0.0 0.0 0.0 0.0 0.3Spring water ................................. 4 0.0 0.0 0.0 0.0 0.0 0.0 9.7 0.0Yogurt drinks ................................ 2 51.1 60.0 0.1 0.3 0.7 0.4 250.0 0.7
Bread or grain productsAll items ....................................... 16 17.6 0.9 0.2 0.1 1.5 0.1 40.4 1.3Cereal bars/cereal mixes .............. 2 111.9 5.1 0.1 0.1 1.7 0.2 3.0 0.7Crackers/Cracker Sandwiches ..... 6 9.0 0.3 0.2 0.2 2.0 0.1 82.9 1.5Granola bar ................................... 5 0.4 0.4 0.1 0.0 0.6 0.1 22.1 1.2Pretzels ......................................... 2 0.0 0.0 0.2 0.3 2.2 0.0 15.3 1.8Rice or corn cakes ........................ 1 1.8 0.0 0.0 0.0 1.6 0.0 2.3 0.5
Frozen dessertsAll items ....................................... 33 50.8 1.8 0.0 0.1 0.3 0.0 71.6 0.5Ice cream ...................................... 28 58.8 0.6 0.0 0.2 0.4 0.0 83.7 0.5Non-dairy frozen desserts ............ 5 6.1 8.8 0.0 0.0 0.0 0.0 4.1 0.2
Salads with dressingAll items ....................................... 2 250.4 15.7 0.0 0.1 1.0 0.0 64.3 1.0Side salads ................................... 2 250.4 15.7 0.0 0.1 1.0 0.0 64.3 1.0
SnacksAll items ....................................... 45 8.1 8.6 0.0 0.0 1.1 0.2 36.8 0.8Chips ............................................ 30 8.7 5.1 0.0 0.1 1.4 0.2 45.4 0.9Chips - baked or reduced fat ........ 5 4.5 0.0 0.0 0.0 1.0 0.1 25.9 0.3Fruit roll-ups/fruit snacks .............. 5 5.4 46.4 0.0 0.0 0.0 0.1 9.2 0.4Popcorn ........................................ 5 10.5 0.0 0.0 0.0 0.4 0.0 23.5 0.5
Source: Cafeteria Survey and and Inventories of Competitive Foods.
—————————————————————————————————————————————————————————————————— Chapter 4: Competitive Foods: Nutritional Characteristics 88

———————————————————————————————————————————————————Table 4.10
Micronutrient Composition of Competitive Foods Available During the School Day, All Schools and Sources— Continued
———————————————————————————————————————————————————
Food Available Outside the School Cafeteria
Number ofitems
Mean amount per item
VitaminA
(RE)
VitaminC
(mg)
Thiamin(mg)
Riboflavin(mg)
Niacin(mg)
VitaminB6
(mg)
Calcium(mg)
Iron(mg)
Baked goods/dessertAll items ....................................... 2 298.6 0.3 0.3 0.4 4.1 0.4 27.0 3.6Pastries (danish, toaster pastries,
pies) ........................................ 2 298.6 0.3 0.3 0.4 4.1 0.4 27.0 3.6
BeveragesAll items ....................................... 3 4.1 122.0 0.0 0.0 0.0 0.0 36.9 0.9Juice-based drinks, 16-20 fl oz ..... 2 6.2 182.9 0.1 0.1 0.1 0.0 49.4 1.3Spring water ................................. 1 0.0 0.0 0.0 0.0 0.0 0.0 11.8 0.0
Bread or grain productsAll items ....................................... 5 66.4 5.7 0.2 0.2 2.7 0.2 114.3 4.1Cereal bars/cereal mixes .............. 4 83.1 7.0 0.2 0.2 2.8 0.3 133.2 4.8Crackers/Cracker Sandwiches ..... 1 0.0 0.2 0.2 0.1 2.4 0.0 38.7 1.1
Candy/gumAll items ....................................... 58 2.1 5.3 0.0 0.0 0.2 0.0 10.6 0.1Candy with chocolate ................... 9 12.9 0.2 0.0 0.0 1.1 0.0 45.1 0.5Candy with chocolate, single
piece or pop ............................ 3 2.2 0.0 0.0 0.0 0.0 0.0 15.8 0.0Candy without chocolate .............. 14 0.0 14.2 0.0 0.0 0.0 0.0 4.3 0.1Candy without chocolate, single
piece or pop ............................ 19 0.0 5.6 0.0 0.0 0.0 0.0 2.7 0.0Chewing gum ................................ 13 0.0 0.0 0.0 0.0 0.0 0.0 3.7 0.0
SnacksAll items ....................................... 12 2.1 2.8 0.0 0.0 0.9 0.0 18.3 0.7Chips ............................................ 10 2.5 3.4 0.0 0.0 1.1 0.0 21.2 0.6Meat snacks (jerky) ...................... 2 0.0 0.0 0.0 0.0 0.3 0.0 3.7 1.0
Source: Cafeteria Survey and and Inventories of Competitive Foods.
—————————————————————————————————————————————————————————————————— Chapter 4: Competitive Foods: Nutritional Characteristics 89

———————————————————————————————————————————————————Table 4.11
Food Guide Pyramid Servings for Competitive Foods Available During the School Day, All Schools andSources
———————————————————————————————————————————————————
Food Available Inside and Outside the School Cafeteria
Number ofitems
Mean number of servings per pyramid group Mean amount per item
Grain Vegetable Fruit Dairy Meat1Discre-tionary
Fat(g)
AddedSugars
(tsp)
Baked goods/dessertAll items ....................................... 27 1.7 0.0 0.0 0.0 0.0 13.3 7.2Cookies ......................................... 10 1.2 0.0 0.0 0.0 0.0 13.8 6.1Doughnuts .................................... 2 1.7 0.0 0.0 0.0 0.0 21.2 4.8Pastries (danish, toaster pastries,
pies) ........................................ 7 2.4 0.0 0.1 0.0 0.0 9.8 7.7Snack cakes ................................. 8 1.8 0.0 0.0 0.0 0.0 13.8 8.9
BeveragesAll items ....................................... 66 0.0 0.0 0.5 0.4 0.0 2.4 7.1Fruit juice, 100% juice .................. 7 0.0 0.0 2.2 0.0 0.0 0.0 0.0Iced tea drinks, fortified ................ 2 0.0 0.0 0.0 0.0 0.0 0.0 4.3Juice-based drink, fortified, 16-20
fl oz ......................................... 2 0.0 0.0 1.0 0.0 0.0 0.0 9.7Juice-based drinks, 11.5-12 fl oz .. 4 0.0 0.0 0.4 0.0 0.0 0.0 8.7Juice-based drinks, 16-20 fl oz ..... 8 0.0 0.0 0.4 0.0 0.0 0.0 13.8Juice-based drinks, fortified,
11.5-12 fl oz ............................ 23 0.0 0.0 0.3 0.0 0.0 0.0 8.8Milk, flavored, skim or 1% fat,
fortified .................................... 2 0.0 0.0 0.0 2.0 0.0 4.9 6.1Milk, flavored, whole or 2% fat,
fortified .................................... 9 0.6 0.0 0.0 1.9 0.0 14.0 6.5Milk, whole .................................... 1 0.0 0.0 0.0 2.0 0.0 15.4 0.0Sports drinks ................................. 1 0.0 0.0 0.0 0.0 0.0 0.0 9.0Spring water ................................. 5 0.0 0.0 0.0 0.0 0.0 0.0 0.0Yogurt drinks ................................ 2 0.0 0.0 1.4 0.4 0.0 4.1 7.4
Bread or grain productsAll items ....................................... 21 1.3 0.0 0.0 0.0 0.0 5.0 1.6Cereal bars/cereal mixes .............. 6 1.0 0.0 0.0 0.0 0.0 3.2 2.9Crackers/Cracker Sandwiches ..... 7 1.5 0.0 0.0 0.0 0.1 8.2 1.2Granola bar ................................... 5 1.0 0.0 0.0 0.0 0.1 5.4 1.7Pretzels ......................................... 2 2.6 0.0 0.0 0.0 0.0 0.0 0.0Rice or corn cakes ........................ 1 1.5 0.0 0.0 0.0 0.0 0.0 0.0
Candy/gumAll items ....................................... 58 0.0 0.0 0.0 0.0 0.0 2.9 5.8Candy with chocolate ................... 9 0.4 0.0 0.0 0.1 0.2 12.6 4.6Candy with chocolate, single
piece or pop ............................ 3 0.0 0.0 0.0 0.0 0.0 2.6 2.3Candy without chocolate .............. 14 0.0 0.0 0.0 0.0 0.0 2.0 11.8Candy without chocolate, single
piece or pop ............................ 19 0.0 0.0 0.0 0.0 0.0 1.1 4.8Chewing gum ................................ 13 0.0 0.0 0.0 0.0 0.0 0.0 2.5
Frozen dessertsAll items ....................................... 33 0.3 0.0 0.0 0.2 0.0 8.9 4.1Ice cream ...................................... 28 0.3 0.0 0.0 0.2 0.0 10.5 3.9Non-dairy frozen desserts ............ 5 0.0 0.0 0.2 0.0 0.0 0.0 5.3
Salads with dressingAll items ....................................... 2 0.2 1.5 0.0 0.0 0.2 12.0 0.3Side salads ................................... 2 0.2 1.5 0.0 0.0 0.2 12.0 0.3
1 Also includes legumes, soybean products, nuts, and seeds.
Source: Cafeteria Survey and and Inventories of Competitive Foods.
—————————————————————————————————————————————————————————————————— Chapter 4: Competitive Foods: Nutritional Characteristics 90

———————————————————————————————————————————————————Table 4.11
Food Guide Pyramid Servings for Competitive Foods Available During the School Day, All Schools andSources — Continued
———————————————————————————————————————————————————
Food Available Inside and Outside the School Cafeteria
Number ofitems
Mean number of servings per pyramid group Mean amount per item
Grain Vegetable Fruit Dairy Meat1Discre-tionary
Fat(g)
AddedSugars
(tsp)
SnacksAll items ....................................... 57 1.1 0.5 0.0 0.0 0.0 11.6 0.5Chips ............................................ 40 1.3 0.7 0.0 0.0 0.0 14.5 0.0Chips - baked or reduced fat ........ 5 0.9 0.7 0.0 0.0 0.0 8.1 0.4Fruit roll-ups/fruit snacks .............. 5 0.0 0.0 0.8 0.0 0.0 0.0 4.5Meat snacks (jerky) ...................... 2 0.0 0.0 0.0 0.0 0.5 3.3 0.0Popcorn ........................................ 5 1.2 0.0 0.0 0.0 0.0 7.2 0.0
1 Also includes legumes, soybean products, nuts, and seeds.
Source: Cafeteria Survey and and Inventories of Competitive Foods.
—————————————————————————————————————————————————————————————————— Chapter 4: Competitive Foods: Nutritional Characteristics 91
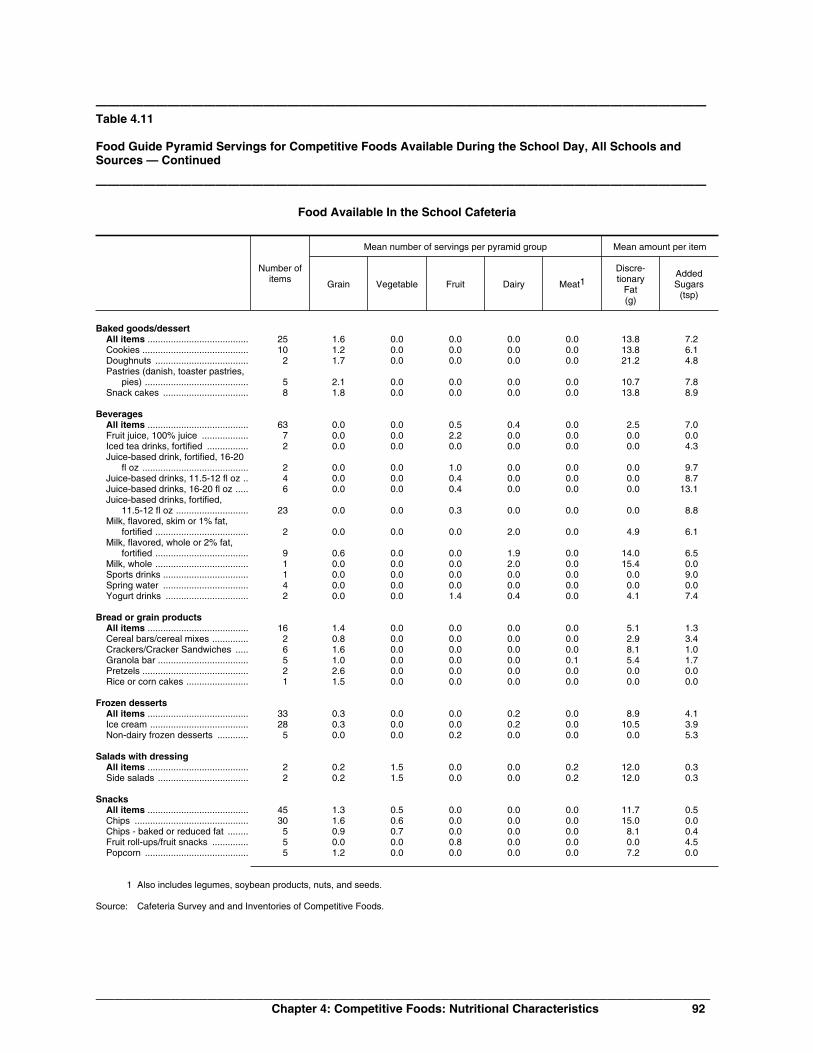
———————————————————————————————————————————————————Table 4.11
Food Guide Pyramid Servings for Competitive Foods Available During the School Day, All Schools andSources — Continued
———————————————————————————————————————————————————
Food Available In the School Cafeteria
Number ofitems
Mean number of servings per pyramid group Mean amount per item
Grain Vegetable Fruit Dairy Meat1Discre-tionary
Fat(g)
AddedSugars
(tsp)
Baked goods/dessertAll items ....................................... 25 1.6 0.0 0.0 0.0 0.0 13.8 7.2Cookies ......................................... 10 1.2 0.0 0.0 0.0 0.0 13.8 6.1Doughnuts .................................... 2 1.7 0.0 0.0 0.0 0.0 21.2 4.8Pastries (danish, toaster pastries,
pies) ........................................ 5 2.1 0.0 0.0 0.0 0.0 10.7 7.8Snack cakes ................................. 8 1.8 0.0 0.0 0.0 0.0 13.8 8.9
BeveragesAll items ....................................... 63 0.0 0.0 0.5 0.4 0.0 2.5 7.0Fruit juice, 100% juice .................. 7 0.0 0.0 2.2 0.0 0.0 0.0 0.0Iced tea drinks, fortified ................ 2 0.0 0.0 0.0 0.0 0.0 0.0 4.3Juice-based drink, fortified, 16-20
fl oz ......................................... 2 0.0 0.0 1.0 0.0 0.0 0.0 9.7Juice-based drinks, 11.5-12 fl oz .. 4 0.0 0.0 0.4 0.0 0.0 0.0 8.7Juice-based drinks, 16-20 fl oz ..... 6 0.0 0.0 0.4 0.0 0.0 0.0 13.1Juice-based drinks, fortified,
11.5-12 fl oz ............................ 23 0.0 0.0 0.3 0.0 0.0 0.0 8.8Milk, flavored, skim or 1% fat,
fortified .................................... 2 0.0 0.0 0.0 2.0 0.0 4.9 6.1Milk, flavored, whole or 2% fat,
fortified .................................... 9 0.6 0.0 0.0 1.9 0.0 14.0 6.5Milk, whole .................................... 1 0.0 0.0 0.0 2.0 0.0 15.4 0.0Sports drinks ................................. 1 0.0 0.0 0.0 0.0 0.0 0.0 9.0Spring water ................................. 4 0.0 0.0 0.0 0.0 0.0 0.0 0.0Yogurt drinks ................................ 2 0.0 0.0 1.4 0.4 0.0 4.1 7.4
Bread or grain productsAll items ....................................... 16 1.4 0.0 0.0 0.0 0.0 5.1 1.3Cereal bars/cereal mixes .............. 2 0.8 0.0 0.0 0.0 0.0 2.9 3.4Crackers/Cracker Sandwiches ..... 6 1.6 0.0 0.0 0.0 0.0 8.1 1.0Granola bar ................................... 5 1.0 0.0 0.0 0.0 0.1 5.4 1.7Pretzels ......................................... 2 2.6 0.0 0.0 0.0 0.0 0.0 0.0Rice or corn cakes ........................ 1 1.5 0.0 0.0 0.0 0.0 0.0 0.0
Frozen dessertsAll items ....................................... 33 0.3 0.0 0.0 0.2 0.0 8.9 4.1Ice cream ...................................... 28 0.3 0.0 0.0 0.2 0.0 10.5 3.9Non-dairy frozen desserts ............ 5 0.0 0.0 0.2 0.0 0.0 0.0 5.3
Salads with dressingAll items ....................................... 2 0.2 1.5 0.0 0.0 0.2 12.0 0.3Side salads ................................... 2 0.2 1.5 0.0 0.0 0.2 12.0 0.3
SnacksAll items ....................................... 45 1.3 0.5 0.0 0.0 0.0 11.7 0.5Chips ............................................ 30 1.6 0.6 0.0 0.0 0.0 15.0 0.0Chips - baked or reduced fat ........ 5 0.9 0.7 0.0 0.0 0.0 8.1 0.4Fruit roll-ups/fruit snacks .............. 5 0.0 0.0 0.8 0.0 0.0 0.0 4.5Popcorn ........................................ 5 1.2 0.0 0.0 0.0 0.0 7.2 0.0
1 Also includes legumes, soybean products, nuts, and seeds.
Source: Cafeteria Survey and and Inventories of Competitive Foods.
—————————————————————————————————————————————————————————————————— Chapter 4: Competitive Foods: Nutritional Characteristics 92

———————————————————————————————————————————————————Table 4.11
Food Guide Pyramid Servings for Competitive Foods Available During the School Day, All Schools andSources — Continued
———————————————————————————————————————————————————
Food Available Outside the School Cafeteria
Number ofitems
Mean number of servings per pyramid group Mean amount per item
Grain Vegetable Fruit Dairy Meat1Discre-tionary
Fat(g)
AddedSugars
(tsp)
Baked goods/dessertAll items ....................................... 2 3.2 0.0 0.1 0.0 0.0 7.4 7.7Pastries (danish, toaster pastries,
pies) ........................................ 2 3.2 0.0 0.1 0.0 0.0 7.4 7.7
BeveragesAll items ....................................... 3 0.0 0.0 0.2 0.0 0.0 0.0 10.7Juice-based drinks, 16-20 fl oz ..... 2 0.0 0.0 0.4 0.0 0.0 0.0 16.0Spring water ................................. 1 0.0 0.0 0.0 0.0 0.0 0.0 0.0
Bread or grain productsAll items ....................................... 5 1.0 0.0 0.0 0.0 0.0 4.5 2.7Cereal bars/cereal mixes .............. 4 1.0 0.0 0.0 0.0 0.0 3.4 2.6Crackers/Cracker Sandwiches ..... 1 0.7 0.0 0.0 0.0 0.3 8.9 2.8
Candy/gumAll items ....................................... 58 0.0 0.0 0.0 0.0 0.0 2.9 5.8Candy with chocolate ................... 9 0.4 0.0 0.0 0.1 0.2 12.6 4.6Candy with chocolate, single
piece or pop ............................ 3 0.0 0.0 0.0 0.0 0.0 2.6 2.3Candy without chocolate .............. 14 0.0 0.0 0.0 0.0 0.0 2.0 11.8Candy without chocolate, single
piece or pop ............................ 19 0.0 0.0 0.0 0.0 0.0 1.1 4.8Chewing gum ................................ 13 0.0 0.0 0.0 0.0 0.0 0.0 2.5
SnacksAll items ....................................... 12 0.4 0.8 0.0 0.0 0.0 11.2 0.1Chips ............................................ 10 0.5 0.9 0.0 0.0 0.0 12.7 0.2Meat snacks (jerky) ...................... 2 0.0 0.0 0.0 0.0 0.5 3.3 0.0
1 Also includes legumes, soybean products, nuts, and seeds.
Source: Cafeteria Survey and and Inventories of Competitive Foods.
—————————————————————————————————————————————————————————————————— Chapter 4: Competitive Foods: Nutritional Characteristics 93

———————————————————————————————————————————————————Table 4.12
Competitive Foods Meeting FDA Regulations for Nutrient Content Claims: Foods Available During theSchool Day, All Schools and Sources
———————————————————————————————————————————————————Food Available Inside and Outside the School Cafeteria
Numberof items
Percent of items meeting FDA labeling criteria1
Caloriefree
Lowcalorie
Fat free(total fat)
Low fat(total fat)
Lowsaturated
fat
Choleste-rol
free
Lowcholeste-
rol
Sodiumfree
LowSodium
Baked goods/dessertAll items ....................................... 27 0.0 0.0 0.0 0.0 18.5 25.9 29.6 0.0 22.2Cakes/cookies/doughnuts/pastries 27 0.0 0.0 0.0 0.0 18.5 25.9 29.6 0.0 22.2
BeveragesAll items ....................................... 66 7.6 0.0 80.3 3.0 83.3 78.8 4.5 1.5 75.8Fruit juice/juice-based drinks ...... 47 0.0 0.0 97.9 2.1 100.0 100.0 0.0 2.1 91.5Milk and yogurt-based drinks .... 14 0.0 0.0 14.3 7.1 21.4 0.0 21.4 0.0 14.3Spring water ............. 5 100.0 0.0 100.0 0.0 100.0 100.0 0.0 0.0 100.0
Bread or grain productsAll items ....................................... 21 0.0 0.0 0.0 23.8 52.4 61.9 28.6 0.0 23.8Cereal bars and cereal products 14 0.0 0.0 0.0 35.7 71.4 71.4 28.6 0.0 35.7Crackers/Cracker Sandwiches 7 0.0 0.0 0.0 0.0 14.3 42.9 28.6 0.0 0.0
Candy/gumAll items ....................................... 58 0.0 0.0 48.3 3.4 81.0 81.0 19.0 22.4 72.4Candy with chocolate ....... 12 0.0 0.0 8.3 0.0 8.3 8.3 91.7 0.0 75.0Candy without chocolate ..... 33 0.0 0.0 42.4 6.1 100.0 100.0 0.0 0.0 100.0Chewing gum ........... 13 0.0 0.0 100.0 0.0 100.0 100.0 0.0 100.0 0.0
Frozen dessertsAll items ....................................... 33 0.0 0.0 15.2 0.0 15.2 15.2 27.3 6.1 90.9Ice cream ............... 28 0.0 0.0 0.0 0.0 0.0 0.0 32.1 0.0 96.4Non-dairy frozen desserts ..... 5 0.0 0.0 100.0 0.0 100.0 100.0 0.0 40.0 60.0
Salads with dressingAll items ....................................... 2 0.0 0.0 0.0 0.0 0.0 50.0 0.0 0.0 0.0Side salads .............. 2 0.0 0.0 0.0 0.0 0.0 50.0 0.0 0.0 0.0
SnacksAll items ....................................... 57 0.0 0.0 0.0 8.8 17.5 52.6 5.3 0.0 3.5Chips - baked or reduced fat .... 5 0.0 0.0 0.0 0.0 100.0 100.0 0.0 0.0 0.0Chips/Popcorn ........... 45 0.0 0.0 0.0 0.0 0.0 44.4 6.7 0.0 0.0Fruit roll-ups/fruit snacks ......... 5 0.0 0.0 0.0 100.0 100.0 100.0 0.0 0.0 40.0Meat snacks (jerky) ......... 2 0.0 0.0 0.0 0.0 0.0 0.0 0.0 0.0 0.0
1 Items identified as low-calorie do not include items identified as calorie-free, and similarly for other categories.
Note: Some food categories have been combined due to small numbers of items.
Source: Cafeteria Survey and and Inventories of Competitive Foods.
—————————————————————————————————————————————————————————————————— Chapter 4: Competitive Foods: Nutritional Characteristics 94

———————————————————————————————————————————————————Table 4.12
Competitive Foods Meeting FDA Regulations for Nutrient Content Claims: Foods Available During theSchool Day, All Schools and Sources — Continued
———————————————————————————————————————————————————Food Available In the School Cafeteria
Numberof items
Percent of items meeting FDA labeling criteria1
Caloriefree
Lowcalorie
Fat free(total fat)
Low fat(total fat)
Lowsaturated
fat
Choleste-rol
free
Lowcholeste-
rol
Sodiumfree
LowSodium
Baked goods/dessertAll items ....................................... 25 0.0 0.0 0.0 0.0 12.0 20.0 32.0 0.0 24.0Cakes/cookies/doughnuts/pastries 25 0.0 0.0 0.0 0.0 12.0 20.0 32.0 0.0 24.0
BeveragesAll items ....................................... 63 6.3 0.0 79.4 3.2 82.5 77.8 4.8 1.6 74.6Fruit juice/juice-based drinks ...... 45 0.0 0.0 97.8 2.2 100.0 100.0 0.0 2.2 91.1Milk and yogurt-based drinks .... 14 0.0 0.0 14.3 7.1 21.4 0.0 21.4 0.0 14.3Spring water ............. 4 100.0 0.0 100.0 0.0 100.0 100.0 0.0 0.0 100.0
Bread or grain productsAll items ....................................... 16 0.0 0.0 0.0 25.0 43.8 50.0 37.5 0.0 25.0Cereal bars and cereal products 10 0.0 0.0 0.0 40.0 60.0 60.0 40.0 0.0 40.0Crackers/Cracker Sandwiches 6 0.0 0.0 0.0 0.0 16.7 33.3 33.3 0.0 0.0
Frozen dessertsAll items ....................................... 33 0.0 0.0 15.2 0.0 15.2 15.2 27.3 6.1 90.9Ice cream ............... 28 0.0 0.0 0.0 0.0 0.0 0.0 32.1 0.0 96.4Non-dairy frozen desserts ..... 5 0.0 0.0 100.0 0.0 100.0 100.0 0.0 40.0 60.0
Salads with dressingAll items ....................................... 2 0.0 0.0 0.0 0.0 0.0 50.0 0.0 0.0 0.0Side salads .............. 2 0.0 0.0 0.0 0.0 0.0 50.0 0.0 0.0 0.0
SnacksAll items ....................................... 45 0.0 0.0 0.0 11.1 22.2 57.8 6.7 0.0 4.4Chips - baked or reduced fat .... 5 0.0 0.0 0.0 0.0 100.0 100.0 0.0 0.0 0.0Chips/Popcorn ........... 35 0.0 0.0 0.0 0.0 0.0 45.7 8.6 0.0 0.0Fruit roll-ups/fruit snacks ......... 5 0.0 0.0 0.0 100.0 100.0 100.0 0.0 0.0 40.0
1 Items identified as low-calorie do not include items identified as calorie-free, and similarly for other categories.
Note: Some food categories have been combined due to small numbers of items.
Source: Cafeteria Survey and and Inventories of Competitive Foods.
—————————————————————————————————————————————————————————————————— Chapter 4: Competitive Foods: Nutritional Characteristics 95

———————————————————————————————————————————————————Table 4.12
Competitive Foods Meeting FDA Regulations for Nutrient Content Claims: Foods Available During theSchool Day, All Schools and Sources — Continued
———————————————————————————————————————————————————Food Available Outside the School Cafeteria
Numberof items
Percent of items meeting FDA labeling criteria1
Caloriefree
Lowcalorie
Fat free(total fat)
Low fat(total fat)
Lowsaturated
fat
Choleste-rol
free
Lowcholeste-
rol
Sodiumfree
LowSodium
Baked goods/dessertAll items ....................................... 2 0.0 0.0 0.0 0.0 100.0 100.0 0.0 0.0 0.0Cakes/cookies/doughnuts/pastries 2 0.0 0.0 0.0 0.0 100.0 100.0 0.0 0.0 0.0
BeveragesAll items ....................................... 3 33.3 0.0 100.0 0.0 100.0 100.0 0.0 0.0 100.0Fruit juice/juice-based drinks ...... 2 0.0 0.0 100.0 0.0 100.0 100.0 0.0 0.0 100.0Spring water ............. 1 100.0 0.0 100.0 0.0 100.0 100.0 0.0 0.0 100.0
Bread or grain productsAll items ....................................... 5 0.0 0.0 0.0 20.0 80.0 100.0 0.0 0.0 20.0Cereal bars and cereal products 4 0.0 0.0 0.0 25.0 100.0 100.0 0.0 0.0 25.0Crackers/Cracker Sandwiches 1 0.0 0.0 0.0 0.0 0.0 100.0 0.0 0.0 0.0
Candy/gumAll items ....................................... 58 0.0 0.0 48.3 3.4 81.0 81.0 19.0 22.4 72.4Candy with chocolate ....... 12 0.0 0.0 8.3 0.0 8.3 8.3 91.7 0.0 75.0Candy without chocolate ..... 33 0.0 0.0 42.4 6.1 100.0 100.0 0.0 0.0 100.0Chewing gum ........... 13 0.0 0.0 100.0 0.0 100.0 100.0 0.0 100.0 0.0
SnacksAll items ....................................... 12 0.0 0.0 0.0 0.0 0.0 33.3 0.0 0.0 0.0Chips/Popcorn ........... 10 0.0 0.0 0.0 0.0 0.0 40.0 0.0 0.0 0.0Meat snacks (jerky) ......... 2 0.0 0.0 0.0 0.0 0.0 0.0 0.0 0.0 0.0
1 Items identified as low-calorie do not include items identified as calorie-free, and similarly for other categories.
Note: Some food categories have been combined due to small numbers of items.
Source: Cafeteria Survey and and Inventories of Competitive Foods.
—————————————————————————————————————————————————————————————————— Chapter 4: Competitive Foods: Nutritional Characteristics 96

Abt Associates Inc. Chapter 4: Competitive Foods: Nutritional Characteristics 97
Weighted Tables

———————————————————————————————————————————————————Table 4.14
Food Energy and Macronutrient Composition of Competitive Foods Available During the School Day,Weighted by Sales, All Schools and Sources
———————————————————————————————————————————————————
Food Available Inside and Outside the School Cafeteria
Numberof items
Numbersold
Meancaloriesper item
Mean amount per item Mean percent ofcalories from
Totalfat(g)
Satura-ted fat
(g)
Carbo-hydrate
(g)
Protein(g)
Choles-terol(mg)
Sodium(mg)
Dietaryfiber(g)
Totalfat
Satura-tedfat
Baked goods/dessertAll items ....................................... 26 2580 342.0 17.0 4.6 46.0 3.8 16.3 268.0 1.7 44.1 11.8Cookies ......................................... 10 2056 334.9 17.1 5.1 44.4 3.7 8.9 247.7 1.8 45.3 13.4Doughnuts .................................... 2 72 380.6 22.9 5.0 41.5 4.3 40.4 414.6 1.5 53.9 11.6Pastries (danish, toaster pastries,
pies) ........................................ 6 209 335.0 11.2 2.1 55.4 4.3 28.2 286.9 1.8 28.3 5.3Snack cakes ................................. 8 243 406.3 17.4 3.8 60.8 3.8 14.7 248.2 1.2 37.9 8.3
BeveragesAll items ....................................... 51 4220 183.3 0.3 0.2 45.6 0.6 1.1 69.7 0.4 0.8 0.5Fruit juice, 100% juice .................. 5 207 184.1 0.5 0.0 44.1 1.9 0.0 13.4 0.7 2.4 0.3Iced tea drinks, fortified ................ 2 137 130.0 0.0 0.0 33.0 0.0 0.0 9.9 0.0 0.0 0.0Juice-based drink, fortified, 16-20
fl oz ......................................... 1 15 254.4 0.0 0.0 62.4 0.0 0.0 370.0 0.0 0.0 0.0Juice-based drinks, 11.5-12 fl oz .. 1 9 166.9 0.0 0.0 42.3 0.0 0.0 78.1 0.4 0.0 0.0Juice-based drinks, 16-20 fl oz ..... 7 774 275.4 0.0 0.0 70.3 0.2 0.0 95.3 0.6 0.3 0.0Juice-based drinks, fortified,
11.5-12 fl oz ............................ 20 1671 186.7 0.0 0.0 47.2 0.5 0.0 60.1 0.4 0.1 0.0Milk, flavored, skim or 1% fat,
fortified .................................... 2 35 311.6 5.9 3.6 54.6 16.7 20.1 268.6 2.7 16.1 9.8Milk, flavored, whole or 2% fat,
fortified .................................... 7 123 414.9 15.5 9.6 54.9 15.4 58.2 273.2 2.4 33.5 20.8Milk, whole .................................... 1 9 299.8 16.3 10.2 22.7 16.1 66.4 239.1 0.0 48.9 30.5Sports drinks ................................. 0 – – – – – – – – – – –Spring water ................................. 3 1233 0.0 0.0 0.0 0.0 0.0 0.0 14.7 0.0 0.0 0.0Yogurt drinks ................................ 2 7 240.0 0.0 0.0 59.5 4.9 16.0 77.3 2.9 0.0 0.0
Bread or grain productsAll items ....................................... 18 1209 188.5 7.4 2.2 26.9 4.3 2.1 379.7 1.2 32.9 9.9Cereal bars/cereal mixes .............. 5 148 163.8 4.7 1.0 28.8 3.0 0.5 265.3 1.1 25.2 5.3Crackers/Cracker Sandwiches ..... 5 843 206.9 10.2 2.9 24.1 4.7 2.7 402.5 0.6 44.4 12.4Granola bar ................................... 5 110 168.8 6.4 4.5 25.1 3.7 0.0 104.8 1.2 33.7 23.3Pretzels ......................................... 2 33 162.0 1.5 0.3 33.7 3.9 0.0 729.3 1.4 8.2 1.8Rice or corn cakes ........................ 1 75 99.1 0.8 0.1 20.7 2.5 0.0 74.3 0.8 7.3 1.1
Candy/gumAll items ....................................... 58 5332 111.7 2.3 0.7 24.1 0.5 0.4 24.2 0.1 12.0 3.7Candy with chocolate ................... 9 295 253.9 12.9 5.0 31.5 3.5 3.5 93.5 1.2 45.3 17.8Candy with chocolate, single
piece or pop ............................ 3 100 63.3 1.9 1.1 11.9 0.4 1.3 8.4 0.1 26.8 16.2Candy without chocolate .............. 14 846 213.6 2.5 0.6 49.4 0.3 0.0 38.4 0.0 9.6 2.1Candy without chocolate, single
piece or pop ............................ 19 3929 65.7 0.8 0.2 15.2 0.1 0.0 13.5 0.0 10.8 2.5Chewing gum ................................ 13 162 68.3 0.0 0.0 22.0 0.0 0.0 1.5 0.0 1.1 0.2
Frozen dessertsAll items ....................................... 27 857 196.6 10.0 5.4 25.2 3.4 24.3 55.3 0.7 45.0 24.3Ice cream ...................................... 23 819 200.1 10.4 5.6 25.1 3.5 25.3 57.0 0.7 46.7 25.1Non-dairy frozen desserts ............ 4 38 114.1 0.0 0.0 29.3 0.4 0.0 17.0 0.0 0.2 0.0
– Data not available.Note: Number of items is the number offered at the three schools. Number sold is the total sales for the three schools.
Estimates are the result of weighting items by the number sold within school, and then giving equal weight to schools.Weighted and unweighted results may be identical for subcategories with small numbers of items offered at each school.
Source: Cafeteria Survey and and Inventories of Competitive Foods.
—————————————————————————————————————————————————————————————————— Chapter 4: Competitive Foods: Nutritional Characteristics 99
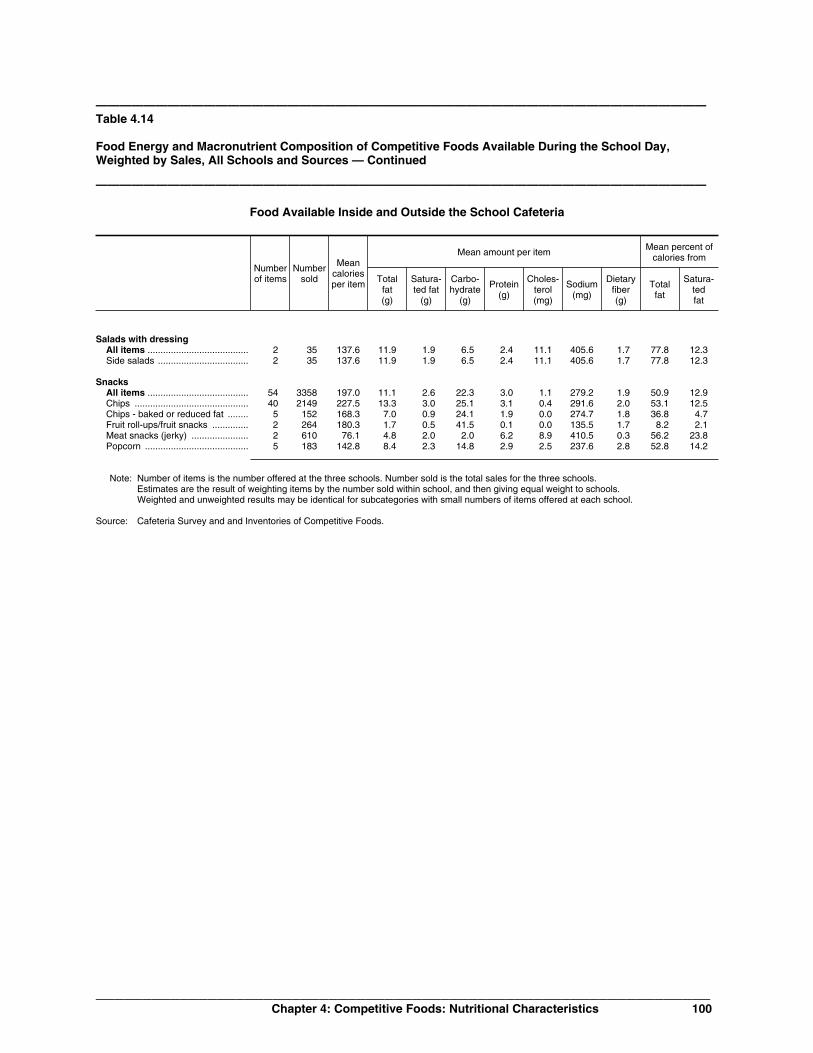
———————————————————————————————————————————————————Table 4.14
Food Energy and Macronutrient Composition of Competitive Foods Available During the School Day,Weighted by Sales, All Schools and Sources — Continued
———————————————————————————————————————————————————
Food Available Inside and Outside the School Cafeteria
Numberof items
Numbersold
Meancaloriesper item
Mean amount per item Mean percent ofcalories from
Totalfat(g)
Satura-ted fat
(g)
Carbo-hydrate
(g)
Protein(g)
Choles-terol(mg)
Sodium(mg)
Dietaryfiber(g)
Totalfat
Satura-tedfat
Salads with dressingAll items ....................................... 2 35 137.6 11.9 1.9 6.5 2.4 11.1 405.6 1.7 77.8 12.3Side salads ................................... 2 35 137.6 11.9 1.9 6.5 2.4 11.1 405.6 1.7 77.8 12.3
SnacksAll items ....................................... 54 3358 197.0 11.1 2.6 22.3 3.0 1.1 279.2 1.9 50.9 12.9Chips ............................................ 40 2149 227.5 13.3 3.0 25.1 3.1 0.4 291.6 2.0 53.1 12.5Chips - baked or reduced fat ........ 5 152 168.3 7.0 0.9 24.1 1.9 0.0 274.7 1.8 36.8 4.7Fruit roll-ups/fruit snacks .............. 2 264 180.3 1.7 0.5 41.5 0.1 0.0 135.5 1.7 8.2 2.1Meat snacks (jerky) ...................... 2 610 76.1 4.8 2.0 2.0 6.2 8.9 410.5 0.3 56.2 23.8Popcorn ........................................ 5 183 142.8 8.4 2.3 14.8 2.9 2.5 237.6 2.8 52.8 14.2
Note: Number of items is the number offered at the three schools. Number sold is the total sales for the three schools.Estimates are the result of weighting items by the number sold within school, and then giving equal weight to schools.Weighted and unweighted results may be identical for subcategories with small numbers of items offered at each school.
Source: Cafeteria Survey and and Inventories of Competitive Foods.
—————————————————————————————————————————————————————————————————— Chapter 4: Competitive Foods: Nutritional Characteristics 100

———————————————————————————————————————————————————Table 4.14
Food Energy and Macronutrient Composition of Competitive Foods Available During the School Day,Weighted by Sales, All Schools and Sources — Continued
———————————————————————————————————————————————————
Food Available In the School Cafeteria
Numberof items
Numbersold
Meancaloriesper item
Mean amount per item Mean percent ofcalories from
Totalfat(g)
Satura-ted fat
(g)
Carbo-hydrate
(g)
Protein(g)
Choles-terol(mg)
Sodium(mg)
Dietaryfiber(g)
Totalfat
Satura-tedfat
Baked goods/dessertAll items ....................................... 24 2523 341.5 17.1 4.6 45.7 3.8 16.5 266.0 1.7 44.4 12.0Cookies ......................................... 10 2056 334.9 17.1 5.1 44.4 3.7 8.9 247.7 1.8 45.3 13.4Doughnuts .................................... 2 72 380.6 22.9 5.0 41.5 4.3 40.4 414.6 1.5 53.9 11.6Pastries (danish, toaster pastries,
pies) ........................................ 4 152 338.3 12.2 2.3 53.9 4.4 37.5 281.3 1.8 30.3 5.8Snack cakes ................................. 8 243 406.3 17.4 3.8 60.8 3.8 14.7 248.2 1.2 37.9 8.3
BeveragesAll items ....................................... 48 4028 175.8 0.3 0.2 43.7 0.6 1.1 66.3 0.4 0.8 0.5Fruit juice, 100% juice .................. 5 207 184.1 0.5 0.0 44.1 1.9 0.0 13.4 0.7 2.4 0.3Iced tea drinks, fortified ................ 2 137 130.0 0.0 0.0 33.0 0.0 0.0 9.9 0.0 0.0 0.0Juice-based drink, fortified, 16-20
fl oz ......................................... 1 15 254.4 0.0 0.0 62.4 0.0 0.0 370.0 0.0 0.0 0.0Juice-based drinks, 11.5-12 fl oz .. 1 9 166.9 0.0 0.0 42.3 0.0 0.0 78.1 0.4 0.0 0.0Juice-based drinks, 16-20 fl oz ..... 5 631 267.8 0.1 0.0 68.7 0.2 0.0 75.0 0.5 0.4 0.0Juice-based drinks, fortified,
11.5-12 fl oz ............................ 20 1671 186.7 0.0 0.0 47.2 0.5 0.0 60.1 0.4 0.1 0.0Milk, flavored, skim or 1% fat,
fortified .................................... 2 35 311.6 5.9 3.6 54.6 16.7 20.1 268.6 2.7 16.1 9.8Milk, flavored, whole or 2% fat,
fortified .................................... 7 123 414.9 15.5 9.6 54.9 15.4 58.2 273.2 2.4 33.5 20.8Milk, whole .................................... 1 9 299.8 16.3 10.2 22.7 16.1 66.4 239.1 0.0 48.9 30.5Sports drinks ................................. 0 – – – – – – – – – – –Spring water ................................. 2 1184 0.0 0.0 0.0 0.0 0.0 0.0 14.6 0.0 0.0 0.0Yogurt drinks ................................ 2 7 240.0 0.0 0.0 59.5 4.9 16.0 77.3 2.9 0.0 0.0
Bread or grain productsAll items ....................................... 13 1124 154.4 5.0 1.7 24.3 3.3 1.7 430.6 0.9 23.3 7.8Cereal bars/cereal mixes .............. 1 83 141.0 3.7 0.7 26.9 1.1 0.0 161.5 0.1 23.8 4.7Crackers/Cracker Sandwiches ..... 4 823 220.1 10.8 3.6 26.2 4.4 4.6 447.4 0.8 44.0 14.8Granola bar ................................... 5 110 168.8 6.4 4.5 25.1 3.7 0.0 104.8 1.2 33.7 23.3Pretzels ......................................... 2 33 162.0 1.5 0.3 33.7 3.9 0.0 729.3 1.4 8.2 1.8Rice or corn cakes ........................ 1 75 99.1 0.8 0.1 20.7 2.5 0.0 74.3 0.8 7.3 1.1
Frozen dessertsAll items ....................................... 27 857 196.6 10.0 5.4 25.2 3.4 24.3 55.3 0.7 45.0 24.3Ice cream ...................................... 23 819 200.1 10.4 5.6 25.1 3.5 25.3 57.0 0.7 46.7 25.1Non-dairy frozen desserts ............ 4 38 114.1 0.0 0.0 29.3 0.4 0.0 17.0 0.0 0.2 0.0
Salads with dressingAll items ....................................... 2 35 137.6 11.9 1.9 6.5 2.4 11.1 405.6 1.7 77.8 12.3Side salads ................................... 2 35 137.6 11.9 1.9 6.5 2.4 11.1 405.6 1.7 77.8 12.3
SnacksAll items ....................................... 42 2631 213.6 11.9 2.7 24.8 2.9 0.7 282.6 2.1 49.9 11.9Chips ............................................ 30 2032 227.0 13.3 3.1 25.0 3.1 0.4 290.1 2.0 53.4 12.9Chips - baked or reduced fat ........ 5 152 168.3 7.0 0.9 24.1 1.9 0.0 274.7 1.8 36.8 4.7Fruit roll-ups/fruit snacks .............. 2 264 180.3 1.7 0.5 41.5 0.1 0.0 135.5 1.7 8.2 2.1Popcorn ........................................ 5 183 142.8 8.4 2.3 14.8 2.9 2.5 237.6 2.8 52.8 14.2
– Data not available.Note: Number of items is the number offered at the three schools. Number sold is the total sales for the three schools.
Estimates are the result of weighting items by the number sold within school, and then giving equal weight to schools.Weighted and unweighted results may be identical for subcategories with small numbers of items offered at each school.
Source: Cafeteria Survey and and Inventories of Competitive Foods.
—————————————————————————————————————————————————————————————————— Chapter 4: Competitive Foods: Nutritional Characteristics 101

———————————————————————————————————————————————————Table 4.14
Food Energy and Macronutrient Composition of Competitive Foods Available During the School Day,Weighted by Sales, All Schools and Sources — Continued
———————————————————————————————————————————————————
Food Available Outside the School Cafeteria
Numberof items
Numbersold
Meancaloriesper item
Mean amount per item Mean percent ofcalories from
Totalfat(g)
Satura-ted fat
(g)
Carbo-hydrate
(g)
Protein(g)
Choles-terol(mg)
Sodium(mg)
Dietaryfiber(g)
Totalfat
Satura-tedfat
Baked goods/dessertAll items ....................................... 2 57 408.9 10.6 1.6 74.0 4.9 0.0 436.0 2.2 23.4 3.5Pastries (danish, toaster pastries,
pies) ........................................ 2 57 408.9 10.6 1.6 74.0 4.9 0.0 436.0 2.2 23.4 3.5
BeveragesAll items ....................................... 3 192 216.3 0.0 0.0 54.8 0.0 0.0 105.8 0.5 0.0 0.0Juice-based drinks, 16-20 fl oz ..... 2 143 290.5 0.0 0.0 73.5 0.0 0.0 136.0 0.6 0.0 0.0Spring water ................................. 1 49 0.0 0.0 0.0 0.0 0.0 0.0 17.8 0.0 0.0 0.0
Bread or grain productsAll items ....................................... 5 85 188.2 6.5 1.5 28.6 4.9 0.9 366.4 1.7 30.8 6.8Cereal bars/cereal mixes .............. 4 65 186.6 5.6 1.3 30.6 4.9 0.9 369.2 2.1 26.6 5.9Crackers/Cracker Sandwiches ..... 1 20 193.7 9.6 2.1 22.0 5.0 0.8 357.6 0.4 44.7 9.9
Candy/gumAll items ....................................... 58 5332 111.7 2.3 0.7 24.1 0.5 0.4 24.2 0.1 12.0 3.7Candy with chocolate ................... 9 295 253.9 12.9 5.0 31.5 3.5 3.5 93.5 1.2 45.3 17.8Candy with chocolate, single
piece or pop ............................ 3 100 63.3 1.9 1.1 11.9 0.4 1.3 8.4 0.1 26.8 16.2Candy without chocolate .............. 14 846 213.6 2.5 0.6 49.4 0.3 0.0 38.4 0.0 9.6 2.1Candy without chocolate, single
piece or pop ............................ 19 3929 65.7 0.8 0.2 15.2 0.1 0.0 13.5 0.0 10.8 2.5Chewing gum ................................ 13 162 68.3 0.0 0.0 22.0 0.0 0.0 1.5 0.0 1.1 0.2
SnacksAll items ....................................... 12 727 106.4 6.5 1.8 9.3 3.2 3.2 240.5 0.8 55.1 18.2Chips ............................................ 10 117 217.8 14.2 3.3 21.3 2.5 0.1 261.1 1.6 57.4 13.4Meat snacks (jerky) ...................... 2 610 76.1 4.8 2.0 2.0 6.2 8.9 410.5 0.3 56.2 23.8
Note: Number of items is the number offered at the three schools. Number sold is the total sales for the three schools.Estimates are the result of weighting items by the number sold within school, and then giving equal weight to schools.Weighted and unweighted results may be identical for subcategories with small numbers of items offered at each school.
Source: Cafeteria Survey and and Inventories of Competitive Foods.
—————————————————————————————————————————————————————————————————— Chapter 4: Competitive Foods: Nutritional Characteristics 102

———————————————————————————————————————————————————Table 4.15
Micronutrient Composition of Competitive Foods Available During the School Day, Weighted by Sales, AllSchools and Sources
———————————————————————————————————————————————————
Food Available Inside and Outside the School Cafeteria
Numberof items
Numbersold
Mean amount per item
VitaminA
(RE)
VitaminC
(mg)
Thiamin(mg)
Riboflavin(mg)
Niacin(mg)
VitaminB6
(mg)
Calcium(mg)
Iron(mg)
Baked goods/dessertAll items ....................................... 26 2580 53.6 0.3 0.2 0.2 1.6 0.0 38.9 2.0Cookies ......................................... 10 2056 38.2 0.2 0.1 0.2 1.5 0.0 21.4 1.9Doughnuts .................................... 2 72 20.4 0.1 0.2 0.1 1.3 0.0 33.6 1.9Pastries (danish, toaster pastries,
pies) ........................................ 6 209 201.0 0.9 0.4 0.4 4.2 0.4 138.3 2.2Snack cakes ................................. 8 243 7.1 0.2 0.2 0.2 1.7 0.0 62.9 2.6
BeveragesAll items ....................................... 51 4220 39.4 46.8 0.0 0.0 0.6 0.0 64.2 0.7Fruit juice, 100% juice .................. 5 207 41.1 140.6 0.2 0.0 0.8 0.2 258.2 1.3Iced tea drinks, fortified ................ 2 137 0.0 60.0 0.0 0.0 4.0 0.4 100.0 0.0Juice-based drink, fortified, 16-20
fl oz ......................................... 1 15 231.3 75.2 0.7 0.0 0.2 0.0 23.1 0.2Juice-based drinks, 11.5-12 fl oz .. 1 9 3.6 105.1 0.0 0.0 0.0 0.0 28.4 0.8Juice-based drinks, 16-20 fl oz ..... 7 774 15.4 80.8 0.1 0.1 0.1 0.0 38.4 1.2Juice-based drinks, fortified,
11.5-12 fl oz ............................ 20 1671 76.6 88.2 0.1 0.1 1.3 0.1 48.7 0.7Milk, flavored, skim or 1% fat,
fortified .................................... 2 35 284.4 16.2 0.2 0.7 0.6 0.2 693.9 1.3Milk, flavored, whole or 2% fat,
fortified .................................... 7 123 155.0 4.5 0.2 0.8 0.5 0.2 807.9 0.9Milk, whole .................................... 1 9 151.3 4.6 0.2 0.8 0.4 0.2 582.7 0.2Sports drinks ................................. 0 – – – – – – – – –Spring water ................................. 3 1233 0.0 0.0 0.0 0.0 0.0 0.0 9.8 0.0Yogurt drinks ................................ 2 7 51.1 60.0 0.1 0.3 0.7 0.4 250.0 0.7
Bread or grain productsAll items ....................................... 18 1209 18.3 3.8 0.2 0.2 2.9 0.2 48.7 3.1Cereal bars/cereal mixes .............. 5 148 70.6 7.9 0.2 0.2 3.3 0.3 24.5 3.6Crackers/Cracker Sandwiches ..... 5 843 6.1 0.2 0.2 0.2 2.2 0.1 56.7 1.5Granola bar ................................... 5 110 0.4 0.4 0.1 0.0 0.7 0.1 22.6 1.2Pretzels ......................................... 2 33 0.0 0.0 0.2 0.3 2.2 0.0 15.3 1.8Rice or corn cakes ........................ 1 75 1.8 0.0 0.0 0.0 1.6 0.0 2.3 0.5
Candy/gumAll items ....................................... 58 5332 1.4 4.5 0.0 0.0 0.1 0.0 7.5 0.0Candy with chocolate ................... 9 295 12.8 0.2 0.0 0.1 1.1 0.0 45.9 0.5Candy with chocolate, single
piece or pop ............................ 3 100 1.7 0.0 0.0 0.0 0.0 0.0 12.0 0.0Candy without chocolate .............. 14 846 0.0 15.2 0.0 0.0 0.0 0.0 5.1 0.1Candy without chocolate, single
piece or pop ............................ 19 3929 0.0 4.1 0.0 0.0 0.0 0.0 1.9 0.0Chewing gum ................................ 13 162 0.0 0.0 0.0 0.0 0.0 0.0 2.8 0.0
Frozen dessertsAll items ....................................... 27 857 57.0 0.5 0.0 0.2 0.4 0.0 82.1 0.5Ice cream ...................................... 23 819 59.1 0.5 0.0 0.2 0.4 0.0 85.4 0.6Non-dairy frozen desserts ............ 4 38 0.7 2.6 0.0 0.0 0.0 0.0 2.0 0.1
– Data not available.Note: Number of items is the number offered at the three schools. Number sold is the total sales for the three schools.
Estimates are the result of weighting items by the number sold within school, and then giving equal weight to schools.Weighted and unweighted results may be identical for subcategories with small numbers of items offered at each school.
Source: Cafeteria Survey and and Inventories of Competitive Foods.
—————————————————————————————————————————————————————————————————— Chapter 4: Competitive Foods: Nutritional Characteristics 103

———————————————————————————————————————————————————Table 4.15
Micronutrient Composition of Competitive Foods Available During the School Day, Weighted by Sales, AllSchools and Sources — Continued
———————————————————————————————————————————————————
Food Available Inside and Outside the School Cafeteria
Numberof items
Numbersold
Mean amount per item
VitaminA
(RE)
VitaminC
(mg)
Thiamin(mg)
Riboflavin(mg)
Niacin(mg)
VitaminB6
(mg)
Calcium(mg)
Iron(mg)
Salads with dressingAll items ....................................... 2 35 268.2 13.7 0.0 0.0 0.7 0.0 44.7 0.8Side salads ................................... 2 35 268.2 13.7 0.0 0.0 0.7 0.0 44.7 0.8
SnacksAll items ....................................... 54 3358 7.0 4.2 0.0 0.0 0.9 0.1 34.6 0.7Chips ............................................ 40 2149 7.5 3.5 0.0 0.0 1.0 0.1 41.3 0.7Chips - baked or reduced fat ........ 5 152 2.3 0.0 0.0 0.0 1.1 0.1 32.9 0.3Fruit roll-ups/fruit snacks .............. 2 264 5.9 50.0 0.0 0.0 0.0 0.1 9.8 0.4Meat snacks (jerky) ...................... 2 610 0.0 0.0 0.0 0.0 0.3 0.0 3.7 1.0Popcorn ........................................ 5 183 10.5 0.0 0.0 0.0 0.4 0.0 23.5 0.5
Note: Number of items is the number offered at the three schools. Number sold is the total sales for the three schools.Estimates are the result of weighting items by the number sold within school, and then giving equal weight to schools.Weighted and unweighted results may be identical for subcategories with small numbers of items offered at each school.
Source: Cafeteria Survey and and Inventories of Competitive Foods.
—————————————————————————————————————————————————————————————————— Chapter 4: Competitive Foods: Nutritional Characteristics 104

———————————————————————————————————————————————————Table 4.15
Micronutrient Composition of Competitive Foods Available During the School Day, Weighted by Sales, AllSchools and Sources — Continued
———————————————————————————————————————————————————
Food Available In the School Cafeteria
Numberof items
Numbersold
Mean amount per item
VitaminA
(RE)
VitaminC
(mg)
Thiamin(mg)
Riboflavin(mg)
Niacin(mg)
VitaminB6
(mg)
Calcium(mg)
Iron(mg)
Baked goods/dessertAll items ....................................... 24 2523 51.5 0.3 0.2 0.2 1.6 0.0 39.0 1.9Cookies ......................................... 10 2056 38.2 0.2 0.1 0.2 1.5 0.0 21.4 1.9Doughnuts .................................... 2 72 20.4 0.1 0.2 0.1 1.3 0.0 33.6 1.9Pastries (danish, toaster pastries,
pies) ........................................ 4 152 167.6 1.2 0.4 0.4 3.9 0.3 144.7 1.8Snack cakes ................................. 8 243 7.1 0.2 0.2 0.2 1.7 0.0 62.9 2.6
BeveragesAll items ....................................... 48 4028 39.8 41.8 0.0 0.0 0.6 0.0 63.2 0.7Fruit juice, 100% juice .................. 5 207 41.1 140.6 0.2 0.0 0.8 0.2 258.2 1.3Iced tea drinks, fortified ................ 2 137 0.0 60.0 0.0 0.0 4.0 0.4 100.0 0.0Juice-based drink, fortified, 16-20
fl oz ......................................... 1 15 231.3 75.2 0.7 0.0 0.2 0.0 23.1 0.2Juice-based drinks, 11.5-12 fl oz .. 1 9 3.6 105.1 0.0 0.0 0.0 0.0 28.4 0.8Juice-based drinks, 16-20 fl oz ..... 5 631 20.1 29.7 0.0 0.1 0.1 0.0 32.8 1.1Juice-based drinks, fortified,
11.5-12 fl oz ............................ 20 1671 76.6 88.2 0.1 0.1 1.3 0.1 48.7 0.7Milk, flavored, skim or 1% fat,
fortified .................................... 2 35 284.4 16.2 0.2 0.7 0.6 0.2 693.9 1.3Milk, flavored, whole or 2% fat,
fortified .................................... 7 123 155.0 4.5 0.2 0.8 0.5 0.2 807.9 0.9Milk, whole .................................... 1 9 151.3 4.6 0.2 0.8 0.4 0.2 582.7 0.2Sports drinks ................................. 0 – – – – – – – – –Spring water ................................. 2 1184 0.0 0.0 0.0 0.0 0.0 0.0 9.7 0.0Yogurt drinks ................................ 2 7 51.1 60.0 0.1 0.3 0.7 0.4 250.0 0.7
Bread or grain productsAll items ....................................... 13 1124 8.8 0.3 0.2 0.2 1.7 0.1 34.3 1.4Cereal bars/cereal mixes .............. 1 83 111.9 5.1 0.1 0.1 1.7 0.2 3.0 0.7Crackers/Cracker Sandwiches ..... 4 823 12.3 0.2 0.2 0.2 2.0 0.2 74.6 1.8Granola bar ................................... 5 110 0.4 0.4 0.1 0.0 0.7 0.1 22.6 1.2Pretzels ......................................... 2 33 0.0 0.0 0.2 0.3 2.2 0.0 15.3 1.8Rice or corn cakes ........................ 1 75 1.8 0.0 0.0 0.0 1.6 0.0 2.3 0.5
Frozen dessertsAll items ....................................... 27 857 57.0 0.5 0.0 0.2 0.4 0.0 82.1 0.5Ice cream ...................................... 23 819 59.1 0.5 0.0 0.2 0.4 0.0 85.4 0.6Non-dairy frozen desserts ............ 4 38 0.7 2.6 0.0 0.0 0.0 0.0 2.0 0.1
Salads with dressingAll items ....................................... 2 35 268.2 13.7 0.0 0.0 0.7 0.0 44.7 0.8Side salads ................................... 2 35 268.2 13.7 0.0 0.0 0.7 0.0 44.7 0.8
SnacksAll items ....................................... 42 2631 7.9 5.1 0.0 0.0 0.9 0.1 37.9 0.7Chips ............................................ 30 2032 7.4 4.0 0.0 0.0 1.1 0.2 40.2 0.8Chips - baked or reduced fat ........ 5 152 2.3 0.0 0.0 0.0 1.1 0.1 32.9 0.3Fruit roll-ups/fruit snacks .............. 2 264 5.9 50.0 0.0 0.0 0.0 0.1 9.8 0.4Popcorn ........................................ 5 183 10.5 0.0 0.0 0.0 0.4 0.0 23.5 0.5
– Data not available.Note: Number of items is the number offered at the three schools. Number sold is the total sales for the three schools.
Estimates are the result of weighting items by the number sold within school, and then giving equal weight to schools.Weighted and unweighted results may be identical for subcategories with small numbers of items offered at each school.
Source: Cafeteria Survey and and Inventories of Competitive Foods.
—————————————————————————————————————————————————————————————————— Chapter 4: Competitive Foods: Nutritional Characteristics 105
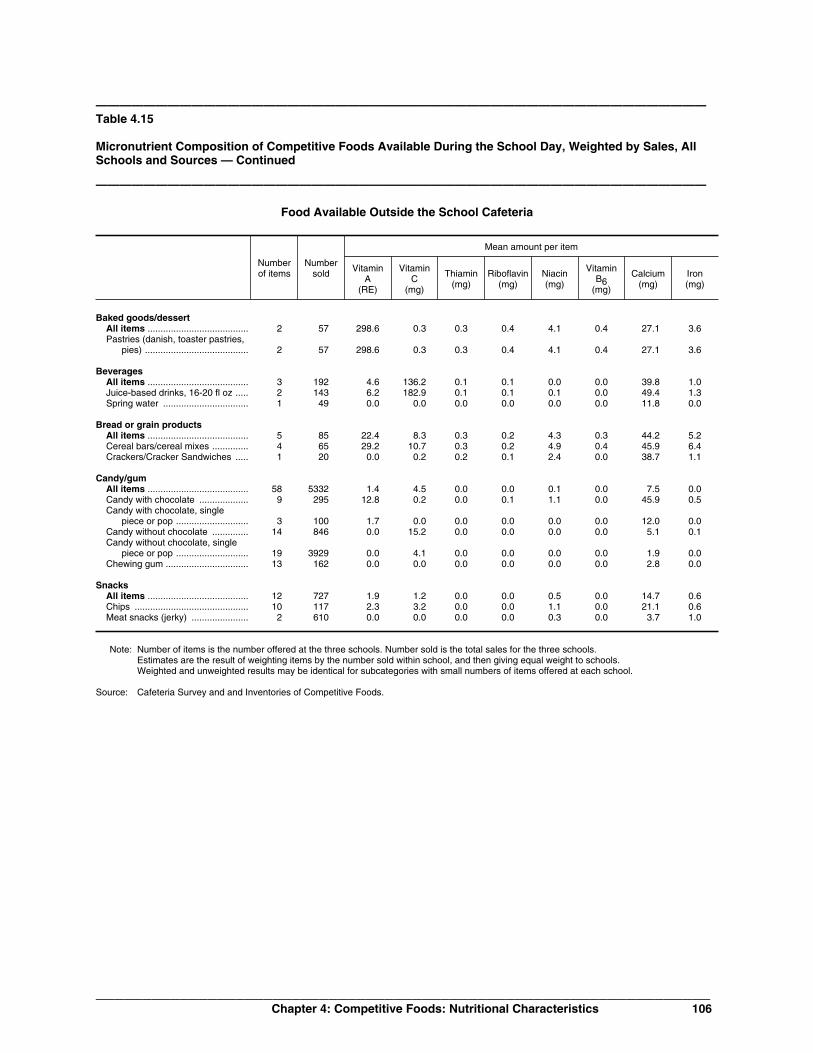
———————————————————————————————————————————————————Table 4.15
Micronutrient Composition of Competitive Foods Available During the School Day, Weighted by Sales, AllSchools and Sources — Continued
———————————————————————————————————————————————————
Food Available Outside the School Cafeteria
Numberof items
Numbersold
Mean amount per item
VitaminA
(RE)
VitaminC
(mg)
Thiamin(mg)
Riboflavin(mg)
Niacin(mg)
VitaminB6
(mg)
Calcium(mg)
Iron(mg)
Baked goods/dessertAll items ....................................... 2 57 298.6 0.3 0.3 0.4 4.1 0.4 27.1 3.6Pastries (danish, toaster pastries,
pies) ........................................ 2 57 298.6 0.3 0.3 0.4 4.1 0.4 27.1 3.6
BeveragesAll items ....................................... 3 192 4.6 136.2 0.1 0.1 0.0 0.0 39.8 1.0Juice-based drinks, 16-20 fl oz ..... 2 143 6.2 182.9 0.1 0.1 0.1 0.0 49.4 1.3Spring water ................................. 1 49 0.0 0.0 0.0 0.0 0.0 0.0 11.8 0.0
Bread or grain productsAll items ....................................... 5 85 22.4 8.3 0.3 0.2 4.3 0.3 44.2 5.2Cereal bars/cereal mixes .............. 4 65 29.2 10.7 0.3 0.2 4.9 0.4 45.9 6.4Crackers/Cracker Sandwiches ..... 1 20 0.0 0.2 0.2 0.1 2.4 0.0 38.7 1.1
Candy/gumAll items ....................................... 58 5332 1.4 4.5 0.0 0.0 0.1 0.0 7.5 0.0Candy with chocolate ................... 9 295 12.8 0.2 0.0 0.1 1.1 0.0 45.9 0.5Candy with chocolate, single
piece or pop ............................ 3 100 1.7 0.0 0.0 0.0 0.0 0.0 12.0 0.0Candy without chocolate .............. 14 846 0.0 15.2 0.0 0.0 0.0 0.0 5.1 0.1Candy without chocolate, single
piece or pop ............................ 19 3929 0.0 4.1 0.0 0.0 0.0 0.0 1.9 0.0Chewing gum ................................ 13 162 0.0 0.0 0.0 0.0 0.0 0.0 2.8 0.0
SnacksAll items ....................................... 12 727 1.9 1.2 0.0 0.0 0.5 0.0 14.7 0.6Chips ............................................ 10 117 2.3 3.2 0.0 0.0 1.1 0.0 21.1 0.6Meat snacks (jerky) ...................... 2 610 0.0 0.0 0.0 0.0 0.3 0.0 3.7 1.0
Note: Number of items is the number offered at the three schools. Number sold is the total sales for the three schools.Estimates are the result of weighting items by the number sold within school, and then giving equal weight to schools.Weighted and unweighted results may be identical for subcategories with small numbers of items offered at each school.
Source: Cafeteria Survey and and Inventories of Competitive Foods.
—————————————————————————————————————————————————————————————————— Chapter 4: Competitive Foods: Nutritional Characteristics 106

———————————————————————————————————————————————————Table 4.16
Food Guide Pyramid Servings for Competitive Foods Available During the School Day, Weighted by Sales,All Schools and Sources
———————————————————————————————————————————————————
Food Available Inside and Outside the School Cafeteria
Number ofitems
Numbersold
Mean number of servings per pyramid group Mean amount per item
Grain Vegetable Fruit Dairy Meat1Discre-tionary
Fat(g)
AddedSugars
(tsp)
Baked goods/dessertAll items ....................................... 26 2580 1.4 0.0 0.0 0.0 0.0 15.5 6.5Cookies ......................................... 10 2056 1.3 0.0 0.0 0.0 0.0 15.8 6.4Doughnuts .................................... 2 72 1.7 0.0 0.0 0.0 0.0 21.2 4.8Pastries (danish, toaster pastries,
pies) ........................................ 6 209 2.0 0.0 0.0 0.0 0.0 9.2 7.3Snack cakes ................................. 8 243 1.8 0.0 0.0 0.0 0.0 13.9 8.8
BeveragesAll items ....................................... 51 4220 0.0 0.0 0.3 0.0 0.0 0.3 8.7Fruit juice, 100% juice .................. 5 207 0.0 0.0 2.2 0.0 0.0 0.0 0.0Iced tea drinks, fortified ................ 2 137 0.0 0.0 0.0 0.0 0.0 0.0 4.3Juice-based drink, fortified, 16-20
fl oz ......................................... 1 15 0.0 0.0 1.0 0.0 0.0 0.0 10.4Juice-based drinks, 11.5-12 fl oz .. 1 9 0.0 0.0 0.2 0.0 0.0 0.0 9.2Juice-based drinks, 16-20 fl oz ..... 7 774 0.0 0.0 0.4 0.0 0.0 0.0 14.1Juice-based drinks, fortified,
11.5-12 fl oz ............................ 20 1671 0.0 0.0 0.3 0.0 0.0 0.0 8.8Milk, flavored, skim or 1% fat,
fortified .................................... 2 35 0.0 0.0 0.0 2.0 0.0 4.6 6.2Milk, flavored, whole or 2% fat,
fortified .................................... 7 123 0.4 0.0 0.0 1.9 0.0 14.6 6.6Milk, whole .................................... 1 9 0.0 0.0 0.0 2.0 0.0 15.4 0.0Sports drinks ................................. 0 – – – – – – – –Spring water ................................. 3 1233 0.0 0.0 0.0 0.0 0.0 0.0 0.0Yogurt drinks ................................ 2 7 0.0 0.0 1.4 0.4 0.0 4.1 7.4
Bread or grain productsAll items ....................................... 18 1209 1.5 0.0 0.0 0.0 0.0 6.0 1.0Cereal bars/cereal mixes .............. 5 148 1.1 0.0 0.0 0.0 0.0 3.6 2.3Crackers/Cracker Sandwiches ..... 5 843 1.3 0.0 0.0 0.0 0.2 8.9 1.6Granola bar ................................... 5 110 1.1 0.0 0.0 0.0 0.1 5.6 1.7Pretzels ......................................... 2 33 2.6 0.0 0.0 0.0 0.0 0.0 0.0Rice or corn cakes ........................ 1 75 1.5 0.0 0.0 0.0 0.0 0.0 0.0
Candy/gumAll items ....................................... 58 5332 0.0 0.0 0.0 0.0 0.0 2.3 4.7Candy with chocolate ................... 9 295 0.6 0.0 0.0 0.1 0.2 12.9 4.4Candy with chocolate, single
piece or pop ............................ 3 100 0.0 0.0 0.0 0.0 0.0 1.9 2.7Candy without chocolate .............. 14 846 0.0 0.0 0.0 0.0 0.0 2.3 11.8Candy without chocolate, single
piece or pop ............................ 19 3929 0.0 0.0 0.0 0.0 0.0 0.8 3.7Chewing gum ................................ 13 162 0.0 0.0 0.0 0.0 0.0 0.0 1.6
Frozen dessertsAll items ....................................... 27 857 0.4 0.0 0.0 0.2 0.0 9.6 4.0Ice cream ...................................... 23 819 0.4 0.0 0.0 0.2 0.0 9.9 3.9Non-dairy frozen desserts ............ 4 38 0.0 0.0 0.0 0.0 0.0 0.0 6.9
1 Also includes legumes, soybean products, nuts, and seeds.– Data not available.
Note: Number of items is the number offered at the three schools. Number sold is the total sales for the three schools.Estimates are the result of weighting items by the number sold within school, and then giving equal weight to schools.Weighted and unweighted results may be identical for subcategories with small numbers of items offered at each school.
Source: Cafeteria Survey and and Inventories of Competitive Foods.
—————————————————————————————————————————————————————————————————— Chapter 4: Competitive Foods: Nutritional Characteristics 107

———————————————————————————————————————————————————Table 4.16
Food Guide Pyramid Servings for Competitive Foods Available During the School Day, Weighted by Sales,All Schools and Sources — Continued
———————————————————————————————————————————————————
Food Available Inside and Outside the School Cafeteria
Number ofitems
Numbersold
Mean number of servings per pyramid group Mean amount per item
Grain Vegetable Fruit Dairy Meat1Discre-tionary
Fat(g)
AddedSugars
(tsp)
Salads with dressingAll items ....................................... 2 35 0.0 1.6 0.0 0.0 0.0 11.4 0.3Side salads ................................... 2 35 0.0 1.6 0.0 0.0 0.0 11.4 0.3
SnacksAll items ....................................... 54 3358 1.1 0.3 0.0 0.0 0.0 9.5 0.2Chips ............................................ 40 2149 1.4 0.4 0.0 0.0 0.0 11.6 0.0Chips - baked or reduced fat ........ 5 152 0.4 0.9 0.0 0.0 0.0 7.0 0.6Fruit roll-ups/fruit snacks .............. 2 264 0.0 0.0 0.9 0.0 0.0 0.0 4.9Meat snacks (jerky) ...................... 2 610 0.0 0.0 0.0 0.0 0.5 3.3 0.0Popcorn ........................................ 5 183 1.2 0.0 0.0 0.0 0.0 7.2 0.0
1 Also includes legumes, soybean products, nuts, and seeds.Note: Number of items is the number offered at the three schools. Number sold is the total sales for the three schools.
Estimates are the result of weighting items by the number sold within school, and then giving equal weight to schools.Weighted and unweighted results may be identical for subcategories with small numbers of items offered at each school.
Source: Cafeteria Survey and and Inventories of Competitive Foods.
—————————————————————————————————————————————————————————————————— Chapter 4: Competitive Foods: Nutritional Characteristics 108

———————————————————————————————————————————————————Table 4.16
Food Guide Pyramid Servings for Competitive Foods Available During the School Day, Weighted by Sales,All Schools and Sources — Continued
———————————————————————————————————————————————————
Food Available In the School Cafeteria
Number ofitems
Numbersold
Mean number of servings per pyramid group Mean amount per item
Grain Vegetable Fruit Dairy Meat1Discre-tionary
Fat(g)
AddedSugars
(tsp)
Baked goods/dessertAll items ....................................... 24 2523 1.3 0.0 0.0 0.0 0.0 15.6 6.5Cookies ......................................... 10 2056 1.3 0.0 0.0 0.0 0.0 15.8 6.4Doughnuts .................................... 2 72 1.7 0.0 0.0 0.0 0.0 21.2 4.8Pastries (danish, toaster pastries,
pies) ........................................ 4 152 1.8 0.0 0.0 0.0 0.0 10.5 7.5Snack cakes ................................. 8 243 1.8 0.0 0.0 0.0 0.0 13.9 8.8
BeveragesAll items ....................................... 48 4028 0.0 0.0 0.3 0.0 0.0 0.3 8.3Fruit juice, 100% juice .................. 5 207 0.0 0.0 2.2 0.0 0.0 0.0 0.0Iced tea drinks, fortified ................ 2 137 0.0 0.0 0.0 0.0 0.0 0.0 4.3Juice-based drink, fortified, 16-20
fl oz ......................................... 1 15 0.0 0.0 1.0 0.0 0.0 0.0 10.4Juice-based drinks, 11.5-12 fl oz .. 1 9 0.0 0.0 0.2 0.0 0.0 0.0 9.2Juice-based drinks, 16-20 fl oz ..... 5 631 0.0 0.0 0.4 0.0 0.0 0.0 13.2Juice-based drinks, fortified,
11.5-12 fl oz ............................ 20 1671 0.0 0.0 0.3 0.0 0.0 0.0 8.8Milk, flavored, skim or 1% fat,
fortified .................................... 2 35 0.0 0.0 0.0 2.0 0.0 4.6 6.2Milk, flavored, whole or 2% fat,
fortified .................................... 7 123 0.4 0.0 0.0 1.9 0.0 14.6 6.6Milk, whole .................................... 1 9 0.0 0.0 0.0 2.0 0.0 15.4 0.0Sports drinks ................................. 0 – – – – – – – –Spring water ................................. 2 1184 0.0 0.0 0.0 0.0 0.0 0.0 0.0Yogurt drinks ................................ 2 7 0.0 0.0 1.4 0.4 0.0 4.1 7.4
Bread or grain productsAll items ....................................... 13 1124 1.7 0.0 0.0 0.0 0.0 3.7 0.3Cereal bars/cereal mixes .............. 1 83 0.8 0.0 0.0 0.0 0.0 2.9 3.4Crackers/Cracker Sandwiches ..... 4 823 1.9 0.0 0.0 0.0 0.0 8.9 0.3Granola bar ................................... 5 110 1.1 0.0 0.0 0.0 0.1 5.6 1.7Pretzels ......................................... 2 33 2.6 0.0 0.0 0.0 0.0 0.0 0.0Rice or corn cakes ........................ 1 75 1.5 0.0 0.0 0.0 0.0 0.0 0.0
Frozen dessertsAll items ....................................... 27 857 0.4 0.0 0.0 0.2 0.0 9.6 4.0Ice cream ...................................... 23 819 0.4 0.0 0.0 0.2 0.0 9.9 3.9Non-dairy frozen desserts ............ 4 38 0.0 0.0 0.0 0.0 0.0 0.0 6.9
Salads with dressingAll items ....................................... 2 35 0.0 1.6 0.0 0.0 0.0 11.4 0.3Side salads ................................... 2 35 0.0 1.6 0.0 0.0 0.0 11.4 0.3
SnacksAll items ....................................... 42 2631 1.3 0.4 0.0 0.0 0.0 10.3 0.3Chips ............................................ 30 2032 1.3 0.5 0.0 0.0 0.0 11.5 0.0Chips - baked or reduced fat ........ 5 152 0.4 0.9 0.0 0.0 0.0 7.0 0.6Fruit roll-ups/fruit snacks .............. 2 264 0.0 0.0 0.9 0.0 0.0 0.0 4.9
1 Also includes legumes, soybean products, nuts, and seeds.– Data not available.
Note: Number of items is the number offered at the three schools. Number sold is the total sales for the three schools.Estimates are the result of weighting items by the number sold within school, and then giving equal weight to schools.Weighted and unweighted results may be identical for subcategories with small numbers of items offered at each school.
Source: Cafeteria Survey and and Inventories of Competitive Foods.
—————————————————————————————————————————————————————————————————— Chapter 4: Competitive Foods: Nutritional Characteristics 109

———————————————————————————————————————————————————Table 4.16
Food Guide Pyramid Servings for Competitive Foods Available During the School Day, Weighted by Sales,All Schools and Sources — Continued
———————————————————————————————————————————————————
Food Available In the School Cafeteria
Number ofitems
Numbersold
Mean number of servings per pyramid group Mean amount per item
Grain Vegetable Fruit Dairy Meat1Discre-tionary
Fat(g)
AddedSugars
(tsp)
SnacksPopcorn ........................................ 5 183 1.2 0.0 0.0 0.0 0.0 7.2 0.0
1 Also includes legumes, soybean products, nuts, and seeds.Note: Number of items is the number offered at the three schools. Number sold is the total sales for the three schools.
Estimates are the result of weighting items by the number sold within school, and then giving equal weight to schools.Weighted and unweighted results may be identical for subcategories with small numbers of items offered at each school.
Source: Cafeteria Survey and and Inventories of Competitive Foods.
—————————————————————————————————————————————————————————————————— Chapter 4: Competitive Foods: Nutritional Characteristics 110

———————————————————————————————————————————————————Table 4.16
Food Guide Pyramid Servings for Competitive Foods Available During the School Day, Weighted by Sales,All Schools and Sources — Continued
———————————————————————————————————————————————————
Food Available Outside the School Cafeteria
Number ofitems
Numbersold
Mean number of servings per pyramid group Mean amount per item
Grain Vegetable Fruit Dairy Meat1Discre-tionary
Fat(g)
AddedSugars
(tsp)
Baked goods/dessertAll items ....................................... 2 57 3.2 0.0 0.1 0.0 0.0 7.3 7.7Pastries (danish, toaster pastries,
pies) ........................................ 2 57 3.2 0.0 0.1 0.0 0.0 7.3 7.7
BeveragesAll items ....................................... 3 192 0.0 0.0 0.3 0.0 0.0 0.0 11.9Juice-based drinks, 16-20 fl oz ..... 2 143 0.0 0.0 0.4 0.0 0.0 0.0 16.0Spring water ................................. 1 49 0.0 0.0 0.0 0.0 0.0 0.0 0.0
Bread or grain productsAll items ....................................... 5 85 1.2 0.0 0.0 0.0 0.2 5.4 1.6Cereal bars/cereal mixes .............. 4 65 1.4 0.0 0.0 0.0 0.1 4.3 1.2Crackers/Cracker Sandwiches ..... 1 20 0.7 0.0 0.0 0.0 0.3 8.9 2.8
Candy/gumAll items ....................................... 58 5332 0.0 0.0 0.0 0.0 0.0 2.3 4.7Candy with chocolate ................... 9 295 0.6 0.0 0.0 0.1 0.2 12.9 4.4Candy with chocolate, single
piece or pop ............................ 3 100 0.0 0.0 0.0 0.0 0.0 1.9 2.7Candy without chocolate .............. 14 846 0.0 0.0 0.0 0.0 0.0 2.3 11.8Candy without chocolate, single
piece or pop ............................ 19 3929 0.0 0.0 0.0 0.0 0.0 0.8 3.7Chewing gum ................................ 13 162 0.0 0.0 0.0 0.0 0.0 0.0 1.6
SnacksAll items ....................................... 12 727 0.4 0.2 0.0 0.0 0.2 5.5 0.0Chips ............................................ 10 117 0.5 1.0 0.0 0.0 0.0 13.7 0.2Meat snacks (jerky) ...................... 2 610 0.0 0.0 0.0 0.0 0.5 3.3 0.0
1 Also includes legumes, soybean products, nuts, and seeds.Note: Number of items is the number offered at the three schools. Number sold is the total sales for the three schools.
Estimates are the result of weighting items by the number sold within school, and then giving equal weight to schools.Weighted and unweighted results may be identical for subcategories with small numbers of items offered at each school.
Source: Cafeteria Survey and and Inventories of Competitive Foods.
—————————————————————————————————————————————————————————————————— Chapter 4: Competitive Foods: Nutritional Characteristics 111

Chapter 5: Methodology for Assessing the Impact of Policies 113
Chapter 5 Methodology for Assessing the Impact of Competitive Food Policies
Competitive food policies determine the types of foods available to students during the school day, in addition to USDA reimbursable meals. These policies may concern the locations and time periods of availability, the types of foods prohibited or required, and the pricing of foods. Competitive food policies, together with policies regarding USDA reimbursable meal planning, define the school food environment. This chapter discusses “an approach/methodology to be used on an ongoing basis by FNS and/or State Child Nutrition Agencies to monitor the impact of schools changing their policies on competitive foods on the nutritional quality of foods at school.”1 The impact of competitive food policies can be expressed by the following research questions:
1. What is the nutritional quality of competitive foods available at school?
2. Do competitive foods “crowd out” the selection of USDA reimbursable meals?
3. How much do competitive foods add to (or subtract from) total food energy, key nutrients, added sugars, and fat served to students during the school day?
Estimating the impact of changes in competitive food policies requires data collection sufficient to answer one or more of these research questions. The primary design considerations for a data collection plan are:
• Overall design of the study: cross-sectional or longitudinal data;
• Ability to collect comparable information about competitive food policies across schools; and
• Ability to collect comparable data on foods offered and served, across schools. This chapter provides a discussion of the operational and methodological issues involved in collecting data and answering the research questions. The discussion provides recommendations for large-scale monitoring, and is informed by the findings of the data collection portion of this feasibility study. Overall Design Considerations
A study of the impact of changes in competitive food policies requires two types of information: data about policies and data on outcome measures related to those policies. Because FNS is interested in monitoring the impact of competitive food policies over time, the monitoring effort will require ongoing data collection from individual schools. 1 USDA/FNS Statement of Work, Task Order: Feasibility Study to Develop Methodology to Monitor Impact of Changes
in Competitive Food Policies, January 2003.

114 Chapter 5: Methodology for Assessing the Impact of Policies
There are two basic design options for data collection and evaluation of competitive food policies:
• Cross-sectional study of the variation in policies across schools, and • Longitudinal study of the impact of policy changes within schools.
A cross-sectional design involves a recurring survey with a sample of schools that changes over time; a longitudinal design involves a recurring survey of a single sample of schools followed over time.2 Cross-sectional data can provide a wealth of information describing policies and outcomes, but cannot support evaluation of the causal impact of school policies. Longitudinal data can be used to estimate the impact of changes in policies. Cross-Sectional Design
From an operational standpoint, a cross-section design spreads the burden of ongoing monitoring over more schools; each year, a new sample of schools might be surveyed to provide estimates of the prevalence of different competitive food policies. A cross-sectional study of a nationally representative sample of schools can provide a wealth of information describing school environments—including competitive food policies/practices and outcome measures. There is currently only limited information about the foods available to students, outside of USDA reimbursable meals. For example, SNDA-II found that a la carte items are available in nine out of ten NSLP schools and vending machines are in one-third of NSLP schools, but SNDA-II did not collect data to describe the nutritional quality of a la carte foods or the volume of purchases. A nationally representative cross-sectional study could be used to assess the current status of competitive food availability. Cross-sectional studies are limited, however, in their ability to estimate the causal impact of policy changes. For example, a cross-sectional study can tell that particular competitive food policies are associated with particular nutritional outcomes, but cannot attribute causality to the competitive food policies. The inability to attribute causality in a cross-sectional study is due to the fact that competitive food policies are endogenous—these policies are not adopted in isolation, but are likely to be related to other school characteristics that influence student food selections. As an illustration of the fact that competitive food policies are endogenous, consider that schools in low-income areas may be less likely to offer competitive foods because a large percentage of the student population receives free USDA meals and cannot afford to purchase vending and a la carte items in addition to, or in lieu of, reimbursable meals. Another example of endogenous policies is that a la carte food offerings can, in some schools, be limited by the physical characteristics of the school cafeteria. Because competitive food policies are endogenous, the impact of policies cannot be determined from cross-sectional data without substantial effort to control for school characteristics that may influence both policies/practices and outcomes. With cross-sectional data, analyses of the impact of
2 The Current Population Survey, March Demographic File is usually thought of as a recurring cross-section because the
sample changes from year to year (although the survey has a rotating sample, so that a small portion of respondents appear in consecutive files). Examples of true longitudinal surveys are the Panel Study of Income Dynamics or National Longitudinal Surveys, which followed a single sample of respondents over time.

Chapter 5: Methodology for Assessing the Impact of Policies 115
competitive food policies must include modeling that accounts for the selection of competitive food policies by schools. The analytic modeling required to account for endogenous policies imposes additional data collection burdens on participating schools, and analysis results are generally less certain when compared to a longitudinal study. Longitudinal Design
A longitudinal design places all data collection burden on a single sample of schools that is surveyed on a recurring basis. A longitudinal approach may minimize total data collection burden, however; if respondents at the single sample of schools are stable, they may become familiar with the instruments, and hence more efficient with each round of data collection. In addition, data collection can be reduced after an initial baseline survey because some school characteristics are stable over time.3 A longitudinal study is the best design for studying the impact of changes in competitive food policies. With this design, changes in policies are related to changes in outcomes within schools. To support impact analyses, a longitudinal study would, at a minimum, collect information about competitive food policies and outcome measures to address at least one of the research questions listed at the start of this chapter. Schools with changes in competitive food policies would be identified from data collected at multiple points in time. Changes in outcomes would also be measured by comparing data collected at multiple points in time. In a longitudinal study, the impact of competitive food policies is identified from the within-school changes in outcomes in schools with changes in policies, relative to the within-school changes in outcomes in schools with no policy changes. The one limitation of a longitudinal study design is that impact estimates can only be obtained if changes in policies are observed within the study sample. If competitive food policies are stable, a very large panel of schools would need to be followed in order to ensure that some schools will experience changes in policies. (Likewise, with a cross-sectional study design, the expected variation in competitive food policies is an important consideration in determining sample size.) For analyses, longitudinal data allow researchers to estimate the impact of changes in policies, while controlling for school characteristics that are difficult (and costly) to measure, but may influence both school policies and the outcomes of interest. Many characteristics of schools may be considered “fixed effects” if they are relatively stable over time. Fixed effects would include the physical characteristics of the food service areas, demographic composition of the student body, and regional food preferences and dietary habits. This “fixed effects” approach with longitudinal data affords savings in data collection costs. Although a longitudinal approach relies mainly on observation of within-school changes in policies and outcomes, this design also allows researchers to control for time trends. For example, changes in student food choices over time may reflect general trends in the popularity of particular food items, or the acceptance of more healthful food choices, or the reformulation of food products. These general trends will be observed across all schools, regardless of whether the schools experience policy changes. 3 One consideration in designing a monitoring effort is whether to use school staff as respondents or to use outside
observers. This discussion of burden assumes school staff respondents.

116 Chapter 5: Methodology for Assessing the Impact of Policies
The next sections of this chapter discuss options and recommendations for measuring competitive food policies and outcomes. The final section of the chapter provides a discussion of analysis methods. Measuring Competitive Food Policies
Competitive food policies, whether implicit or explicit, govern the types of foods available, locations of sales, and hours of availability. The critical consideration in designing an approach for monitoring the impact of changes in competitive food policies is to develop data collection methods that collect comparable data across schools and over time. This feasibility study collected data about competitive food policies and practices from two types of respondents: SFA directors and school principals. SFA directors were asked about district-level policies/procedures and SFA operations; school principals were asked school policies and procedures. The surveys asked a wide range of questions about the availability of competitive foods (venues, locations, hours), types of competitive foods (required and/or prohibited foods), persons responsible for approving competitive foods, pricing strategies for competitive foods, and financial arrangements (who receives the revenue and how is it used). Some of the data collected via survey were validated during on-site training visits, or revised based on debriefing discussions with respondents. The survey instruments used for this study are too long to be used as a model for ongoing monitoring activities, but they provide a good basis for prioritizing survey methods and topic areas. Three main problems were found regarding data collection on competitive food policies:
1. Identifying the appropriate respondent for the survey of school policies; 2. Defining food “sources”; and 3. Finding a lack of clear policies.
Identifying the Respondent
Competitive food venues do not fall within the jurisdiction of a single person. In the three schools surveyed, the school food service had responsibility for most of the food served in the cafeteria, whereas one or two other organizations had responsibility for foods available outside the cafeteria.4 One of the most important findings was that school principals, whose jurisdiction covers the entire school, did not always have knowledge of food policies and practices. This finding suggests that complete and accurate information about the school food environment cannot be obtained by a simple mail survey of school principals. Principals were not motivated to seek out the information requested on the surveys, or to delegate the task to others; they returned incomplete or inaccurate surveys. There are two possible alternatives to a principal survey: (1) use a screener survey to identify respondents, and send multiple survey modules to multiple respondents within a school;5 or (2) rely
4 In each of the three schools surveyed, the food service is responsible for all foods available in the cafeteria with one
exception: the vending machine in the cafeteria of School #1 is governed by a citywide beverage contract. 5 The respondents would be identified as persons responsible for each food venue within the school.

Chapter 5: Methodology for Assessing the Impact of Policies 117
on cafeteria managers (or SFA directors) to report on competitive foods available throughout their schools. The first option would be costly to field because it adds a round of data collection and increases the number of respondents requiring follow-up. Recommendation (2) may be viable because this feasibility study found that cafeteria managers are concerned about the school food environment and are motivated to obtain information requested on surveys. Cafeteria managers, however, cannot be expected to shoulder the combined burden of a detailed cafeteria survey and a survey of other competitive food venues. It may be reasonable, however, to ask cafeteria managers to respond to a well-designed short-form monitoring survey. Defining Food Sources
This study designed Principal and SFA Director surveys with a parallel structure to collect similar information about each possible source of competitive foods available during the school day: (a) a la carte, (b) snack bars, (c) vending machines, and (d) school stores. Visits to the schools, however, quickly revealed that a “food source” is not necessarily comparable across schools. The main difficultly in collecting and examining data on foods “by source” is that different school food service operations may use different methods of food delivery to sell the same a la carte items to students. “Snack bar” may be just a name given to a separate a la carte line or window; vending machines may be used to sell a la carte beverages so as to save space on the line. It seems clear that the presence of different food sources in and near the cafeteria may be related to space and staff constraints faced by the school food service. This study found that the structure of the Principal Survey resulted in missing data on a la carte-only operations in one school. That school has no a la carte-only service other than a snack bar. As a result, the respondent completed the snack bar portion of the survey and “skipped out” of questions about certain a la carte-only policies.6 An argument can be made to use the term “a la carte” or “food service foods” to identify all foods made available by the school food service in the cafeteria, and all policies related to those foods. Consistent with this argument, we grouped competitive foods by location inside and outside the cafeteria for the analyses presented in Chapter 4. An examination of individual items available from different sources in the cafeteria at different schools (Appendix E) supports this grouping for the three schools surveyed. An important consideration is that the grouping of data that made sense for this study may not make sense in a larger study. Some school food service operations provide food outside the cafeteria—for example, in outdoor kiosks in warm-weather locations. For this reason, we recommend that the structure of data collection and analysis in future studies focus on the distinction between the following four categories of competitive foods:
1. School food service, during lunch 2. School food service, outside lunch 3. Non-food service, during lunch 4. Non-food service, outside lunch
6 These responses were subsequently obtained during the debriefing.

118 Chapter 5: Methodology for Assessing the Impact of Policies
This structure is important for collecting information about competitive food offerings and for collecting information about competitive food policies and practices. Lack of Clear Policies
Evidence from the three schools included in this feasibility study showed that schools do not necessarily have clear policies about competitive foods. As a result, we found that respondents did not interpret questions about policies consistently. Two different types of questions were used to collect data about competitive school policies:
Type 1 Respondents were asked about observable practices (Do you have vending machines? How many? Where are they?).7
Type 2 Respondents were asked about unobservable policies (Do you restrict the types of foods available in vending machines? What is your pricing strategy for a la carte items?).
In many environments, questions about policies would be categorized as “observable”. Individual schools, however (like other small organizations) may have many policies that are not written down. Because they are not codified in formal documents, the difference between a “policy” and a “practice” is blurred, and respondents may have difficulty responding to survey questions. Type 1 and Type 2 questions provided a mix of factual questions about the school environment and questions that may have required subjective judgment. Responses to Type 1 survey questions were verified for this feasibility study through on-site visits, thus providing some validation of the reliability of responses. Responses to Type 2 questions are not easily verified, and may be interpreted differently by different respondents. For example, when we ask whether certain foods are prohibited from vending machines, some respondents will answer affirmatively only if they have clear written policies about certain food items; other respondents will answer affirmatively because they know that certain items are not in their machines (this example was revealed during our debriefings). The types of survey questions must be considered together with the identity of respondents. This feasibility study used a Principal Survey because it was expected that only the principal would know the policies that affect multiple operations in the school. If instead of asking about policies, we ask only about observable practices, there are other potential respondents to the survey. It can be argued that unobservable policies and procedures result in observable practices, and that a survey aimed at obtaining comparable data should limit questions to observable practices (“just tell us what you do, not what you think you might be doing”). For example, we can ask respondents about their pricing strategies, or we can collect data on prices and analyze their pricing practices. Likewise, we can ask whether certain items are prohibited from vending machines, or we can collect information about the contents of vending machines. The difficulty in this case is that FNS wants to know the impact of changes in competitive food policies, without first having evidence that district- and school-level policies (as opposed to practices) exist.
7 We use the term observable to mean “verifiable by an outside observer”.

Chapter 5: Methodology for Assessing the Impact of Policies 119
The first issue then is how to measure “policies”. With the data collected for this study, there are several options for defining baseline policies; changes in those policies would require additional data from the same schools at a subsequent point in time. A series of policy-change variables could be used together in a regression analysis to estimate the marginal impact of changes in a number of competitive food policies. For example, policy variables could include indicators of:
• Any non-food service-operated food venues located in the cafeteria?
• Any non-food service-operated food venues located outside the cafeteria?
• Whether competitive food items have to meet written state or district nutrition standards?
• Whether competitive food items have to meet written state or district price standards?
• Any pouring rights contract governing beverage sales in the school? These questions require little interpretation by respondents, and are likely to elicit consistently accurate responses across schools and over time. Additional policy questions could be posed in the same concise question style. Measuring Nutritional Outcomes
The three research questions posed in the introduction to this chapter are shown below. Each research question corresponds to an outcome measure. Outcome measures are expressed as changes over time, because the overriding research question is the impact of changes in competitive food policies. These outcome measures may be used (separately or together) to evaluate the impact of changes in competitive food policies in schools.
Research Question Outcome Measure
1. What is the nutritional quality of competitive foods available at school?
Change in average nutrient content of competitive foods offered
2. Do competitive foods “crowd out” the selection of USDA reimbursable meals?
Change in participation in USDA reimbursable meal programs
3. How much do competitive foods add to (or subtract from) total food energy, key nutrients, added sugars, and fat served to students during the school day?
a. Change in nutrient content of all foods served/sold
OR b. Change in marginal impact of
competitive foods on total nutrients selected during the school day (using an expected value for the nutrient content of reimbursable meals)

120 Chapter 5: Methodology for Assessing the Impact of Policies
This feasibility study collected much of the data that are analogous to baseline data that would be collected to address each research question.8
• Nutrient content of competitive foods offered—This outcome can be measured by collecting a list of all competitive foods offered in schools, and entering those food products in a nutrient database. This study fielded the Cafeteria Survey and Inventories of Competitive Foods to obtain lists of food products offered and data on number of products served. The reporting of servings data imposed a large burden on respondents, but servings data are not needed to evaluate the nutrient content of foods offered.
• Percent of students receiving reimbursable meals—This outcome can be measured by
collecting data on daily meal counts and numbers of students eligible for free and reduced-price meals; the participation rates calculated from these numbers might be adjusted by daily attendance data. This study collected meal counts from cafeteria managers and attendance data from school principals.9 Reporting of attendance and meal counts did not impose a large burden on respondents. Future studies, however, must determine the most efficient method for collecting attendance data if school principals are not used as respondents for a survey of competitive food policies.
• Impact of competitive foods on nutrient content of all foods as selected—This outcome
can be measured by collecting data on the nutrient content of competitive foods served. As discussed in the following section, simulation analyses are recommended to determine the impact of competitive foods on total nutrients served during the school day, rather than analyzing both competitive foods and reimbursable meals from the same sample of schools. For this feasibility study, the Cafeteria Survey and Inventories of Competitive Foods collected information about servings of competitive foods. Collection of servings data, however, imposed a substantial burden on respondents, and it became clear that a study attempting to collect servings of competitive foods would have to confront the problem of missing data (from non-food service-operated venues) and inaccurate data (cafeterias providing counts of portions prepared, rather than portions served).
The varying success of data collection on each outcome measure suggests that future studies may be able to evaluate only the first two outcomes for all schools. Missing data will likely result in a selected sample of schools for which the third outcome can be evaluated. Analyzing Nutritional Outcomes
This section discusses the analysis methods that may be applied to evaluate each of the three research questions identified in this chapter. It is important to remember throughout the discussion that the three research questions identified above represent different requirements for data collection and different levels of precision for the true outcome measure of interest. The true outcome measure of
8 Data were collected at a single point in time to evaluate feasibility, and cannot be used to analyze changes in outcomes. 9 We did not recognize the need to test the ability to collect data on numbers of students eligible for free and reduced-
price meals until after the data collection period. The data are not needed for the feasibility study, because we are not estimating the impact of policy changes with just one point of observation per school; it is expected that these data would not be difficult to collect.
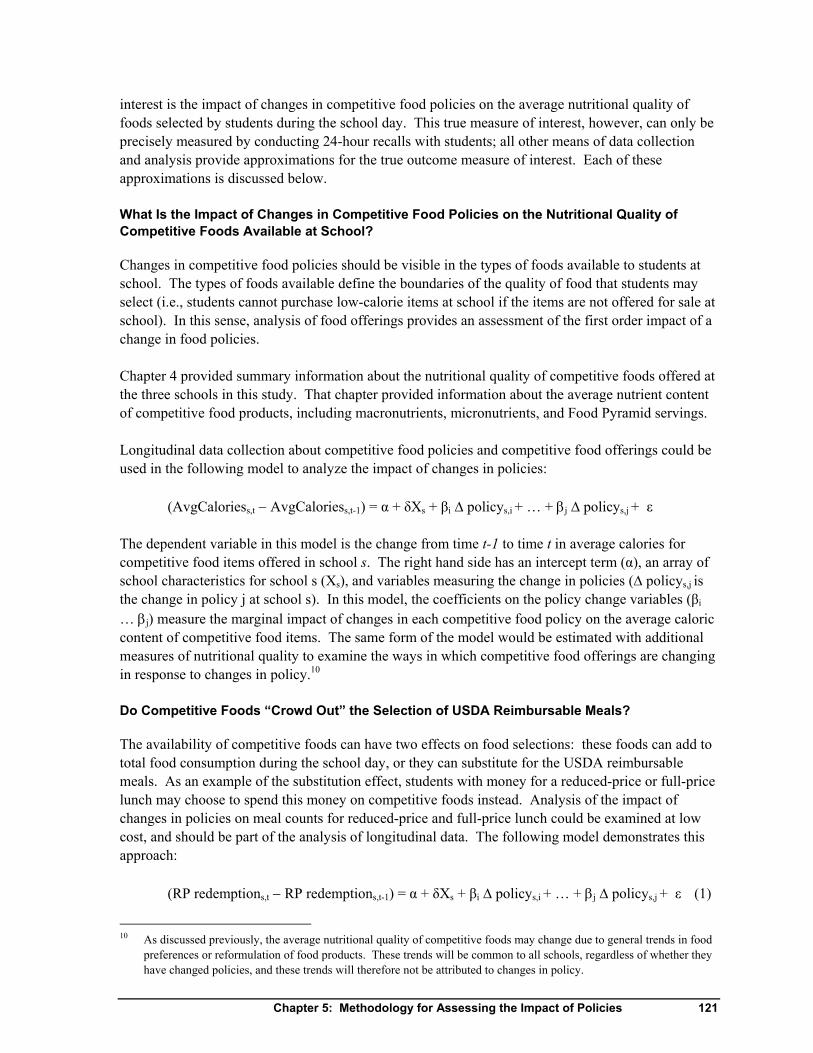
Chapter 5: Methodology for Assessing the Impact of Policies 121
interest is the impact of changes in competitive food policies on the average nutritional quality of foods selected by students during the school day. This true measure of interest, however, can only be precisely measured by conducting 24-hour recalls with students; all other means of data collection and analysis provide approximations for the true outcome measure of interest. Each of these approximations is discussed below. What Is the Impact of Changes in Competitive Food Policies on the Nutritional Quality of Competitive Foods Available at School?
Changes in competitive food policies should be visible in the types of foods available to students at school. The types of foods available define the boundaries of the quality of food that students may select (i.e., students cannot purchase low-calorie items at school if the items are not offered for sale at school). In this sense, analysis of food offerings provides an assessment of the first order impact of a change in food policies. Chapter 4 provided summary information about the nutritional quality of competitive foods offered at the three schools in this study. That chapter provided information about the average nutrient content of competitive food products, including macronutrients, micronutrients, and Food Pyramid servings. Longitudinal data collection about competitive food policies and competitive food offerings could be used in the following model to analyze the impact of changes in policies: (AvgCaloriess,t − AvgCaloriess,t-1) = α + δXs + βi ∆ policys,i + … + βj ∆ policys,j + ε The dependent variable in this model is the change from time t-1 to time t in average calories for competitive food items offered in school s. The right hand side has an intercept term (α), an array of school characteristics for school s (Xs), and variables measuring the change in policies (∆ policys,j is the change in policy j at school s). In this model, the coefficients on the policy change variables (βi … βj) measure the marginal impact of changes in each competitive food policy on the average caloric content of competitive food items. The same form of the model would be estimated with additional measures of nutritional quality to examine the ways in which competitive food offerings are changing in response to changes in policy.10 Do Competitive Foods “Crowd Out” the Selection of USDA Reimbursable Meals?
The availability of competitive foods can have two effects on food selections: these foods can add to total food consumption during the school day, or they can substitute for the USDA reimbursable meals. As an example of the substitution effect, students with money for a reduced-price or full-price lunch may choose to spend this money on competitive foods instead. Analysis of the impact of changes in policies on meal counts for reduced-price and full-price lunch could be examined at low cost, and should be part of the analysis of longitudinal data. The following model demonstrates this approach: (RP redemptions,t − RP redemptions,t-1) = α + δXs + βi ∆ policys,i + … + βj ∆ policys,j + ε (1)
10 As discussed previously, the average nutritional quality of competitive foods may change due to general trends in food
preferences or reformulation of food products. These trends will be common to all schools, regardless of whether they have changed policies, and these trends will therefore not be attributed to changes in policy.

122 Chapter 5: Methodology for Assessing the Impact of Policies
(FP redemptions,t − FP redemptions,t-1) = α + δXs + βi ∆ policys,i + … + βj ∆ policys,j + ε (2) where RP redemption = (avg daily # reduced-price lunch served) / (#students eligible for RP lunch) FP redemption = (avg daily # full-price lunch served) / (#students not eligible for free or
reduced-price lunch) The denominator for both measures of redemption might be adjusted by the average rate of absenteeism during the target week. If changes in competitive food policies reduce or increase the number of items available as “meal alternatives”, we would expect to see impacts on rates of reimbursable meal purchases among students who pay reduced and full price. How Much Do Competitive Foods Add to (or Subtract from) Total Food Energy, Key Nutrients, Added Sugars, and Fat Served to Students During the School Day?
This is the most difficult research question to address, due to the difficulty of collecting data on servings of competitive foods, and due to the denominator problem discussed below. This question may be evaluated with two fundamentally different approaches.
1. Collect data on all foods served throughout the school day and evaluate the contribution of competitive foods to total nutritional quality of all foods served.
2. Collect data on competitive foods served and evaluate the marginal contribution of competitive foods to total nutritional quality, under various assumptions about the quality of reimbursable meals (i.e., using the NSLP standards or extant data from SNDA-II or the Integrated Study).
These approaches differ with respect to the amount of data to be collected. Both approaches, however, must confront the denominator problem inherent in a study of all foods served at schools. The Denominator Problem The denominator problem is that it is not possible to collect data about foods consumed on a per-student basis from a cafeteria survey. School cafeterias monitor production of individual food items and servings of reimbursable meals. Prior studies of the nutritional quality of school foods have focused almost exclusively on the nutritional quality of the reimbursable meal, without estimating the nutrients consumed per student (for example, studies of meal quality do not account for a la carte purchases of “second helpings” or a la carte-only items).11 For this study, we collected data about the competitive foods offered and the sales of individual items, where available. There is no way, however, to assign these sales to individual students to assess the percent of students purchasing competitive foods. The only way to use these data is to assess competitive food purchases, on average, using different assumptions about the denominator (i.e., the universe of students who purchase competitive foods). Table 5.1 demonstrates this approach for
11 One exception was the analysis of 24-hour dietary recalls in SNDA-I.

Chapter 5: Methodology for Assessing the Impact of Policies 123
Schools #2 and #3; School #1 is excluded from analyses in this chapter because the sales data for competitive foods were incomplete. Table 5.1 shows the total number of competitive food items purchased at Schools #2 and #3 during the target week: 12,232 and 4,257, respectively. The average daily number of competitive food items purchased was 2,446 at School #2 and 851 at School #3. If we assume that all students are equally likely to purchase competitive foods, then the average number of items purchased per student per day is equal to the average daily number of items sold divided by average daily attendance: on average, students purchased 0.87 competitive food items per day at School #2 and 0.66 items per day at School #3. (Another way to look at this is that, on average, 87 percent of students purchased one competitive food item each day at School #2, and 66 percent of students purchased a competitive food item each day at School #2.) Table 5.1 Alternative Denominators for Assessing Competitive Food Sales on a Per Student Basis Measure School #2 School #3 Competitive foods Number of items sold during target week 12,232 4,257 Average daily number of items sold 2,446 851 Average calories per item (weighted by servings) 161.97 214.16 Student counts Attendance, daily average 2,823 1,297 Reimbursable meal counts, daily average 1,472 600 Average number competitive food items purchased per student per day
Denominator = all students [lower bound estimate] .87 .66
Denominator = (attendance – meal count) [higher bound estimate] 1.81 1.22
Average daily calories consumed from competitive foods per student
Denominator = all students [lower bound estimate per student] 140.91 141.35
Denominator = (attendance – meal count) [higher bound estimate per student] 293.16 261.28
Using total attendance as the denominator assumes that all students are equally likely to purchase competitive food items; this assumption yields a lower bound on the average number of competitive food items purchased per student per day. Alternative assumptions provide other bounds on the average consumption of competitive food items. A higher bound estimate on the average number of competitive foods purchased per student per day (among students purchasing any) might exclude from the denominator all students purchasing a reimbursable meal (i.e., those with bag lunch or a la

124 Chapter 5: Methodology for Assessing the Impact of Policies
carte entrée purchase). The resulting higher bound estimates of the number of items per student purchasing competitive foods are 1.81 items per student in School #2 and 1.22 items per student in School #3. Additional assumptions could be made about the denominator in order to provide a basis for comparison of competitive food purchases across schools. It should be clear, however, that analysis of the number of competitive food items purchased (or the average nutritional content of foods purchased) must necessarily rely on distributional assumptions about the number of students purchasing those items. Without 24-hour recalls with students, it is not possible to obtain data about per student consumption of foods that are served from multiple food venues within a school.12 Using these same assumptions about the average daily purchases of competitive foods items by students, the food energy contribution of competitive foods can be examined on a per student basis. Table 5.1 shows that if all students are equally likely to purchase competitive foods, then the average daily contribution of competitive foods to calorie intake is 141 calories in both Schools #2 and #3. (On average, competitive food items in School #3 have higher caloric content than in School #2, but students in School #3 purchase fewer items.) The higher bound estimates for the food energy contribution of competitive foods on a per student basis are 293 calories at School #2 and 261 calories at School #3. Contribution of Competitive Foods to the Nutritional Quality of All School Foods Our proposal recommended that nutrient analyses and servings data for reimbursable meals are not needed to estimate the impact of competitive foods on the overall nutritional quality of all school foods. The data collection plan included reimbursable meals information (food product descriptions and servings data), but these data were not entered in FIAS and reimbursable meal components were not included in the analyses presented in Chapter 4. Building on the information presented in Table 5.1, simulation analyses could be conducted to determine upper and lower bounds for the overall nutritional quality of foods at school, given information collected about competitive foods. Table 5.2 provides an analysis of the impact of competitive foods on the total calories provided to students who receive reimbursable meals. The NSLP nutrition standards for reimbursable meals, and the SNDA-II findings from a nationally representative survey, provide two benchmarks against which to gauge the impact of competitive foods. Use of these benchmarks allows evaluation of the average impact of competitive foods. When estimated average daily calories from competitive foods is combined with benchmarks for the content of reimbursable lunches, we see that competitive foods raise the food energy content of food selections during the school day to between 36 and 39 percent of total daily recommended energy allowance. The combination of competitive food data from one sample with out-of-sample information—through simulation analysis—could greatly reduce the burden imposed on respondents to USDA surveys. The use of benchmarks for evaluating the range of average impacts is valid—if both SNDA-II and the competitive foods survey use nationally representative samples, we can combine the average characteristics of reimbursable meals and the average characteristics of competitive foods without 12 Even if POS systems provided the data to derive per student consumption of food service items from the cafeteria lines,
the prevalence of vending machines and off-line snack bars precludes derivation of per student servings data.

Chapter 5: Methodology for Assessing the Impact of Policies 125
collecting reimbursable meal and competitive food data from the same sample. We cannot, however, say anything about the distribution of the combined data; for example, we cannot determine the percentage of students with total food selections during the school day above certain standards. Table 5.2 Contribution of Competitive Foods to the Overall Nutritional Quality of Foods at School Measure Food Energy Percent REA NSLP standard for food energy 825 33.0%
SNDA-II findings for average food energy provided in USDA lunch in secondary schools
750 30.0
Feasibility sample Average daily food energy from competitive foods, per student
141 5.6
Total food energy from all foods, assuming NSLP standard met for USDA lunch
966 38.6
Total food energy from all foods, assuming school is average (i.e., SNDA-II findings)
891 35.6
Conclusions
For ongoing monitoring and analysis, we have three recommendations:
1. Maintain updated information about state policies on the FNS website.
2. Monitor competitive food practices with a survey of schools (fielded on a regular basis), to obtain information about school practices with regard to competitive foods. Limit data collection at the school-level to observable practices, so that collected data will be consistent across schools and over time.
This sample should be large enough to provide national estimates of the prevalence of various competitive food practices.
3. Begin a longitudinal survey with a subsample of schools from #2. Follow these schools to collect data over time about changes in school practices, types of competitive foods offered, and rates of participation in the USDA reimbursable meal programs. For the same schools, collect information about district-level competitive food policies. Districts are more likely than schools to have codified policies because policy-making at the district level must be formally communicated to multiple schools.
This panel of schools will provide data for examining the impact of changes in state and district competitive food policies on the nutritional quality of foods available to students, and the impact on rates of participation in USDA meal programs.

References 127
References
Cline, T. and G. White. Position of the American Dietetic Association: Local support for nutrition integrity in schools. Journal of the American Dietetic Association 100(1):108-111, 2000. Fox, M.K., M.K. Crepinsek, P. Connor, and M. Battaglia. School Nutrition Dietary Assessment Study-II: Final Report. Alexandria, VA: U.S. Department of Agriculture, Food and Nutrition Service, Special Nutrition Programs Report no. CN-01-SNDAIIFR, April 2001. Gleason, P. and C. Suitor. Children’s Diets in the Mid-1990s: Dietary Intake and Its Relationship with School Meal Participation, CN-01-CD1. Alexandria, VA: U.S. Department of Agriculture, Food and Nutrition Service, 2001. National Research Council. Diet and Health: Implications for Reducing Chronic Disease Risk. Washington, DC: National Academy Press, 1989a. National Research Council. Recommended Dietary Allowances, 10th ed. Washington, DC: National Academy Press, 1989b. U.S. Department of Agriculture. Changing the Scene: Improving the School Nutrition Environment. Alexandria, VA: U.S. Department of Agriculture, Food and Nutrition Service, August 2000. U.S. Department of Agriculture. Foods Sold in Competition with School Meal Programs: A Report to Congress. Alexandria, VA: U.S. Department of Agriculture, Food and Nutrition Service, August 2001. U.S. Department of Agriculture. Testimony of Eric M. Bost, Undersecretary, Food, Nutrition and Consumer Services, Before the Senate Committee on Agriculture, Nutrition and Forestry, April 3, 2003. http//www.fns.usda.gov/cga/Speeches/CT040303.html. U.S. Department of Agriculture, Agricultural Research Service. Documentation: Pyramid Servings Database for USDA Survey Food Codes, October 2000. Online at http:/www.barc.usda.gov/bhnrc/ cnrg. U.S. Department of Agriculture, Food and Nutrition Service. Eat Smart. Play Hard, 3000. http://www.fas.usda.gov/eatsmartplayhard. Accessed June 2003. U.S. Department of Agriculture, Food and Nutrition Service. State Competitive Foods Policies, September 2002. http://www.fns.usda.gov/cnd/lunch/competitive foods/state_policies_2002.htm U.S. Department of Health and Human Services. Healthy People 2010: Understanding and Improving Health, 2d ed. Washington, DC: U.S. Government Printing Office, 2000. U.S. Departments of Health and Human Services and Agriculture. Nutrition and Your Health: Dietary Guidelines for Americans, 4th ed. Washington, DC: U.S. Government Printing Office, 1995.

128 References
U.S. Departments of Health and Human Services and Agriculture. Nutrition and Your Health: Dietary Guidelines for Americans, 5th ed. Washington, DC: U.S. Government Printing Office, 2000. U.S. Food and Drug Administration, Center for Food Safety and Applied Nutrition. A Food Labeling Guide, Sept. 1984 (rev. June 1999). U.S. Food and Drug Administration. Kurtzweil, P. “Daily Values” encourage healthy diet. FDA Consumer Magazine, 27(4): May 1993. Online at http://www.fda.gov/fdac/special/foodlabel/dvs. html. Accessed July 2003. Wechsler, H., N.D. Brener, S. Kuester, and C. Miller. Food service and foods and beverages available at school: Results from the School Health Policies and Programs Study 2000. Journal of School Health 71(7):313-324, 2001.

Appendix A: Instrument Design and Data Quality Issues A-1
Appendix A Instrument Design and Data Quality Issues
This appendix provides a list of specific issues regarding the quality of the data obtained for this feasibility study. The main sources of information include in-person discussions with respondents during training, technical assistance, and debriefing visits; on-site observations made by study staff; and review and coding of the surveys and competitive foods data. Data quality and instrument design issues are discussed for each instrument, where relevant; and some recommendations for future testing are provided. Principal Survey
Data Quality
There were discrepancies between the principals’ reports of the types of competitive foods available and the number and location of vending machines, and what was observed at the school by Abt Associates staff. For example, in two of the schools principals reported the existence of a vending machine that neither the SFA director nor Abt staff could locate. There were also some discrepancies between principal reports of the types of vending machines in the school (e.g., milk, water, snacks, etc.) and the data collected from the vending machine inventories. In part, this was because there is often a mix of items within the same machine, and the response categories to capture this on the questionnaire were limited. Item Nonresponse
There were many questions that principals either could not answer, could not answer without consulting other school personnel with more knowledge about competitive food policies, or did not answer accurately (based on discussions during debriefing and comparisons with SFA director responses). Principals frequently chose the “don’t know” option for questions about the existence of competitive food policies, pouring rights contracts, and nutrition initiatives. One issue is that school-specific policies are not necessarily documented, especially if they have been in effect for a long time. Another is that some foods or practices are “discouraged” rather than prohibited, or not considered “nutrition policies.” For example, at one of the high schools the principal has asked teachers to sell non-food items for fundraisers. This was communicated during an all-staff meeting at the beginning of the school year, but is not a documented rule. In addition, the discipline code for the middle school prohibits gum chewing, but there is no policy prohibiting the sale of gum. Another issue is that ques-tions about foods prohibited were sometimes answered based on actual practice, rather than knowl-edge about explicit policy. For example, coffee or tea were marked as “prohibited” because they are never offered at the middle school, but the principal was unaware of a policy restricting their sale. Principals were not knowledgeable about the financial arrangements concerning food sales at their schools. The principal of one school with beverage sales covered by a pouring rights contract was unaware of the contract. Principals also found it difficult to answer questions about the profit earned from competitive food venues, and did not always consult others to obtain the requested information.

A-2 Appendix A: Instrument Design and Data Quality Issues
Principals in two schools would have needed to collect this information from teachers and athletic directors and, in the third school, from the city business manager. (They were not asked to provide profit information for food service-operated food venues.) The only other school personnel principals consulted when completing the survey were cafeteria staff. Instrument Design Issues
Information about the types of vending machines might be better collected with a checklist of items in each machine and post-coding of these data to assign category codes. This procedure would eliminate the discrepancies between the principal report of types of vending machines and the information contained on inventory forms. Because of the manner in which the vending machine section of the questionnaire was structured, it was not possible to relate certain environmental characteristics or policy issues to individual vending machines. For example, the person or organization responsible could not be mapped to the type, location, and hours of availability of each machine (although, for this study, the mapping was obtained from the on-site observation and discussions with school personnel). Future data collection efforts might consider collecting detailed data for each individual vending machine. A question asking if parents or teachers are “permitted” to offer students food or beverages in the classroom was misinterpreted by at least two of the three principals. All answered in the negative, but during the debriefing principals mentioned that teachers have discretion to use candy, snacks, and pizza parties as rewards, and parents can bring in food for special occasions. This question should be presented differently on future surveys. The current instrument asked about restrictions on access to food venues, but did not ask about compliance. For example, information obtained during on-site visits suggests that vending machine timers may not always work. Recommendations
Much of the information collected on the Principal Survey seemed better suited to a site-visit protocol that could combine an in-depth interview with on-site observation. The self-report survey resulted in poor quality data that would be of questionable value had we not been able to supplement and revise those data from information obtained on-site. Future studies might consider one of the following two data collection options:
• On-site data collection interviews and direct observation by study staff while training on foods forms, or
• SFA staff to complete competitive food checklists (types, locations, hours, etc.), followed up with telephone interview.
SFA Director Survey
Data Quality
Not surprisingly, SFA directors seemed to be knowledgeable about school food policies for their district and, compared with principals, had less difficulty answering these questions. SFA directors

Appendix A: Instrument Design and Data Quality Issues A-3
also seemed motivated to consult with others in order to answer all survey questions. For example, the SFA director for the one school covered by an exclusive beverage contract obtained a copy of the contract, and conferred with the city business manager prior to completing that section of the survey. Item Nonresponse
There were no problems. Instrument Design Issues
SFA directors had some of the same difficulty interpreting questions about “policies” as the school principals. The SFA director in one of the high schools noted that the school committee “requested” that certain beverages (juice and water) be made available for sale to students throughout the school day. He implemented the request, but was not sure this was considered “policy.” One director felt the survey needed clearer delineation between questions that asked about district practices/policies and those about the specific school participating in the study. SFA directors could not readily provide data on total profit earned from vending machine or snack bar sales.1 One problem is that a school food service is considered a nonprofit entity—it is not supposed to earn a profit, so the terminology used in the survey was confusing to SFA directors. Information on revenue from the various food service-operated competitive food venues is easy for directors to provide. Data on expenses, however, are much more difficult to obtain and usually cannot be separately estimated for the different sources of food (i.e., vending versus a la carte expenses). As with the Principal Survey, the structure of the questions on vending machines was limiting. For example, it was difficult for one SFA director to respond to the question about the types of schools (elementary, middle, or high) in which the food service has primary responsibility for vending machines, because this varies by type of machine (e.g., beverage versus ice cream). The one respondent who completed the section on food service management company (FSMC) involvement felt it was “a waste of time”; she reported that the SFA makes all decisions about the foods allowed to be served to students, and the FSMC simply implements them. There were some minor issues with the survey items about components of reimbursable meals also offered on an a la carte basis, and about a la carte pricing. In one of the schools, students can only buy a full second meal a la carte, not the individual components. There was no way to indicate this on the survey. Another school charges less for an a la carte entrée than a full reimbursable meal, but if combined with milk, the prices are the same. Recommendations
Although the SFA directors reported that the survey was “easy”, there were still a significant number of survey items that they found difficult to interpret and answer. The survey might be improved by including more opportunities for open-ended narrative responses that can accurately capture
1 They were not asked about the amount of profit earned from a la carte sales—only whether or not a la carte service was
profitable.
A-4 Appendix A: Instrument Design and Data Quality Issues
information about individual SFA experiences (recognizing that these data require more resources to process and analyze). Cafeteria Survey
The Cafeteria Survey consisted of seven data collection forms, as described in Chapter 2. Selected forms are discussed below, by topic. Data Quality
Data quality problems were encountered for three data items: weekly a la carte sales dollars (Daily Meal Counts Form), number of food servings (Every Day and Cafeteria Foods Forms), and manufac-turer product codes (Every Day and Cafeteria Foods Forms). In addition, there was a small amount of confusion about the identification of menu items as “a la carte only”, “reimbursable only”, and “both”. Respondents at two of the schools did not have easy access to information on the weekly a la carte sales total (in dollars). In one high school, a daily “Sales Activity Report” included a total sales amount that combined a la carte sales (adults and students), vending sales, and sales of a few non-food items.2 At the second high school, revenues from food-service operated vending machines are added to the daily a la carte totals, and the POS system reports the combined amount (this amount does not include adult a la carte sales).3 In contrast, the middle school manager was able to obtain a la carte sales (in dollars) directly from daily POS reports; this figure usually included sales to no more than one or two adults. Incorrect data on the number of servings were provided on the Every Day and Cafeteria Foods Forms by two of the three schools. These two respondents recorded the number of servings prepared, rather than the total number served or sold. One of the schools that provided incorrect data had access to the correct data because both the number prepared and number leftover are recorded on daily produc-tion records. In the second school, information on servings was not always available for individual menu items and not always in terms of portions.4 In addition, one school provides free meals for cafeteria staff, which are not tracked in the POS system or on production records. These problems did not affect the analysis of a la carte-only foods, but would have been significant for an analysis of reimbursable meal items. The cafeteria manager in the third school provided correct servings data because she was able to simply transcribe the “number of portions used” from her daily production records to the “number of portions served” column on the cafeteria foods forms. This was not possible for milk, however,
2 The manager subtracted vending and non-food sales each day, and totaled the remainder over the five days of the target
week in order to provide total weekly a la carte sales; this amount included a la carte sales to teachers. The only way to exclude teacher sales would be to record their purchases by hand at point of sale. Doing this for one day during the target week confirmed the manager’s report that a la carte sales to teachers was minimal.
3 For this school, it would be necessary to subtract vending machine from a la carte sales during analysis. 4 For example, the total portions of “chicken” served were provided, but this count was for chicken patties, chicken
nuggets, and chicken fingers combined. The form included the amounts of each type of chicken prepared, but only in terms of the number of cases or pounds. In order to estimate the number of servings of each type of chicken sold, it would be necessary to request additional information on the number of portions per case/pound for these items.

Appendix A: Instrument Design and Data Quality Issues A-5
because the production records differentiate milks by size (14 oz and 8 oz), but not by flavor or fat content. The inventory method was used to track sales of milk at this school. One complication for servings datacommon to all schoolsis the difficulty of excluding adult servings from total servings counts. This does not appear to be feasible in any of the three schools without putting special, manual procedures in place. All managers reported that adult sales are minimal. The additional burden of asking schools to track adult sales is probably not worth the small gain in accuracy of the data. The third item subject to data quality problems was product codes. Upon review of the survey forms, it was clear that most of the codes recorded were distributor codes (item order numbers), rather than the manufacturer codes. The task of providing manufacturer product codes for pre-prepared food items was problematic in two of the three schools. One respondent noted that identifying and recording product codes “was the hardest part” of the Cafeteria Survey. She found that some boxes had more than one code, and others did not have a code at all. Despite special attention to the issue during training and technical assistance visits, the middle school manager was unable (or possibly unwilling) to provide manufacturer product codes. She also had difficulty identifying which foods were processed commodity items, one of the types of preprepared foods for which product codes were requested. In the third school, product codes were provided, but for more foods than necessary and sometimes in addition to another code (UPC or distributor code). The cafeteria manager in this school had access to some product codes on preprinted production record forms and in a purchasing handbook used throughout the district. All respondents thought it would be easier to record distributor item numbers, rather than product codes; although one felt the SFA director should be responsible for this task. One of the SFA directors pointed out, however, that distributors change items without changing the numbers, and they make substitutions. She recommended requesting SFA directors’ purchasing specifications, at least for districts where purchasing is centralized. It seems that it would be difficult to obtain any single, standard document from all SFA directors that includes all of the foods served at the school. A fourth item on the Cafeteria forms that showed data quality problems was the field of the Every Day and Cafeteria Foods Form that required indication of whether each menu item was available as “a la carte only,” “reimbursable only”, or “both a la carte and reimbursable.” Respondents had some difficulty with this form field. For example, in two schools where a la carte purchases of fruit and vegetables are very minimal, managers marked these items as “reimbursable only.” This did not affect the analysis of a la carte-only foods, and could probably be resolved with additional emphasis in the instruction manual and during training. Finally, missing recipe data was a problem for sandwiches in two of the three schools, although components of sandwiches were recorded on cafeteria foods forms in both cases. Item Nonresponse
There were two main problems of missing data on the Cafeteria Forms: (1) the respondent at one school omitted condiments altogether from the Cafeteria Survey, and (2) one cafeteria manager did not use the Inventory of Every Day Prepackaged Foods correctly, resulting in missing data. Both problems affected the data received from the manager for the middle school (School #1).

A-6 Appendix A: Instrument Design and Data Quality Issues
The starting inventory was missing from the Inventory of Every Day Prepackaged Foods Form (she recorded bulk packaging information in this column). During the technical assistance visit, study staff learned that the manager had been out on Monday of the target week, and therefore no starting inventory was taken. During follow-up, the manager reported that most items were sold out by the end of the week, and recalled having only ten bags of chips and six cases of Snapple left on Friday afternoon. Deliveries were received for some items on Monday, and others on Thursday. There were also some items recorded on the form for which no starting inventory, deliveries, or ending inventory were reported. Instrument Design Issues
The Self-Serve Bar Form created some problems for respondents. Respondents in two schools had difficulty knowing which forms to use to record condiments. In one high school with a condiment bar (School #2), the respondent used the Self-Serve Bar Form to record these items. Instead of providing an inventory of amounts put out and left over for just one day, as described in the instruc-tions, the form was used like the inventory forms, and accounted for all of the bulk containers used on the bar over the course of the week. In fact, this information would have been more useful during analysis than a one-day inventory, especially because the school was unable to say how many students actually used the condiment bar. In addition, as noted above, one respondent failed to use the Self-Serve Bar Form, and omitted condiments altogether from the Cafeteria Survey.5 The Inventory of Every Day Prepackaged Foods form was not used for prepackaged condiments offered every day, as intended. Instead, for the one high school that offered individually packaged condiments, the cafeteria manager recorded daily the number of full cases and fractions of a case (e.g., 2¼ cases) taken by students each day on the Every Day Cafeteria Foods Form. It seems as though it would have been less burdensome to use the inventory method and count the cases (and fractions of cases) at the beginning and end of the week only, assuming deliveries of these items did not occur frequently. Although estimating fractions of cases is not as precise as counting individual packages; this seemed like a reasonable compromise, and preferable to obtaining no information on condiment use at all. The issue of shared stockrooms for multiple sources of competitive foods came up in the high school that sells a la carte-only items from the cafeteria line versus a separate snack bar (School #3). Many of the same foods and beverages sold on the line are also stocked in the food service-operated vending machines in the cafeteria. Although it was assumed it would be too difficult to use the inventory method in schools with shared stock rooms, the cafeteria manager was instructed to take the a la carte inventory before beginning to fill the vending machines and complete both forms according to the instructions. The numbers of items added to the vending machines during the target week were then subtracted from the calculated number sold for the a la carte items during analysis. Although a bit tedious to identify the specific items that appeared in both places, in the future the forms could include a column for respondents to indicate the items served in multiple venues.
5 In subsequent discussions, the manager realized that the easiest way to record condiments for her school (bulk, self-
serve, vary daily) would be to use the Self-Serve Bar Form for a daily inventory of the number of cans used.

Appendix A: Instrument Design and Data Quality Issues A-7
Recommendations
Overall, many of the problems that were encountered with the Cafeteria Survey instruments might be alleviated with more and better-timed on-site technical assistance. Some of the problems, however, were likely to be due to the fact that cafeteria managers were overwhelmed with the amount of data requested, and shortcuts were attempted and mistakes made. A separate form for recording condiments should be considered to help avoid the missing condiment data issue. Sample completed forms for all of the various ways in which offer condiments could be added to the instruction manual. To avoid errors in the reporting of a la carte sales dollars, it would be advisable to request copies of the POS report for each day of the target week or, as one SFA director suggested, obtain this informa-tion as part of the SFA Director Survey. Having POS records would allow a check on the calcula-tions performed by cafeteria managers. Inventory of Snack Bar Prepackaged Food and Beverage Items
Only one of the three schools (School #2) had a snack bar in the cafeteria, and it was instructed to complete the snack bar forms. Because the school did not offer cafeteria-prepared items or reimbursable meals at the snack bar, the Inventory of Prepackaged Snack Bar Items (inventory method) was to be used alone. Unfortunately, the form designed for this study was not used. Data Quality/Item Nonresponse
The SFA director for School #2 created a spreadsheet of all foods and beverages sold in the snack bar in an effort to save staff the time it would take to write food descriptions. The SFA director planned to enter food names and descriptions, bulk packaging information, and package sizes, so that the snack bar staff would only have to enter the inventory information. Unfortunately, there were two problems with this approach. First, the SFA director’s form omitted some items that were available for sale during the target week (based on validation data collected by Abt Associates study staff). Snack bar staff did not add these items to the form, so they were not inventoried and sales data were not available. Second, package size and packaging information were missing for a large number of foods and had to be obtained via follow-up contacts with the SFA director before the nutrient content could be analyzed. The significance of these problems in a larger study could be great, and points to the need for respondents to provide information on standardized forms. Instrument Design Issues
The Inventory of Prepackaged Snack Bar Items was unable to accommodate damaged items that were included in the starting inventory but could not be sold. This could be a problem if the damaged items are either returned to the supplier or discarded. Apparently, this does not occur frequently, either for the snack bar or other competitive food sources, so it is probably not a major issue.

A-8 Appendix A: Instrument Design and Data Quality Issues
Inventory of School Store Food and Beverage Items
Two of the three schools surveyed had school stores. One school store supervisor willingly cooperated with the survey and provided high quality data (School #3). The second school store supervisor was unwilling to use the instrument provided (School #2); thus, the test of the instrument is based on only one respondent. Data Quality
The faculty supervisor for the store at School #3 provided complete descriptions of each item, including manufacturer and brand names, and completed the starting and ending inventories. Because this was a testing week at the school, she did not receive any deliveries, and none were recorded on the form. The store supervisor did note that sales (in dollars) were fairly typical, so students were choosing other items when stock ran out. For example, they would buy Juicy Fruit gum instead of Big Red. Because her cash register was not working during the target week, sales were computed manually (students counted items sold and multiplied by price). Item Nonresponse
The second school store supervisor provided invoice data in lieu of completing the survey form. The invoice provided some information on the items sold in the school store, but did not include full food descriptions or package sizes.6 Furthermore, based on information collected by Abt Associates staff as part of the validation, it was clear that the weekly school store invoice was not representative of all food items available or sold to students during a typical school week. At a minimum, one would want to collect invoices for a full month of orders, although follow-up would still be required to obtain package sizes. When study staff attempted to obtain package size information from manufacturers or their websites for certain candies, beef jerky, and gum, they found that several sizes were available and could not know which size was actually sold in the school store. Inventory of Vending Machine Items
Data Quality
The Inventory of Vending Machine Items seemed to work quite well for the two high schools with food service-operated vending machines. Both managers reported that the forms were easy to complete. The only problem encountered with these forms was that respondents did not always fill out the vending inventory form as intended (e.g., items in multiple slots were combined on the form), although it usually did not result in any loss of data. Additional training or technical assistance earlier in the data collection week could alleviate these minor issues. In addition, one school (School #3) operated a shared stock room for a la carte sales and vending machines, and the data had to be adjusted to account for the shared inventory.
6 An order/price book from the distributor who supplies food items for the school store was provided, but it did not
contain the needed package size information.

Appendix A: Instrument Design and Data Quality Issues A-9
Item Nonresponse
The main issue for the collection of information on vending machine items was the feasibility of obtaining data on the number of items sold (and, for some items, complete food descriptions) from machines stocked by an outside distributor. As noted in Chapter 2, this information was available for only one of the three schools, from only one of four vendors. Principals and two of the three SFA directors were unable to assist in obtaining this information because they were not directly involved with the vending machines in any of the three schools.

Appendix B: Validation Study Findings B-1
Appendix B Validation Study Findings
This appendix presents results from the validation component of the feasibility study. Abt Associates staff collected information about the competitive foods available to students on one day during the target week at the three sample schools. The objectives of this on-site data collection were to: (1) corroborate the identity of competitive foods described by school staff on study forms; (2) check that respondents provided a comprehensive list of items available; and (3) document the ability of an outside observer to collect detailed data without disrupting school operations. The data collection process and analysis results are described in the sections that follow. Collection of Validation Data
As mentioned in Chapter 2, during the on-site technical assistance visits with cafeteria staff, study staff collected a complete description of all competitive foods and beverages available, including manufacturer and product name, package or serving size, and price. For vending machines, the machine location and slot numbers were also included. They used the same study forms as those used by cafeteria and other school staff to record the main study data. All items offered a la carte-only, in vending machines, snack bars, and school stores were recorded on the forms. To provide a larger sample and variety of competitive food items, validation data were also collected for the vending machines that operate after school only at School #3. In addition to providing data to assess the completeness of the information respondents recorded on study forms, study staff documented the time spent and their experiences collecting these data at the schools. Findings are discussed here, although it should be noted that time estimates include the purchasing of a sample of items from each competitive food venue. Labels from these items were compared to nutrient information obtained from the nutrient database used for the feasibility study (discussed in Appendix C). A la Carte-Only and Snack Bar Items
The time spent completing the validation data collection for a la carte-only foods and beverages ranged from 20 minutes at School #1 (middle school) to 50 minutes at School #2 (snack bar). The mean completion time over all three schools was approximately 33 minutes. As anticipated, the data collection time increased with the total number of items offered. Two main problems were encountered when collecting information on a la carte-only items. First, it was difficult for observers to spot or gain access to all of the a la carte-only offerings at all three schools. For the two schools where a la carte service is operated off the main cafeteria line, items were located in multiple areas of the cafeteria, under counters, in freezers, or on multiple serving lines. In the school with the snack bar, many items were not accessible due to the small and busy serving area. Without the assistance of cafeteria staff in all three schools, it would not have been possible to identify all of the a la carte-only items available, or record complete descriptions and package sizes.

B-2 Appendix B: Validation Study Findings
The second problem was that prices were not always posted. Cafeteria staff assistance was needed at all three schools to obtain pricing information for a la carte-only food items. Vending Machine Items
Recording the foods or beverages in each vending machine required from 10 to 25 minutes, or an average of 16 minutes per machine. The main difficulty with the collection of these data was obtaining the package size for some items and certain vending machines. For machines dispensing snack items, package sizes were not always visible due to the positioning of the packages in the machine. This was a particular problem for gum and candy in small packages with very small printing on the labels. For most beverage machines and one ice cream machine, it was not possible to “see” into the machine to read the labels. Staff had to rely on the posted label for each slot for food descriptions and sizes (if available). On one beverage machine, a package size was posted on the outside of the vending machine, between two buttons, making it unclear which of two beverages was the posted size. Without actually purchasing the item, there may be no definitive way to accurately record the package size for some items. It was also not clear that the posted descriptions and sizes were always accurate. On two occasions, when study staff tried to purchase a sample of items, they found the machines did not vend the posted item.1 Prices for individual vended items were posted on the machines. School Store Items
Obtaining information on the food and beverage items available in the two school stores took an average of 36.5 minutes per store (30 and 43 minutes). The assistance of store workers in one school was required in order to record the foods and their descriptions, because most of the food items were located behind the counter. In the other school, although no assistance was needed to record information about the food items, access to the store had to be scheduled with the store supervisor. Operating hours for this store were limited to mornings, before classes started; due to space limitations, the inventory could not have been conducted while students were making purchases. Prices were posted for most, but not all, food and beverage items offered for sale at the school stores. Validation Results
The validation data collected by Abt Associates staff were compared to the information provided by cafeteria and other school staff on the Cafeteria Survey and other competitive food forms. Three main types of discrepancies were noted for the competitive food and beverage items recorded in the three schools: (1) missing items, (2) missing or incomplete food descriptions, and (3) missing or incomplete package sizes.2 Food descriptions and package sizes were considered missing/incomplete
1 Other issues that observers encountered when purchasing items from the vending machines included locked machines
(machines were on timers) and non-functioning machines. 2 Vending machine location and item slot numbers were also validated for the 15 vending machines included in the
analysis reported here. Location was missing for three machines (20 percent), and slot numbers were omitted for eight machines (53 percent).

Appendix B: Validation Study Findings B-3
if the information provided was insufficient to code accurately the food in the FIAS nutrient database. Price data were not requested from respondents, and thus are not included in the analysis; as discussed previously, however, the data were collected by study staff to test the feasibility of doing so by direct observation. Table B.1 presents the results of the validation study analysis, citing the extent of missing or incomplete data for each source of competitive foods (a la carte, snack bar, vending, and school store), and for all sources combined.3 Problems with food descriptions are reported separately for the various components of the description, that is, manufacturer name and product name (food type, brand, flavor, percent fat or other indication of nutritional value). Likewise, package size issues are indicated for both the amount and the unit of measure. For example, for a 20 ounce bottle of a juice-based drink, “20” represents the amount and “ounce” is the unit of measure. Overall, across all sources of competitive foods in the sample schools, only 5 percent of the competitive foods observed by study staff were missing completely from the school foods forms.4 Missing data did vary somewhat by source of food, however. The respondent for the one school store included in this analysis provided a complete listing of all food/beverage items available (0 percent missing). Cafeteria managers for the two schools with a la carte-only items missed about 12 percent of all items available. This degree of missing data might have had an impact on conclusions drawn about the number, type, or nutritional characteristics of a la carte-only items offered in the these schools.5 The main source of missing or incomplete data for items reported by respondents was the package size. Almost one third of the items reported were missing or had incomplete information about the unit of measure, and 14 percent had problems with the amount. These problems can be attributed almost exclusively to the issue with the collection of snack bar data at School #2. The school food service staff used a spreadsheet set up by the SFA director in lieu of the study form, and the spreadsheet was missing package sizes altogether for over half of all items. Package-size reporting was also a problem for a small share of foods (6 percent) in vending machines. For example, school personnel omitted package sizes for Lifesavers, gum, and a few snack items at School #3, and Abt staff package sizes differed for some snack and ice cream items from descriptions provided by a vending distributor for School #2.
3 The analysis excluded (1) vended beverages at School #1—the only source of data on these items was the validation
data collected by study staff; and (2) school store food and beverage items for School #2—data provided by school staff were not for the target week when validation data were collected.
4 Only items that appeared on study staff forms but not respondents’ forms were identified as missing. It was not possible to validate items that appeared on respondents’ forms but not on the validation forms; these items may have been available at some point during the target week, but were not in stock on the day of the validation data collection.
5 All nutrient analyses for this report combined data from respondents and the validation study to provide a more complete picture of the competitive foods available in the three schools.

B-4
Appendix B
: Validation Study Findings
Table B.1 Extent of Missing or Incomplete Data on Competitive Foods, Overall and by Source
All Sources A la Carte Snack Bar Vending School Store Number % Number % Number % Number % Number % Items missing from study forms 15 5.1 5 11.5 2 3.4 8 5.3 0 0 Food description missing/incomplete
Manufacturer 65 22.1 12 26.7 44 75.9 9 5.9 0 0 Product name 46 15.6 8 17.8 14 24.1 15 9.9 9 23.1
Package size missing/incomplete
Amount 42 14.3 0 0 32 55.2 9 5.9 1 2.6 Unit 37 32.4 0 0 29 50.0 7 4.6 1 2.6
Total number of itemsa 294 45 58 152 39 a Excludes vended items for School #1 and school store items for School #2.
Sources: Validation data, Cafeteria Survey, and Inventories of Competitive Foods.

Abt Associates Inc. Appendix B: Validation Study Findings B-5
Food descriptions were missing, or to some extent incomplete, among all sources of competitive foods. Overall, 22 percent of items were missing manufacturer name, and about 16 percent had incomplete product names. One possible explanation for missing manufacturer names may be that, with the more recognized branded foods such as Doritos or Cheetos, cafeteria managers may have thought that brand was sufficient to describe the product.6 Some examples of product names with problems are shown below. Missing information provided by the validation data collected by Abt study staff is shown in parentheses.
• Veryfine Orange juice (100% juice) • Veryfine iced tea with lemon (Chillers, vitamin-fortified) • Chipburger (Good Humor premium cookie sandwich) • Hostess cupcakes (chocolate) • Snapple (fruit punch) • Strawberry shortcake ice cream bar (Hood) • Sunbelt chewy chocolate chip (granola bar) • Extra spearmint gum (sugar-free) • Chex Mix (Betty Crocker traditional) • Honey buns (Hostess iced) • Hershey chocolate milk (2% fat, calcium-fortified)
Food description problems were greatest for the snack bar, with three quarters of items missing manufacturer and one quarter with incomplete product names. The vended items recorded by respondents had the fewest food description problems (less than ten missing manufacturer or with incomplete product names). Without the validation data collected for the feasibility study, follow-up telephone calls to cafeteria staff and SFA directors would have been required to obtain the data needed for an accurate nutrient analysis.
6 Manufacturer name is not always essential to enter a food into a nutrient analysis system, but it is difficult to provide
respondents with “rules” about when they are and are not useful.

Appendix C: Nutrient Database Issues C-1
Appendix C Nutrient Database Issues
The Food Intake and Analysis System (FIAS), version 3.99, was used to code and analyze the food energy and nutrient content of the competitive foods offered in the three sample schools. FIAS was chosen for the feasibility study for three main reasons: (1) the database includes the nutrients and dietary components of most interest to FNS; (2) the database includes commonly consumed snack and beverage items, some of which can be specified by brand name; and (3) food codes can be linked to the USDA Pyramid Servings Database, which provides Food Guide Pyramid food group servings for each item.1 In addition, FIAS is being considered for use in a large, national study of the USDA meal programs (Integrated Study of School Meal Costs and Outcomes). Thus, FNS was interested in learning about any problems and issues with the use of FIAS that might have implications for this and other future studies. This appendix reports the experiences of the project nutritionists who entered the competitive food items into FIAS for nutrient analysis. They identified three key issues:2
1. FIAS did not always specify or include all brands or flavors of the foods—the implications of this finding are not clear.
2. Some foods could not be coded in FIAS—nutrient values for these items had to be “added” to the database.
3. Most ice cream novelties could not be entered in FIAS without a package weight—weight information could not always be obtained, even from manufacturers.
Following a brief description of the FIAS entry procedures, each of these issues and related analyses are discussed in detail. The second part of this appendix presents findings from a comparison of FIAS nutrient values and Nutrition Facts labels for a sample of the competitive foods offered in the three schools. Entry Procedures
Two project nutritionists edited and entered the competitive foods data using FIAS 3.99. The entry process involved searching the database, selecting an appropriate food, and assigning an amount to the food. Search attempts began with the brand name, when available. FIAS typically assigns several brands or varieties of a food to a single food code. For example, when “Pepsi” is entered as the search term, FIAS displays the following: 1 Other features of FIAS that would be important for a larger scale analysis of competitive foods include the ability to (1)
add new recipes and foods to the database, and (2) use USDA food codes to group foods for analysis into broad and specific categories. Because none of the competitive foods offered in the sample schools was prepared from recipes, this feature was not used here. Given time constraints and the relatively small number of items, it was more efficient to “replace” versus “add” nutrients for new foods (discussed below), and manually assign each item to food categories.
2 Additionally, incomplete food descriptions and missing package sizes were important problems requiring some follow-up with respondents and manufacturers, and heavy reliance on the validation data (see Appendix B).

C-2 Appendix C: Nutrient Database Issues
92410310 Soft drink, cola-type (Includes Coca Cola; Coke; Pepsi; RC Cola)
If the exact brand could not be found, or if FIAS did not list any brands for a food, the more general food name was used as the search term and an appropriate “generic” item selected. Specific food codes were selected from the database for foods whose description included a nutritional claim (e.g., 2% lowfat, sugar-free, baked or reduced-fat). If no separate code was available, the food was flagged for review.3 Nutritionists used their judgment to decide when information about the particular flavor of an item, which was not specified in FIAS, was important enough to warrant flagging an entry for review. When competitive food items could not be matched to the description of any items in the FIAS database, the nutritionists selected the closest item and flagged these foods for review. The closest item was selected to provide a FIAS record to match to the Pyramid servings database. Nutrient information was obtained for all “missing” foods from on-line sources, calls to manufacturers, and when necessary, package labels. Nutritionists then compared the per-package food energy and (available) nutrient values with the FIAS nutrient analysis for these items.4 If values differed by more than the standards defined for this study (shown in Table C.1), the foods were flagged for replacement. Nutrient replacement is discussed in later sections of this appendix. The remaining “missing” items not flagged for replacement were analyzed using the FIAS values. Table C.1 Criteria Used for Replacement of Selected Nutrients: Amount per Package Calories ± 75 kcal Protein ± 2.5 g Carbohydrate ± 15 g Total fat ± 3.5 g Saturated fat ± 2 g Sodium ± 120 mg Calcium ± 80 mg Vitamin C ± 15 mg Niacin ± 4 mg Vitamin B6 ± 0.4 mg Iron ± 3 mg
3 Few of the items offered at the sample schools fell into this category, and even fewer were flagged as missing for this
reason. 4 This comparison had to be done outside the FIAS system, using analysis reports. The FIAS entry system only allows
the user to view nutrient values for 100 grams of the food rather than the amount entered. It also required conversion of label nutrients to per-package values.

Appendix C: Nutrient Database Issues C-3
Entry Issues
Brand Name and Flavor Specificity
Brand name, flavor, and missing food entry issues for competitive foods are summarized in Table C.2. The number and percentage of food items for which FIAS did not allow coding by brand or flavor are presented, by type of competitive food venue and overall (all schools and sources combined). Results show that FIAS entry was not brand-specific for approximately 17 percent of foods overall, including corn and tortilla chips, milk, doughnuts, and some ice cream products. The database was not flavor-specific for 35 percent of all items: juice-based drinks, sports drinks, fruit snacks, trail mix, and some candy and ice cream products. FIAS was neither brand- nor flavor-specific for potato chips, popcorn, and chewing gum. Candy and gum accounted for the large share of items offered at the school stores (65 percent) for which FIAS did not differentiate by flavor. Table C.2 also shows the proportion of items for which the exact brand or flavor of the competitive food was missing from the FIAS database (when FIAS does specify brand names or flavors for a similar food). The exact brand name was not included in FIAS for about one fifth (21 percent) of all items. This was somewhat more likely for a la carte-only foods (including snack bar items) than vended or school store items. Not surprisingly, FIAS did not include the brand names of locally made ice cream, but beverage brands such as Snapple and Veryfine were missing. Other items whose brand was not found in FIAS included all fruit snacks, and some cookies and granola bars. It was relatively rare that nutritionists could not find a FIAS code for a particular flavor of a food (6 percent of items overall, although, as noted above, 35 percent of items were coded with a FIAS entry that was not flavor-specific. Missing Foods
Some foods could not be coded in FIAS, based on their description (i.e., brand and food name). They included foods that were new to the market since the last database update and vitamin- or mineral-fortified versions of products in the database.5 Project nutritionists identified 59 such items, representing 17 percent of all competitive foods analyzed (see Table C.2). Three quarters of these items were found in vending machines in the sample schools. Of the 59 items “missing” from the database, 15 (25 percent) were found to have nutrient values close to a similar food in FIAS, that is, values fell within the parameters of the criteria shown in Table C.1.6 The remaining 44 items had one or more nutrient value that met the criteria for replacing nutrients, when compared to a similar item in FIAS.
5 Spring water was another category of items missing from the FIAS database, although it was not counted here. The
only water entry in FIAS is “water as an ingredient,” which contains sodium—most spring water does not. This affected the analysis of items meeting the FDA labeling criteria for sodium where spring water was counted as “low sodium”, but not “sodium free”.
6 The criteria were designed to identify only the clear outliers, that is, foods with one or more nutrient values that differed substantially from the closest food in FIAS.

C-4
Appendix C
: Nutrient D
atabase Issues
Table C.2 FIAS Entry Issues, Overall and by Source
All Sources A la Carte Snack Bar Vending School Store Number % Number % Number % Number % Number % FIAS not brand-specific 58 16.8 7 15.6 8 12.5 28 17.8 15 18.8 FIAS not flavor-specific 121 35.0 13 28.9 17 26.6 39 24.8 52 65.0 Exact brand not in FIAS 74 21.4 13 28.9 22 34.4 27 17.2 12 15.0 Exact flavor not in FIAS 22 6.4 3 6.7 7 10.9 9 5.7 3 3.8 No match on description in FIASa 59 17.0 4 8.9 7 10.9 43 27.4 5 6.3 Types of nonmatches:
New food/Not in FIASb 13 22.0 3 75.0 3 42.8 6 14.0 0 0.0 Not fortified in FIASb 31 52.5 1 25.0 2 28.6 26 60.5 2 40.0 Did not meet criteria for nutrient replacement
15 25.4 0 0.0 2 28.6 11 25.6 3 60.0
Total 59 100.0 4 100.0 7 100.0 43 100.0 5 100.0 Total number of itemsc 346 45 64 157 80 a Nutrient values for each of these items were obtained from online sources or, when necessary, package labels.
b Items in these categories met criteria for replacing nutrients (see Table C.1).
c Includes six types of salad dressing offered with salads at the snack bar in School #2.

Appendix C: Nutrient Database Issues C-5
More than half of the foods that could not be coded in FIAS were highly fortified with vitamins A, C, and/or B vitamins, or with calcium or iron, and met the criteria for nutrient replacement (Table C.2). Twenty-two percent were newer food items, although many of these foods were also fortified (e.g., Honey Nut Cheerios Milk and Cereal Bar). Fortified items, especially beverages (e.g., Pink Lemonade Chiller), accounted for about 60 percent of vending machine items missing from FIAS. Ice Cream Amounts
Ice cream novelties (e.g., ice cream bars, ice cream sandwiches, ice cream cones) posed a unique problem when nutritionists attempted to enter their package sizes in FIAS. The unit of measure for the package size printed on the wrappers of these items was “fluid ounces.”7 For example, the label for a Twix Ice Cream Bar, described as “ice cream and caramel loaded with cookie crunch bits”, indicated a package size of “2.5 fl. oz.”. The main problem is that FIAS does not allow items that are not all fluid at room temperature to be entered in volume units.8 The options were either to obtain a weight (ounces, grams) for the item (or a similar item) or enter a food-specific unit, for example, “1 bar” or “1 cone”. Neither alternative was without problems. Study staff reviewed labels collected as part of the validation study and noted that only a few ice cream products included the weight (in grams) of the item on the Nutrition Facts portion of the label. They attempted to obtain the weights of the remaining ice cream items on-line and from manufac-turers; weight information was not always available, however. Some of the food-specific units in FIAS included a conversion to volume units, for example, “1 bar (3 fl. oz.)”. In these cases, the food-specific unit was an acceptable option for entering the package size. Nutritionists used these conversion factors and the available volume-to-weight information to determine amounts to enter for the remaining ice cream items. Comparison of FIAS Nutrients with Replacement Values
Additional analyses were conducted to assess the relative impact of replacing nutrient values for foods missing from the database on the average nutrient composition of competitive foods. Nutrient values were generally replaced only for those nutrients that did not meet the replacement criteria. Exceptions included calories, protein, carbohydrate, total fat, and saturated fat, where adjustments were also made to the percentages of calories from fat and saturated fat. Because the main reason for replacing nutrients was fortification, it seemed reasonable to replace only those nutrients that differed substantially (i.e., according to the criteria used for this study).9
7 Respondents (including one vending distributor) tended to record the package sizes for ice cream products as if they
were weighed ounces, e.g., 3 oz. instead of 3 fl. oz. Entry of these amounts as weight units would have introduced error.
8 FIAS does allow entry of volume units for ice cream and sundae cups, sherbet, Italian ice, and frozen juice bars/tubes—these are typically fluid at room temperature.
9 Replacement of nutrients was the preferred method for addressing the missing food issue for the feasibility study for two reasons: (1) time constraints did not allow for the research or imputation that would be necessary to avoid missing nutrient values if the foods were simply added to the database, using easily accessible nutrient information (e.g., Nutrition Facts label); and (2) it was important to maintain the original food code for the most similar item in FIAS, to allow for linking with the Pyramid Servings database.

C-6 Appendix C: Nutrient Database Issues
Table C.3 shows the number of items with replaced nutrient values in each of the major food categories, the number of replacement values higher or lower than FIAS values, and the mean nutrient content (as offered) for the items in each category before and after replacing nutrients. As a group, beverages were the items for which nutrients were replaced most often. Twenty-eight percent of all beverage items had replaced nutrients, and beverages comprised two thirds of all items with replaced values. The remaining third of items with replaced nutrients fell within the baked goods/dessert, bread or grain products, and frozen desserts categories. None of candy, snacks, or salads/salad dressing met the criteria for nutrient replacement. Not surprisingly, the preponderance of replacement values was higher than FIAS values for the most similar foods in the database (Table C.3). Fortification of beverages with vitamins B6 and C, niacin, and calcium is the major contributor, but other breakfast and snack items fortified with calcium and iron have replacement values higher than FIAS nutrients. Also notable are the frozen desserts, where calorie, fat, and saturated fat replacement values were higher than FIAS values. This could be reflective of the difficulty encountered with the entry of package sizes for ice cream, or it might be that FIAS values for ice cream do not reflect the current mix available in the marketplace. The dietary components most likely to be replaced with values lower than FIAS values were calories and vitamin C for beverages, and sodium for baked goods and frozen desserts. The higher vitamin C values in FIAS for beverages are for juice-based drinks fortified to a higher level of vitamin C than the fortified products observed in this study (Veryfine Chillers and Fruitworks). The average nutrient composition of competitive foods as offered was compared using original (FIAS) and revised (replacement) nutrient values for the 44 foods “missing” from the nutrient database. Results are presented in the last two columns of Table C.3 for the four food categories containing items with replaced nutrients. The original and revised nutrient values differ surprisingly little, even among the beverage category, which experienced the most replacements. The largest and most consistent changes seen are for calcium. Revised mean values for calcium increased for baked goods/desserts, bread or grain products, and beverages, but by only 19 to 35 mg, or 2 to 4 percent of the calcium RDI. Summary of FIAS Entry Issues
It was beyond the capacity of this study to predict precisely the implications of limited brand- and flavor-specificity and foods missing from the nutrient database for a larger study. Results of analyses presented here, however, do not indicate that the impacts would be great. Presumably, the reason the FIAS database does not differentiate by brand or flavor for some foods is because nutrient composition information available at the time of the last database update did not vary substantially by brand or flavor, although this is not noted in system or database documentation. The brand names observed at the three sample schools were found in the database for the majority of foods for which FIAS specifies brands. Twelve percent of foods could not be coded with FIAS, but when the nutrient values for these foods were “added” to the database (or replaced in the data set), the mean nutrient composition of the four affected food categories did not change substantially. Because it has been a number of years since the FIAS database was last updated, the proportion of missing foods should be reduced with a new release.

Appendix C: Nutrient Database Issues C-7
Table C.3 Comparison of FIAS Nutrients with Replacement Values
Number of Items with Replaced Nutrients Mean Nutrient Value for
Categorya Food Category/ Nutrient
Total Number of Items Total
Replacement Value Higher
Replacement Value Lower
Original Revised
Baked goods/Dessert 34 4 Calories 2 2 0 342.2 347.4 Total fat (g) 2 2 0 14.5 15.1 Saturated fat (g) 2 2 0 3.5 3.6 Vitamin B6 (mg) 1 1 0 0.1 0.1 Calcium (mg) 2 2 0 37.4 56.7 Niacin (mg) 1 1 0 2.0 2.2 Sodium (mg) 3 0 3 275.7 261.6 Beverages 104 29 Calories 6 2 4 206.2 205.9 Carbohydrate (g) 3 3 0 46.8 47.1 Vitamin B6 (mg) 16 15 1 0.1 0.2 Vitamin C (mg) 19 11 8 43.4 44.7 Calcium (mg) 22 22 0 93.5 128.6 Niacin (mg) 16 15 1 0.4 1.1 Sodium (mg) 5 5 0 88.1 94.6 Bread or grain products 26 4
Calories 3 2 1 172.7 172.9 Protein (g) 2 2 0 3.5 3.9 Total fat (g) 1 0 1 6.0 5.9 Saturated fat (g) 1 0 1 2.1 2.0 Iron (mg) 2 2 0 1.7 2.0 Calcium (mg) 3 3 0 29.8 52.7 Candy 72 0 Frozen desserts 33 7 Calories 5 4 1 184.8 188.3 Total fat (g) 5 4 1 9.2 9.5 Saturated fat (g) 5 4 1 5.5 5.5 Sodium (mg) 4 0 4 83.0 57.5 Salads/Salad dressing 8 0 Snacks 69 0 Total 346 44 104 27 a Mean values include all competitive foods for which data were available, both during and after school.

C-8 Appendix C: Nutrient Database Issues
The most serious problem encountered by this feasibility study was the inability to enter observed package sizes for ice cream in FIAS. The effort involved in obtaining the information needed to enter an accurate amount for ice cream novelties could be substantial in a larger study. It may be worthwhile to explore the potential for software and database modifications to allow ice cream to be entered according the label amount. Comparison of FIAS Data to Label Nutrition Information
While collecting data for the validation component of the feasibility study, Abt Associates staff purchased a random one-third sample of all competitive food (non-beverage) items from each of the food venues. Information from the Nutrition Facts portion of the labels from these items was used for comparison with the nutrient information obtained from the nutrient database. The purpose of the comparison was to determine the extent of variation between the two sources of nutrition information for competitive foods offered in the sample schools. This comparison is relevant because school-children who are concerned about healthful choices rely on nutrient label information.10 The planned analyses were similar to the comparisons performed to identify foods that could not be accurately coded in the FIAS database (discussed above). For this reason, any items with replaced nutrients were excluded from the analysis (n=6). The resulting sample for the label comparison was 41 foods. Nutrient values were compared for the full package—the amount entered in FIAS for each food. For items with more than one serving per package, label nutrient values were multiplied by the number of “servings per container”. Label values expressed as a percent of Daily Value (DV) were converted to absolute amounts of the nutrient. (This introduces some error due to the rounding of DV percentages.) The nutrients and dietary components included in the comparison are those for which label information was available for the majority of sample foods.11 Two types of analysis were conducted. First, for each of the 12 nutrients, the label value was expressed as a percentage of the FIAS value and averaged over all foods for which both values were available. Second, because the mean ratio of label value to FIAS value does not adequately represent the distribution of differences between the two data sources, the relative numbers of foods with FIAS values that were lower, higher, or the same as the label nutrients were identified. The mean ratio of label to FIAS nutrients ranged from 0.64 for calcium to 3.17 for vitamin A. This ratio was close (within 10 percent) to 1.0 for food energy (calories), carbohydrate, total fat, saturated fat, cholesterol, and dietary fiber (data not shown). The higher FIAS values for calcium can be explained by the fact that 13 of 32 labels (41 percent) reported a calcium value of 0 percent of DV (RDI), whereas FIAS had small amounts of calcium for these items. It seems reasonable to assume that these foods do contain calcium, albeit in small amounts. This finding for calcium is important because it points to the limitations of label nutrition information. On the other hand, none of the
10 The nutrient information from food labels was assumed to be more accurate than the FIAS values, although
manufacturers can label their products using data from a nutrient database in place of actual laboratory analysis (USFDA, 1999). Furthermore, labeling regulations allow rounding of values and certain nutrients may be expressed as a percentage of DV, which detracts from their precision.
11 All 41 labels included data for calories, protein, carbohydrate, total fat, and sodium. Data for saturated fat, cholesterol, dietary fiber, vitamins A and C, calcium, and iron were included on 32 to 35 labels (78 to 85 percent). The B vitamins thiamin, niacin, riboflavin, and vitamin B6 were excluded from the comparison because they were found on only 2 to 6 labels, or fewer than 15 percent.

Appendix C: Nutrient Database Issues C-9
foods for which FIAS shows calcium values are important sources of this nutrient in children’s diets. Zero values on Nutrition Facts labels were also common for vitamin A (when FIAS had small values), but this was offset by especially high vitamin A values on the labels (relative to FIAS) of French dressing and fruit snacks (2,000 and 1,875 International Units, respectively).12 Other nutrients where the mean ratio of label values to FIAS values differed from 1.0 include vitamin C (1.79), protein (1.45), and sodium (1.29). The variation in values for these nutrients is attributable in large part to a few food items where the FIAS values are substantially lower than indicated on the label. These foods include vitamin C-fortified fruit snacks, fruit roll-ups, and candy; French dressing; and some ice cream novelties.13 For example, according to the Nutrition Facts label for fruit roll-ups, one package has 15 mg vitamin C, 1.5 g protein, and 55 mg sodium versus FIAS values of 0.9 mg vitamin C, 0.1 g protein, and 9 mg sodium. Note that none of the foods where differences between FIAS and label nutrients are great is typically considered an important dietary source of those nutrients. Figure C.1 shows the share of foods with FIAS values that are lower, higher, or the same (within 1 percent) as the label nutrients for that food. Nutrient values were converted to percent of DVs for this comparison. The analysis finds close agreement between FIAS and label values for food energy, protein, carbohydrate, and cholesterol content, for two thirds or more of the sample foods. Total fat, vitamin A, and vitamin C values agree for a little over half of the foods (despite the large mean differences for vitamins A and C discussed above). For all other dietary components examined, a large share of sample foods have FIAS values that fall above or below the label values. Although the mean difference for this particular sample is relatively small (10 percent), saturated fat values are particularly likely to vary between the two data sources, with a greater tendency for FIAS values to be higher than labeled amounts. When FIAS values differ from the label nutrients, more food items have higher values for food energy, protein, total fat, saturated fat, and calcium; and lower values for cholesterol, fiber, and vitamins A and C.
12 Zero values on Nutrition Facts labels were also seen for vitamin C, although when FIAS had values for these foods,
they tended to be very small (less than 0.5 mg vitamin C). 13 If beverages were included in this analysis, fortified juice-based drinks would also likely be a source of differences in
vitamin C values between the label and FIAS.
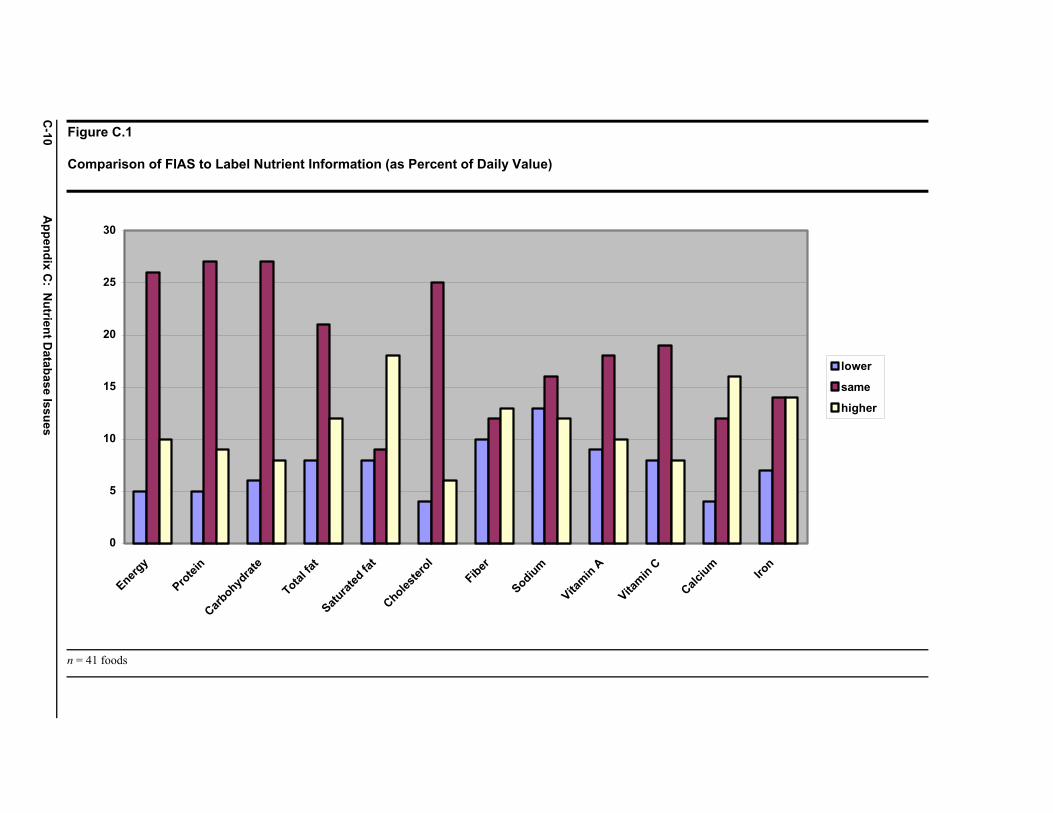
C-10
Appendix C
: Nutrient D
atabase Issues
Figure C.1 Comparison of FIAS to Label Nutrient Information (as Percent of Daily Value)
0
5
10
15
20
25
30
Energy
Protei
nCarb
ohydrat
e
Total fa
tSatu
rated
fat
Cholester
ol
Fiber
Sodium
Vitamin A
Vitamin C
Calcium
Iron
lower
same
higher
n = 41 foods

Appendix D: Reimbursable Meal Menus D-1
Table D.1 Reimbursable Meals Offered During Target Week Meal Components School #1 School #2 School #3 Milk Skim, 2%, choc 1% (8
oz) Skim, whole, 1%, choc 1% (10 oz)
Skim, 1%, choc 1% (8 oz) Strawb 1%, choc 1% (14 oz)
Entrée (available every day)
Salads: tuna, ham, garden turkey, garden Sandwiches: cheeseburger; hamburger; veggie burger; hot dog; kielbasa dog; chicken patty; cheese; pb/jelly; pb/fluff Sub sandwiches: tuna; turkey; turkey salad; ham/cheese; Italian; bologna/cheese
Pizza: pepperoni or cheese Sandwiches: chicken filet; cheeseburger; pork rib Club sandwich: steak/ cheese Yogurt/bagel w/ cream cheese
Daily entrée Mon Turkey taco boat;
chicken nuggets; chicken fingers; chicken cacciatore
Macaroni/cheese; chicken nuggets; sausage/egg sandwich
Turkey taco boat; chicken nuggets; chicken fingers; chicken cacciatore
Tue Chicken Caesar salad; minestrone; mozzarella sticks; chicken legs; nachos
Lasagna; egg salad sandwich
Chicken Caesar salad; minestrone; mozzarella sticks; chicken legs; nachos
Wed American chop suey; chicken strips; chicken fingers; mozzarella sticks/salsa
Beef taco/refried beans; tuna salad
American chop suey; chicken strips; chicken fingers; mozzarella sticks/salsa
Thu Breaded chicken; chicken nuggets (honey BBQ); macaroni/cheese
BBQ chicken; turkey/cheese sandwich
Breaded chicken; chicken nuggets (honey BBQ); macaroni/cheese
Fri Pizza; chicken nuggets; buffalo chicken; macaroni/cheese
Sweet/sour pork; Italian sub; cheese sandwich
Pizza; chicken nuggets; buffalo chicken; macaroni/cheese
Grains/Breads Bread (w/ salads)a
Dinner roll (2 days only) Rice (1 day)
Dinner roll, white bread (every day) Ziti (1 day) Goldfish crackers; biscuits; tortilla chips (1 day)
Roll (1 day) Rice (1 day)
Vegetable side (every day)
Tossed salada Lettuce/tomato (w/ sandwich)a
French fries; carrot/celery sticks
French fries; tossed salad
Daily vegetable side
Mon Lettuce/tomato; corn Corn on the cob Lettuce/tomato; corn
Tue Stay Crisp fries Green beans; cole slaw Stay Crisp fries Wed Green beans; wax beans Salsa/lettuce cup Green beans; wax beans

D-2 Appendix D: Reimbursable Meal Menus
Table D.1 Reimbursable Meals Offered During Target Week Meal Components School #1 School #2 School #3
Thu Mashed potatoes; cole slaw; Stay Crisp fries; green beans; wax beans
Mashed potatoes; broccoli Mashed potatoes; cole slaw; Stay Crisp fries; green beans; wax beans
Fri Wax beans; green beans Corn on the cob Wax beans; green beans
Fruit side Fruit choice (fresh, canned, or juice)a
Apple (every day) Canned fruit (every day) Apple juice (1 day)
Peach cup Pears (canned); apple Fruit cup (canned); apple Grapefruit juice; apple Fruit cup (canned); apple
Dessert/Misc. None Italian ice (1 day)
Potato chips & cheese curls (every day)
Peach crisp (1 day) Peach cup (frozen) (1 day)
a Information from printed menu but missing from Cafeteria Survey.
b Information from production records but missing from Cafeteria Survey.

Tab
le E
.1—
Co
mp
etit
ive
Fo
od
an
d B
ever
age
Pro
du
cts
Ava
ilab
le D
uri
ng
th
e S
cho
ol D
ay, B
y S
cho
ol a
nd
So
urc
e
Sch
oo
l #1,
A la
car
te
Pac
kage
size
Num
b-er
1P
rice
FM
NV
&
FD
Ala
bel
crite
ri-a2
Mac
ron
utr
ien
tsM
icro
nu
trie
nts
Mea
n #
ser
vin
gs
per
pyr
amid
gro
up
Fat
& s
ug
ar
Mea
n am
ount
per
item
Per
cent
of
calo
ries
from
Vit A
(RE
)
Vit C
(mg)
Cal
ci-
um (mg)
Iron
(mg)
Gra
inV
eget
-ab
leF
ruit
Dai
ryM
eat3
Mea
n am
ount
per
item
Cal
ori-
es
Tot
alfa
t(g
)
Sat
ura-
ted
fat
(g)
Car
b-oh
ydr-
ate
(g)
Pro
tein
(g)
Cho
le-
ster
ol(m
g)
Sod
i-um (m
g)
Die
tary
fiber
(g)
Tot
alfa
t
Sat
ura-
ted
fat
Dis
cre-
tiona
ryF
at (g)
Add
edS
ugar
s(t
sp)
Bak
ed g
oods
/des
sert
Gra
ndm
a’s
Cho
c ch
ipco
okie
s...
......
......
2.8
oz12
00.
75
375
17.6
5.8
52.1
4.2
–24
5.6
2.0
42.3
14.0
––
19.5
2.2
1.7
––
––
15.9
7.1
Hos
tess
Cho
ccu
pcak
es...
......
...3.
5 oz
360.
85➋
373
14.4
2.8
59.8
3.4
16.9
421.
70.
834
.76.
95.
00.
172
.43.
32.
0–
––
–12
.48.
0H
oste
ss C
hoc
fros
ted
doug
hnut
s...
......
..3.
0 oz
360.
75
403
26.4
6.9
40.8
4.3
49.3
364.
91.
758
.915
.426
.4–
29.8
2.1
1.4
––
––
25.0
5.3
Hos
tess
Hon
ey b
uns
3.5
oz36
0.85
37
615
.22.
956
.15.
052
.534
9.6
1.9
36.3
6.9
72.2
1.6
59.8
1.3
1.8
–0.
1–
–13
.37.
8H
oste
ss P
owde
red
doug
hnut
s...
......
..3.
0 oz
360.
75
358
19.5
3.1
42.3
4.3
31.5
464.
41.
349
.07.
714
.50.
237
.41.
72.
0–
––
–17
.54.
2
Bev
erag
esF
ruito
pia
Kiw
i Ber
ry..
20.0
oz
na1.
25➁
➌➃
291
––
73.8
––
136.
40.
6–
–6.
234
.749
.61.
3–
–0.
4–
––
16.0
Gat
orad
e F
ruit
punc
h20
.0 o
zna
1.25
➁➃
150
––
37.8
––
240.
0–
––
––
–0.
3–
––
––
–9.
0S
napp
le F
ruit
Pun
ch20
.0 o
z21
61.
25➁
➌➃
291
––
73.8
––
136.
40.
6–
–6.
234
.749
.61.
3–
–0.
4–
––
16.0
Sna
pple
Man
goM
adne
ss...
......
....
20.0
oz
721.
25➁
➌➃
256
0.2
–66
.60.
7–
16.4
0.2
0.6
0.1
95.4
28.5
18.7
0.5
––
0.6
––
–13
.1S
prin
g w
ater
......
......
.16
.9 o
zna
1.00
✘➀
➁➌
➃–
––
––
–15
.0–
––
––
10.0
––
––
––
––
Sun
ny D
elig
ht...
......
..16
.0 o
zna
1.25
➁➃
220
––
54.0
––
320.
0–
––
200.
065
.020
.00.
2–
–0.
9–
––
9.0
Bre
ad/g
rain
pro
duct
sR
ice
Kris
pie
Tre
at...
..1.
3 oz
na0.
75➁
141
3.7
0.7
26.9
1.1
–16
1.5
0.1
23.8
4.7
111.
95.
13.
00.
70.
8–
––
–2.
93.
4
Sna
cks
BB
Q p
otat
o ch
ips
......
1.8
oz62
0.75
26
617
.25.
426
.33.
5–
294.
72.
258
.118
.4–
15.4
11.9
0.8
–1.
7–
––
15.5
–C
heet
os C
urls
......
.....
1.8
oz12
20.
75➁
275
17.1
3.3
26.7
3.8
2.0
520.
90.
655
.910
.716
.90.
128
.81.
21.
9–
––
–15
.2–
Dor
itos
Coo
l Ran
ch..
1.8
oz12
20.
75➁
249
13.0
2.5
31.2
3.5
–26
2.0
3.2
47.1
9.0
9.9
–76
.40.
82.
4–
––
–10
.6–
Dor
itos
Nac
ho...
......
..1.
8 oz
122
0.75
➁24
913
.02.
531
.23.
5–
262.
03.
247
.19.
09.
9–
76.4
0.8
2.4
––
––
10.6
–F
unyu
ns...
......
......
.....
1.3
oz60
0.75
➁19
612
.22.
319
.12.
71.
437
2.1
0.4
55.9
10.7
12.1
–20
.60.
81.
3–
––
–10
.8–
Lays
Orig
inal
Bak
edpo
tato
chi
ps...
.....
1.1
oz62
0.75
➁15
15.
80.
822
.81.
6–
292.
51.
534
.55.
0–
–39
.90.
3–
1.1
––
–5.
70.
8
Ave
rag
e o
f al
l ite
ms
Unw
eigh
ted
......
......
...–
180.
91
257
9.7
2.2
41.2
2.3
8.5
270.
91.
130
.26.
632
.610
.334
.61.
11.
00.
20.
1–
–8.
65.
5W
eigh
ted
......
......
......
–11
020.
89
284
11.1
2.5
44.6
2.7
5.2
275.
81.
535
.47.
816
.09.
643
.71.
21.
20.
20.
1–
–9.
85.
6
–V
alue
is e
xact
ly z
ero.
naD
ata
are
not a
vaila
ble.
The
num
ber
sold
was
una
vaila
ble
for
som
e so
urce
s; n
umbe
r so
ld is
’na’
for
indi
vidu
al it
ems
with
in a
sou
rce
if in
form
atio
n w
as o
btai
ned
durin
g va
lidat
ion
but n
ot r
epor
ted
on th
e su
rvey
.1
’Num
ber’
colu
mn
cont
ains
the
num
ber
of in
divi
dual
item
s so
ld d
urin
g th
e ta
rget
wee
k. T
he ’N
umbe
r’ in
the
’All
item
s’ r
ow is
the
num
ber
of it
ems
(unw
eigh
ted)
or
the
tota
l num
ber
of s
ales
(w
eigh
ted)
.2
✘ in
dica
tes
food
s of
min
imum
nut
ritio
nal v
alue
(F
MN
V).
Foo
ds m
eetin
g F
DA
labe
ling
crite
ria a
re in
dica
ted
by: ➀
= c
alor
ie-f
ree;
➊ =
low
cal
orie
; ➁ =
cho
lest
erol
-fre
e; ➋
= lo
w c
hole
ster
ol; ➂
= s
odiu
m-f
ree;
➌ =
low
sod
ium
; ➃
= fa
t-fr
ee; ➍
= lo
w fa
t.3
Als
o in
clud
es le
gum
es, s
oybe
an p
rodu
cts,
nut
s, a
nd s
eeds
.S
ourc
e: C
afet
eria
Sur
vey
and
and
Inve
ntor
ies
of C
ompe
titiv
e F
oods
.
E-1
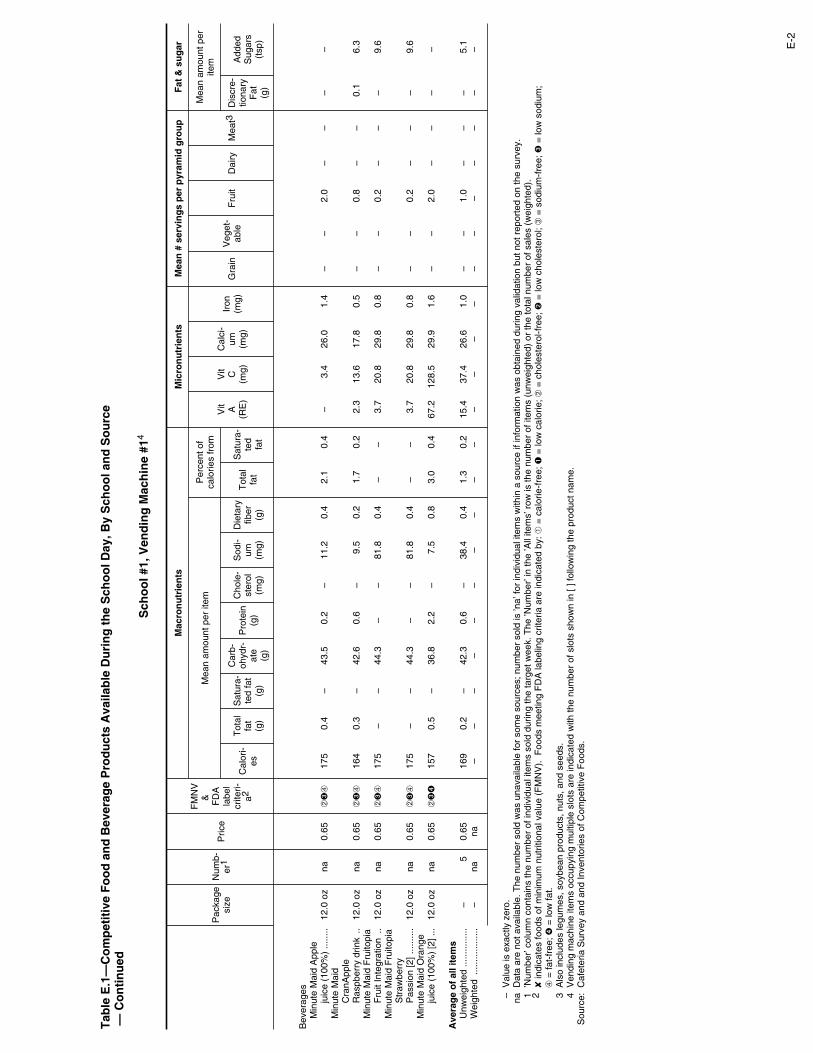
Tab
le E
.1—
Co
mp
etit
ive
Fo
od
an
d B
ever
age
Pro
du
cts
Ava
ilab
le D
uri
ng
th
e S
cho
ol D
ay, B
y S
cho
ol a
nd
So
urc
e —
Co
nti
nu
ed
Sch
oo
l #1,
Ven
din
g M
ach
ine
#14
Pac
kage
size
Num
b-er
1P
rice
FM
NV
&
FD
Ala
bel
crite
ri-a2
Mac
ron
utr
ien
tsM
icro
nu
trie
nts
Mea
n #
ser
vin
gs
per
pyr
amid
gro
up
Fat
& s
ug
ar
Mea
n am
ount
per
item
Per
cent
of
calo
ries
from
Vit A
(RE
)
Vit C
(mg)
Cal
ci-
um (mg)
Iron
(mg)
Gra
inV
eget
-ab
leF
ruit
Dai
ryM
eat3
Mea
n am
ount
per
item
Cal
ori-
es
Tot
alfa
t(g
)
Sat
ura-
ted
fat
(g)
Car
b-oh
ydr-
ate
(g)
Pro
tein
(g)
Cho
le-
ster
ol(m
g)
Sod
i-um (m
g)
Die
tary
fiber
(g)
Tot
alfa
t
Sat
ura-
ted
fat
Dis
cre-
tiona
ryF
at (g)
Add
edS
ugar
s(t
sp)
Bev
erag
esM
inut
e M
aid
App
leju
ice
(100
%)
......
..12
.0 o
zna
0.65
➁➌
➃17
50.
4–
43.5
0.2
–11
.20.
42.
10.
4–
3.4
26.0
1.4
––
2.0
––
––
Min
ute
Mai
dC
ranA
pple
Ras
pber
ry d
rink
..12
.0 o
zna
0.65
➁➌
➃16
40.
3–
42.6
0.6
–9.
50.
21.
70.
22.
313
.617
.80.
5–
–0.
8–
–0.
16.
3M
inut
e M
aid
Fru
itopi
aF
ruit
Inte
grat
ion
..12
.0 o
zna
0.65
➁➌
➃17
5–
–44
.3–
–81
.80.
4–
–3.
720
.829
.80.
8–
–0.
2–
––
9.6
Min
ute
Mai
d F
ruito
pia
Str
awbe
rry
Pas
sion
[2]
......
....
12.0
oz
na0.
65➁
➌➃
175
––
44.3
––
81.8
0.4
––
3.7
20.8
29.8
0.8
––
0.2
––
–9.
6M
inut
e M
aid
Ora
nge
juic
e (1
00%
) [2
]...
12.0
oz
na0.
65➁
➌➍
157
0.5
–36
.82.
2–
7.5
0.8
3.0
0.4
67.2
128.
529
.91.
6–
–2.
0–
––
–
Ave
rag
e o
f al
l ite
ms
Unw
eigh
ted
......
......
...–
50.
65
169
0.2
–42
.30.
6–
38.4
0.4
1.3
0.2
15.4
37.4
26.6
1.0
––
1.0
––
–5.
1W
eigh
ted
......
......
......
–na
na
––
––
––
––
––
––
––
––
––
––
–
–V
alue
is e
xact
ly z
ero.
naD
ata
are
not a
vaila
ble.
The
num
ber
sold
was
una
vaila
ble
for
som
e so
urce
s; n
umbe
r so
ld is
’na’
for
indi
vidu
al it
ems
with
in a
sou
rce
if in
form
atio
n w
as o
btai
ned
durin
g va
lidat
ion
but n
ot r
epor
ted
on th
e su
rvey
.1
’Num
ber’
colu
mn
cont
ains
the
num
ber
of in
divi
dual
item
s so
ld d
urin
g th
e ta
rget
wee
k. T
he ’N
umbe
r’ in
the
’All
item
s’ r
ow is
the
num
ber
of it
ems
(unw
eigh
ted)
or
the
tota
l num
ber
of s
ales
(w
eigh
ted)
.2
✘ in
dica
tes
food
s of
min
imum
nut
ritio
nal v
alue
(F
MN
V).
Foo
ds m
eetin
g F
DA
labe
ling
crite
ria a
re in
dica
ted
by: ➀
= c
alor
ie-f
ree;
➊ =
low
cal
orie
; ➁ =
cho
lest
erol
-fre
e; ➋
= lo
w c
hole
ster
ol; ➂
= s
odiu
m-f
ree;
➌ =
low
sod
ium
; ➃
= fa
t-fr
ee; ➍
= lo
w fa
t.3
Als
o in
clud
es le
gum
es, s
oybe
an p
rodu
cts,
nut
s, a
nd s
eeds
.4
Ven
ding
mac
hine
item
s oc
cupy
ing
mul
tiple
slo
ts a
re in
dica
ted
with
the
num
ber
of s
lots
sho
wn
in [
] fol
low
ing
the
prod
uct n
ame.
S
ourc
e:C
afet
eria
Sur
vey
and
and
Inve
ntor
ies
of C
ompe
titiv
e F
oods
.
E-2
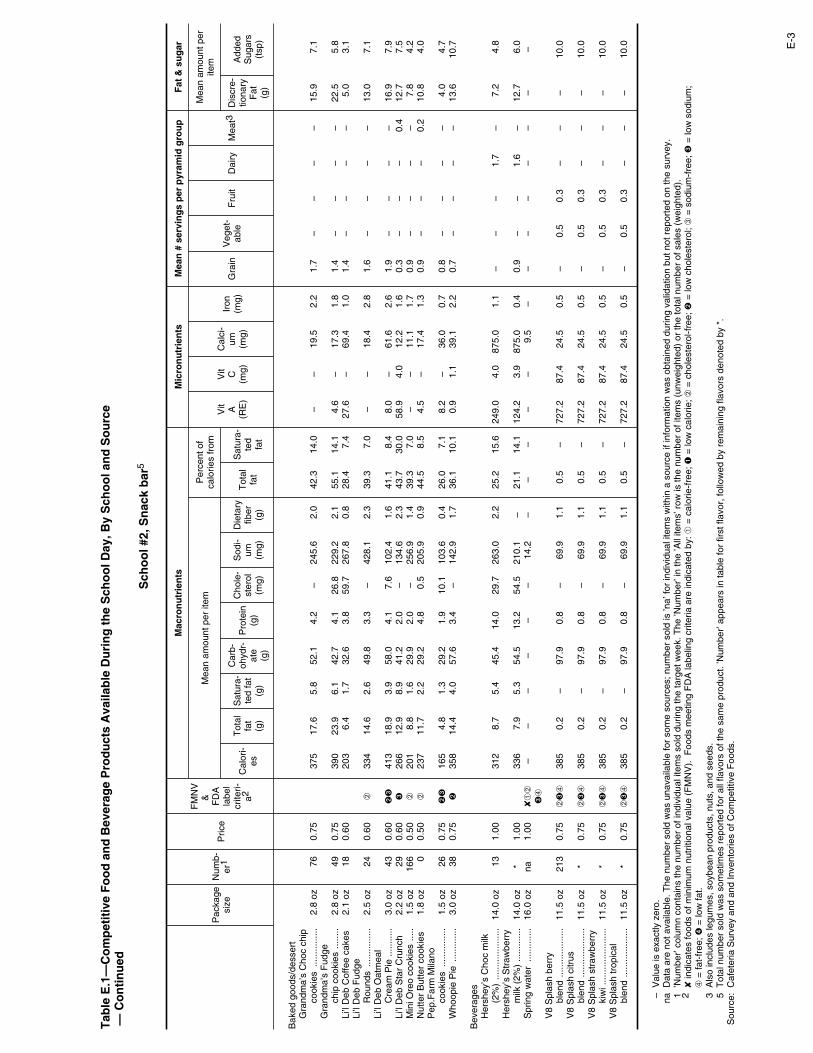
Tab
le E
.1—
Co
mp
etit
ive
Fo
od
an
d B
ever
age
Pro
du
cts
Ava
ilab
le D
uri
ng
th
e S
cho
ol D
ay, B
y S
cho
ol a
nd
So
urc
e —
Co
nti
nu
ed
Sch
oo
l #2,
Sn
ack
bar
5
Pac
kage
size
Num
b-er
1P
rice
FM
NV
&
FD
Ala
bel
crite
ri-a2
Mac
ron
utr
ien
tsM
icro
nu
trie
nts
Mea
n #
ser
vin
gs
per
pyr
amid
gro
up
Fat
& s
ug
ar
Mea
n am
ount
per
item
Per
cent
of
calo
ries
from
Vit A
(RE
)
Vit C
(mg)
Cal
ci-
um (mg)
Iron
(mg)
Gra
inV
eget
-ab
leF
ruit
Dai
ryM
eat3
Mea
n am
ount
per
item
Cal
ori-
es
Tot
alfa
t(g
)
Sat
ura-
ted
fat
(g)
Car
b-oh
ydr-
ate
(g)
Pro
tein
(g)
Cho
le-
ster
ol(m
g)
Sod
i-um (m
g)
Die
tary
fiber
(g)
Tot
alfa
t
Sat
ura-
ted
fat
Dis
cre-
tiona
ryF
at (g)
Add
edS
ugar
s(t
sp)
Bak
ed g
oods
/des
sert
Gra
ndm
a’s
Cho
c ch
ipco
okie
s...
......
......
2.8
oz76
0.75
37
517
.65.
852
.14.
2–
245.
62.
042
.314
.0–
–19
.52.
21.
7–
––
–15
.97.
1G
rand
ma’
s F
udge
chip
coo
kies
......
..2.
8 oz
490.
75
390
23.9
6.1
42.7
4.1
26.8
229.
22.
155
.114
.14.
6–
17.3
1.8
1.4
––
––
22.5
5.8
Li’l
Deb
Cof
fee
cake
s2.
1 oz
180.
60
203
6.4
1.7
32.6
3.8
59.7
267.
80.
828
.47.
427
.6–
69.4
1.0
1.4
––
––
5.0
3.1
Li’l
Deb
Fud
geR
ound
s...
......
......
2.5
oz24
0.60
➁33
414
.62.
649
.83.
3–
428.
12.
339
.37.
0–
–18
.42.
81.
6–
––
–13
.07.
1Li
’l D
eb O
atm
eal
Cre
am P
ie...
......
..3.
0 oz
430.
60➋
➌41
318
.93.
958
.04.
17.
610
2.4
1.6
41.1
8.4
8.0
–61
.62.
61.
9–
––
–16
.97.
9Li
’l D
eb S
tar
Cru
nch
2.2
oz29
0.60
➌26
612
.98.
941
.22.
0–
134.
62.
343
.730
.058
.94.
012
.21.
60.
3–
––
0.4
12.7
7.5
Min
i Ore
o co
okie
s...
..1.
5 oz
166
0.50
➁20
18.
81.
629
.92.
0–
256.
91.
439
.37.
0–
–11
.11.
70.
9–
––
–7.
84.
2N
utte
r B
utte
r co
okie
s1.
8 oz
00.
50➁
237
11.7
2.2
29.2
4.8
0.5
205.
90.
944
.58.
54.
5–
17.4
1.3
0.9
––
–0.
210
.84.
0P
ep.F
arm
Mila
noco
okie
s...
......
......
1.5
oz26
0.75
➋➌
165
4.8
1.3
29.2
1.9
10.1
103.
60.
426
.07.
18.
2–
36.0
0.7
0.8
––
––
4.0
4.7
Who
opie
Pie
......
......
.3.
0 oz
380.
75➋
358
14.4
4.0
57.6
3.4
–14
2.9
1.7
36.1
10.1
0.9
1.1
39.1
2.2
0.7
––
––
13.6
10.7
Bev
erag
esH
ersh
ey’s
Cho
c m
ilk(2
%)
......
......
......
..14
.0 o
z13
1.00
31
28.
75.
445
.414
.029
.726
3.0
2.2
25.2
15.6
249.
04.
087
5.0
1.1
––
–1.
7–
7.2
4.8
Her
shey
’s S
traw
berr
ym
ilk (
2%)
......
......
.14
.0 o
z*
1.00
33
67.
95.
354
.513
.254
.521
0.1
–21
.114
.112
4.2
3.9
875.
00.
40.
9–
–1.
6–
12.7
6.0
Spr
ing
wat
er...
......
....
16.0
oz
na1.
00✘
➀➁
➌➃
––
––
––
14.2
––
––
–9.
5–
––
––
––
–
V8
Spl
ash
berr
ybl
end
......
......
......
.11
.5 o
z21
30.
75➁
➌➃
385
0.2
–97
.90.
8–
69.9
1.1
0.5
–72
7.2
87.4
24.5
0.5
–0.
50.
3–
––
10.0
V8
Spl
ash
citr
usbl
end
......
......
......
.11
.5 o
z*
0.75
➁➌
➃38
50.
2–
97.9
0.8
–69
.91.
10.
5–
727.
287
.424
.50.
5–
0.5
0.3
––
–10
.0V
8 S
plas
h st
raw
berr
yki
wi.
......
......
......
...11
.5 o
z*
0.75
➁➌
➃38
50.
2–
97.9
0.8
–69
.91.
10.
5–
727.
287
.424
.50.
5–
0.5
0.3
––
–10
.0V
8 S
plas
h tr
opic
albl
end
......
......
......
.11
.5 o
z*
0.75
➁➌
➃38
50.
2–
97.9
0.8
–69
.91.
10.
5–
727.
287
.424
.50.
5–
0.5
0.3
––
–10
.0
–V
alue
is e
xact
ly z
ero.
naD
ata
are
not a
vaila
ble.
The
num
ber
sold
was
una
vaila
ble
for
som
e so
urce
s; n
umbe
r so
ld is
’na’
for
indi
vidu
al it
ems
with
in a
sou
rce
if in
form
atio
n w
as o
btai
ned
durin
g va
lidat
ion
but n
ot r
epor
ted
on th
e su
rvey
.1
’Num
ber’
colu
mn
cont
ains
the
num
ber
of in
divi
dual
item
s so
ld d
urin
g th
e ta
rget
wee
k. T
he ’N
umbe
r’ in
the
’All
item
s’ r
ow is
the
num
ber
of it
ems
(unw
eigh
ted)
or
the
tota
l num
ber
of s
ales
(w
eigh
ted)
.2
✘ in
dica
tes
food
s of
min
imum
nut
ritio
nal v
alue
(F
MN
V).
Foo
ds m
eetin
g F
DA
labe
ling
crite
ria a
re in
dica
ted
by: ➀
= c
alor
ie-f
ree;
➊ =
low
cal
orie
; ➁ =
cho
lest
erol
-fre
e; ➋
= lo
w c
hole
ster
ol; ➂
= s
odiu
m-f
ree;
➌ =
low
sod
ium
; ➃
= fa
t-fr
ee; ➍
= lo
w fa
t.3
Als
o in
clud
es le
gum
es, s
oybe
an p
rodu
cts,
nut
s, a
nd s
eeds
.5
Tot
al n
umbe
r so
ld w
as s
omet
imes
rep
orte
d fo
r al
l fla
vors
of t
he s
ame
prod
uct.
’Num
ber’
appe
ars
in ta
ble
for
first
flav
or, f
ollo
wed
by
rem
aini
ng fl
avor
s de
note
d by
*.
Sou
rce:
Caf
eter
ia S
urve
y an
d an
d In
vent
orie
s of
Com
petit
ive
Foo
ds.
E-3

Tab
le E
.1—
Co
mp
etit
ive
Fo
od
an
d B
ever
age
Pro
du
cts
Ava
ilab
le D
uri
ng
th
e S
cho
ol D
ay, B
y S
cho
ol a
nd
So
urc
e —
Co
nti
nu
ed
Sch
oo
l #2,
Sn
ack
bar
5
Pac
kage
size
Num
b-er
1P
rice
FM
NV
&
FD
Ala
bel
crite
ri-a2
Mac
ron
utr
ien
tsM
icro
nu
trie
nts
Mea
n #
ser
vin
gs
per
pyr
amid
gro
up
Fat
& s
ug
ar
Mea
n am
ount
per
item
Per
cent
of
calo
ries
from
Vit A
(RE
)
Vit C
(mg)
Cal
ci-
um (mg)
Iron
(mg)
Gra
inV
eget
-ab
leF
ruit
Dai
ryM
eat3
Mea
n am
ount
per
item
Cal
ori-
es
Tot
alfa
t(g
)
Sat
ura-
ted
fat
(g)
Car
b-oh
ydr-
ate
(g)
Pro
tein
(g)
Cho
le-
ster
ol(m
g)
Sod
i-um (m
g)
Die
tary
fiber
(g)
Tot
alfa
t
Sat
ura-
ted
fat
Dis
cre-
tiona
ryF
at (g)
Add
edS
ugar
s(t
sp)
Bre
ad/g
rain
pro
duct
sC
hew
ey c
hoc
chip
gran
ola
bar
......
...1.
3 oz
310.
50➋
➌16
16.
24.
523
.63.
5–
98.5
1.1
34.9
25.2
0.4
0.4
21.3
1.1
1.0
––
–0.
15.
21.
6C
hew
ey o
at h
oney
gran
ola
bar
......
...1.
0 oz
80.
50➋
➌12
95.
03.
618
.92.
8–
78.8
0.9
34.9
25.2
0.3
0.3
17.0
0.9
0.8
––
–0.
14.
21.
3C
hew
ey o
at r
aisi
ngr
anol
a ba
r...
......
1.2
oz8
0.50
➁➌
➍12
22.
4–
22.7
3.3
–94
.61.
117
.9–
0.3
0.3
20.4
1.1
1.0
––
–0.
15.
01.
6C
lub
min
i che
ese
sand
wic
hcr
acke
rs...
......
.....
1.5
ozna
0.50
➋20
79.
72.
526
.04.
02.
647
5.9
0.2
42.2
10.9
13.2
0.7
97.0
1.1
1.5
––
––
8.2
0.1
Gol
dfis
h cr
acke
rs,
ched
dar
......
......
...1.
5 oz
585
0.50
21
410
.84.
024
.84.
35.
542
3.1
1.0
45.3
16.8
12.8
–64
.22.
02.
0–
––
–8.
8–
Qua
ker
Car
amel
cor
nca
ke...
......
......
.....
0.9
oz75
0.50
➁➍
990.
80.
120
.72.
5–
74.3
0.8
7.3
1.1
1.8
–2.
30.
51.
5–
––
––
–R
ice
Kris
pie
Tre
at...
..1.
3 oz
830.
75➁
141
3.7
0.7
26.9
1.1
–16
1.5
0.1
23.8
4.7
111.
95.
13.
00.
70.
8–
––
–2.
93.
4R
itz B
itz w
/ che
ese
...1.
8 oz
171
0.50
➋24
211
.32.
930
.44.
63.
055
5.2
0.3
42.1
10.9
15.4
0.8
113.
11.
21.
7–
––
–9.
60.
1R
itz B
itz w
/ pea
nut
butte
r...
......
......
...1.
8 oz
470.
50➁
246
12.2
2.7
27.9
6.3
1.0
453.
50.
644
.79.
9–
0.2
49.1
1.4
0.9
––
–0.
411
.33.
6S
’mor
es g
rano
la tr
eat
1.1
oz38
0.50
➋➌
135
5.2
3.8
19.9
2.9
–82
.80.
934
.925
.20.
30.
317
.91.
00.
8–
––
0.1
4.4
1.4
Fro
zen
dess
erts
Cho
c C
hip
cook
iesa
ndw
ich
......
......
.4.
5 oz
921.
00➌
207
8.1
4.7
31.3
3.8
28.5
52.4
0.8
35.1
20.3
75.8
0.4
86.5
0.4
0.8
––
0.2
–8.
04.
3Ic
e cr
eam
bar
, cho
céc
lair
......
......
......
.3.
0 oz
580.
75➌
219
11.0
5.0
29.2
3.4
34.4
70.0
0.8
45.2
20.5
38.0
0.1
81.2
1.6
0.6
––
––
7.5
4.1
Ice
crea
m b
ar, s
traw
.sh
ortc
ake
......
......
3.0
oz*
0.75
➋➌
171
12.0
5.0
15.3
1.4
15.3
28.1
1.2
63.2
26.3
42.3
4.7
48.5
0.2
––
0.2
0.1
–3.
92.
5Ic
e cr
eam
san
dwic
h..
3.0
oz20
0.75
➌17
36.
83.
926
.23.
223
.843
.80.
735
.120
.363
.30.
372
.20.
30.
6–
–0.
2–
6.7
3.6
Nut
ty R
oyal
e ic
ecr
eam
con
e...
......
3.0
oz61
0.75
➌17
010
.74.
417
.13.
520
.642
.81.
156
.523
.155
.00.
378
.50.
60.
1–
–0.
20.
110
.52.
6S
tar
bar
ice
crea
m...
.4.
4 oz
10.
75➌
343
25.3
19.4
29.1
3.4
39.4
72.0
0.4
66.5
51.0
104.
80.
511
6.1
0.3
––
–0.
3–
25.4
5.6
Str
awbe
rry
sher
bet
...3.
0 oz
20.
75➁
➂➃
73–
–18
.11.
1–
3.6
–1.
1–
2.7
8.5
4.5
0.2
––
0.2
––
–3.
0S
unda
e cu
p, c
hoc
.....
6.0
oz71
0.75
➋➌
242
7.9
4.1
38.5
5.6
17.0
124.
5–
29.2
15.0
48.5
2.4
157.
20.
3–
––
0.5
–6.
57.
3
–V
alue
is e
xact
ly z
ero.
naD
ata
are
not a
vaila
ble.
The
num
ber
sold
was
una
vaila
ble
for
som
e so
urce
s; n
umbe
r so
ld is
’na’
for
indi
vidu
al it
ems
with
in a
sou
rce
if in
form
atio
n w
as o
btai
ned
durin
g va
lidat
ion
but n
ot r
epor
ted
on th
e su
rvey
.1
’Num
ber’
colu
mn
cont
ains
the
num
ber
of in
divi
dual
item
s so
ld d
urin
g th
e ta
rget
wee
k. T
he ’N
umbe
r’ in
the
’All
item
s’ r
ow is
the
num
ber
of it
ems
(unw
eigh
ted)
or
the
tota
l num
ber
of s
ales
(w
eigh
ted)
.2
✘ in
dica
tes
food
s of
min
imum
nut
ritio
nal v
alue
(F
MN
V).
Foo
ds m
eetin
g F
DA
labe
ling
crite
ria a
re in
dica
ted
by: ➀
= c
alor
ie-f
ree;
➊ =
low
cal
orie
; ➁ =
cho
lest
erol
-fre
e; ➋
= lo
w c
hole
ster
ol; ➂
= s
odiu
m-f
ree;
➌ =
low
sod
ium
; ➃
= fa
t-fr
ee; ➍
= lo
w fa
t.3
Als
o in
clud
es le
gum
es, s
oybe
an p
rodu
cts,
nut
s, a
nd s
eeds
.5
Tot
al n
umbe
r so
ld w
as s
omet
imes
rep
orte
d fo
r al
l fla
vors
of t
he s
ame
prod
uct.
’Num
ber’
appe
ars
in ta
ble
for
first
flav
or, f
ollo
wed
by
rem
aini
ng fl
avor
s de
note
d by
*.
Sou
rce:
Caf
eter
ia S
urve
y an
d an
d In
vent
orie
s of
Com
petit
ive
Foo
ds.
E-4

Tab
le E
.1—
Co
mp
etit
ive
Fo
od
an
d B
ever
age
Pro
du
cts
Ava
ilab
le D
uri
ng
th
e S
cho
ol D
ay, B
y S
cho
ol a
nd
So
urc
e —
Co
nti
nu
ed
Sch
oo
l #2,
Sn
ack
bar
5
Pac
kage
size
Num
b-er
1P
rice
FM
NV
&
FD
Ala
bel
crite
ri-a2
Mac
ron
utr
ien
tsM
icro
nu
trie
nts
Mea
n #
ser
vin
gs
per
pyr
amid
gro
up
Fat
& s
ug
ar
Mea
n am
ount
per
item
Per
cent
of
calo
ries
from
Vit A
(RE
)
Vit C
(mg)
Cal
ci-
um (mg)
Iron
(mg)
Gra
inV
eget
-ab
leF
ruit
Dai
ryM
eat3
Mea
n am
ount
per
item
Cal
ori-
es
Tot
alfa
t(g
)
Sat
ura-
ted
fat
(g)
Car
b-oh
ydr-
ate
(g)
Pro
tein
(g)
Cho
le-
ster
ol(m
g)
Sod
i-um (m
g)
Die
tary
fiber
(g)
Tot
alfa
t
Sat
ura-
ted
fat
Dis
cre-
tiona
ryF
at (g)
Add
edS
ugar
s(t
sp)
Fro
zen
dess
erts
Sun
dae
cup,
stra
wbe
rry
......
.....
6.0
oz*
0.75
➋➌
242
7.9
4.1
38.5
5.6
17.0
124.
5–
29.2
15.0
48.5
2.4
157.
20.
3–
––
0.5
–6.
57.
3
Sal
ads
with
dre
ssin
gS
hake
-Up
Cae
sar
Sal
ad...
......
......
...4.
0 oz
92.
00
176
14.6
2.8
6.4
5.7
41.3
279.
51.
574
.814
.121
3.8
19.9
104.
71.
40.
31.
3–
0.1
0.3
13.3
–S
hake
-Up
Gar
den
Gre
ens
......
......
....
4.0
oz26
2.00
➁12
410
.91.
66.
61.
30.
644
9.2
1.7
78.9
11.7
287.
011
.623
.90.
6–
1.8
––
–10
.70.
4
Sna
cks
Che
etos
Ast
eroi
dF
lam
in’ H
otsn
acks
......
......
....
2.5
oz10
91.
25➋
393
24.4
4.7
38.1
5.4
2.8
744.
20.
855
.910
.724
.10.
141
.11.
72.
7–
––
–21
.7–
Che
etos
Cru
nchy
......
1.8
oz83
0.75
➁27
517
.13.
326
.73.
82.
052
0.9
0.6
55.9
10.7
16.9
0.1
28.8
1.2
1.9
––
––
15.2
–D
orito
s A
ster
oids
3D’s
Nac
ho M
ini
snac
ks...
......
......
.2.
0 oz
271.
25➁
284
14.9
2.9
35.7
4.0
–29
9.4
3.7
47.1
9.0
11.3
–87
.30.
92.
7–
––
–12
.1–
Dor
itos
Coo
l Ran
ch..
1.8
oz36
80.
75➁
249
13.0
2.5
31.2
3.5
–26
2.0
3.2
47.1
9.0
9.9
–76
.40.
82.
4–
––
–10
.6–
Frit
os c
orn
chip
s...
....
2.3
oz32
0.75
➁34
421
.32.
936
.34.
2–
401.
93.
155
.87.
65.
7–
81.0
0.8
2.7
––
––
18.6
–F
ruit
By
the
foot
......
..0.
8 oz
930.
50✘
➁➌
➍74
0.6
0.1
17.9
0.2
–13
.00.
87.
71.
72.
61.
36.
80.
2–
–0.
4–
––
2.1
Fru
it R
oll U
p’s
......
.....
0.5
oz*
0.50
✘➁
➌➍
500.
4–
12.0
0.1
–8.
70.
57.
81.
61.
70.
94.
50.
1–
–0.
3–
––
1.4
Fru
it sn
acks
, gra
pe...
2.3
oz17
10.
75➁
➍23
82.
20.
654
.4–
–20
2.2
2.2
8.4
2.4
7.7
76.6
11.5
0.5
––
1.2
––
–6.
4F
ruit
snac
ks, p
each
..2.
3 oz
*0.
75➁
➍23
82.
20.
654
.4–
–20
2.2
2.2
8.4
2.4
7.7
76.6
11.5
0.5
––
1.2
––
–6.
4F
ruit
snac
ks, w
hite
grap
e...
......
......
...2.
3 oz
*0.
75➁
➍23
82.
20.
654
.4–
–20
2.2
2.2
8.4
2.4
7.7
76.6
11.5
0.5
––
1.2
––
–6.
4F
unyu
ns...
......
......
.....
1.3
oz91
0.75
➁19
612
.22.
319
.12.
71.
437
2.1
0.4
55.9
10.7
12.1
–20
.60.
81.
3–
––
–10
.8–
Lays
Cla
ssic
pot
ato
chip
s...
......
......
....
1.5
oz18
0.75
22
814
.74.
722
.53.
0–
252.
61.
958
.118
.4–
13.2
10.2
0.7
–1.
5–
––
13.3
–La
y’s
KC
Mas
terp
iece
BB
Q p
otat
o ch
ips
1.5
oz78
0.75
22
814
.74.
722
.53.
0–
252.
61.
958
.118
.4–
13.2
10.2
0.7
–1.
5–
––
13.3
–La
ys O
rigin
al B
aked
pota
to c
hips
......
..1.
2 oz
340.
75➁
161
6.2
0.9
24.3
1.7
–31
2.0
1.6
34.5
5.0
––
42.5
0.3
–1.
2–
––
6.1
0.8
–V
alue
is e
xact
ly z
ero.
naD
ata
are
not a
vaila
ble.
The
num
ber
sold
was
una
vaila
ble
for
som
e so
urce
s; n
umbe
r so
ld is
’na’
for
indi
vidu
al it
ems
with
in a
sou
rce
if in
form
atio
n w
as o
btai
ned
durin
g va
lidat
ion
but n
ot r
epor
ted
on th
e su
rvey
.1
’Num
ber’
colu
mn
cont
ains
the
num
ber
of in
divi
dual
item
s so
ld d
urin
g th
e ta
rget
wee
k. T
he ’N
umbe
r’ in
the
’All
item
s’ r
ow is
the
num
ber
of it
ems
(unw
eigh
ted)
or
the
tota
l num
ber
of s
ales
(w
eigh
ted)
.2
✘ in
dica
tes
food
s of
min
imum
nut
ritio
nal v
alue
(F
MN
V).
Foo
ds m
eetin
g F
DA
labe
ling
crite
ria a
re in
dica
ted
by: ➀
= c
alor
ie-f
ree;
➊ =
low
cal
orie
; ➁ =
cho
lest
erol
-fre
e; ➋
= lo
w c
hole
ster
ol; ➂
= s
odiu
m-f
ree;
➌ =
low
sod
ium
; ➃
= fa
t-fr
ee; ➍
= lo
w fa
t.3
Als
o in
clud
es le
gum
es, s
oybe
an p
rodu
cts,
nut
s, a
nd s
eeds
.5
Tot
al n
umbe
r so
ld w
as s
omet
imes
rep
orte
d fo
r al
l fla
vors
of t
he s
ame
prod
uct.
’Num
ber’
appe
ars
in ta
ble
for
first
flav
or, f
ollo
wed
by
rem
aini
ng fl
avor
s de
note
d by
*.
Sou
rce:
Caf
eter
ia S
urve
y an
d an
d In
vent
orie
s of
Com
petit
ive
Foo
ds.
E-5

Tab
le E
.1—
Co
mp
etit
ive
Fo
od
an
d B
ever
age
Pro
du
cts
Ava
ilab
le D
uri
ng
th
e S
cho
ol D
ay, B
y S
cho
ol a
nd
So
urc
e —
Co
nti
nu
ed
Sch
oo
l #2,
Sn
ack
bar
5
Pac
kage
size
Num
b-er
1P
rice
FM
NV
&
FD
Ala
bel
crite
ri-a2
Mac
ron
utr
ien
tsM
icro
nu
trie
nts
Mea
n #
ser
vin
gs
per
pyr
amid
gro
up
Fat
& s
ug
ar
Mea
n am
ount
per
item
Per
cent
of
calo
ries
from
Vit A
(RE
)
Vit C
(mg)
Cal
ci-
um (mg)
Iron
(mg)
Gra
inV
eget
-ab
leF
ruit
Dai
ryM
eat3
Mea
n am
ount
per
item
Cal
ori-
es
Tot
alfa
t(g
)
Sat
ura-
ted
fat
(g)
Car
b-oh
ydr-
ate
(g)
Pro
tein
(g)
Cho
le-
ster
ol(m
g)
Sod
i-um (m
g)
Die
tary
fiber
(g)
Tot
alfa
t
Sat
ura-
ted
fat
Dis
cre-
tiona
ryF
at (g)
Add
edS
ugar
s(t
sp)
Sna
cks
Lays
Sal
t & V
ineg
arpo
tato
chi
ps...
.....
1.5
oz28
0.75
22
814
.74.
722
.53.
0–
252.
61.
958
.118
.4–
13.2
10.2
0.7
–1.
5–
––
13.3
–La
ys S
our
Cre
am &
Oni
on B
aked
pota
to c
hips
......
..1.
2 oz
190.
75➁
161
6.2
0.9
24.3
1.7
–31
2.0
1.6
34.5
5.0
––
42.5
0.3
–1.
2–
––
10.6
–N
acho
s D
orito
s...
......
1.8
oz30
50.
75➁
249
13.0
2.5
31.2
3.5
–26
2.0
3.2
47.1
9.0
9.9
–76
.40.
82.
4–
––
–10
.6–
Ruf
fles
Che
ddar
&S
our
Cre
ampo
tato
chi
ps...
.....
1.5
oz12
40.
75
228
14.7
4.7
22.5
3.0
–25
2.6
1.9
58.1
18.4
–13
.210
.20.
7–
1.5
––
–13
.3–
Sm
artfo
od w
hite
ched
dar
popc
orn
1.0
oz89
0.75
14
38.
42.
314
.82.
92.
523
7.6
2.8
52.8
14.2
10.5
–23
.50.
51.
2–
––
–7.
2–
Sun
Chi
ps M
ultig
rain
Sna
ck O
rigin
alfla
vor
......
......
......
.1.
5 oz
320.
75➁
220
11.1
0.8
27.0
3.0
–17
8.2
2.6
45.4
3.4
11.2
–2.
30.
42.
1–
––
–8.
90.
1
Ave
rag
e o
f al
l ite
ms
Unw
eigh
ted
......
......
...–
580.
76
231
9.5
3.0
34.5
3.2
7.7
210.
61.
336
.111
.580
.512
.270
.80.
90.
80.
20.
10.
1–
8.4
3.3
Wei
ghte
d...
......
......
...–
3782
0.70
23
810
.52.
933
.83.
24.
227
6.4
1.6
39.8
11.3
58.8
9.7
51.7
1.1
1.3
0.2
––
–9.
02.
2
–V
alue
is e
xact
ly z
ero.
naD
ata
are
not a
vaila
ble.
The
num
ber
sold
was
una
vaila
ble
for
som
e so
urce
s; n
umbe
r so
ld is
’na’
for
indi
vidu
al it
ems
with
in a
sou
rce
if in
form
atio
n w
as o
btai
ned
durin
g va
lidat
ion
but n
ot r
epor
ted
on th
e su
rvey
.1
’Num
ber’
colu
mn
cont
ains
the
num
ber
of in
divi
dual
item
s so
ld d
urin
g th
e ta
rget
wee
k. T
he ’N
umbe
r’ in
the
’All
item
s’ r
ow is
the
num
ber
of it
ems
(unw
eigh
ted)
or
the
tota
l num
ber
of s
ales
(w
eigh
ted)
.2
✘ in
dica
tes
food
s of
min
imum
nut
ritio
nal v
alue
(F
MN
V).
Foo
ds m
eetin
g F
DA
labe
ling
crite
ria a
re in
dica
ted
by: ➀
= c
alor
ie-f
ree;
➊ =
low
cal
orie
; ➁ =
cho
lest
erol
-fre
e; ➋
= lo
w c
hole
ster
ol; ➂
= s
odiu
m-f
ree;
➌ =
low
sod
ium
; ➃
= fa
t-fr
ee; ➍
= lo
w fa
t.3
Als
o in
clud
es le
gum
es, s
oybe
an p
rodu
cts,
nut
s, a
nd s
eeds
.5
Tot
al n
umbe
r so
ld w
as s
omet
imes
rep
orte
d fo
r al
l fla
vors
of t
he s
ame
prod
uct.
’Num
ber’
appe
ars
in ta
ble
for
first
flav
or, f
ollo
wed
by
rem
aini
ng fl
avor
s de
note
d by
*.
Sou
rce:
Caf
eter
ia S
urve
y an
d an
d In
vent
orie
s of
Com
petit
ive
Foo
ds.
E-6

Tab
le E
.1—
Co
mp
etit
ive
Fo
od
an
d B
ever
age
Pro
du
cts
Ava
ilab
le D
uri
ng
th
e S
cho
ol D
ay, B
y S
cho
ol a
nd
So
urc
e —
Co
nti
nu
ed
Sch
oo
l #2,
Sch
oo
l sto
re
Pac
kage
size
Num
b-er
1P
rice
FM
NV
&
FD
Ala
bel
crite
ri-a2
Mac
ron
utr
ien
tsM
icro
nu
trie
nts
Mea
n #
ser
vin
gs
per
pyr
amid
gro
up
Fat
& s
ug
ar
Mea
n am
ount
per
item
Per
cent
of
calo
ries
from
Vit A
(RE
)
Vit C
(mg)
Cal
ci-
um (mg)
Iron
(mg)
Gra
inV
eget
-ab
leF
ruit
Dai
ryM
eat3
Mea
n am
ount
per
item
Cal
ori-
es
Tot
alfa
t(g
)
Sat
ura-
ted
fat
(g)
Car
b-oh
ydr-
ate
(g)
Pro
tein
(g)
Cho
le-
ster
ol(m
g)
Sod
i-um (m
g)
Die
tary
fiber
(g)
Tot
alfa
t
Sat
ura-
ted
fat
Dis
cre-
tiona
ryF
at (g)
Add
edS
ugar
s(t
sp)
Can
dyA
ir H
eads
blu
era
spbe
rry
......
......
0.6
oz18
00.
25➁
➌12
22.
60.
625
.90.
3–
33.1
–18
.84.
3–
12.3
5.3
––
––
––
2.4
6.4
Air
Hea
ds c
herr
y...
....
0.6
oz14
40.
25➁
➌12
22.
60.
625
.90.
3–
33.1
–18
.84.
3–
12.3
5.3
––
––
––
2.4
6.4
Air
Hea
ds g
reen
appl
e...
......
......
....
0.6
oz10
80.
25➁
➌12
22.
60.
625
.90.
3–
33.1
–18
.84.
3–
12.3
5.3
––
––
––
2.4
6.4
Air
Hea
ds o
rang
e...
...0.
6 oz
720.
25➁
➌12
22.
60.
625
.90.
3–
33.1
–18
.84.
3–
12.3
5.3
––
––
––
2.4
6.4
Air
Hea
ds s
traw
berr
y0.
6 oz
144
0.25
➁➌
122
2.6
0.6
25.9
0.3
–33
.1–
18.8
4.3
–12
.35.
3–
––
––
–2.
46.
4A
ir H
eads
wat
erm
elon
......
...0.
6 oz
108
0.25
➁➌
122
2.6
0.6
25.9
0.3
–33
.1–
18.8
4.3
–12
.35.
3–
––
––
–2.
46.
4A
ir H
eads
whi
tem
yste
ry...
......
......
0.6
oz14
40.
25➁
➌12
22.
60.
625
.90.
3–
33.1
–18
.84.
3–
12.3
5.3
––
––
––
2.4
6.4
Car
amel
app
le p
op...
1.0
pop
240
0.25
✘➁
➌➃
63–
–16
.7–
–6.
5–
––
––
0.5
––
––
––
–4.
0C
harm
s flu
ffy c
otto
nca
ndy
......
......
......
1.0
pop
240
0.25
✘➁
➌➃
221
––
58.2
––
22.5
––
––
–1.
80.
2–
––
––
–13
.8C
harm
s sw
eet &
sou
rpo
p...
......
......
......
.1.
0 po
p24
00.
25✘
➁➌
➃78
––
20.6
––
8.0
––
––
–0.
6–
––
––
––
4.9
Gum
mi B
ears
......
......
1.4
oz36
0.75
✘➁
➌➃
153
––
39.3
––
17.5
––
––
–1.
20.
20.
2–
––
––
9.4
Jolly
Ran
cher
pop
.....
1.0
pop
300
0.25
✘➁
➌➃
78–
–20
.6–
–8.
0–
––
––
0.6
––
––
––
–4.
9La
ffy T
affy
app
le...
....
1.0
pc16
50.
15➁
➌37
0.8
0.2
7.9
––
10.0
–18
.74.
4–
3.7
1.6
––
––
––
0.7
1.9
Laffy
Taf
fy b
lue
rasp
berr
y...
......
...1.
0 pc
165
0.15
➁➌
370.
80.
27.
9–
–10
.0–
18.7
4.4
–3.
71.
6–
––
––
–0.
71.
9La
ffy T
affy
che
rry
......
1.0
pc16
50.
15➁
➌37
0.8
0.2
7.9
––
10.0
–18
.74.
4–
3.7
1.6
––
––
––
0.7
1.9
Laffy
Taf
fy p
unch
......
1.0
pc16
50.
15➁
➌37
0.8
0.2
7.9
––
10.0
–18
.74.
4–
3.7
1.6
––
––
––
0.7
1.9
Life
save
r po
p sw
irl...
.1.
0 po
p50
0.25
✘➁
➌➃
52–
–13
.8–
–5.
3–
––
––
0.4
––
––
––
–3.
3Li
ndor
milk
cho
c ba
lls0.
4 oz
480.
35✘
➋➌
623.
72.
27.
10.
82.
69.
80.
453
.832
.56.
6–
22.9
0.2
––
––
–3.
71.
4Li
ndor
whi
te c
hoc
balls
......
......
......
..0.
4 oz
480.
35✘
➋➌
653.
92.
37.
10.
72.
510
.8–
53.6
32.4
0.1
–23
.9–
––
––
–4.
01.
5M
&M
’s C
rispy
......
.....
1.5
oz24
0.75
➋➌
209
9.0
5.6
30.3
1.8
6.0
25.9
1.1
38.7
23.9
22.5
0.2
44.7
0.5
0.1
––
0.1
–9.
06.
5M
&M
’s P
eanu
t...
......
.1.
7 oz
480.
75➋
➌24
212
.34.
928
.44.
54.
222
.61.
645
.818
.011
.30.
247
.50.
5–
––
0.2
0.2
16.1
4.2
Neo
n la
ser
stra
w...
....
0.1
oz12
000.
10✘
➁➌
➃11
––
3.0
––
1.1
––
––
––
––
––
––
–0.
7R
aisi
nete
s...
......
......
..1.
6 oz
360.
75✘
➋➌
175
6.6
3.9
30.6
1.8
1.3
16.1
1.9
34.2
20.3
3.1
–38
.50.
8–
–0.
60.
1–
7.0
2.7
Ree
se’s
Pea
nut
butte
r cu
p...
......
...1.
6 oz
360.
75➋
244
14.1
5.0
24.6
4.6
2.3
142.
71.
452
.118
.58.
6–
35.1
0.5
––
––
0.4
13.5
4.4
–V
alue
is e
xact
ly z
ero.
naD
ata
are
not a
vaila
ble.
The
num
ber
sold
was
una
vaila
ble
for
som
e so
urce
s; n
umbe
r so
ld is
’na’
for
indi
vidu
al it
ems
with
in a
sou
rce
if in
form
atio
n w
as o
btai
ned
durin
g va
lidat
ion
but n
ot r
epor
ted
on th
e su
rvey
.1
’Num
ber’
colu
mn
cont
ains
the
num
ber
of in
divi
dual
item
s so
ld d
urin
g th
e ta
rget
wee
k. T
he ’N
umbe
r’ in
the
’All
item
s’ r
ow is
the
num
ber
of it
ems
(unw
eigh
ted)
or
the
tota
l num
ber
of s
ales
(w
eigh
ted)
.2
✘ in
dica
tes
food
s of
min
imum
nut
ritio
nal v
alue
(F
MN
V).
Foo
ds m
eetin
g F
DA
labe
ling
crite
ria a
re in
dica
ted
by: ➀
= c
alor
ie-f
ree;
➊ =
low
cal
orie
; ➁ =
cho
lest
erol
-fre
e; ➋
= lo
w c
hole
ster
ol; ➂
= s
odiu
m-f
ree;
➌ =
low
sod
ium
; ➃
= fa
t-fr
ee; ➍
= lo
w fa
t.3
Als
o in
clud
es le
gum
es, s
oybe
an p
rodu
cts,
nut
s, a
nd s
eeds
.S
ourc
e:C
afet
eria
Sur
vey
and
and
Inve
ntor
ies
of C
ompe
titiv
e F
oods
.
E-7

Tab
le E
.1—
Co
mp
etit
ive
Fo
od
an
d B
ever
age
Pro
du
cts
Ava
ilab
le D
uri
ng
th
e S
cho
ol D
ay, B
y S
cho
ol a
nd
So
urc
e —
Co
nti
nu
ed
Sch
oo
l #2,
Sch
oo
l sto
re
Pac
kage
size
Num
b-er
1P
rice
FM
NV
&
FD
Ala
bel
crite
ri-a2
Mac
ron
utr
ien
tsM
icro
nu
trie
nts
Mea
n #
ser
vin
gs
per
pyr
amid
gro
up
Fat
& s
ug
ar
Mea
n am
ount
per
item
Per
cent
of
calo
ries
from
Vit A
(RE
)
Vit C
(mg)
Cal
ci-
um (mg)
Iron
(mg)
Gra
inV
eget
-ab
leF
ruit
Dai
ryM
eat3
Mea
n am
ount
per
item
Cal
ori-
es
Tot
alfa
t(g
)
Sat
ura-
ted
fat
(g)
Car
b-oh
ydr-
ate
(g)
Pro
tein
(g)
Cho
le-
ster
ol(m
g)
Sod
i-um (m
g)
Die
tary
fiber
(g)
Tot
alfa
t
Sat
ura-
ted
fat
Dis
cre-
tiona
ryF
at (g)
Add
edS
ugar
s(t
sp)
Can
dyS
kittl
es F
ruit
cand
y...
2.2
oz36
0.75
➁➌
➍24
92.
70.
555
.80.
1–
9.8
–9.
71.
9–
41.2
––
0.1
––
––
2.1
12.9
Sni
cker
s...
......
......
.....
2.1
oz48
0.75
➋27
314
.05.
133
.84.
67.
415
1.6
1.4
46.2
16.9
22.2
0.3
53.6
0.4
––
–0.
10.
210
.97.
4S
our
patc
h ki
ds...
......
2.0
oz12
00.
75✘
➁➌
➃21
9–
–56
.1–
–25
.0–
––
––
1.7
0.2
0.2
––
––
–13
.4S
our
wat
erm
elon
......
2.0
oz14
40.
75✘
➁➌
➃21
9–
–56
.1–
–25
.0–
––
––
1.7
0.2
0.2
––
––
–13
.4S
tarb
urst
Cal
iforn
iaF
ruit
......
......
......
..2.
1 oz
720.
75➁
➌23
14.
81.
149
.10.
60.
262
.7–
18.8
4.2
–23
.310
.00.
1–
––
––
4.6
12.1
Sta
rbur
st F
ruit
Che
ws
2.1
oz36
0.75
➁➌
231
4.8
1.1
49.1
0.6
0.2
62.7
–18
.84.
2–
23.3
10.0
0.1
––
––
–4.
612
.1S
tarb
urst
Har
dT
ropi
cal.
......
......
..1.
6 oz
240.
75✘
➁➌
➃16
9–
–44
.5–
–17
.2–
––
––
1.4
0.1
––
––
––
10.6
Sta
rbur
st S
ours
......
...2.
1 oz
720.
75➁
➌23
14.
81.
149
.10.
60.
262
.7–
18.8
4.2
–23
.310
.00.
1–
––
––
4.6
12.1
Sta
rbur
st T
ropi
cal
.....
2.1
oz72
0.75
➁➌
231
4.8
1.1
49.1
0.6
0.2
62.7
–18
.84.
2–
23.3
10.0
0.1
––
––
–4.
612
.1S
wed
ish
fish
red
......
.2.
0 oz
720.
75✘
➁➌
➃21
9–
–56
.1–
–25
.0–
––
––
1.7
0.2
0.2
––
––
–13
.4T
wix
car
amel
coo
kie
bar
......
......
......
....
2.0
oz36
0.75
➋➌
283
13.8
5.1
37.2
2.6
2.8
109.
40.
644
.016
.114
.20.
251
.00.
51.
6–
––
–13
.23.
7W
onka
Gob
stop
pers
Che
wy
Cen
tere
d1.
8 oz
960.
75✘
➁➌
➃18
7–
–49
.3–
–19
.1–
––
––
1.5
0.2
––
––
––
11.7
Sna
cks
Prin
gles
Che
ezum
s..
1.8
oz12
0.75
27
719
.14.
725
.32.
9–
325.
51.
861
.915
.2–
4.1
11.9
0.7
–1.
7–
––
19.4
0.4
Prin
gles
Orig
inal
......
.1.
8 oz
120.
75
277
19.1
4.7
25.3
2.9
–32
5.5
1.8
61.9
15.2
–4.
111
.90.
7–
1.7
––
–19
.40.
4P
ringl
es P
izza
flavo
red
......
......
...1.
8 oz
120.
75
277
19.1
4.7
25.3
2.9
–32
5.5
1.8
61.9
15.2
–4.
111
.90.
7–
1.7
––
–19
.40.
4P
ringl
es S
our
crea
m&
oni
on...
......
......
1.8
oz24
0.75
27
719
.14.
725
.32.
9–
325.
51.
861
.915
.2–
4.1
11.9
0.7
–1.
7–
––
19.4
0.4
Slim
Jim
......
......
......
..1.
0 st
k60
00.
35
392.
51.
01.
13.
24.
621
2.5
0.2
56.3
23.8
––
1.9
0.5
––
––
0.3
1.7
–
Ave
rag
e o
f al
l ite
ms
Unw
eigh
ted
......
......
...–
410.
50
160
4.9
1.6
29.3
1.0
0.9
66.2
0.4
23.5
8.0
2.2
6.2
11.3
0.2
–0.
2–
––
4.8
6.1
Wei
ghte
d...
......
......
...–
5594
0.31
95
1.8
0.6
20.0
0.6
0.7
43.5
0.1
15.6
5.4
0.6
3.8
4.4
0.1
––
––
–1.
64.
6
–V
alue
is e
xact
ly z
ero.
naD
ata
are
not a
vaila
ble.
The
num
ber
sold
was
una
vaila
ble
for
som
e so
urce
s; n
umbe
r so
ld is
’na’
for
indi
vidu
al it
ems
with
in a
sou
rce
if in
form
atio
n w
as o
btai
ned
durin
g va
lidat
ion
but n
ot r
epor
ted
on th
e su
rvey
.1
’Num
ber’
colu
mn
cont
ains
the
num
ber
of in
divi
dual
item
s so
ld d
urin
g th
e ta
rget
wee
k. T
he ’N
umbe
r’ in
the
’All
item
s’ r
ow is
the
num
ber
of it
ems
(unw
eigh
ted)
or
the
tota
l num
ber
of s
ales
(w
eigh
ted)
.2
✘ in
dica
tes
food
s of
min
imum
nut
ritio
nal v
alue
(F
MN
V).
Foo
ds m
eetin
g F
DA
labe
ling
crite
ria a
re in
dica
ted
by: ➀
= c
alor
ie-f
ree;
➊ =
low
cal
orie
; ➁ =
cho
lest
erol
-fre
e; ➋
= lo
w c
hole
ster
ol; ➂
= s
odiu
m-f
ree;
➌ =
low
sod
ium
; ➃
= fa
t-fr
ee; ➍
= lo
w fa
t.3
Als
o in
clud
es le
gum
es, s
oybe
an p
rodu
cts,
nut
s, a
nd s
eeds
.S
ourc
e:C
afet
eria
Sur
vey
and
and
Inve
ntor
ies
of C
ompe
titiv
e F
oods
.
E
-8

Tab
le E
.1—
Co
mp
etit
ive
Fo
od
an
d B
ever
age
Pro
du
cts
Ava
ilab
le D
uri
ng
th
e S
cho
ol D
ay, B
y S
cho
ol a
nd
So
urc
e —
Co
nti
nu
ed
Sch
oo
l #2,
Ven
din
g M
ach
ine
#14
Pac
kage
size
Num
b-er
1P
rice
FM
NV
&
FD
Ala
bel
crite
ri-a2
Mac
ron
utr
ien
tsM
icro
nu
trie
nts
Mea
n #
ser
vin
gs
per
pyr
amid
gro
up
Fat
& s
ug
ar
Mea
n am
ount
per
item
Per
cent
of
calo
ries
from
Vit A
(RE
)
Vit C
(mg)
Cal
ci-
um (mg)
Iron
(mg)
Gra
inV
eget
-ab
leF
ruit
Dai
ryM
eat3
Mea
n am
ount
per
item
Cal
ori-
es
Tot
alfa
t(g
)
Sat
ura-
ted
fat
(g)
Car
b-oh
ydr-
ate
(g)
Pro
tein
(g)
Cho
le-
ster
ol(m
g)
Sod
i-um (m
g)
Die
tary
fiber
(g)
Tot
alfa
t
Sat
ura-
ted
fat
Dis
cre-
tiona
ryF
at (g)
Add
edS
ugar
s(t
sp)
Bev
erag
esH
ood
Fru
it P
unch
(10%
juic
e) [9
]....
.16
.0 o
z10
11.
00➁
➌➃
233
––
59.0
––
109.
10.
5–
–5.
027
.839
.71.
0–
–0.
3–
––
12.8
Hoo
d Le
mon
ade
(10%
juic
e) [9
]....
.16
.0 o
z15
01.
00➁
➌➃
261
0.3
–68
.00.
4–
16.3
0.6
1.0
0.1
14.4
25.6
17.1
1.1
––
0.4
––
0.1
10.4
Hoo
d O
rang
e ju
ice
(100
%)
[9]
......
.....
16.0
oz
731.
00➁
➂➃
223
0.3
–53
.43.
4–
5.0
1.0
1.2
0.1
39.6
192.
760
0.1
0.5
––
2.7
––
––
Nes
quik
Cho
c m
ilk [5
]16
.0 o
z13
1.50
41
717
.010
.551
.715
.961
.029
8.0
4.0
36.6
22.7
145.
04.
680
0.0
1.2
––
–2.
0–
16.1
6.7
Nes
quik
Dou
ble
choc
milk
[6]
......
......
....
16.0
oz
431.
50
417
17.0
10.5
51.7
15.9
61.0
298.
04.
036
.622
.714
5.0
4.6
800.
01.
2–
––
2.0
–16
.16.
7N
esqu
ik S
traw
berr
ym
ilk [4
]...
......
......
.16
.0 o
z28
1.50
44
215
.49.
662
.415
.162
.424
0.5
–31
.419
.514
2.2
4.4
800.
00.
41.
1–
–1.
9–
14.5
6.9
Nes
quik
Ver
y V
anill
am
ilk [3
]...
......
......
.16
.0 o
z6
1.50
44
215
.49.
662
.415
.162
.424
0.5
–31
.419
.514
2.2
4.4
800.
00.
41.
1–
–1.
9–
14.5
6.9
Ave
rag
e o
f al
l ite
ms
Unw
eigh
ted
......
......
...–
71.
29
348
9.3
5.7
58.4
9.4
35.3
172.
51.
519
.712
.190
.537
.755
1.0
0.8
0.3
–0.
51.
1–
8.7
7.2
Wei
ghte
d...
......
......
...–
414
1.11
28
43.
72.
260
.64.
113
.493
.51.
18.
14.
744
.751
.029
5.6
0.9
––
0.7
0.4
–3.
48.
4
–V
alue
is e
xact
ly z
ero.
naD
ata
are
not a
vaila
ble.
The
num
ber
sold
was
una
vaila
ble
for
som
e so
urce
s; n
umbe
r so
ld is
’na’
for
indi
vidu
al it
ems
with
in a
sou
rce
if in
form
atio
n w
as o
btai
ned
durin
g va
lidat
ion
but n
ot r
epor
ted
on th
e su
rvey
.1
’Num
ber’
colu
mn
cont
ains
the
num
ber
of in
divi
dual
item
s so
ld d
urin
g th
e ta
rget
wee
k. T
he ’N
umbe
r’ in
the
’All
item
s’ r
ow is
the
num
ber
of it
ems
(unw
eigh
ted)
or
the
tota
l num
ber
of s
ales
(w
eigh
ted)
.2
✘ in
dica
tes
food
s of
min
imum
nut
ritio
nal v
alue
(F
MN
V).
Foo
ds m
eetin
g F
DA
labe
ling
crite
ria a
re in
dica
ted
by: ➀
= c
alor
ie-f
ree;
➊ =
low
cal
orie
; ➁ =
cho
lest
erol
-fre
e; ➋
= lo
w c
hole
ster
ol; ➂
= s
odiu
m-f
ree;
➌ =
low
sod
ium
; ➃
= fa
t-fr
ee; ➍
= lo
w fa
t.3
Als
o in
clud
es le
gum
es, s
oybe
an p
rodu
cts,
nut
s, a
nd s
eeds
.4
Ven
ding
mac
hine
item
s oc
cupy
ing
mul
tiple
slo
ts a
re in
dica
ted
with
the
num
ber
of s
lots
sho
wn
in [
] fol
low
ing
the
prod
uct n
ame.
S
ourc
e:C
afet
eria
Sur
vey
and
and
Inve
ntor
ies
of C
ompe
titiv
e F
oods
.
E-9

Tab
le E
.1—
Co
mp
etit
ive
Fo
od
an
d B
ever
age
Pro
du
cts
Ava
ilab
le D
uri
ng
th
e S
cho
ol D
ay, B
y S
cho
ol a
nd
So
urc
e —
Co
nti
nu
ed
Sch
oo
l #2,
Ven
din
g M
ach
ine
#24,
6
Pac
kage
size
Num
b-er
1P
rice
FM
NV
&
FD
Ala
bel
crite
ri-a2
Mac
ron
utr
ien
tsM
icro
nu
trie
nts
Mea
n #
ser
vin
gs
per
pyr
amid
gro
up
Fat
& s
ug
ar
Mea
n am
ount
per
item
Per
cent
of
calo
ries
from
Vit A
(RE
)
Vit C
(mg)
Cal
ci-
um (mg)
Iron
(mg)
Gra
inV
eget
-ab
leF
ruit
Dai
ryM
eat3
Mea
n am
ount
per
item
Cal
ori-
es
Tot
alfa
t(g
)
Sat
ura-
ted
fat
(g)
Car
b-oh
ydr-
ate
(g)
Pro
tein
(g)
Cho
le-
ster
ol(m
g)
Sod
i-um (m
g)
Die
tary
fiber
(g)
Tot
alfa
t
Sat
ura-
ted
fat
Dis
cre-
tiona
ryF
at (g)
Add
edS
ugar
s(t
sp)
Bev
erag
esH
ood
App
le ju
ice
(100
%)
[9]
......
.....
16.0
oz
911.
00➁
➌➃
233
0.5
–57
.20.
7–
34.7
0.5
1.9
0.3
–17
1.4
554.
71.
3–
–2.
7–
––
–H
ood
Cof
fee
milk
(1%
) [2
]...
......
......
16.0
oz
161.
00
340
10.0
6.2
56.0
16.1
34.0
301.
02.
526
.516
.428
5.0
30.0
568.
01.
2–
––
2.0
–8.
25.
5H
ood
Lem
onad
e(1
0% ju
ice)
[9].
....
16.0
oz
921.
00➁
➌➃
261
0.3
–68
.00.
4–
16.3
0.6
1.0
0.1
14.4
25.6
17.1
1.1
––
0.4
––
0.1
10.4
Hoo
d W
hole
Milk
......
16.0
oz
91.
00
300
16.3
10.2
22.7
16.1
66.4
239.
1–
48.9
30.5
151.
34.
658
2.7
0.2
––
–2.
0–
15.4
–N
esqu
ik C
hoc
milk
(fat
free
) [4
]...
......
16.0
oz
191.
50➋
➍28
82.
41.
453
.417
.28.
424
1.4
3.0
7.4
4.3
283.
84.
680
0.0
1.4
––
–2.
0–
1.5
6.7
Nes
quik
Dou
ble
choc
milk
[6]
......
......
....
16.0
oz
91.
50
417
17.0
10.5
51.7
15.9
61.0
298.
04.
036
.622
.714
5.0
4.6
800.
01.
2–
––
2.0
–16
.16.
7N
esqu
ik S
traw
berr
ym
ilk [9
]...
......
......
.16
.0 o
z11
1.50
44
215
.49.
662
.415
.162
.424
0.5
–31
.419
.514
2.2
4.4
800.
00.
41.
1–
–1.
9–
14.5
6.9
Nes
quik
Van
illa
milk
[3].
......
......
......
.....
16.0
oz
na1.
50
442
15.4
9.6
62.4
15.1
62.4
240.
5–
31.4
19.5
142.
24.
480
0.0
0.4
1.1
––
1.9
–14
.56.
9T
ropi
cana
sm
ooth
ies,
mix
ed b
erry
......
...11
.5 o
z3
1.75
➋➌
➃24
0–
–59
.54.
916
.077
.32.
9–
–51
.160
.025
0.0
0.7
––
1.4
0.4
–4.
17.
4T
ropi
cana
sm
ooth
ies,
stra
wbe
rry
......
.....
11.5
oz
41.
75➋
➌➃
240
––
59.5
4.9
16.0
77.3
2.9
––
51.1
60.0
250.
00.
7–
–1.
40.
4–
4.1
7.4
Ave
rag
e o
f al
l ite
ms
Unw
eigh
ted
......
......
...–
101.
35
320
7.7
4.7
55.3
10.6
32.6
176.
61.
618
.511
.312
6.6
37.0
542.
30.
90.
2–
0.6
1.3
–7.
85.
8W
eigh
ted
......
......
......
–25
41.
10
272
2.9
1.7
59.6
4.6
10.4
86.9
1.0
7.7
4.3
62.5
75.1
391.
11.
1–
–1.
10.
5–
2.5
5.3
–V
alue
is e
xact
ly z
ero.
naD
ata
are
not a
vaila
ble.
The
num
ber
sold
was
una
vaila
ble
for
som
e so
urce
s; n
umbe
r so
ld is
’na’
for
indi
vidu
al it
ems
with
in a
sou
rce
if in
form
atio
n w
as o
btai
ned
durin
g va
lidat
ion
but n
ot r
epor
ted
on th
e su
rvey
.1
’Num
ber’
colu
mn
cont
ains
the
num
ber
of in
divi
dual
item
s so
ld d
urin
g th
e ta
rget
wee
k. T
he ’N
umbe
r’ in
the
’All
item
s’ r
ow is
the
num
ber
of it
ems
(unw
eigh
ted)
or
the
tota
l num
ber
of s
ales
(w
eigh
ted)
.2
✘ in
dica
tes
food
s of
min
imum
nut
ritio
nal v
alue
(F
MN
V).
Foo
ds m
eetin
g F
DA
labe
ling
crite
ria a
re in
dica
ted
by: ➀
= c
alor
ie-f
ree;
➊ =
low
cal
orie
; ➁ =
cho
lest
erol
-fre
e; ➋
= lo
w c
hole
ster
ol; ➂
= s
odiu
m-f
ree;
➌ =
low
sod
ium
; ➃
= fa
t-fr
ee; ➍
= lo
w fa
t.3
Als
o in
clud
es le
gum
es, s
oybe
an p
rodu
cts,
nut
s, a
nd s
eeds
.6
Ven
ding
mac
hine
had
one
em
pty
slot
.4
Ven
ding
mac
hine
item
s oc
cupy
ing
mul
tiple
slo
ts a
re in
dica
ted
with
the
num
ber
of s
lots
sho
wn
in [
] fol
low
ing
the
prod
uct n
ame.
S
ourc
e:C
afet
eria
Sur
vey
and
and
Inve
ntor
ies
of C
ompe
titiv
e F
oods
.
E-1
0

Tab
le E
.1—
Co
mp
etit
ive
Fo
od
an
d B
ever
age
Pro
du
cts
Ava
ilab
le D
uri
ng
th
e S
cho
ol D
ay, B
y S
cho
ol a
nd
So
urc
e —
Co
nti
nu
ed
Sch
oo
l #2,
Ven
din
g M
ach
ine
#3
Pac
kage
size
Num
b-er
1P
rice
FM
NV
&
FD
Ala
bel
crite
ri-a2
Mac
ron
utr
ien
tsM
icro
nu
trie
nts
Mea
n #
ser
vin
gs
per
pyr
amid
gro
up
Fat
& s
ug
ar
Mea
n am
ount
per
item
Per
cent
of
calo
ries
from
Vit A
(RE
)
Vit C
(mg)
Cal
ci-
um (mg)
Iron
(mg)
Gra
inV
eget
-ab
leF
ruit
Dai
ryM
eat3
Mea
n am
ount
per
item
Cal
ori-
es
Tot
alfa
t(g
)
Sat
ura-
ted
fat
(g)
Car
b-oh
ydr-
ate
(g)
Pro
tein
(g)
Cho
le-
ster
ol(m
g)
Sod
i-um (m
g)
Die
tary
fiber
(g)
Tot
alfa
t
Sat
ura-
ted
fat
Dis
cre-
tiona
ryF
at (g)
Add
edS
ugar
s(t
sp)
Fro
zen
dess
erts
Am
eric
an G
lory
sund
ae c
one
......
.4.
3 oz
431.
00➌
256
16.1
6.6
25.8
5.2
31.1
64.5
1.7
56.5
23.1
82.9
0.5
118.
30.
80.
2–
–0.
20.
215
.84.
0B
lack
ras
pber
ry ic
ecr
eam
bar
......
.....
3.0
oz17
1.00
➋➌
201
16.0
11.0
14.4
1.7
19.5
35.5
0.2
71.6
49.3
51.8
0.3
57.4
0.1
––
–0.
1–
12.5
2.8
Cho
c C
hip
cook
iesa
ndw
ich
......
......
.4.
5 oz
141.
50➌
207
8.1
4.7
31.3
3.8
28.5
52.4
0.8
35.1
20.3
75.8
0.4
86.5
0.4
0.8
––
0.2
–8.
04.
3C
hoc
écla
ir ic
e cr
eam
bar
......
......
......
....
4.0
ozna
1.00
20
58.
63.
030
.93.
636
.531
0.3
0.8
38.0
13.0
40.2
0.2
86.0
1.7
0.7
––
––
8.0
4.3
Coo
kies
& c
ream
ice
crea
m b
ar...
......
..4.
5 oz
341.
00➌
212
14.0
8.0
21.8
2.5
29.6
54.0
0.3
59.4
34.0
78.6
0.4
87.0
0.2
––
–0.
2–
19.0
4.2
Cry
Bab
y E
xtra
Sou
rC
herr
y Ita
lian
Ice
4.5
oz14
0.75
✘➁
➌➃
139
––
35.4
0.4
–23
.9–
––
–1.
12.
20.
2–
––
––
–8.
8Ic
e cr
eam
san
dwic
h..
3.5
oz12
0.75
➌16
86.
63.
825
.43.
123
.142
.50.
635
.120
.361
.50.
370
.20.
30.
6–
–0.
2–
6.5
3.5
Klo
ndik
e O
reo
cook
iesa
ndw
ich
......
......
.4.
2 oz
71.
50➌
175
6.8
4.0
26.5
3.2
24.1
44.4
0.7
35.1
20.3
64.2
0.3
73.3
0.3
0.7
––
0.2
–6.
83.
6S
nick
ers
Big
One
ice
crea
m b
ar...
......
..3.
0 oz
241.
25➌
280
19.5
12.2
24.8
4.5
27.4
69.3
0.9
62.6
39.1
71.8
0.4
101.
20.
3–
––
0.2
0.1
18.9
4.8
Sof
t Fro
zen
Lem
onad
e...
......
..4.
0 oz
61.
25➁
➂➃
980.
1–
24.1
1.4
–4.
8–
1.1
–3.
611
.36.
00.
2–
–0.
3–
––
4.0
Str
awbe
rry
shor
tcak
eic
e cr
eam
bar
......
4.0
oz26
1.00
➌23
512
.03.
530
.93.
636
.590
.00.
846
.013
.440
.20.
286
.01.
70.
7–
––
–8.
04.
3S
uper
sicl
eF
irecr
acke
r R
ed,
Whi
te &
Blu
e B
ar4.
5 oz
160.
75✘
➁➌
➃10
4–
–27
.2–
–17
.3–
––
––
––
––
––
––
6.9
Tw
ix ic
e cr
eam
bar
...2.
5 oz
211.
25➌
175
13.0
9.9
14.9
1.7
20.2
36.8
0.2
66.5
51.0
53.6
0.3
59.4
0.2
––
–0.
2–
13.0
2.9
Ave
rag
e o
f al
l ite
ms
Unw
eigh
ted
......
......
...–
131.
08
189
9.3
5.1
25.6
2.7
21.3
65.0
0.5
39.0
21.8
48.0
1.2
64.1
0.5
0.3
––
0.1
–9.
04.
5W
eigh
ted
......
......
......
–23
41.
05
207
11.7
6.3
24.8
3.0
23.7
52.1
0.7
46.7
25.7
56.8
0.7
75.1
0.5
0.2
––
0.2
–11
.64.
4
–V
alue
is e
xact
ly z
ero.
naD
ata
are
not a
vaila
ble.
The
num
ber
sold
was
una
vaila
ble
for
som
e so
urce
s; n
umbe
r so
ld is
’na’
for
indi
vidu
al it
ems
with
in a
sou
rce
if in
form
atio
n w
as o
btai
ned
durin
g va
lidat
ion
but n
ot r
epor
ted
on th
e su
rvey
.1
’Num
ber’
colu
mn
cont
ains
the
num
ber
of in
divi
dual
item
s so
ld d
urin
g th
e ta
rget
wee
k. T
he ’N
umbe
r’ in
the
’All
item
s’ r
ow is
the
num
ber
of it
ems
(unw
eigh
ted)
or
the
tota
l num
ber
of s
ales
(w
eigh
ted)
.2
✘ in
dica
tes
food
s of
min
imum
nut
ritio
nal v
alue
(F
MN
V).
Foo
ds m
eetin
g F
DA
labe
ling
crite
ria a
re in
dica
ted
by: ➀
= c
alor
ie-f
ree;
➊ =
low
cal
orie
; ➁ =
cho
lest
erol
-fre
e; ➋
= lo
w c
hole
ster
ol; ➂
= s
odiu
m-f
ree;
➌ =
low
sod
ium
; ➃
= fa
t-fr
ee; ➍
= lo
w fa
t.3
Als
o in
clud
es le
gum
es, s
oybe
an p
rodu
cts,
nut
s, a
nd s
eeds
.S
ourc
e:C
afet
eria
Sur
vey
and
and
Inve
ntor
ies
of C
ompe
titiv
e F
oods
.
E-1
1

Tab
le E
.1—
Co
mp
etit
ive
Fo
od
an
d B
ever
age
Pro
du
cts
Ava
ilab
le D
uri
ng
th
e S
cho
ol D
ay, B
y S
cho
ol a
nd
So
urc
e —
Co
nti
nu
ed
Sch
oo
l #2,
Ven
din
g M
ach
ine
#4
Pac
kage
size
Num
b-er
1P
rice
FM
NV
&
FD
Ala
bel
crite
ri-a2
Mac
ron
utr
ien
tsM
icro
nu
trie
nts
Mea
n #
ser
vin
gs
per
pyr
amid
gro
up
Fat
& s
ug
ar
Mea
n am
ount
per
item
Per
cent
of
calo
ries
from
Vit A
(RE
)
Vit C
(mg)
Cal
ci-
um (mg)
Iron
(mg)
Gra
inV
eget
-ab
leF
ruit
Dai
ryM
eat3
Mea
n am
ount
per
item
Cal
ori-
es
Tot
alfa
t(g
)
Sat
ura-
ted
fat
(g)
Car
b-oh
ydr-
ate
(g)
Pro
tein
(g)
Cho
le-
ster
ol(m
g)
Sod
i-um (m
g)
Die
tary
fiber
(g)
Tot
alfa
t
Sat
ura-
ted
fat
Dis
cre-
tiona
ryF
at (g)
Add
edS
ugar
s(t
sp)
Bak
ed g
oods
/des
sert
Gra
ndm
a’s
Cho
c ch
ipco
okie
s...
......
......
2.8
oz40
0.75
37
517
.65.
852
.14.
2–
245.
62.
042
.314
.0–
–19
.52.
21.
7–
––
–15
.97.
1Q
uake
r F
ruit
&O
atm
eal B
ites,
stra
wbe
rry
......
.....
2.0
oz50
0.75
➁➌
209
4.3
0.9
41.3
2.5
–94
.71.
218
.33.
734
8.1
–30
6.0
2.8
1.5
––
––
2.8
5.7
Qua
ker
Fru
it &
Oat
mea
lT
oast
able
s, ic
edst
raw
b...
......
......
..3.
5 oz
na0.
75➁
390
10.1
1.5
70.6
4.7
–24
0.0
2.1
23.4
3.5
284.
80.
340
0.0
3.5
3.1
–0.
1–
–7.
07.
3
Bre
ad/g
rain
pro
duct
sC
heet
os C
urls
......
.....
1.5
ozna
0.75
21
410
.84.
024
.84.
35.
542
3.1
1.0
45.3
16.8
12.8
–64
.22.
02.
0–
––
–8.
8–
Hon
ey W
heat
Rol
dG
old
pret
zels
......
2.0
oz18
0.75
➁➍
216
2.0
0.4
44.9
5.2
–97
2.4
1.8
8.2
1.8
––
20.4
2.5
3.4
––
––
––
Qua
ker
chew
ygr
anol
a ba
r, c
hoc
chip
......
......
......
...2.
0 oz
250.
75➋
257
10.0
7.2
37.8
5.6
–15
7.6
1.8
34.9
25.2
0.6
0.6
34.0
1.8
1.6
–0.
1–
0.2
8.4
2.6
Qua
ker
Cris
pum
s...
...1.
3 oz
200.
75➁
156
3.7
0.6
28.3
2.5
–22
3.0
1.0
21.5
3.2
––
110.
01.
41.
6–
––
–2.
12.
1
Sna
cks
Che
etos
Cru
nchy
,K
ing
Siz
e...
......
...3.
5 oz
61.
25➋
550
34.1
6.5
53.4
7.5
4.0
1041
.91.
155
.910
.733
.70.
257
.62.
33.
7–
––
–30
.4–
Dor
itos
Coo
l Ran
ch,
Kin
g S
ize
......
......
3.0
oz93
1.25
➁42
622
.34.
353
.56.
0–
449.
15.
547
.19.
017
.0–
131.
01.
34.
0–
––
–18
.2–
Dor
itos
Nac
hoC
hees
e, K
ing
Siz
e...
......
......
......
3.0
oz9
1.25
➁42
622
.34.
353
.56.
0–
449.
15.
547
.19.
017
.0–
131.
01.
34.
0–
––
–18
.2–
Frit
os C
hili
Che
ese
chip
s...
......
......
....
4.5
oz8
1.25
➁68
842
.65.
872
.68.
4–
803.
76.
355
.87.
611
.5–
162.
01.
75.
3–
––
–37
.2–
Fun
yuns
, Kin
g S
ize
...2.
5 oz
71.
25➋
393
24.4
4.7
38.1
5.4
2.8
744.
20.
855
.910
.724
.10.
141
.11.
72.
7–
––
–21
.7–
Lay’
s K
C M
aste
rpie
ceB
BQ
pot
ato
chip
s2.
8 oz
51.
25
418
27.0
8.5
41.2
5.5
–46
3.1
3.5
58.1
18.4
–24
.318
.71.
3–
2.7
––
–24
.4–
Ruf
fles
Che
ddar
&S
our
Cre
am...
.....
2.8
oz9
1.25
41
827
.08.
541
.25.
5–
463.
13.
558
.118
.4–
24.3
18.7
1.3
–2.
7–
––
24.4
–
–V
alue
is e
xact
ly z
ero.
naD
ata
are
not a
vaila
ble.
The
num
ber
sold
was
una
vaila
ble
for
som
e so
urce
s; n
umbe
r so
ld is
’na’
for
indi
vidu
al it
ems
with
in a
sou
rce
if in
form
atio
n w
as o
btai
ned
durin
g va
lidat
ion
but n
ot r
epor
ted
on th
e su
rvey
.1
’Num
ber’
colu
mn
cont
ains
the
num
ber
of in
divi
dual
item
s so
ld d
urin
g th
e ta
rget
wee
k. T
he ’N
umbe
r’ in
the
’All
item
s’ r
ow is
the
num
ber
of it
ems
(unw
eigh
ted)
or
the
tota
l num
ber
of s
ales
(w
eigh
ted)
.2
✘ in
dica
tes
food
s of
min
imum
nut
ritio
nal v
alue
(F
MN
V).
Foo
ds m
eetin
g F
DA
labe
ling
crite
ria a
re in
dica
ted
by: ➀
= c
alor
ie-f
ree;
➊ =
low
cal
orie
; ➁ =
cho
lest
erol
-fre
e; ➋
= lo
w c
hole
ster
ol; ➂
= s
odiu
m-f
ree;
➌ =
low
sod
ium
; ➃
= fa
t-fr
ee; ➍
= lo
w fa
t.3
Als
o in
clud
es le
gum
es, s
oybe
an p
rodu
cts,
nut
s, a
nd s
eeds
.S
ourc
e:C
afet
eria
Sur
vey
and
and
Inve
ntor
ies
of C
ompe
titiv
e F
oods
.
E-1
2

Tab
le E
.1—
Co
mp
etit
ive
Fo
od
an
d B
ever
age
Pro
du
cts
Ava
ilab
le D
uri
ng
th
e S
cho
ol D
ay, B
y S
cho
ol a
nd
So
urc
e —
Co
nti
nu
ed
Sch
oo
l #2,
Ven
din
g M
ach
ine
#4
Pac
kage
size
Num
b-er
1P
rice
FM
NV
&
FD
Ala
bel
crite
ri-a2
Mac
ron
utr
ien
tsM
icro
nu
trie
nts
Mea
n #
ser
vin
gs
per
pyr
amid
gro
up
Fat
& s
ug
ar
Mea
n am
ount
per
item
Per
cent
of
calo
ries
from
Vit A
(RE
)
Vit C
(mg)
Cal
ci-
um (mg)
Iron
(mg)
Gra
inV
eget
-ab
leF
ruit
Dai
ryM
eat3
Mea
n am
ount
per
item
Cal
ori-
es
Tot
alfa
t(g
)
Sat
ura-
ted
fat
(g)
Car
b-oh
ydr-
ate
(g)
Pro
tein
(g)
Cho
le-
ster
ol(m
g)
Sod
i-um (m
g)
Die
tary
fiber
(g)
Tot
alfa
t
Sat
ura-
ted
fat
Dis
cre-
tiona
ryF
at (g)
Add
edS
ugar
s(t
sp)
Sna
cks
Sun
Chi
ps M
ultig
rain
Sna
ck H
arve
stC
hedd
ar...
......
.....
1.5
oz5
0.75
➁22
011
.10.
827
.03.
0–
178.
22.
645
.43.
411
.2–
2.3
0.4
2.1
––
––
8.9
0.1
Ave
rag
e o
f al
l ite
ms
Unw
eigh
ted
......
......
...–
150.
98
357
17.9
4.3
45.4
5.1
0.8
463.
22.
641
.110
.450
.73.
310
1.1
1.8
2.5
0.4
––
–15
.21.
7W
eigh
ted
......
......
......
–29
40.
98
341
15.9
3.9
46.8
4.8
0.1
375.
73.
137
.59.
767
.01.
211
9.1
1.8
2.6
0.1
––
–13
.22.
3
–V
alue
is e
xact
ly z
ero.
naD
ata
are
not a
vaila
ble.
The
num
ber
sold
was
una
vaila
ble
for
som
e so
urce
s; n
umbe
r so
ld is
’na’
for
indi
vidu
al it
ems
with
in a
sou
rce
if in
form
atio
n w
as o
btai
ned
durin
g va
lidat
ion
but n
ot r
epor
ted
on th
e su
rvey
.1
’Num
ber’
colu
mn
cont
ains
the
num
ber
of in
divi
dual
item
s so
ld d
urin
g th
e ta
rget
wee
k. T
he ’N
umbe
r’ in
the
’All
item
s’ r
ow is
the
num
ber
of it
ems
(unw
eigh
ted)
or
the
tota
l num
ber
of s
ales
(w
eigh
ted)
.2
✘ in
dica
tes
food
s of
min
imum
nut
ritio
nal v
alue
(F
MN
V).
Foo
ds m
eetin
g F
DA
labe
ling
crite
ria a
re in
dica
ted
by: ➀
= c
alor
ie-f
ree;
➊ =
low
cal
orie
; ➁ =
cho
lest
erol
-fre
e; ➋
= lo
w c
hole
ster
ol; ➂
= s
odiu
m-f
ree;
➌ =
low
sod
ium
; ➃
= fa
t-fr
ee; ➍
= lo
w fa
t.3
Als
o in
clud
es le
gum
es, s
oybe
an p
rodu
cts,
nut
s, a
nd s
eeds
.S
ourc
e:C
afet
eria
Sur
vey
and
and
Inve
ntor
ies
of C
ompe
titiv
e F
oods
.
E-1
3

Tab
le E
.1—
Co
mp
etit
ive
Fo
od
an
d B
ever
age
Pro
du
cts
Ava
ilab
le D
uri
ng
th
e S
cho
ol D
ay, B
y S
cho
ol a
nd
So
urc
e —
Co
nti
nu
ed
Sch
oo
l #2,
Ven
din
g M
ach
ine
#54
Pac
kage
size
Num
b-er
1P
rice
FM
NV
&
FD
Ala
bel
crite
ri-a2
Mac
ron
utr
ien
tsM
icro
nu
trie
nts
Mea
n #
ser
vin
gs
per
pyr
amid
gro
up
Fat
& s
ug
ar
Mea
n am
ount
per
item
Per
cent
of
calo
ries
from
Vit A
(RE
)
Vit C
(mg)
Cal
ci-
um (mg)
Iron
(mg)
Gra
inV
eget
-ab
leF
ruit
Dai
ryM
eat3
Mea
n am
ount
per
item
Cal
ori-
es
Tot
alfa
t(g
)
Sat
ura-
ted
fat
(g)
Car
b-oh
ydr-
ate
(g)
Pro
tein
(g)
Cho
le-
ster
ol(m
g)
Sod
i-um (m
g)
Die
tary
fiber
(g)
Tot
alfa
t
Sat
ura-
ted
fat
Dis
cre-
tiona
ryF
at (g)
Add
edS
ugar
s(t
sp)
Bev
erag
esS
prin
g w
ater
[7]
......
..16
.0 o
z37
31.
00✘
➀➁
➌➃
––
––
––
14.2
––
––
–9.
5–
––
––
––
–
Ave
rag
e o
f al
l ite
ms
Unw
eigh
ted
......
......
...–
11.
00
––
––
––
14.2
––
––
–9.
5–
––
––
––
–W
eigh
ted
......
......
......
–37
31.
00
––
––
––
14.2
––
––
–9.
5–
––
––
––
–
–V
alue
is e
xact
ly z
ero.
naD
ata
are
not a
vaila
ble.
The
num
ber
sold
was
una
vaila
ble
for
som
e so
urce
s; n
umbe
r so
ld is
’na’
for
indi
vidu
al it
ems
with
in a
sou
rce
if in
form
atio
n w
as o
btai
ned
durin
g va
lidat
ion
but n
ot r
epor
ted
on th
e su
rvey
.1
’Num
ber’
colu
mn
cont
ains
the
num
ber
of in
divi
dual
item
s so
ld d
urin
g th
e ta
rget
wee
k. T
he ’N
umbe
r’ in
the
’All
item
s’ r
ow is
the
num
ber
of it
ems
(unw
eigh
ted)
or
the
tota
l num
ber
of s
ales
(w
eigh
ted)
.2
✘ in
dica
tes
food
s of
min
imum
nut
ritio
nal v
alue
(F
MN
V).
Foo
ds m
eetin
g F
DA
labe
ling
crite
ria a
re in
dica
ted
by: ➀
= c
alor
ie-f
ree;
➊ =
low
cal
orie
; ➁ =
cho
lest
erol
-fre
e; ➋
= lo
w c
hole
ster
ol; ➂
= s
odiu
m-f
ree;
➌ =
low
sod
ium
; ➃
= fa
t-fr
ee; ➍
= lo
w fa
t.3
Als
o in
clud
es le
gum
es, s
oybe
an p
rodu
cts,
nut
s, a
nd s
eeds
.4
Ven
ding
mac
hine
item
s oc
cupy
ing
mul
tiple
slo
ts a
re in
dica
ted
with
the
num
ber
of s
lots
sho
wn
in [
] fol
low
ing
the
prod
uct n
ame.
S
ourc
e:C
afet
eria
Sur
vey
and
and
Inve
ntor
ies
of C
ompe
titiv
e F
oods
.
E-1
4

Tab
le E
.1—
Co
mp
etit
ive
Fo
od
an
d B
ever
age
Pro
du
cts
Ava
ilab
le D
uri
ng
th
e S
cho
ol D
ay, B
y S
cho
ol a
nd
So
urc
e —
Co
nti
nu
ed
Sch
oo
l #2,
Ven
din
g M
ach
ine
#64
Pac
kage
size
Num
b-er
1P
rice
FM
NV
&
FD
Ala
bel
crite
ri-a2
Mac
ron
utr
ien
tsM
icro
nu
trie
nts
Mea
n #
ser
vin
gs
per
pyr
amid
gro
up
Fat
& s
ug
ar
Mea
n am
ount
per
item
Per
cent
of
calo
ries
from
Vit A
(RE
)
Vit C
(mg)
Cal
ci-
um (mg)
Iron
(mg)
Gra
inV
eget
-ab
leF
ruit
Dai
ryM
eat3
Mea
n am
ount
per
item
Cal
ori-
es
Tot
alfa
t(g
)
Sat
ura-
ted
fat
(g)
Car
b-oh
ydr-
ate
(g)
Pro
tein
(g)
Cho
le-
ster
ol(m
g)
Sod
i-um (m
g)
Die
tary
fiber
(g)
Tot
alfa
t
Sat
ura-
ted
fat
Dis
cre-
tiona
ryF
at (g)
Add
edS
ugar
s(t
sp)
Bev
erag
esV
eryf
ine
Arc
ticO
rang
e C
hille
rs...
11.5
oz
700.
75➁
➌➃
190
––
48.0
0.7
–7.
2–
––
14.3
60.0
100.
00.
4–
–0.
5–
––
9.6
Ver
yfin
e F
ruit
punc
h[2
]....
......
......
......
..11
.5 o
z16
50.
75➁
➌➃
167
––
42.3
––
78.1
0.4
––
3.6
105.
128
.40.
8–
–0.
2–
––
9.2
Ver
yfin
e Ic
ed te
a w
/Le
mon
Chi
llers
....
11.5
oz
370.
75➁
➌➃
130
––
33.0
––
9.9
––
––
60.0
100.
0–
––
––
––
4.3
Ver
yfin
e O
rang
e ju
ice
(100
%)
......
......
....
11.5
oz
90.
75➁
➌➃
150
0.5
–35
.32.
1–
7.2
0.7
3.0
0.4
64.4
123.
128
.61.
6–
–1.
9–
––
–V
eryf
ine
Pin
kLe
mon
ade
Chi
llers
......
......
....
11.5
oz
790.
75➁
➌➃
188
0.2
–48
.90.
3–
11.7
0.4
1.0
0.1
10.4
60.0
100.
00.
8–
–0.
3–
––
7.4
Ver
yfin
e S
traw
berr
yba
nana
pun
ch...
..11
.5 o
z11
40.
75➁
➌➃
167
––
42.3
––
78.1
0.4
––
3.6
105.
128
.40.
8–
–0.
2–
––
9.2
Ver
yfin
e T
ropi
cal
Fre
eze
Chi
llers
...11
.5 o
z80
0.75
➁➌
➃16
7–
–42
.3–
–78
.10.
4–
–3.
660
.010
0.0
0.8
––
0.2
––
–9.
2
Ave
rag
e o
f al
l ite
ms
Unw
eigh
ted
......
......
...–
70.
75
166
0.1
–41
.70.
4–
38.6
0.3
0.6
0.1
14.3
81.9
69.4
0.7
––
0.5
––
–7.
0W
eigh
ted
......
......
......
–55
40.
75
170
––
43.2
0.2
–54
.00.
30.
2–
6.6
83.7
62.8
0.7
––
0.3
––
–8.
5
–V
alue
is e
xact
ly z
ero.
naD
ata
are
not a
vaila
ble.
The
num
ber
sold
was
una
vaila
ble
for
som
e so
urce
s; n
umbe
r so
ld is
’na’
for
indi
vidu
al it
ems
with
in a
sou
rce
if in
form
atio
n w
as o
btai
ned
durin
g va
lidat
ion
but n
ot r
epor
ted
on th
e su
rvey
.1
’Num
ber’
colu
mn
cont
ains
the
num
ber
of in
divi
dual
item
s so
ld d
urin
g th
e ta
rget
wee
k. T
he ’N
umbe
r’ in
the
’All
item
s’ r
ow is
the
num
ber
of it
ems
(unw
eigh
ted)
or
the
tota
l num
ber
of s
ales
(w
eigh
ted)
.2
✘ in
dica
tes
food
s of
min
imum
nut
ritio
nal v
alue
(F
MN
V).
Foo
ds m
eetin
g F
DA
labe
ling
crite
ria a
re in
dica
ted
by: ➀
= c
alor
ie-f
ree;
➊ =
low
cal
orie
; ➁ =
cho
lest
erol
-fre
e; ➋
= lo
w c
hole
ster
ol; ➂
= s
odiu
m-f
ree;
➌ =
low
sod
ium
; ➃
= fa
t-fr
ee; ➍
= lo
w fa
t.3
Als
o in
clud
es le
gum
es, s
oybe
an p
rodu
cts,
nut
s, a
nd s
eeds
.4
Ven
ding
mac
hine
item
s oc
cupy
ing
mul
tiple
slo
ts a
re in
dica
ted
with
the
num
ber
of s
lots
sho
wn
in [
] fol
low
ing
the
prod
uct n
ame.
S
ourc
e:C
afet
eria
Sur
vey
and
and
Inve
ntor
ies
of C
ompe
titiv
e F
oods
.
E-1
5

Tab
le E
.1—
Co
mp
etit
ive
Fo
od
an
d B
ever
age
Pro
du
cts
Ava
ilab
le D
uri
ng
th
e S
cho
ol D
ay, B
y S
cho
ol a
nd
So
urc
e —
Co
nti
nu
ed
Sch
oo
l #2,
Ven
din
g M
ach
ine
#74
Pac
kage
size
Num
b-er
1P
rice
FM
NV
&
FD
Ala
bel
crite
ri-a2
Mac
ron
utr
ien
tsM
icro
nu
trie
nts
Mea
n #
ser
vin
gs
per
pyr
amid
gro
up
Fat
& s
ug
ar
Mea
n am
ount
per
item
Per
cent
of
calo
ries
from
Vit A
(RE
)
Vit C
(mg)
Cal
ci-
um (mg)
Iron
(mg)
Gra
inV
eget
-ab
leF
ruit
Dai
ryM
eat3
Mea
n am
ount
per
item
Cal
ori-
es
Tot
alfa
t(g
)
Sat
ura-
ted
fat
(g)
Car
b-oh
ydr-
ate
(g)
Pro
tein
(g)
Cho
le-
ster
ol(m
g)
Sod
i-um (m
g)
Die
tary
fiber
(g)
Tot
alfa
t
Sat
ura-
ted
fat
Dis
cre-
tiona
ryF
at (g)
Add
edS
ugar
s(t
sp)
Bev
erag
esV
eryf
ine
App
le ju
ice
(100
%)
......
......
....
11.5
oz
220.
75➁
➌➃
168
0.4
–41
.60.
2–
10.7
0.4
2.1
0.4
–3.
225
.01.
3–
–1.
9–
––
–V
eryf
ine
Fru
it pu
nch
[2].
......
......
......
.....
11.5
oz
254
0.75
➁➌
➃16
7–
–42
.3–
–78
.10.
4–
–3.
610
5.1
28.4
0.8
––
0.2
––
–9.
2V
eryf
ine
Gla
cial
Gra
pe C
hille
rs...
..11
.5 o
z66
0.75
➁➌
➃16
2–
–41
.3–
–21
.6–
––
–60
.010
0.0
0.6
––
0.2
––
–9.
0V
eryf
ine
Iced
tea
w/
Lem
on C
hille
rs...
.11
.5 o
z10
00.
75➁
➌➃
130
––
33.0
––
9.9
––
––
60.0
100.
0–
––
––
––
4.3
Ver
yfin
e K
iwi
Str
awbe
rry
Chi
llers
......
......
....
11.5
oz
890.
75➁
➌➃
167
––
42.3
––
78.1
0.4
––
3.6
60.0
100.
00.
8–
–0.
2–
––
9.2
Ver
yfin
e P
ink
lem
onad
e...
......
...11
.5 o
z89
0.75
➁➌
➃18
80.
2–
48.9
0.3
–11
.70.
41.
00.
110
.460
.010
0.0
0.8
––
0.3
––
–7.
4V
eryf
ine
Tro
pica
lF
reez
e C
hille
rs...
11.5
oz
113
0.75
➁➌
➃16
7–
–42
.3–
–78
.10.
4–
–3.
660
.010
0.0
0.8
––
0.2
––
–9.
2
Ave
rag
e o
f al
l ite
ms
Unw
eigh
ted
......
......
...–
70.
75
164
––
41.7
––
41.2
0.3
0.4
0.1
3.0
58.3
79.1
0.7
––
0.4
––
–6.
9W
eigh
ted
......
......
......
–73
30.
75
164
––
41.7
––
53.6
0.3
0.2
–3.
573
.972
.90.
7–
–0.
2–
––
8.0
–V
alue
is e
xact
ly z
ero.
naD
ata
are
not a
vaila
ble.
The
num
ber
sold
was
una
vaila
ble
for
som
e so
urce
s; n
umbe
r so
ld is
’na’
for
indi
vidu
al it
ems
with
in a
sou
rce
if in
form
atio
n w
as o
btai
ned
durin
g va
lidat
ion
but n
ot r
epor
ted
on th
e su
rvey
.1
’Num
ber’
colu
mn
cont
ains
the
num
ber
of in
divi
dual
item
s so
ld d
urin
g th
e ta
rget
wee
k. T
he ’N
umbe
r’ in
the
’All
item
s’ r
ow is
the
num
ber
of it
ems
(unw
eigh
ted)
or
the
tota
l num
ber
of s
ales
(w
eigh
ted)
.2
✘ in
dica
tes
food
s of
min
imum
nut
ritio
nal v
alue
(F
MN
V).
Foo
ds m
eetin
g F
DA
labe
ling
crite
ria a
re in
dica
ted
by: ➀
= c
alor
ie-f
ree;
➊ =
low
cal
orie
; ➁ =
cho
lest
erol
-fre
e; ➋
= lo
w c
hole
ster
ol; ➂
= s
odiu
m-f
ree;
➌ =
low
sod
ium
; ➃
= fa
t-fr
ee; ➍
= lo
w fa
t.3
Als
o in
clud
es le
gum
es, s
oybe
an p
rodu
cts,
nut
s, a
nd s
eeds
.4
Ven
ding
mac
hine
item
s oc
cupy
ing
mul
tiple
slo
ts a
re in
dica
ted
with
the
num
ber
of s
lots
sho
wn
in [
] fol
low
ing
the
prod
uct n
ame.
S
ourc
e:C
afet
eria
Sur
vey
and
and
Inve
ntor
ies
of C
ompe
titiv
e F
oods
.
E-1
6

Tab
le E
.1—
Co
mp
etit
ive
Fo
od
an
d B
ever
age
Pro
du
cts
Ava
ilab
le D
uri
ng
th
e S
cho
ol D
ay, B
y S
cho
ol a
nd
So
urc
e —
Co
nti
nu
ed
Sch
oo
l #3,
A la
car
te
Pac
kage
size
Num
b-er
1P
rice
FM
NV
&
FD
Ala
bel
crite
ri-a2
Mac
ron
utr
ien
tsM
icro
nu
trie
nts
Mea
n #
ser
vin
gs
per
pyr
amid
gro
up
Fat
& s
ug
ar
Mea
n am
ount
per
item
Per
cent
of
calo
ries
from
Vit A
(RE
)
Vit C
(mg)
Cal
ci-
um (mg)
Iron
(mg)
Gra
inV
eget
-ab
leF
ruit
Dai
ryM
eat3
Mea
n am
ount
per
item
Cal
ori-
es
Tot
alfa
t(g
)
Sat
ura-
ted
fat
(g)
Car
b-oh
ydr-
ate
(g)
Pro
tein
(g)
Cho
le-
ster
ol(m
g)
Sod
i-um (m
g)
Die
tary
fiber
(g)
Tot
alfa
t
Sat
ura-
ted
fat
Dis
cre-
tiona
ryF
at (g)
Add
edS
ugar
s(t
sp)
Bak
ed g
oods
/des
sert
Cho
c ch
ip c
ooki
e(s
choo
l-bak
ed)
....
2.5
oz15
260.
60
347
20.1
5.7
41.4
4.1
23.0
255.
51.
852
.114
.810
9.4
0.2
28.3
1.7
0.9
––
–0.
219
.16.
3Li
’l D
eb H
oney
Bun
...4.
0 oz
480.
75
430
17.3
3.3
64.2
5.7
60.0
399.
62.
236
.36.
982
.51.
868
.31.
52.
1–
0.1
––
15.2
9.0
Li’l
Deb
Oat
mea
lC
ream
Pie
......
.....
3.8
oz42
0.75
➋➌
524
23.9
4.9
73.4
5.2
9.6
129.
62.
141
.18.
410
.10.
178
.03.
22.
5–
––
–21
.410
.0Li
’l D
eb Z
ebra
cak
e...
3.6
oz48
0.75
➋46
022
.05.
065
.23.
216
.322
0.0
0.4
43.0
9.8
5.1
0.1
45.9
1.3
1.6
––
––
10.0
10.7
Bev
erag
esS
prin
g w
ater
......
......
.16
.9 o
z81
11.
00✘
➀➁
➌➃
––
––
––
15.0
––
––
–10
.0–
––
––
––
–
Sun
ny D
elig
ht...
......
..18
.5 o
z15
1.25
➁➃
254
––
62.4
––
370.
0–
––
231.
375
.223
.10.
2–
–1.
0–
––
10.4
Ver
yfin
e A
pple
che
rry
berr
y pu
nch
......
...11
.5 o
z0
0.70
➁➌
➃16
7–
–42
.3–
–78
.10.
4–
–3.
610
5.1
28.4
0.8
––
0.2
––
–9.
2V
eryf
ine
Fru
it pu
nch
11.5
oz
390.
70➁
➌➃
167
––
42.3
––
78.1
0.4
––
3.6
105.
128
.40.
8–
–0.
2–
––
9.2
Ver
yfin
e G
laci
alG
rape
Chi
llers
.....
11.5
oz
240.
70➁
➌➃
162
––
41.3
––
21.6
––
––
60.0
100.
00.
6–
–0.
2–
––
9.0
Ver
yfin
e P
inea
pple
oran
ge d
rink
......
..11
.5 o
z18
0.70
➁➌
➃18
0–
–42
.44.
7–
10.8
0.4
––
190.
580
.918
.01.
0–
–1.
0–
––
4.7
Ver
yfin
e S
traw
berr
yba
nana
pun
ch...
..11
.5 o
z48
0.70
➁➌
➃16
7–
–42
.3–
–78
.10.
4–
–3.
610
5.1
28.4
0.8
––
0.2
––
–9.
2
Bre
ad/g
rain
pro
duct
sT
hin
pret
zels
chi
p...
..1.
0 oz
150.
60➁
➍10
81.
00.
222
.52.
6–
486.
20.
98.
21.
7–
–10
.21.
21.
7–
––
––
–
Fro
zen
dess
erts
Cho
c C
hip
cook
iesa
ndw
ich
......
......
.4.
5 oz
790.
90➌
207
8.1
4.7
31.3
3.8
28.5
52.4
0.8
35.1
20.3
75.8
0.4
86.5
0.4
0.8
––
0.2
–8.
04.
3C
hoc
écla
ir ic
e cr
eam
bar
......
......
......
....
3.0
oz12
0.60
➌17
67.
42.
626
.63.
131
.480
.00.
738
.013
.134
.60.
174
.01.
40.
6–
––
–6.
93.
7C
rispy
ice
crea
m b
ar3.
0 oz
110.
60➋
➌16
612
.39.
414
.11.
619
.134
.90.
266
.551
.050
.90.
356
.30.
1–
––
0.1
–12
.32.
7F
roze
n O
rang
e Ju
ice
Tur
bo T
ube
......
...3.
0 oz
na0.
60➁
➌➃
82–
–20
.70.
5–
7.2
––
–24
.123
.08.
10.
4–
–0.
3–
––
3.6
Ice
crea
m b
ar, v
anill
aw
/cho
c co
atin
g...
.3.
0 oz
na0.
60➋
➌16
612
.39.
414
.11.
619
.134
.90.
266
.551
.050
.90.
356
.30.
1–
––
0.1
–12
.32.
7
–V
alue
is e
xact
ly z
ero.
naD
ata
are
not a
vaila
ble.
The
num
ber
sold
was
una
vaila
ble
for
som
e so
urce
s; n
umbe
r so
ld is
’na’
for
indi
vidu
al it
ems
with
in a
sou
rce
if in
form
atio
n w
as o
btai
ned
durin
g va
lidat
ion
but n
ot r
epor
ted
on th
e su
rvey
.1
’Num
ber’
colu
mn
cont
ains
the
num
ber
of in
divi
dual
item
s so
ld d
urin
g th
e ta
rget
wee
k. T
he ’N
umbe
r’ in
the
’All
item
s’ r
ow is
the
num
ber
of it
ems
(unw
eigh
ted)
or
the
tota
l num
ber
of s
ales
(w
eigh
ted)
.2
✘ in
dica
tes
food
s of
min
imum
nut
ritio
nal v
alue
(F
MN
V).
Foo
ds m
eetin
g F
DA
labe
ling
crite
ria a
re in
dica
ted
by: ➀
= c
alor
ie-f
ree;
➊ =
low
cal
orie
; ➁ =
cho
lest
erol
-fre
e; ➋
= lo
w c
hole
ster
ol; ➂
= s
odiu
m-f
ree;
➌ =
low
sod
ium
; ➃
= fa
t-fr
ee; ➍
= lo
w fa
t.3
Als
o in
clud
es le
gum
es, s
oybe
an p
rodu
cts,
nut
s, a
nd s
eeds
.S
ourc
e:C
afet
eria
Sur
vey
and
and
Inve
ntor
ies
of C
ompe
titiv
e F
oods
.
E-1
7

Tab
le E
.1—
Co
mp
etit
ive
Fo
od
an
d B
ever
age
Pro
du
cts
Ava
ilab
le D
uri
ng
th
e S
cho
ol D
ay, B
y S
cho
ol a
nd
So
urc
e —
Co
nti
nu
ed
Sch
oo
l #3,
A la
car
te
Pac
kage
size
Num
b-er
1P
rice
FM
NV
&
FD
Ala
bel
crite
ri-a2
Mac
ron
utr
ien
tsM
icro
nu
trie
nts
Mea
n #
ser
vin
gs
per
pyr
amid
gro
up
Fat
& s
ug
ar
Mea
n am
ount
per
item
Per
cent
of
calo
ries
from
Vit A
(RE
)
Vit C
(mg)
Cal
ci-
um (mg)
Iron
(mg)
Gra
inV
eget
-ab
leF
ruit
Dai
ryM
eat3
Mea
n am
ount
per
item
Cal
ori-
es
Tot
alfa
t(g
)
Sat
ura-
ted
fat
(g)
Car
b-oh
ydr-
ate
(g)
Pro
tein
(g)
Cho
le-
ster
ol(m
g)
Sod
i-um (m
g)
Die
tary
fiber
(g)
Tot
alfa
t
Sat
ura-
ted
fat
Dis
cre-
tiona
ryF
at (g)
Add
edS
ugar
s(t
sp)
Fro
zen
dess
erts
Ice
crea
m s
andw
ich,
choc
......
......
......
..4.
0 oz
490.
60➋
➌14
45.
63.
221
.82.
619
.836
.40.
635
.220
.352
.60.
360
.00.
30.
5–
–0.
2–
5.6
3.0
Ice
crea
m s
andw
ich,
vani
lla...
......
......
..4.
1 oz
na0.
60➋
➌14
45.
63.
221
.82.
619
.836
.40.
635
.220
.352
.60.
360
.00.
30.
5–
–0.
2–
5.6
3.0
Klo
ndik
e Ic
e cr
eam
bar
......
......
......
....
5.0
oz14
0.90
➌27
820
.615
.823
.62.
732
.058
.40.
366
.551
.085
.10.
494
.20.
2–
––
0.2
–20
.64.
6N
utco
ne v
anill
a ic
ecr
eam
con
e...
......
4.0
oz45
0.60
➌21
713
.65.
621
.94.
426
.454
.71.
456
.523
.170
.30.
410
0.3
0.7
0.2
––
0.2
0.2
13.4
3.4
Sni
cker
s ic
e cr
eam
bar
......
......
......
....
2.0
oz72
0.90
➋➌
164
11.4
7.1
14.5
2.6
16.0
40.5
0.5
62.6
39.1
42.0
0.2
59.2
0.2
––
–0.
1–
11.0
2.8
Str
awbe
rry
écla
ir ic
ecr
eam
bar
......
.....
3.0
oz36
0.60
➌17
67.
42.
626
.63.
131
.455
.00.
738
.013
.134
.60.
174
.01.
40.
6–
––
–6.
93.
7
Sna
cks
But
ter
popc
orn
......
....
1.0
oz22
0.60
14
38.
42.
314
.82.
92.
523
7.6
2.8
52.8
14.2
10.5
–23
.50.
51.
2–
––
–7.
2–
Che
ese
popc
orn
......
.1.
0 oz
430.
60
143
8.4
2.3
14.8
2.9
2.5
237.
62.
852
.814
.210
.5–
23.5
0.5
1.2
––
––
7.2
–S
alt &
Vin
egar
pot
ato
chip
s...
......
......
....
1.0
oz55
0.60
15
29.
83.
115
.02.
0–
168.
41.
358
.118
.4–
8.8
6.8
0.5
–1.
0–
––
8.9
–S
our
crea
m &
oni
onpo
tato
chi
ps...
.....
1.0
oz37
0.60
15
29.
83.
115
.02.
0–
168.
41.
358
.118
.4–
8.8
6.8
0.5
–1.
0–
––
8.9
–
Ave
rag
e o
f al
l ite
ms
Unw
eigh
ted
......
......
...–
270.
71
203
8.3
3.5
31.0
2.4
13.2
127.
60.
933
.415
.245
.721
.446
.50.
80.
5–
0.1
––
7.4
4.6
Wei
ghte
d...
......
......
...–
3109
0.73
22
612
.33.
728
.62.
715
.116
2.1
1.1
35.1
11.2
63.6
4.7
29.6
1.0
0.6
––
––
11.5
4.3
–V
alue
is e
xact
ly z
ero.
naD
ata
are
not a
vaila
ble.
The
num
ber
sold
was
una
vaila
ble
for
som
e so
urce
s; n
umbe
r so
ld is
’na’
for
indi
vidu
al it
ems
with
in a
sou
rce
if in
form
atio
n w
as o
btai
ned
durin
g va
lidat
ion
but n
ot r
epor
ted
on th
e su
rvey
.1
’Num
ber’
colu
mn
cont
ains
the
num
ber
of in
divi
dual
item
s so
ld d
urin
g th
e ta
rget
wee
k. T
he ’N
umbe
r’ in
the
’All
item
s’ r
ow is
the
num
ber
of it
ems
(unw
eigh
ted)
or
the
tota
l num
ber
of s
ales
(w
eigh
ted)
.2
✘ in
dica
tes
food
s of
min
imum
nut
ritio
nal v
alue
(F
MN
V).
Foo
ds m
eetin
g F
DA
labe
ling
crite
ria a
re in
dica
ted
by: ➀
= c
alor
ie-f
ree;
➊ =
low
cal
orie
; ➁ =
cho
lest
erol
-fre
e; ➋
= lo
w c
hole
ster
ol; ➂
= s
odiu
m-f
ree;
➌ =
low
sod
ium
; ➃
= fa
t-fr
ee; ➍
= lo
w fa
t.3
Als
o in
clud
es le
gum
es, s
oybe
an p
rodu
cts,
nut
s, a
nd s
eeds
.S
ourc
e:C
afet
eria
Sur
vey
and
and
Inve
ntor
ies
of C
ompe
titiv
e F
oods
.
E-1
8
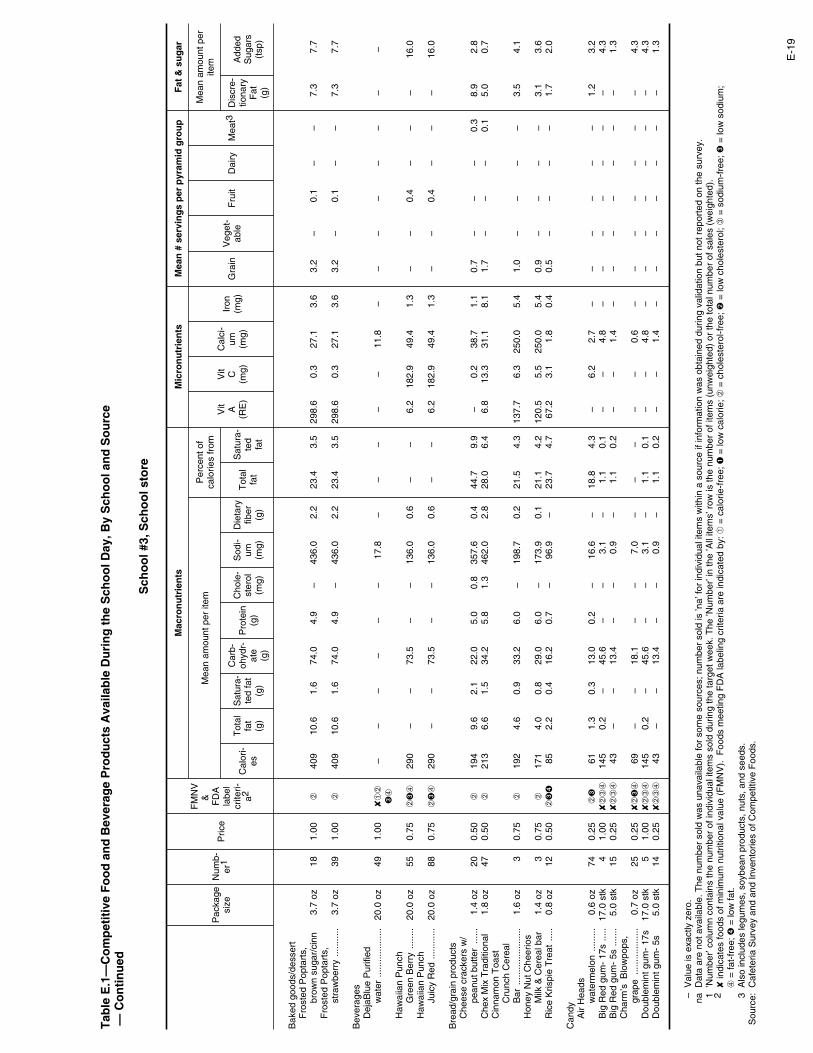
Tab
le E
.1—
Co
mp
etit
ive
Fo
od
an
d B
ever
age
Pro
du
cts
Ava
ilab
le D
uri
ng
th
e S
cho
ol D
ay, B
y S
cho
ol a
nd
So
urc
e —
Co
nti
nu
ed
Sch
oo
l #3,
Sch
oo
l sto
re
Pac
kage
size
Num
b-er
1P
rice
FM
NV
&
FD
Ala
bel
crite
ri-a2
Mac
ron
utr
ien
tsM
icro
nu
trie
nts
Mea
n #
ser
vin
gs
per
pyr
amid
gro
up
Fat
& s
ug
ar
Mea
n am
ount
per
item
Per
cent
of
calo
ries
from
Vit A
(RE
)
Vit C
(mg)
Cal
ci-
um (mg)
Iron
(mg)
Gra
inV
eget
-ab
leF
ruit
Dai
ryM
eat3
Mea
n am
ount
per
item
Cal
ori-
es
Tot
alfa
t(g
)
Sat
ura-
ted
fat
(g)
Car
b-oh
ydr-
ate
(g)
Pro
tein
(g)
Cho
le-
ster
ol(m
g)
Sod
i-um (m
g)
Die
tary
fiber
(g)
Tot
alfa
t
Sat
ura-
ted
fat
Dis
cre-
tiona
ryF
at (g)
Add
edS
ugar
s(t
sp)
Bak
ed g
oods
/des
sert
Fro
sted
Pop
tart
s,br
own
suga
r/ci
nn3.
7 oz
181.
00➁
409
10.6
1.6
74.0
4.9
–43
6.0
2.2
23.4
3.5
298.
60.
327
.13.
63.
2–
0.1
––
7.3
7.7
Fro
sted
Pop
tart
s,st
raw
berr
y...
......
..3.
7 oz
391.
00➁
409
10.6
1.6
74.0
4.9
–43
6.0
2.2
23.4
3.5
298.
60.
327
.13.
63.
2–
0.1
––
7.3
7.7
Bev
erag
esD
ejaB
lue
Pur
ified
wat
er...
......
......
....
20.0
oz
491.
00✘
➀➁
➌➃
––
––
––
17.8
––
––
–11
.8–
––
––
––
–
Haw
aiia
n P
unch
Gre
en B
erry
......
..20
.0 o
z55
0.75
➁➌
➃29
0–
–73
.5–
–13
6.0
0.6
––
6.2
182.
949
.41.
3–
–0.
4–
––
16.0
Haw
aiia
n P
unch
Juic
y R
ed...
......
...20
.0 o
z88
0.75
➁➌
➃29
0–
–73
.5–
–13
6.0
0.6
––
6.2
182.
949
.41.
3–
–0.
4–
––
16.0
Bre
ad/g
rain
pro
duct
sC
hees
e cr
acke
rs w
/pe
anut
but
ter
......
1.4
oz20
0.50
➁19
49.
62.
122
.05.
00.
835
7.6
0.4
44.7
9.9
–0.
238
.71.
10.
7–
––
0.3
8.9
2.8
Che
x M
ix T
radi
tiona
l1.
8 oz
470.
50➁
213
6.6
1.5
34.2
5.8
1.3
462.
02.
828
.06.
46.
813
.331
.18.
11.
7–
––
0.1
5.0
0.7
Cin
nam
on T
oast
Cru
nch
Cer
eal
Bar
......
......
......
....
1.6
oz3
0.75
➁19
24.
60.
933
.26.
0–
198.
70.
221
.54.
313
7.7
6.3
250.
05.
41.
0–
––
–3.
54.
1H
oney
Nut
Che
erio
sM
ilk &
Cer
eal b
ar1.
4 oz
30.
75➁
171
4.0
0.8
29.0
6.0
–17
3.9
0.1
21.1
4.2
120.
55.
525
0.0
5.4
0.9
––
––
3.1
3.6
Ric
e K
rispi
e T
reat
.....
0.8
oz12
0.50
➁➌
➍85
2.2
0.4
16.2
0.7
–96
.9–
23.7
4.7
67.2
3.1
1.8
0.4
0.5
––
––
1.7
2.0
Can
dyA
ir H
eads
wat
erm
elon
......
...0.
6 oz
740.
25➁
➌61
1.3
0.3
13.0
0.2
–16
.6–
18.8
4.3
–6.
22.
7–
––
––
–1.
23.
2B
ig R
ed g
um-
17s
.....
17.0
stk
41.
00✘
➁➂
➃14
50.
2–
45.6
––
3.1
–1.
10.
1–
–4.
8–
––
––
––
4.3
Big
Red
gum
- 5s
......
.5.
0 st
k15
0.25
✘➁
➂➃
43–
–13
.4–
–0.
9–
1.1
0.2
––
1.4
––
––
––
–1.
3C
harm
’s B
low
pops
,gr
ape
......
......
......
0.7
oz25
0.25
✘➁
➌➃
69–
–18
.1–
–7.
0–
––
––
0.6
––
––
––
–4.
3D
oubl
emin
t gum
- 17
s17
.0 s
tk5
1.00
✘➁
➂➃
145
0.2
–45
.6–
–3.
1–
1.1
0.1
––
4.8
––
––
––
–4.
3D
oubl
emin
t gum
- 5s
5.0
stk
140.
25✘
➁➂
➃43
––
13.4
––
0.9
–1.
10.
2–
–1.
4–
––
––
––
1.3
–V
alue
is e
xact
ly z
ero.
naD
ata
are
not a
vaila
ble.
The
num
ber
sold
was
una
vaila
ble
for
som
e so
urce
s; n
umbe
r so
ld is
’na’
for
indi
vidu
al it
ems
with
in a
sou
rce
if in
form
atio
n w
as o
btai
ned
durin
g va
lidat
ion
but n
ot r
epor
ted
on th
e su
rvey
.1
’Num
ber’
colu
mn
cont
ains
the
num
ber
of in
divi
dual
item
s so
ld d
urin
g th
e ta
rget
wee
k. T
he ’N
umbe
r’ in
the
’All
item
s’ r
ow is
the
num
ber
of it
ems
(unw
eigh
ted)
or
the
tota
l num
ber
of s
ales
(w
eigh
ted)
.2
✘ in
dica
tes
food
s of
min
imum
nut
ritio
nal v
alue
(F
MN
V).
Foo
ds m
eetin
g F
DA
labe
ling
crite
ria a
re in
dica
ted
by: ➀
= c
alor
ie-f
ree;
➊ =
low
cal
orie
; ➁ =
cho
lest
erol
-fre
e; ➋
= lo
w c
hole
ster
ol; ➂
= s
odiu
m-f
ree;
➌ =
low
sod
ium
; ➃
= fa
t-fr
ee; ➍
= lo
w fa
t.3
Als
o in
clud
es le
gum
es, s
oybe
an p
rodu
cts,
nut
s, a
nd s
eeds
.S
ourc
e:C
afet
eria
Sur
vey
and
and
Inve
ntor
ies
of C
ompe
titiv
e F
oods
.
E-1
9

Tab
le E
.1—
Co
mp
etit
ive
Fo
od
an
d B
ever
age
Pro
du
cts
Ava
ilab
le D
uri
ng
th
e S
cho
ol D
ay, B
y S
cho
ol a
nd
So
urc
e —
Co
nti
nu
ed
Sch
oo
l #3,
Sch
oo
l sto
re
Pac
kage
size
Num
b-er
1P
rice
FM
NV
&
FD
Ala
bel
crite
ri-a2
Mac
ron
utr
ien
tsM
icro
nu
trie
nts
Mea
n #
ser
vin
gs
per
pyr
amid
gro
up
Fat
& s
ug
ar
Mea
n am
ount
per
item
Per
cent
of
calo
ries
from
Vit A
(RE
)
Vit C
(mg)
Cal
ci-
um (mg)
Iron
(mg)
Gra
inV
eget
-ab
leF
ruit
Dai
ryM
eat3
Mea
n am
ount
per
item
Cal
ori-
es
Tot
alfa
t(g
)
Sat
ura-
ted
fat
(g)
Car
b-oh
ydr-
ate
(g)
Pro
tein
(g)
Cho
le-
ster
ol(m
g)
Sod
i-um (m
g)
Die
tary
fiber
(g)
Tot
alfa
t
Sat
ura-
ted
fat
Dis
cre-
tiona
ryF
at (g)
Add
edS
ugar
s(t
sp)
Can
dyE
xtra
spe
arm
int g
um,
suga
r-fr
ee...
......
..15
.0 s
tk6
1.00
✘➁
➂➃
800.
1–
28.4
––
2.1
–1.
30.
2–
–6.
0–
––
––
––
–Ic
ebre
aker
’sC
inna
fusi
on g
um12
.0 p
c2
1.00
✘➁
➂➃
205
0.2
–64
.3–
–4.
4–
1.1
0.1
––
6.7
––
––
––
–6.
0Ic
ebre
aker
’sM
inte
nsity
gum
...12
.0 p
c1
1.00
✘➁
➂➃
102
0.1
–32
.2–
–2.
2–
1.1
0.2
––
3.4
––
––
––
–3.
0Ju
icy
Fru
it gu
m-
17s
17.0
stk
61.
00✘
➁➂
➃14
50.
2–
45.6
––
3.1
–1.
10.
1–
–4.
8–
––
––
––
4.3
Juic
y F
ruit
gum
- 5s
...5.
0 st
k4
0.25
✘➁
➂➃
43–
–13
.4–
–0.
9–
1.1
0.2
––
1.4
––
––
––
–1.
3M
&M
’s P
eanu
t...
......
.1.
7 oz
110.
75➋
➌25
412
.95.
129
.84.
74.
423
.71.
745
.818
.011
.80.
349
.80.
6–
––
0.2
0.3
16.9
4.4
Men
tos
mix
ed fr
uit
....
1.3
oz16
0.75
✘➁
➌➃
134
––
34.7
––
15.0
––
––
–0.
8–
––
––
––
7.2
Orb
it pe
pper
min
tgu
m, s
ugar
-fre
e..
14.0
pc
241.
00✘
➁➂
➃75
0.1
–26
.5–
–2.
0–
1.3
0.2
––
5.6
––
––
––
––
Ree
se’s
Pea
nut
butte
r cu
p...
......
...1.
6 oz
200.
75➋
244
14.1
5.0
24.6
4.6
2.3
142.
71.
452
.118
.58.
6–
35.1
0.5
––
––
0.4
13.5
4.4
Ski
ttles
Fru
it ca
ndy
...2.
2 oz
120.
75➁
➌➍
249
2.7
0.5
55.8
0.1
–9.
8–
9.7
1.9
–41
.2–
–0.
1–
––
–2.
112
.9S
pear
min
t gum
......
...5.
0 st
k8
0.25
✘➁
➂➃
43–
–13
.4–
–0.
9–
1.1
0.2
––
1.4
––
––
––
–1.
3S
tarb
urst
Fru
it C
hew
s2.
1 oz
380.
75➁
➌23
24.
91.
149
.30.
60.
263
.0–
18.8
4.3
–23
.410
.00.
1–
––
––
4.7
12.1
Too
tsie
Rol
l Pop
s...
..0.
6 oz
40.
25✘
➁➌
➃63
––
16.7
––
6.5
––
––
–0.
5–
––
––
––
4.0
Tw
ix c
aram
el c
ooki
eba
r...
......
......
......
.2.
0 oz
360.
75➋
➌28
313
.85.
137
.22.
62.
810
9.4
0.6
44.0
16.1
14.2
0.2
51.0
0.5
1.6
––
––
13.2
3.7
Win
terf
resh
gum
- 17
s17
.0 s
tk12
1.00
✘➁
➂➃
145
0.2
–45
.6–
–3.
1–
1.1
0.1
––
4.8
––
––
––
–4.
3W
inte
rfre
sh g
um-
5s5.
0 st
k61
0.25
✘➁
➂➃
43–
–13
.4–
–0.
9–
1.1
0.2
––
1.4
––
––
––
–1.
3
Sna
cks
Che
etos
Cru
nchy
......
1.1
oz9
0.50
➁17
711
.02.
117
.22.
41.
333
4.9
0.4
55.9
10.7
10.8
–18
.50.
81.
2–
––
–9.
8–
Dor
itos
Coo
ler
Ran
ch1.
0 oz
60.
50➁
142
7.4
1.4
17.8
2.0
–14
9.7
1.8
47.1
9.0
5.7
–43
.70.
41.
3–
––
–6.
1–
Dor
itos
Nac
hoC
hees
ier
......
......
.1.
0 oz
170.
50➁
142
7.4
1.4
17.8
2.0
–14
9.7
1.8
47.1
9.0
5.7
–43
.70.
41.
3–
––
–6.
1–
Frit
os c
orn
chip
s...
....
1.3
oz10
0.50
➁19
111
.81.
620
.22.
3–
223.
31.
755
.87.
63.
2–
45.0
0.5
1.5
––
––
10.3
–G
iant
Slim
Jim
......
....
1.0
oz10
1.00
11
37.
03.
03.
09.
113
.260
8.6
0.5
56.2
23.8
––
5.5
1.5
––
––
0.8
4.9
–La
ys B
BQ
pot
ato
chip
s...
......
......
....
1.0
oz10
0.50
15
29.
83.
115
.02.
0–
168.
41.
358
.118
.4–
8.8
6.8
0.5
–1.
0–
––
8.9
–
–V
alue
is e
xact
ly z
ero.
naD
ata
are
not a
vaila
ble.
The
num
ber
sold
was
una
vaila
ble
for
som
e so
urce
s; n
umbe
r so
ld is
’na’
for
indi
vidu
al it
ems
with
in a
sou
rce
if in
form
atio
n w
as o
btai
ned
durin
g va
lidat
ion
but n
ot r
epor
ted
on th
e su
rvey
.1
’Num
ber’
colu
mn
cont
ains
the
num
ber
of in
divi
dual
item
s so
ld d
urin
g th
e ta
rget
wee
k. T
he ’N
umbe
r’ in
the
’All
item
s’ r
ow is
the
num
ber
of it
ems
(unw
eigh
ted)
or
the
tota
l num
ber
of s
ales
(w
eigh
ted)
.2
✘ in
dica
tes
food
s of
min
imum
nut
ritio
nal v
alue
(F
MN
V).
Foo
ds m
eetin
g F
DA
labe
ling
crite
ria a
re in
dica
ted
by: ➀
= c
alor
ie-f
ree;
➊ =
low
cal
orie
; ➁ =
cho
lest
erol
-fre
e; ➋
= lo
w c
hole
ster
ol; ➂
= s
odiu
m-f
ree;
➌ =
low
sod
ium
; ➃
= fa
t-fr
ee; ➍
= lo
w fa
t.3
Als
o in
clud
es le
gum
es, s
oybe
an p
rodu
cts,
nut
s, a
nd s
eeds
.S
ourc
e:C
afet
eria
Sur
vey
and
and
Inve
ntor
ies
of C
ompe
titiv
e F
oods
.
E-2
0

Tab
le E
.1—
Co
mp
etit
ive
Fo
od
an
d B
ever
age
Pro
du
cts
Ava
ilab
le D
uri
ng
th
e S
cho
ol D
ay, B
y S
cho
ol a
nd
So
urc
e —
Co
nti
nu
ed
Sch
oo
l #3,
Sch
oo
l sto
re
Pac
kage
size
Num
b-er
1P
rice
FM
NV
&
FD
Ala
bel
crite
ri-a2
Mac
ron
utr
ien
tsM
icro
nu
trie
nts
Mea
n #
ser
vin
gs
per
pyr
amid
gro
up
Fat
& s
ug
ar
Mea
n am
ount
per
item
Per
cent
of
calo
ries
from
Vit A
(RE
)
Vit C
(mg)
Cal
ci-
um (mg)
Iron
(mg)
Gra
inV
eget
-ab
leF
ruit
Dai
ryM
eat3
Mea
n am
ount
per
item
Cal
ori-
es
Tot
alfa
t(g
)
Sat
ura-
ted
fat
(g)
Car
b-oh
ydr-
ate
(g)
Pro
tein
(g)
Cho
le-
ster
ol(m
g)
Sod
i-um (m
g)
Die
tary
fiber
(g)
Tot
alfa
t
Sat
ura-
ted
fat
Dis
cre-
tiona
ryF
at (g)
Add
edS
ugar
s(t
sp)
Sna
cks
Lays
Cla
ssic
pot
ato
chip
s...
......
......
....
1.0
oz5
0.50
15
29.
83.
115
.02.
0–
168.
41.
358
.118
.4–
8.8
6.8
0.5
–1.
0–
––
8.9
–
Ave
rag
e o
f al
l ite
ms
Unw
eigh
ted
......
......
...–
390.
67
158
4.2
1.1
31.2
1.7
0.7
119.
90.
619
.75.
125
.712
.428
.30.
90.
5–
––
–3.
73.
8W
eigh
ted
......
......
......
–79
90.
63
176
3.8
1.0
35.7
1.5
0.5
131.
50.
616
.34.
226
.136
.123
.61.
20.
5–
––
–3.
35.
6
–V
alue
is e
xact
ly z
ero.
naD
ata
are
not a
vaila
ble.
The
num
ber
sold
was
una
vaila
ble
for
som
e so
urce
s; n
umbe
r so
ld is
’na’
for
indi
vidu
al it
ems
with
in a
sou
rce
if in
form
atio
n w
as o
btai
ned
durin
g va
lidat
ion
but n
ot r
epor
ted
on th
e su
rvey
.1
’Num
ber’
colu
mn
cont
ains
the
num
ber
of in
divi
dual
item
s so
ld d
urin
g th
e ta
rget
wee
k. T
he ’N
umbe
r’ in
the
’All
item
s’ r
ow is
the
num
ber
of it
ems
(unw
eigh
ted)
or
the
tota
l num
ber
of s
ales
(w
eigh
ted)
.2
✘ in
dica
tes
food
s of
min
imum
nut
ritio
nal v
alue
(F
MN
V).
Foo
ds m
eetin
g F
DA
labe
ling
crite
ria a
re in
dica
ted
by: ➀
= c
alor
ie-f
ree;
➊ =
low
cal
orie
; ➁ =
cho
lest
erol
-fre
e; ➋
= lo
w c
hole
ster
ol; ➂
= s
odiu
m-f
ree;
➌ =
low
sod
ium
; ➃
= fa
t-fr
ee; ➍
= lo
w fa
t.3
Als
o in
clud
es le
gum
es, s
oybe
an p
rodu
cts,
nut
s, a
nd s
eeds
.S
ourc
e:C
afet
eria
Sur
vey
and
and
Inve
ntor
ies
of C
ompe
titiv
e F
oods
.
E-2
1

Tab
le E
.1—
Co
mp
etit
ive
Fo
od
an
d B
ever
age
Pro
du
cts
Ava
ilab
le D
uri
ng
th
e S
cho
ol D
ay, B
y S
cho
ol a
nd
So
urc
e —
Co
nti
nu
ed
Sch
oo
l #3,
Ven
din
g M
ach
ine
#14
Pac
kage
size
Num
b-er
1P
rice
FM
NV
&
FD
Ala
bel
crite
ri-a2
Mac
ron
utr
ien
tsM
icro
nu
trie
nts
Mea
n #
ser
vin
gs
per
pyr
amid
gro
up
Fat
& s
ug
ar
Mea
n am
ount
per
item
Per
cent
of
calo
ries
from
Vit A
(RE
)
Vit C
(mg)
Cal
ci-
um (mg)
Iron
(mg)
Gra
inV
eget
-ab
leF
ruit
Dai
ryM
eat3
Mea
n am
ount
per
item
Cal
ori-
es
Tot
alfa
t(g
)
Sat
ura-
ted
fat
(g)
Car
b-oh
ydr-
ate
(g)
Pro
tein
(g)
Cho
le-
ster
ol(m
g)
Sod
i-um (m
g)
Die
tary
fiber
(g)
Tot
alfa
t
Sat
ura-
ted
fat
Dis
cre-
tiona
ryF
at (g)
Add
edS
ugar
s(t
sp)
Bev
erag
esV
eryf
ine
App
le c
herr
ybe
rry
punc
h...
......
11.5
oz
90.
70➁
➌➃
167
––
42.3
––
78.1
0.4
––
3.6
105.
128
.40.
8–
–0.
2–
––
9.2
Ver
yfin
e F
ruit
punc
h[3
]....
......
......
......
..11
.5 o
z10
80.
70➁
➌➃
167
––
42.3
––
78.1
0.4
––
3.6
105.
128
.40.
8–
–0.
2–
––
9.2
Ver
yfin
e G
laci
alG
rape
Chi
llers
.....
11.5
oz
300.
70➁
➌➃
162
––
41.3
––
21.6
––
––
60.0
100.
00.
6–
–0.
2–
––
9.0
Ver
yfin
e O
rang
e ju
ice
(100
%)
......
......
....
11.5
oz
120.
70➁
➌➃
150
0.5
–35
.32.
1–
7.2
0.7
3.0
0.4
64.4
123.
128
.61.
6–
–1.
9–
––
–V
eryf
ine
Pin
eapp
leor
ange
drin
k...
.....
11.5
oz
360.
70➁
➌➃
180
––
42.4
4.7
–10
.80.
4–
–19
0.5
80.9
18.0
1.0
––
1.0
––
–4.
7V
eryf
ine
Str
awbe
rry
bana
na p
unch
.....
11.5
oz
360.
70➁
➌➃
167
––
42.3
––
78.1
0.4
––
3.6
105.
128
.40.
8–
–0.
2–
––
9.2
Ave
rag
e o
f al
l ite
ms
Unw
eigh
ted
......
......
...–
60.
70
165
––
41.0
1.1
–45
.60.
40.
5–
44.3
96.5
38.6
0.9
––
0.6
––
–6.
9W
eigh
ted
......
......
......
–23
10.
70
167
––
41.8
0.8
–56
.60.
30.
2–
35.4
96.4
36.1
0.8
––
0.4
––
–8.
0
–V
alue
is e
xact
ly z
ero.
naD
ata
are
not a
vaila
ble.
The
num
ber
sold
was
una
vaila
ble
for
som
e so
urce
s; n
umbe
r so
ld is
’na’
for
indi
vidu
al it
ems
with
in a
sou
rce
if in
form
atio
n w
as o
btai
ned
durin
g va
lidat
ion
but n
ot r
epor
ted
on th
e su
rvey
.1
’Num
ber’
colu
mn
cont
ains
the
num
ber
of in
divi
dual
item
s so
ld d
urin
g th
e ta
rget
wee
k. T
he ’N
umbe
r’ in
the
’All
item
s’ r
ow is
the
num
ber
of it
ems
(unw
eigh
ted)
or
the
tota
l num
ber
of s
ales
(w
eigh
ted)
.2
✘ in
dica
tes
food
s of
min
imum
nut
ritio
nal v
alue
(F
MN
V).
Foo
ds m
eetin
g F
DA
labe
ling
crite
ria a
re in
dica
ted
by: ➀
= c
alor
ie-f
ree;
➊ =
low
cal
orie
; ➁ =
cho
lest
erol
-fre
e; ➋
= lo
w c
hole
ster
ol; ➂
= s
odiu
m-f
ree;
➌ =
low
sod
ium
; ➃
= fa
t-fr
ee; ➍
= lo
w fa
t.3
Als
o in
clud
es le
gum
es, s
oybe
an p
rodu
cts,
nut
s, a
nd s
eeds
.4
Ven
ding
mac
hine
item
s oc
cupy
ing
mul
tiple
slo
ts a
re in
dica
ted
with
the
num
ber
of s
lots
sho
wn
in [
] fol
low
ing
the
prod
uct n
ame.
S
ourc
e:C
afet
eria
Sur
vey
and
and
Inve
ntor
ies
of C
ompe
titiv
e F
oods
.
E-2
2

Tab
le E
.1—
Co
mp
etit
ive
Fo
od
an
d B
ever
age
Pro
du
cts
Ava
ilab
le D
uri
ng
th
e S
cho
ol D
ay, B
y S
cho
ol a
nd
So
urc
e —
Co
nti
nu
ed
Sch
oo
l #3,
Ven
din
g M
ach
ine
#24,
7
Pac
kage
size
Num
b-er
1P
rice
FM
NV
&
FD
Ala
bel
crite
ri-a2
Mac
ron
utr
ien
tsM
icro
nu
trie
nts
Mea
n #
ser
vin
gs
per
pyr
amid
gro
up
Fat
& s
ug
ar
Mea
n am
ount
per
item
Per
cent
of
calo
ries
from
Vit A
(RE
)
Vit C
(mg)
Cal
ci-
um (mg)
Iron
(mg)
Gra
inV
eget
-ab
leF
ruit
Dai
ryM
eat3
Mea
n am
ount
per
item
Cal
ori-
es
Tot
alfa
t(g
)
Sat
ura-
ted
fat
(g)
Car
b-oh
ydr-
ate
(g)
Pro
tein
(g)
Cho
le-
ster
ol(m
g)
Sod
i-um (m
g)
Die
tary
fiber
(g)
Tot
alfa
t
Sat
ura-
ted
fat
Dis
cre-
tiona
ryF
at (g)
Add
edS
ugar
s(t
sp)
Bak
ed g
oods
/des
sert
Li’l
Deb
Hon
ey B
un[2
]....
......
......
......
..4.
0 oz
180.
75
430
17.3
3.3
64.2
5.7
60.0
399.
62.
236
.36.
982
.51.
868
.31.
52.
1–
0.1
––
15.2
9.0
Li’l
Deb
Oat
mea
lC
ream
Pie
......
.....
3.8
oz12
0.75
➋➌
524
23.9
4.9
73.4
5.2
9.6
129.
62.
141
.18.
410
.10.
178
.03.
22.
5–
––
–21
.410
.0Li
’l D
eb Z
ebra
Cak
e..
3.6
oz6
0.75
➋46
022
.05.
065
.23.
216
.322
0.0
0.4
43.0
9.8
5.1
0.1
45.9
1.3
1.6
––
––
10.0
10.7
Sna
cks
But
ter
popc
orn
......
....
1.0
oz12
0.60
14
38.
42.
314
.82.
92.
523
7.6
2.8
52.8
14.2
10.5
–23
.50.
51.
2–
––
–7.
2–
Che
ese
curls
......
......
.1.
0 oz
80.
60➁
157
9.8
1.9
15.3
2.2
1.1
297.
70.
355
.910
.79.
6–
16.4
0.7
1.1
––
––
8.7
–C
hees
e po
pcor
n...
....
1.0
oz17
0.60
14
38.
42.
314
.82.
92.
523
7.6
2.8
52.8
14.2
10.5
–23
.50.
51.
2–
––
–7.
2–
Cor
n ch
ips
......
......
....
1.4
oz6
0.60
➁21
013
.01.
822
.22.
6–
245.
61.
955
.87.
63.
5–
49.5
0.5
1.6
––
––
11.4
–N
acho
chi
ps [3
]...
......
1.0
oz10
0.60
➁14
27.
41.
417
.82.
0–
149.
71.
847
.19.
05.
7–
43.7
0.4
1.3
––
––
6.1
–S
alt &
Vin
egar
pot
ato
chip
s...
......
......
....
1.0
oz5
0.60
15
29.
83.
115
.02.
0–
168.
41.
358
.118
.4–
8.8
6.8
0.5
–1.
0–
––
8.9
–S
our
crea
m &
oni
onpo
tato
chi
ps [2
]...
1.0
oz24
0.60
15
29.
83.
115
.02.
0–
168.
41.
358
.118
.4–
8.8
6.8
0.5
–1.
0–
––
8.9
–
Ave
rag
e o
f al
l ite
ms
Unw
eigh
ted
......
......
...–
100.
65
251
13.0
2.9
31.8
3.1
9.2
225.
41.
750
.111
.813
.82.
036
.21.
01.
20.
2–
––
10.5
3.0
Wei
ghte
d...
......
......
...–
118
0.65
24
812
.62.
931
.63.
211
.723
0.5
1.8
49.8
12.3
17.8
2.5
35.5
1.0
1.2
0.2
––
–10
.62.
9
–V
alue
is e
xact
ly z
ero.
naD
ata
are
not a
vaila
ble.
The
num
ber
sold
was
una
vaila
ble
for
som
e so
urce
s; n
umbe
r so
ld is
’na’
for
indi
vidu
al it
ems
with
in a
sou
rce
if in
form
atio
n w
as o
btai
ned
durin
g va
lidat
ion
but n
ot r
epor
ted
on th
e su
rvey
.1
’Num
ber’
colu
mn
cont
ains
the
num
ber
of in
divi
dual
item
s so
ld d
urin
g th
e ta
rget
wee
k. T
he ’N
umbe
r’ in
the
’All
item
s’ r
ow is
the
num
ber
of it
ems
(unw
eigh
ted)
or
the
tota
l num
ber
of s
ales
(w
eigh
ted)
.2
✘ in
dica
tes
food
s of
min
imum
nut
ritio
nal v
alue
(F
MN
V).
Foo
ds m
eetin
g F
DA
labe
ling
crite
ria a
re in
dica
ted
by: ➀
= c
alor
ie-f
ree;
➊ =
low
cal
orie
; ➁ =
cho
lest
erol
-fre
e; ➋
= lo
w c
hole
ster
ol; ➂
= s
odiu
m-f
ree;
➌ =
low
sod
ium
; ➃
= fa
t-fr
ee; ➍
= lo
w fa
t.3
Als
o in
clud
es le
gum
es, s
oybe
an p
rodu
cts,
nut
s, a
nd s
eeds
.7
Ven
ding
mac
hine
had
six
em
pty
slot
s.4
Ven
ding
mac
hine
item
s oc
cupy
ing
mul
tiple
slo
ts a
re in
dica
ted
with
the
num
ber
of s
lots
sho
wn
in [
] fol
low
ing
the
prod
uct n
ame.
S
ourc
e:C
afet
eria
Sur
vey
and
and
Inve
ntor
ies
of C
ompe
titiv
e F
oods
.
E-2
3

Tab
le F
.1—
Co
mp
etit
ive
Fo
od
an
d B
ever
age
Pro
du
cts
Ava
ilab
le O
UT
SID
E t
he
Sch
oo
l Day
, By
Sch
oo
l an
d S
ou
rce
Sch
oo
l #3,
Ven
din
g M
ach
ine
#3 (
ou
tsid
e sc
ho
ol d
ay)
Pac
kage
size
Num
b-er
1P
rice
FM
NV
&
FD
Ala
bel
crite
ri-a2
Mac
ron
utr
ien
tsM
icro
nu
trie
nts
Mea
n #
ser
vin
gs
per
pyr
amid
gro
up
Fat
& s
ug
ar
Mea
n am
ount
per
item
Per
cent
of
calo
ries
from
Vit A
(RE
)
Vit C
(mg)
Cal
ci-
um (mg)
Iron
(mg)
Gra
inV
eget
-ab
leF
ruit
Dai
ryM
eat3
Mea
n am
ount
per
item
Cal
ori-
es
Tot
alfa
t(g
)
Sat
ura-
ted
fat
(g)
Car
b-oh
ydr-
ate
(g)
Pro
tein
(g)
Cho
le-
ster
ol(m
g)
Sod
i-um (m
g)
Die
tary
fiber
(g)
Tot
alfa
t
Sat
ura-
ted
fat
Dis
cre-
tiona
ryF
at (g)
Add
edS
ugar
s(t
sp)
Bev
erag
esG
ator
ade
Coo
l blu
era
spbe
rry
......
......
20.0
oz
na1.
00➁
➃15
0–
–37
.8–
–24
0.0
––
––
––
0.3
––
––
––
9.0
Gat
orad
e S
traw
berr
yki
wi.
......
......
......
...20
.0 o
zna
1.00
➁➃
150
––
37.8
––
240.
0–
––
––
–0.
3–
––
––
–9.
0G
ator
ade
Fie
rce
mel
on...
......
......
...20
.0 o
zna
1.00
➁➃
150
––
37.8
––
240.
0–
––
––
–0.
3–
––
––
–9.
0G
ator
ade
Rip
tide
rush
......
......
......
...20
.0 o
zna
1.00
➁➃
150
––
37.8
––
240.
0–
––
––
–0.
3–
––
––
–9.
0G
ator
ade
Hig
h tid
e...
20.0
oz
na1.
00➁
➃15
0–
–37
.8–
–24
0.0
––
––
––
0.3
––
––
––
9.0
Gat
orad
e F
ruit
punc
h20
.0 o
zna
1.00
➁➃
150
––
37.8
––
240.
0–
––
––
–0.
3–
––
––
–9.
0T
ropi
cana
Tw
iste
rap
ple
rasp
berr
y...
20.0
oz
na1.
25➁
➌➃
272
0.5
–71
.11.
0–
15.8
0.3
1.7
0.2
3.8
22.7
29.6
0.8
––
1.4
––
0.2
10.5
Tro
pica
na T
wis
ter
oran
ge s
traw
berr
y20
.0 o
zna
1.25
➁➌
➃25
00.
50.
162
.72.
0–
15.2
1.2
1.7
0.4
34.5
61.8
31.1
1.2
––
1.9
––
–5.
3
Ave
rag
e o
f al
l ite
ms
Unw
eigh
ted
......
......
...–
81.
06
178
0.1
–45
.10.
4–
183.
90.
20.
4–
4.8
10.6
7.6
0.5
––
0.4
––
–8.
7W
eigh
ted
......
......
......
–na
na
––
––
––
––
––
––
––
––
––
––
–
–V
alue
is e
xact
ly z
ero.
na
Dat
a ar
e no
t ava
ilabl
e.1
’Num
ber’
colu
mn
cont
ains
the
num
ber
of in
divi
dual
item
s so
ld d
urin
g th
e ta
rget
wee
k. T
he ’N
umbe
r’ in
the
’All
item
s’ r
ow is
the
num
ber
of it
ems
(unw
eigh
ted)
or
the
tota
l num
ber
of s
ales
(w
eigh
ted)
.2
✘ in
dica
tes
food
s of
min
imum
nut
ritio
nal v
alue
(F
MN
V).
Foo
ds m
eetin
g F
DA
labe
ling
crite
ria a
re in
dica
ted
by: ➀
= c
alor
ie-f
ree;
➊ =
low
cal
orie
; ➁ =
cho
lest
erol
-fre
e; ➋
= lo
w c
hole
ster
ol; ➂
= s
odiu
m-f
ree;
➌ =
low
sod
ium
; ➃
= fa
t-fr
ee; ➍
= lo
w fa
t.3
Als
o in
clud
es le
gum
es, s
oybe
an p
rodu
cts,
nut
s, a
nd s
eeds
.S
ourc
e:In
vent
orie
s of
Com
petit
ive
Foo
ds.
F-1

Tab
le F
.1—
Co
mp
etit
ive
Fo
od
an
d B
ever
age
Pro
du
cts
Ava
ilab
le O
UT
SID
E t
he
Sch
oo
l Day
, By
Sch
oo
l an
d S
ou
rce
— C
on
tin
ued
Sch
oo
l #3,
Ven
din
g M
ach
ine
#4 (
ou
tsid
e sc
ho
ol d
ay)
Pac
kage
size
Num
b-er
1P
rice
FM
NV
&
FD
Ala
bel
crite
ri-a2
Mac
ron
utr
ien
tsM
icro
nu
trie
nts
Mea
n #
ser
vin
gs
per
pyr
amid
gro
up
Fat
& s
ug
ar
Mea
n am
ount
per
item
Per
cent
of
calo
ries
from
Vit A
(RE
)
Vit C
(mg)
Cal
ci-
um (mg)
Iron
(mg)
Gra
inV
eget
-ab
leF
ruit
Dai
ryM
eat3
Mea
n am
ount
per
item
Cal
ori-
es
Tot
alfa
t(g
)
Sat
ura-
ted
fat
(g)
Car
b-oh
ydr-
ate
(g)
Pro
tein
(g)
Cho
le-
ster
ol(m
g)
Sod
i-um (m
g)
Die
tary
fiber
(g)
Tot
alfa
t
Sat
ura-
ted
fat
Dis
cre-
tiona
ryF
at (g)
Add
edS
ugar
s(t
sp)
Bev
erag
esA
quaf
ina
wat
er...
......
.20
.0 o
zna
1.00
✘➀
➁➌
➃–
––
––
–17
.8–
––
––
11.9
––
––
––
––
Fru
itWor
ks P
each
papa
ya...
......
......
.20
.0 o
zna
1.00
➁➍
306
0.6
–76
.21.
8–
175.
00.
61.
80.
234
8.0
150.
030
.00.
6–
–1.
5–
––
12.4
Fru
itWor
ksS
traw
berr
y m
elon
20.0
oz
na1.
00➁
➃27
20.
5–
71.1
1.0
–17
5.0
0.3
1.7
0.2
3.8
150.
029
.60.
8–
–1.
4–
–0.
210
.5F
ruitW
orks
Fru
itpu
nch
......
......
......
20.0
oz
na1.
00➁
➃29
0–
–73
.5–
–17
5.0
0.6
––
6.2
150.
049
.41.
3–
–0.
4–
––
16.0
Fru
itWor
ks P
ink
lem
onad
e...
......
...20
.0 o
zna
1.00
➁➃
327
0.4
–85
.00.
5–
175.
00.
71.
00.
118
.115
0.0
21.4
1.4
––
0.5
––
0.1
12.9
Fru
itWor
ks T
ange
rine
citr
us...
......
......
....
20.0
oz
na1.
00➁
➃32
00.
2–
81.1
1.0
–17
5.0
0.2
0.5
–1.
915
0.0
21.2
0.5
––
1.0
––
–16
.1
Ave
rag
e o
f al
l ite
ms
Unw
eigh
ted
......
......
...–
61.
00
253
0.3
–64
.50.
7–
148.
80.
40.
8–
63.0
125.
027
.30.
8–
–0.
8–
––
11.3
Wei
ghte
d...
......
......
...–
nana
–
––
––
––
––
––
––
––
––
––
––
–V
alue
is e
xact
ly z
ero.
na
Dat
a ar
e no
t ava
ilabl
e.1
’Num
ber’
colu
mn
cont
ains
the
num
ber
of in
divi
dual
item
s so
ld d
urin
g th
e ta
rget
wee
k. T
he ’N
umbe
r’ in
the
’All
item
s’ r
ow is
the
num
ber
of it
ems
(unw
eigh
ted)
or
the
tota
l num
ber
of s
ales
(w
eigh
ted)
.2
✘ in
dica
tes
food
s of
min
imum
nut
ritio
nal v
alue
(F
MN
V).
Foo
ds m
eetin
g F
DA
labe
ling
crite
ria a
re in
dica
ted
by: ➀
= c
alor
ie-f
ree;
➊ =
low
cal
orie
; ➁ =
cho
lest
erol
-fre
e; ➋
= lo
w c
hole
ster
ol; ➂
= s
odiu
m-f
ree;
➌ =
low
sod
ium
; ➃
= fa
t-fr
ee; ➍
= lo
w fa
t.3
Als
o in
clud
es le
gum
es, s
oybe
an p
rodu
cts,
nut
s, a
nd s
eeds
.S
ourc
e:In
vent
orie
s of
Com
petit
ive
Foo
ds.
F-2
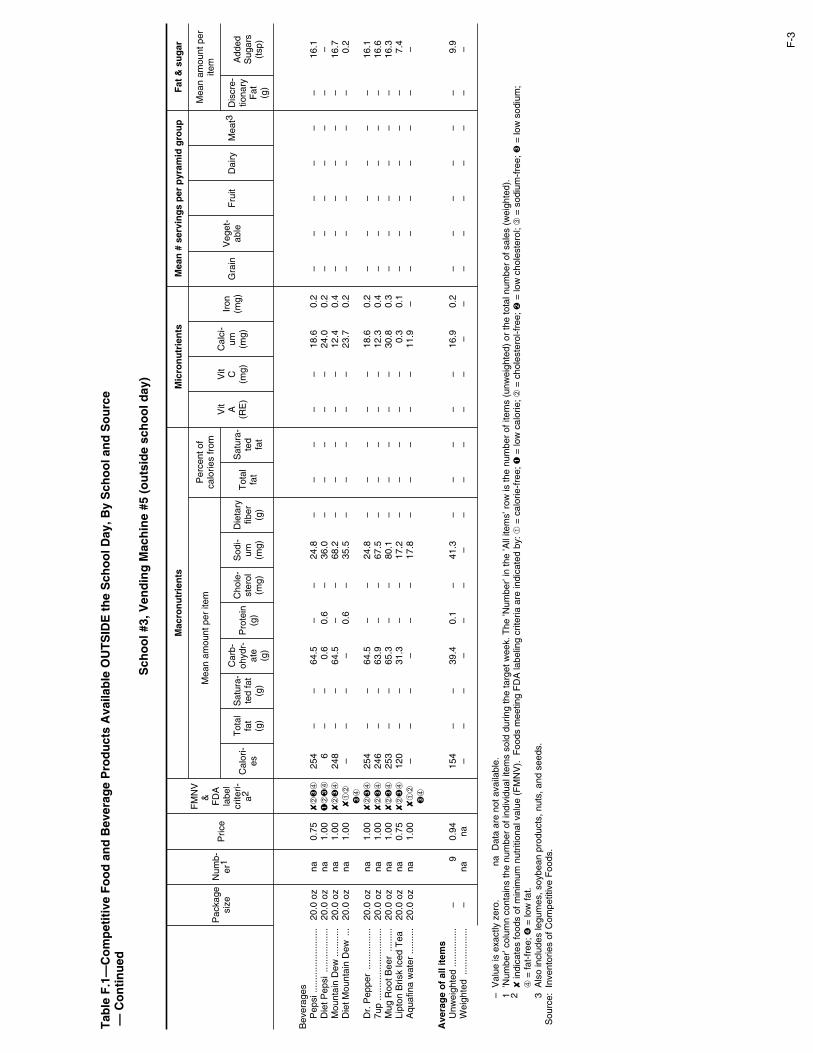
Tab
le F
.1—
Co
mp
etit
ive
Fo
od
an
d B
ever
age
Pro
du
cts
Ava
ilab
le O
UT
SID
E t
he
Sch
oo
l Day
, By
Sch
oo
l an
d S
ou
rce
— C
on
tin
ued
Sch
oo
l #3,
Ven
din
g M
ach
ine
#5 (
ou
tsid
e sc
ho
ol d
ay)
Pac
kage
size
Num
b-er
1P
rice
FM
NV
&
FD
Ala
bel
crite
ri-a2
Mac
ron
utr
ien
tsM
icro
nu
trie
nts
Mea
n #
ser
vin
gs
per
pyr
amid
gro
up
Fat
& s
ug
ar
Mea
n am
ount
per
item
Per
cent
of
calo
ries
from
Vit A
(RE
)
Vit C
(mg)
Cal
ci-
um (mg)
Iron
(mg)
Gra
inV
eget
-ab
leF
ruit
Dai
ryM
eat3
Mea
n am
ount
per
item
Cal
ori-
es
Tot
alfa
t(g
)
Sat
ura-
ted
fat
(g)
Car
b-oh
ydr-
ate
(g)
Pro
tein
(g)
Cho
le-
ster
ol(m
g)
Sod
i-um (m
g)
Die
tary
fiber
(g)
Tot
alfa
t
Sat
ura-
ted
fat
Dis
cre-
tiona
ryF
at (g)
Add
edS
ugar
s(t
sp)
Bev
erag
esP
epsi
......
......
......
......
.20
.0 o
zna
0.75
✘➁
➌➃
254
––
64.5
––
24.8
––
––
–18
.60.
2–
––
––
–16
.1D
iet P
epsi
......
......
.....
20.0
oz
na1.
00➊
➁➌
➃6
––
0.6
0.6
–36
.0–
––
––
24.0
0.2
––
––
––
–M
ount
ain
Dew
......
.....
20.0
oz
na1.
00✘
➁➌
➃24
8–
–64
.5–
–68
.2–
––
––
12.4
0.4
––
––
––
16.7
Die
t Mou
ntai
n D
ew...
20.0
oz
na1.
00✘
➀➁
➌➃
––
––
0.6
–35
.5–
––
––
23.7
0.2
––
––
––
0.2
Dr.
Pep
per
......
......
....
20.0
oz
na1.
00✘
➁➌
➃25
4–
–64
.5–
–24
.8–
––
––
18.6
0.2
––
––
––
16.1
7up
......
......
......
......
....
20.0
oz
na1.
00✘
➁➌
➃24
6–
–63
.9–
–67
.5–
––
––
12.3
0.4
––
––
––
16.6
Mug
Roo
t Bee
r...
......
20.0
oz
na1.
00✘
➁➌
➃25
3–
–65
.3–
–80
.1–
––
––
30.8
0.3
––
––
––
16.3
Lipt
on B
risk
Iced
Tea
20.0
oz
na0.
75✘
➁➌
➃12
0–
–31
.3–
–17
.2–
––
––
0.3
0.1
––
––
––
7.4
Aqu
afin
a w
ater
......
....
20.0
oz
na1.
00✘
➀➁
➌➃
––
––
––
17.8
––
––
–11
.9–
––
––
––
–
Ave
rag
e o
f al
l ite
ms
Unw
eigh
ted
......
......
...–
90.
94
154
––
39.4
0.1
–41
.3–
––
––
16.9
0.2
––
––
––
9.9
Wei
ghte
d...
......
......
...–
nana
–
––
––
––
––
––
––
––
––
––
––
–V
alue
is e
xact
ly z
ero.
na
Dat
a ar
e no
t ava
ilabl
e.1
’Num
ber’
colu
mn
cont
ains
the
num
ber
of in
divi
dual
item
s so
ld d
urin
g th
e ta
rget
wee
k. T
he ’N
umbe
r’ in
the
’All
item
s’ r
ow is
the
num
ber
of it
ems
(unw
eigh
ted)
or
the
tota
l num
ber
of s
ales
(w
eigh
ted)
.2
✘ in
dica
tes
food
s of
min
imum
nut
ritio
nal v
alue
(F
MN
V).
Foo
ds m
eetin
g F
DA
labe
ling
crite
ria a
re in
dica
ted
by: ➀
= c
alor
ie-f
ree;
➊ =
low
cal
orie
; ➁ =
cho
lest
erol
-fre
e; ➋
= lo
w c
hole
ster
ol; ➂
= s
odiu
m-f
ree;
➌ =
low
sod
ium
; ➃
= fa
t-fr
ee; ➍
= lo
w fa
t.3
Als
o in
clud
es le
gum
es, s
oybe
an p
rodu
cts,
nut
s, a
nd s
eeds
.S
ourc
e:In
vent
orie
s of
Com
petit
ive
Foo
ds.
F-3

Tab
le F
.1—
Co
mp
etit
ive
Fo
od
an
d B
ever
age
Pro
du
cts
Ava
ilab
le O
UT
SID
E t
he
Sch
oo
l Day
, By
Sch
oo
l an
d S
ou
rce
— C
on
tin
ued
Sch
oo
l #3,
Ven
din
g M
ach
ine
#6 (
ou
tsid
e sc
ho
ol d
ay)
Pac
kage
size
Num
b-er
1P
rice
FM
NV
&
FD
Ala
bel
crite
ri-a2
Mac
ron
utr
ien
tsM
icro
nu
trie
nts
Mea
n #
ser
vin
gs
per
pyr
amid
gro
up
Fat
& s
ug
ar
Mea
n am
ount
per
item
Per
cent
of
calo
ries
from
Vit A
(RE
)
Vit C
(mg)
Cal
ci-
um (mg)
Iron
(mg)
Gra
inV
eget
-ab
leF
ruit
Dai
ryM
eat3
Mea
n am
ount
per
item
Cal
ori-
es
Tot
alfa
t(g
)
Sat
ura-
ted
fat
(g)
Car
b-oh
ydr-
ate
(g)
Pro
tein
(g)
Cho
le-
ster
ol(m
g)
Sod
i-um (m
g)
Die
tary
fiber
(g)
Tot
alfa
t
Sat
ura-
ted
fat
Dis
cre-
tiona
ryF
at (g)
Add
edS
ugar
s(t
sp)
Bev
erag
esP
epsi
......
......
......
......
.20
.0 o
zna
1.00
✘➁
➌➃
254
––
64.5
––
24.8
––
––
–18
.60.
2–
––
––
–16
.1P
epsi
Blu
e...
......
......
.20
.0 o
zna
1.00
✘➁
➌➃
248
––
64.5
––
68.2
––
––
–12
.40.
4–
––
––
–16
.7M
ount
ain
Dew
......
.....
20.0
oz
na1.
00✘
➁➌
➃24
8–
–64
.5–
–68
.2–
––
––
12.4
0.4
––
––
––
16.7
7up
......
......
......
......
....
20.0
oz
na1.
00✘
➁➌
➃24
6–
–63
.9–
–67
.5–
––
––
12.3
0.4
––
––
––
16.6
Lipt
on B
risk
Iced
Tea
20.0
oz
na1.
00✘
➁➌
➃12
0–
–31
.3–
–17
.2–
––
––
0.3
0.1
––
––
––
7.4
Die
t Pep
si...
......
......
..20
.0 o
zna
1.00
➊➁
➌➃
6–
–0.
60.
6–
36.0
––
––
–24
.00.
2–
––
––
––
Dr.
Pep
per
......
......
....
20.0
oz
na1.
00✘
➁➌
➃24
8–
–64
.5–
–68
.2–
––
––
12.4
0.4
––
––
––
16.7
Aqu
afin
a w
ater
......
....
20.0
oz
na1.
00✘
➀➁
➌➃
––
––
––
17.8
––
––
–11
.9–
––
––
––
–
Ave
rag
e o
f al
l ite
ms
Unw
eigh
ted
......
......
...–
81.
00
171
––
44.2
––
46.0
––
––
–13
.00.
3–
––
––
–11
.3W
eigh
ted
......
......
......
–na
na
––
––
––
––
––
––
––
––
––
––
–
–V
alue
is e
xact
ly z
ero.
na
Dat
a ar
e no
t ava
ilabl
e.1
’Num
ber’
colu
mn
cont
ains
the
num
ber
of in
divi
dual
item
s so
ld d
urin
g th
e ta
rget
wee
k. T
he ’N
umbe
r’ in
the
’All
item
s’ r
ow is
the
num
ber
of it
ems
(unw
eigh
ted)
or
the
tota
l num
ber
of s
ales
(w
eigh
ted)
.2
✘ in
dica
tes
food
s of
min
imum
nut
ritio
nal v
alue
(F
MN
V).
Foo
ds m
eetin
g F
DA
labe
ling
crite
ria a
re in
dica
ted
by: ➀
= c
alor
ie-f
ree;
➊ =
low
cal
orie
; ➁ =
cho
lest
erol
-fre
e; ➋
= lo
w c
hole
ster
ol; ➂
= s
odiu
m-f
ree;
➌ =
low
sod
ium
; ➃
= fa
t-fr
ee; ➍
= lo
w fa
t.3
Als
o in
clud
es le
gum
es, s
oybe
an p
rodu
cts,
nut
s, a
nd s
eeds
.S
ourc
e:In
vent
orie
s of
Com
petit
ive
Foo
ds.
F-4

Tab
le F
.1—
Co
mp
etit
ive
Fo
od
an
d B
ever
age
Pro
du
cts
Ava
ilab
le O
UT
SID
E t
he
Sch
oo
l Day
, By
Sch
oo
l an
d S
ou
rce
— C
on
tin
ued
Sch
oo
l #3,
Ven
din
g M
ach
ine
#7 (
ou
tsid
e sc
ho
ol d
ay)
Pac
kage
size
Num
b-er
1P
rice
FM
NV
&
FD
Ala
bel
crite
ri-a2
Mac
ron
utr
ien
tsM
icro
nu
trie
nts
Mea
n #
ser
vin
gs
per
pyr
amid
gro
up
Fat
& s
ug
ar
Mea
n am
ount
per
item
Per
cent
of
calo
ries
from
Vit A
(RE
)
Vit C
(mg)
Cal
ci-
um (mg)
Iron
(mg)
Gra
inV
eget
-ab
leF
ruit
Dai
ryM
eat3
Mea
n am
ount
per
item
Cal
ori-
es
Tot
alfa
t(g
)
Sat
ura-
ted
fat
(g)
Car
b-oh
ydr-
ate
(g)
Pro
tein
(g)
Cho
le-
ster
ol(m
g)
Sod
i-um (m
g)
Die
tary
fiber
(g)
Tot
alfa
t
Sat
ura-
ted
fat
Dis
cre-
tiona
ryF
at (g)
Add
edS
ugar
s(t
sp)
Bev
erag
esP
epsi
......
......
......
......
.12
.0 o
zna
0.75
✘➁
➌➃
152
––
38.7
––
14.9
––
––
–11
.20.
1–
––
––
–9.
7Li
pton
Bris
k Ic
ed T
ea12
.0 o
zna
0.75
✘➁
➌➃
72–
–18
.8–
–10
.3–
–0.
1–
–0.
2–
––
––
––
4.4
Cou
ntry
Tim
ele
mon
ade
......
......
12.0
oz
na0.
75➁
➌➃
196
0.2
–51
.00.
3–
12.2
0.4
1.0
0.1
10.8
19.2
12.9
0.8
––
0.3
––
–7.
8S
lice
Ora
nge
......
......
.12
.0 o
zna
0.75
✘➁
➌➃
147
––
38.3
––
40.5
––
––
–7.
40.
3–
––
––
–9.
97u
p...
......
......
......
......
.12
.0 o
zna
0.75
✘➁
➌➃
147
––
38.3
––
40.5
––
––
–7.
40.
3–
––
––
–9.
9D
r. P
eppe
r...
......
......
.12
.0 o
zna
0.75
✘➁
➌➃
152
––
38.7
––
14.9
––
––
–11
.20.
1–
––
––
–9.
7D
iet P
epsi
......
......
.....
12.0
oz
na0.
75✘
➀➁
➌➃
4–
–0.
40.
4–
21.6
––
––
–14
.40.
1–
––
––
––
Ave
rag
e o
f al
l ite
ms
Unw
eigh
ted
......
......
...–
70.
75
124
––
32.0
––
22.1
–0.
1–
1.5
2.7
9.2
0.2
––
––
––
7.4
Wei
ghte
d...
......
......
...–
nana
–
––
––
––
––
––
––
––
––
––
––
–V
alue
is e
xact
ly z
ero.
na
Dat
a ar
e no
t ava
ilabl
e.1
’Num
ber’
colu
mn
cont
ains
the
num
ber
of in
divi
dual
item
s so
ld d
urin
g th
e ta
rget
wee
k. T
he ’N
umbe
r’ in
the
’All
item
s’ r
ow is
the
num
ber
of it
ems
(unw
eigh
ted)
or
the
tota
l num
ber
of s
ales
(w
eigh
ted)
.2
✘ in
dica
tes
food
s of
min
imum
nut
ritio
nal v
alue
(F
MN
V).
Foo
ds m
eetin
g F
DA
labe
ling
crite
ria a
re in
dica
ted
by: ➀
= c
alor
ie-f
ree;
➊ =
low
cal
orie
; ➁ =
cho
lest
erol
-fre
e; ➋
= lo
w c
hole
ster
ol; ➂
= s
odiu
m-f
ree;
➌ =
low
sod
ium
; ➃
= fa
t-fr
ee; ➍
= lo
w fa
t.3
Als
o in
clud
es le
gum
es, s
oybe
an p
rodu
cts,
nut
s, a
nd s
eeds
.S
ourc
e:In
vent
orie
s of
Com
petit
ive
Foo
ds.
F-5

Tab
le F
.1—
Co
mp
etit
ive
Fo
od
an
d B
ever
age
Pro
du
cts
Ava
ilab
le O
UT
SID
E t
he
Sch
oo
l Day
, By
Sch
oo
l an
d S
ou
rce
— C
on
tin
ued
Sch
oo
l #3,
Ven
din
g M
ach
ine
#8 (
ou
tsid
e sc
ho
ol d
ay)4
Pac
kage
size
Num
b-er
1P
rice
FM
NV
&
FD
Ala
bel
crite
ri-a2
Mac
ron
utr
ien
tsM
icro
nu
trie
nts
Mea
n #
ser
vin
gs
per
pyr
amid
gro
up
Fat
& s
ug
ar
Mea
n am
ount
per
item
Per
cent
of
calo
ries
from
Vit A
(RE
)
Vit C
(mg)
Cal
ci-
um (mg)
Iron
(mg)
Gra
inV
eget
-ab
leF
ruit
Dai
ryM
eat3
Mea
n am
ount
per
item
Cal
ori-
es
Tot
alfa
t(g
)
Sat
ura-
ted
fat
(g)
Car
b-oh
ydr-
ate
(g)
Pro
tein
(g)
Cho
le-
ster
ol(m
g)
Sod
i-um (m
g)
Die
tary
fiber
(g)
Tot
alfa
t
Sat
ura-
ted
fat
Dis
cre-
tiona
ryF
at (g)
Add
edS
ugar
s(t
sp)
Bak
ed g
oods
/des
sert
Fam
. Am
os O
atm
eal
rais
in c
ooki
es...
...2.
0 oz
na0.
55➁
255
10.3
2.6
39.0
3.5
–21
7.2
1.6
36.2
9.0
1.1
0.2
21.0
1.5
1.3
–0.
2–
–8.
94.
2V
anill
a fla
vore
dw
afer
s...
......
......
..2.
1 oz
na0.
75➁
➌30
814
.62.
242
.22.
5–
88.6
0.4
42.8
6.4
––
10.8
1.2
1.6
––
––
13.0
6.1
Kno
tt’s
Ras
pber
rysh
ortb
read
cook
ies
......
......
...2.
0 oz
na0.
75
270
12.3
3.8
37.2
3.1
27.8
236.
30.
540
.912
.862
.2–
30.2
1.2
1.6
––
––
10.6
4.1
Ore
o co
okie
s...
......
...2.
0 oz
na0.
75➁
268
11.7
2.1
39.9
2.7
–34
2.5
1.8
39.3
7.0
––
14.7
2.2
1.2
––
––
10.4
5.7
App
le d
anis
h...
......
....
4.0
ozna
0.75
42
121
.05.
554
.26.
123
.840
1.4
2.2
44.9
11.8
18.1
4.4
52.2
2.0
2.3
–0.
5–
–18
.77.
1H
oste
ss F
ruit
pie,
cher
ry...
......
......
...4.
5 oz
nana
➋30
214
.52.
941
.33.
1–
285.
51.
843
.18.
623
.41.
412
.61.
41.
6–
0.5
––
12.8
3.2
Sna
ckw
ell’s
van
illa
crem
e sa
ndw
ich
..1.
7 oz
na0.
75➁
197
3.0
0.5
39.8
3.2
0.5
152.
10.
613
.52.
10.
20.
273
.41.
11.
4–
––
–1.
65.
3
Bre
ad/g
rain
pro
duct
sB
utte
r sn
ap p
retz
els
..1.
5 oz
nana
➁➍
162
1.5
0.3
33.7
3.9
–72
9.3
1.4
8.3
1.8
––
15.3
1.8
2.6
––
––
––
Sou
rdou
gh p
retz
els
..1.
5 oz
na0.
55➁
➍16
21.
50.
333
.73.
9–
729.
31.
48.
31.
8–
–15
.31.
82.
6–
––
––
–C
hees
e-it
crac
kers
,w
hite
che
ddar
.....
1.5
ozna
0.55
21
410
.84.
024
.84.
35.
542
3.1
1.0
45.3
16.8
12.8
–64
.22.
02.
0–
––
–8.
8–
Che
x M
orni
ng M
ix...
..1.
2 oz
na0.
75➁
140
4.4
1.0
22.5
3.8
0.8
303.
61.
828
.06.
44.
58.
820
.55.
31.
1–
––
–3.
30.
5C
hees
e cr
acke
rs w
/pe
anut
but
ter
......
1.3
ozna
0.65
➁17
58.
71.
920
.04.
50.
732
3.9
0.4
44.7
9.9
–0.
135
.11.
00.
6–
––
0.3
8.1
2.6
Can
dyN
estle
But
terf
inge
r...
.2.
3 oz
na0.
65➋
➌31
412
.26.
842
.98.
20.
712
9.7
1.6
35.0
19.4
––
17.7
0.5
0.1
––
–0.
312
.18.
2R
eese
’s P
eanu
tbu
tter
cup
......
......
1.5
ozna
0.65
➋➌
230
13.3
4.7
23.2
4.4
2.1
134.
81.
452
.118
.58.
1–
33.2
0.5
––
––
0.4
12.7
4.1
Sni
cker
s C
runc
her
....
1.6
ozna
na➋
➌21
210
.94.
026
.23.
55.
811
7.6
1.1
46.2
16.9
17.3
0.3
41.6
0.3
––
––
0.2
8.4
5.7
M&
M’s
Pea
nut
......
....
1.7
ozna
0.65
➋➌
254
12.9
5.1
29.8
4.7
4.4
23.7
1.7
45.8
18.0
11.8
0.3
49.8
0.6
––
–0.
20.
316
.94.
4S
nick
ers
......
......
......
..2.
0 oz
na0.
65➋
272
13.9
5.1
33.6
4.5
7.4
150.
81.
446
.216
.922
.10.
353
.30.
4–
––
0.1
0.2
10.8
7.3
Who
pper
s m
ilk b
alls
1.8
ozna
0.65
➋➌
246
13.2
7.9
31.5
3.1
9.4
71.9
1.3
48.1
28.8
5.0
0.2
84.8
0.4
0.3
––
0.2
–13
.15.
1N
estle
Cru
nch
with
Car
amel
......
......
..1.
5 oz
nana
➋➌
214
11.4
6.9
27.3
2.7
8.2
62.5
1.1
48.1
28.8
4.3
0.1
73.7
0.3
0.2
––
0.2
–11
.44.
4A
lmon
d Jo
y...
......
......
45.0
gna
0.65
➋➌
215
11.3
9.1
26.5
1.7
0.9
67.1
2.7
47.4
38.3
0.5
0.2
6.8
1.0
––
––
0.2
7.7
6.8
–V
alue
is e
xact
ly z
ero.
na
Dat
a ar
e no
t ava
ilabl
e.1
’Num
ber’
colu
mn
cont
ains
the
num
ber
of in
divi
dual
item
s so
ld d
urin
g th
e ta
rget
wee
k. T
he ’N
umbe
r’ in
the
’All
item
s’ r
ow is
the
num
ber
of it
ems
(unw
eigh
ted)
or
the
tota
l num
ber
of s
ales
(w
eigh
ted)
.2
✘ in
dica
tes
food
s of
min
imum
nut
ritio
nal v
alue
(F
MN
V).
Foo
ds m
eetin
g F
DA
labe
ling
crite
ria a
re in
dica
ted
by: ➀
= c
alor
ie-f
ree;
➊ =
low
cal
orie
; ➁ =
cho
lest
erol
-fre
e; ➋
= lo
w c
hole
ster
ol; ➂
= s
odiu
m-f
ree;
➌ =
low
sod
ium
; ➃
= fa
t-fr
ee; ➍
= lo
w fa
t.3
Als
o in
clud
es le
gum
es, s
oybe
an p
rodu
cts,
nut
s, a
nd s
eeds
.4
Ven
ding
mac
hine
item
s oc
cupy
ing
mul
tiple
slo
ts a
re in
dica
ted
with
the
num
ber
of s
lots
sho
wn
in [
] fol
low
ing
the
prod
uct n
ame.
S
ourc
e:In
vent
orie
s of
Com
petit
ive
Foo
ds.
F-6

Tab
le F
.1—
Co
mp
etit
ive
Fo
od
an
d B
ever
age
Pro
du
cts
Ava
ilab
le O
UT
SID
E t
he
Sch
oo
l Day
, By
Sch
oo
l an
d S
ou
rce
— C
on
tin
ued
Sch
oo
l #3,
Ven
din
g M
ach
ine
#8 (
ou
tsid
e sc
ho
ol d
ay)4
Pac
kage
size
Num
b-er
1P
rice
FM
NV
&
FD
Ala
bel
crite
ri-a2
Mac
ron
utr
ien
tsM
icro
nu
trie
nts
Mea
n #
ser
vin
gs
per
pyr
amid
gro
up
Fat
& s
ug
ar
Mea
n am
ount
per
item
Per
cent
of
calo
ries
from
Vit A
(RE
)
Vit C
(mg)
Cal
ci-
um (mg)
Iron
(mg)
Gra
inV
eget
-ab
leF
ruit
Dai
ryM
eat3
Mea
n am
ount
per
item
Cal
ori-
es
Tot
alfa
t(g
)
Sat
ura-
ted
fat
(g)
Car
b-oh
ydr-
ate
(g)
Pro
tein
(g)
Cho
le-
ster
ol(m
g)
Sod
i-um (m
g)
Die
tary
fiber
(g)
Tot
alfa
t
Sat
ura-
ted
fat
Dis
cre-
tiona
ryF
at (g)
Add
edS
ugar
s(t
sp)
Can
dyH
ersh
ey’s
Cho
c ba
rw
/ alm
onds
......
...1.
5 oz
na0.
65➋
➌21
614
.17.
021
.93.
77.
830
.42.
658
.929
.15.
8–
92.1
0.7
––
–0.
20.
113
.84.
2C
aref
ree
Spe
arm
int
gum
......
......
......
...6.
0 st
kna
0.55
✘➁
➂➃
32–
–11
.4–
–0.
8–
1.4
0.3
––
2.4
––
––
––
––
Iceb
reak
er’s
Coo
lm
int g
um...
......
....
6.0
stk
na0.
55✘
➁➂
➃32
––
11.4
––
0.8
–1.
40.
3–
–2.
4–
––
––
––
–C
inna
burs
t gum
......
..7.
0 st
kna
0.55
✘➁
➂➃
96–
–27
.1–
–1.
7–
0.8
––
––
––
––
––
–5.
0Li
fesa
ver’s
trop
ical
frui
t....
......
......
......
0.9
ozna
0.55
✘➁
➌➃
95–
–25
.1–
–9.
7–
––
––
0.8
––
––
––
–5.
9Li
fesa
ver’s
pepp
erm
int.
......
...0.
7 oz
na0.
55✘
➁➌
➃76
––
20.0
––
7.8
––
––
–0.
6–
––
––
––
4.8
Sna
cks
Frit
os c
orn
chip
s...
....
1.3
ozna
0.55
➁19
111
.81.
620
.22.
3–
223.
31.
755
.87.
63.
2–
45.0
0.5
1.5
––
––
10.3
–La
y’s
Chi
cago
Ste
akH
ouse
pot
ato
chip
s...
......
......
....
1.0
ozna
0.55
15
29.
83.
115
.02.
0–
168.
41.
358
.118
.4–
8.8
6.8
0.5
–1.
0–
––
8.9
–La
y’s
Cla
ssic
pot
ato
chip
s, ja
lape
no...
.1.
0 oz
na0.
55
152
9.8
3.1
15.0
2.0
–16
8.4
1.3
58.1
18.4
–8.
86.
80.
5–
1.0
––
–8.
9–
Ket
tle C
ooke
dK
runc
hers
......
.....
1.0
ozna
0.55
15
29.
83.
115
.02.
0–
168.
41.
358
.118
.4–
8.8
6.8
0.5
–1.
0–
––
8.9
–C
heez
Doo
dles
, whi
tech
edda
r...
......
......
0.7
ozna
0.55
✘➁
107
6.6
1.3
10.4
1.5
0.8
202.
40.
255
.910
.76.
6–
11.2
0.5
0.7
––
––
5.9
–P
otat
o S
tix...
......
......
.1.
0 oz
na0.
55➌
148
9.8
2.5
15.1
1.9
–70
.91.
059
.315
.3–
13.4
5.1
0.6
–1.
0–
––
9.0
–La
y’s
Sal
t and
Vin
egar
pot
ato
chip
s...
......
......
....
1.0
ozna
0.55
15
29.
83.
115
.02.
0–
168.
41.
358
.118
.4–
8.8
6.8
0.5
–1.
0–
––
8.9
–C
otta
ge F
ries
Orig
inal
pota
to c
hips
......
..0.
9 oz
na0.
55
133
8.6
2.7
13.1
1.7
–14
7.4
1.1
58.1
18.4
–7.
76.
00.
4–
0.9
––
–7.
8–
Sal
t and
Pep
per
pota
to c
hips
......
..1.
0 oz
na0.
55
152
9.8
3.1
15.0
2.0
–16
8.4
1.3
58.1
18.4
–8.
86.
80.
5–
1.0
––
–8.
9–
Rid
ges
Sou
r C
ream
and
Oni
on c
hips
..1.
0 oz
na0.
55
152
9.8
3.1
15.0
2.0
–16
8.4
1.3
58.1
18.4
–8.
86.
80.
5–
1.0
––
–8.
9–
–V
alue
is e
xact
ly z
ero.
na
Dat
a ar
e no
t ava
ilabl
e.1
’Num
ber’
colu
mn
cont
ains
the
num
ber
of in
divi
dual
item
s so
ld d
urin
g th
e ta
rget
wee
k. T
he ’N
umbe
r’ in
the
’All
item
s’ r
ow is
the
num
ber
of it
ems
(unw
eigh
ted)
or
the
tota
l num
ber
of s
ales
(w
eigh
ted)
.2
✘ in
dica
tes
food
s of
min
imum
nut
ritio
nal v
alue
(F
MN
V).
Foo
ds m
eetin
g F
DA
labe
ling
crite
ria a
re in
dica
ted
by: ➀
= c
alor
ie-f
ree;
➊ =
low
cal
orie
; ➁ =
cho
lest
erol
-fre
e; ➋
= lo
w c
hole
ster
ol; ➂
= s
odiu
m-f
ree;
➌ =
low
sod
ium
; ➃
= fa
t-fr
ee; ➍
= lo
w fa
t.3
Als
o in
clud
es le
gum
es, s
oybe
an p
rodu
cts,
nut
s, a
nd s
eeds
.4
Ven
ding
mac
hine
item
s oc
cupy
ing
mul
tiple
slo
ts a
re in
dica
ted
with
the
num
ber
of s
lots
sho
wn
in [
] fol
low
ing
the
prod
uct n
ame.
S
ourc
e:In
vent
orie
s of
Com
petit
ive
Foo
ds.
F-7

Tab
le F
.1—
Co
mp
etit
ive
Fo
od
an
d B
ever
age
Pro
du
cts
Ava
ilab
le O
UT
SID
E t
he
Sch
oo
l Day
, By
Sch
oo
l an
d S
ou
rce
— C
on
tin
ued
Sch
oo
l #3,
Ven
din
g M
ach
ine
#8 (
ou
tsid
e sc
ho
ol d
ay)4
Pac
kage
size
Num
b-er
1P
rice
FM
NV
&
FD
Ala
bel
crite
ri-a2
Mac
ron
utr
ien
tsM
icro
nu
trie
nts
Mea
n #
ser
vin
gs
per
pyr
amid
gro
up
Fat
& s
ug
ar
Mea
n am
ount
per
item
Per
cent
of
calo
ries
from
Vit A
(RE
)
Vit C
(mg)
Cal
ci-
um (mg)
Iron
(mg)
Gra
inV
eget
-ab
leF
ruit
Dai
ryM
eat3
Mea
n am
ount
per
item
Cal
ori-
es
Tot
alfa
t(g
)
Sat
ura-
ted
fat
(g)
Car
b-oh
ydr-
ate
(g)
Pro
tein
(g)
Cho
le-
ster
ol(m
g)
Sod
i-um (m
g)
Die
tary
fiber
(g)
Tot
alfa
t
Sat
ura-
ted
fat
Dis
cre-
tiona
ryF
at (g)
Add
edS
ugar
s(t
sp)
Sna
cks
Che
etos
Cru
nchy
......
1.5
ozna
0.75
➁23
614
.62.
822
.93.
21.
744
6.5
0.5
55.9
10.7
14.5
–24
.71.
01.
6–
––
–13
.0–
Tra
il m
ix u
nsal
ted
[2]
2.3
ozna
0.75
➁➌
320
22.8
2.9
25.1
10.0
–5.
64.
364
.08.
10.
81.
054
.81.
8–
–0.
5–
1.1
19.8
–
Ave
rag
e o
f al
l ite
ms
Unw
eigh
ted
......
......
...–
380.
62
195
9.5
3.1
25.9
3.0
2.8
188.
11.
240
.112
.95.
82.
426
.60.
90.
60.
2–
––
8.5
2.8
Wei
ghte
d...
......
......
...–
nana
–
––
––
––
––
––
––
––
––
––
––
–V
alue
is e
xact
ly z
ero.
na
Dat
a ar
e no
t ava
ilabl
e.1
’Num
ber’
colu
mn
cont
ains
the
num
ber
of in
divi
dual
item
s so
ld d
urin
g th
e ta
rget
wee
k. T
he ’N
umbe
r’ in
the
’All
item
s’ r
ow is
the
num
ber
of it
ems
(unw
eigh
ted)
or
the
tota
l num
ber
of s
ales
(w
eigh
ted)
.2
✘ in
dica
tes
food
s of
min
imum
nut
ritio
nal v
alue
(F
MN
V).
Foo
ds m
eetin
g F
DA
labe
ling
crite
ria a
re in
dica
ted
by: ➀
= c
alor
ie-f
ree;
➊ =
low
cal
orie
; ➁ =
cho
lest
erol
-fre
e; ➋
= lo
w c
hole
ster
ol; ➂
= s
odiu
m-f
ree;
➌ =
low
sod
ium
; ➃
= fa
t-fr
ee; ➍
= lo
w fa
t.3
Als
o in
clud
es le
gum
es, s
oybe
an p
rodu
cts,
nut
s, a
nd s
eeds
.4
Ven
ding
mac
hine
item
s oc
cupy
ing
mul
tiple
slo
ts a
re in
dica
ted
with
the
num
ber
of s
lots
sho
wn
in [
] fol
low
ing
the
prod
uct n
ame.
S
ourc
e:In
vent
orie
s of
Com
petit
ive
Foo
ds.
F-8

Study of Foods in the School Environment
SURVEY OF PRINCIPALS
If you have questions or need assistance, please call 617-349-2674 or 617-349-2661
Spring 2003 The Study of Foods in the School Environment is being conducted for the: Food and Nutrition Service US Department of Agriculture 3101 Park Center Drive Alexandria, Virginia 22302 By: Abt Associates Inc. 55 Wheeler Street Cambridge, Massachusetts 02138


Abt Associates Inc. Principal Survey 1
This questionnaire asks about all of the possible sources of foods and beverages available to students during the school day. Specifically, there are questions about:
• School lunch and school breakfast programs
• A la carte foods and beverages purchased separately from USDA reimbursable meals
• Vending machines
• Snack bars, including canteens, food carts, kiosks
• School stores
• Off-campus sources that students can visit when not required to be in some specific location like a class, study hall, or school cafeteria.
• Fundraisers selling food or beverages Please note that the questionnaire will instruct you to skip over sections that do not apply to your school.
A. School Lunch and Breakfast Programs
1. Does your school offer breakfast? ρ 1 Yes ρ 2 No (Skip to Q 5) 2. What time do you usually start serving breakfast? ____ : ____ a.m. 3. What time does the first class of the day usually start? ____ : ____ a.m. 4. Where do students eat breakfast? (Check all that apply.) ρ 1 Cafeteria ρ 2 School buses ρ 3 Classrooms ρ 4 Outdoors ρ 5 Other (Please specify): ____________________________________

2 Principal Survey Abt Associates Inc.
5. What (times are/time is) your lunch period(s)? From ____ : ____ to ____ : ____
From ____ : ____ to ____ : ____
From ____ : ____ to ____ : ____
From ____ : ____ to ____ : ____ 6. Where do students eat lunch? (Check all that apply.) ρ 1 Cafeteria (Specify number of cafeterias: _____) ρ 2 Classrooms ρ 3 Outdoors ρ 4 Other (Please specify): ____________________________________ 7. Are students allowed to leave the area where meals are served after a certain point during
their lunch period, for example, after the first 15 minutes? ρ 1 Yes, all students may leave (Skip to Q 8) ρ 2 Yes, some students may leave (either with or without special permission) ρ 3 No, all students must stay in the area (Skip to Q 8) 7a. Which grades are allowed to leave after a set period? (Circle all that apply.)
K 1 2 3 4 5 6 7 8 9 10 11 12 8. Are any students allowed to leave the area where meals are served at any time during their
lunch period? ρ 1 Yes, all students may leave (Skip to Q 9) ρ 2 Yes, some students may leave (either with or without special permission) ρ 3 No, all students must stay in the area (Skip to Q 9) 8a. Which grades are allowed to leave at any time ? (Circle all that apply.)
K 1 2 3 4 5 6 7 8 9 10 11 12 9. What types of payment are accepted for food and beverages sold through the school lunch
and breakfast programs? (Check all that apply.) ρ 1 Cash ρ 2 Electronic debit ρ 3 Prepaid account (cards, tickets, vouchers) ρ 4 Other (Please specify): ____________________________________

Abt Associates Inc. Principal Survey 3
B. A la Carte
“A la carte” refers to foods and beverages sold in or near the cafeteria(s) by the school food service, other than milk, full reimbursable meals, and vending machine items. For example, a la carte items may be sold on the cafeteria line with reimbursable meals or from a separate line or window within the cafeteria. 1. Are there a la carte food or beverage sales at your school? ρ 1 Yes (Go to Q 2) ρ 2 No (Please answer Q 1a, then skip to Section C) 1a. What is the most important reason your school does not offer a la carte food/beverage
sales?
2. Who decided to sell a la carte foods or beverages at your school? (Check all that apply.) ρ 1 School board ρ 2 Superintendent ρ 3 School district business manager ρ 4 Food service director ρ 5 Principal ρ 6 Cafeteria manager ρ 7 Other (Please specify): ____________________________________ 3. Where may students buy food or beverages on an a la carte basis at your school? (Check all
that apply.) ρ 1 On the cafeteria line, along with USDA meals ρ 2 Separate line or location within the cafeteria ρ 3 Outside but within 25 feet of the cafeteria ρ 4 Other location (Please specify): _________________________________

4 Principal Survey Abt Associates Inc.
4. When may students buy a la carte foods/beverages? (Check all that apply.) ρ 1 No restrictions ρ 2 When student takes a reimbursable meal ρ 3 When student brings lunch from home ρ 4 When student has eaten meal ρ 5 When all students have had the opportunity to take a reimbursable meal ρ 6 Outside breakfast or lunch periods only ρ 7 Limited to specific day(s) (Please specify): ________________________
____________________________________________________________
ρ 8 Other restriction (Please specify): ________________________________
____________________________________________________________ 4a. Are a la carte foods or beverages typically sold to students in the cafeteria outside of
meal periods? ρ 1 Yes ρ 2 No (Skip to Q 5) ρ 3 Don’t know (Skip to Q 5) 4b. Please specify hours when students may buy a la carte items outside of meal periods. ______:______ to ______:______ a.m. / p.m.
______:______ to ______:______ a.m. / p.m.
______:______ to ______:______ a.m. / p.m.
______:______ to ______:______ a.m. / p.m.
In addition to regulations, laws, or guidelines put in place by USDA, state, or school district authorities, please tell us if your school restricts a la carte items based on price or nutrition criteria. 5. Do a la carte items have to fall within any particular price range? ρ 1 Yes ρ 2 No ρ 3 Don’t know If yes, please explain or attach copy of price criteria.

Abt Associates Inc. Principal Survey 5
6. Do a la carte items have to meet any particular nutrition standards? ρ 1 Yes ρ 2 No ρ 3 Don’t know If yes, please explain or attach copy of nutrition criteria.
7. In addition to regulations, laws, or guidelines put in place by USDA, state, or school district
authorities, does your school prohibit any specific foods or beverages from being sold a la carte?
ρ 1 Yes ρ 2 No (Skip to Q 8) ρ 3 Don’t know (Skip to Q 8) 7a. What foods or beverages are prohibited? (Check all that apply.) ρ 1 Coffee or coffee-based beverages ρ 2 Tea or tea-based beverages (including iced teas) ρ 3 All caffeinated beverages (some coffees, teas, colas, energy drinks) ρ 4 Carbonated soft drinks ρ 5 Juice drinks (less than 50% fruit juice, with added sweeteners) ρ 6 Other sweetened beverages (sports drinks, flavored waters with added
sweetener) ρ 7 All artificially sweetened beverages (diet soft drinks, Fruit20) ρ 8 Fried vegetables (french fries) ρ 9 High-fat snacks or baked goods ρ 10 High-sugar foods ρ 11 Candy ρ 12 Gum ρ 13 Other (Please specify): ____________________________________
Please attach a copy of the document that specifies the foods or beverages prohibited from being sold a la carte at your school.
8. In addition to regulations, laws, or guidelines put in place by USDA, state, or school district
authorities, does your school require any specific foods or beverages be sold a la carte? ρ 1 Yes ρ 2 No (Skip to Q 9)

6 Principal Survey Abt Associates Inc.
ρ 3 Don’t know (Skip to Q 9) 8a. What foods or beverages are required? (Check all that apply.) ρ 1 Bottled water (unflavored, with no added sweeteners) ρ 2 Juice (100% juice) ρ 3 Milk (any type) ρ 4 Milk—skim, nonfat or 1% lowfat ρ 5 Low-fat snacks or baked goods ρ 6 Low-sugar foods ρ 7 Fresh fruit or vegetables ρ 8 Lean meats ρ 9 Whole grains ρ 10 Diet, “lite,” or sugar-free beverages ρ 11 Other (Please specify): ____________________________________
Please attach a copy of the document that specifies the foods or beverages required to be sold a la carte at your school.
9. What types of payment are accepted for food and beverages sold on an a la carte basis at your
school? (Check all that apply.) ρ 1 Cash ρ 2 Electronic debit ρ 3 Prepaid account (cards, tickets, vouchers) ρ 4 Other (Please specify): _________________________________

Abt Associates Inc. Principal Survey 7
C. Vending Machines
1. Are there vending machines available for student use located on your school property? ρ 1 Yes (Go to Q 2) ρ 2 No (Please answer Q 1a, then skip to Section D) 1a. What is the most important reason your school does not have vending machines for
students?
2. Who decided to install vending machines in your school? (Check all that apply.) ρ 1 School board ρ 2 Superintendent ρ 3 School district business manager ρ 4 Food service director ρ 5 Principal ρ 6 Cafeteria manager ρ 7 Other (Please specify): ____________________________________ 3. How many of the vending machines located on school property are available for student use?
(If none, write “0” and skip to Section D.) __________ 4. Who operates (or has primary responsibility for) the vending machines in your school?
(Check all that apply.) ρ 1 Food service department ρ 2 School ρ 3 Athletic department ρ 4 Other school department or fund ρ 5 Student club ρ 6 Other (Please specify): ____________________________________ ρ 8 Don’t know

8 Principal Survey Abt Associates Inc.
5. Please answer the following questions regarding the location and type of all vending machines available for student use at your school.
In your school, how many vending machines are located…
How many vending machines of each type are available in each location?
a. In the cafeteria?
______________
____ Milk
____ Water
____ Other beverages
____ Snacks
____ Refrigerated foods*
____ Frozen foods**
____ Combination
____ Other (Specify): _________
_______________________ b. Outside but within 25 feet of
the cafeteria?
______________
____ Milk
____ Water
____ Other beverages
____ Snacks
____ Refrigerated foods*
____ Frozen foods**
____ Combination
____ Other (Specify): _________
_______________________ c. In other indoor areas?
______________
____ Milk
____ Water
____ Other beverages
____ Snacks
____ Refrigerated foods*
____ Frozen foods**
____ Combination
____ Other (Specify): _________
_______________________ d. Outside school buildings, on
school grounds?
______________
____ Milk
____ Water
____ Other beverages
____ Snacks
____ Refrigerated foods*
____ Frozen foods**
____ Combination
____ Other (Specify): _________
_______________________
*Examples of refrigerated foods include sandwiches, yogurt, pasta salad. **Examples of frozen foods include ice cream, frozen yogurt.
6. Availability of vending machines. (Check all time periods when vending machines in your
school are available for student use.)
Location
Before classes begin
During breakfast
Before lunch
During lunch
After lunch
After last
class a. In the cafeteria. ο 1 ο 2 ο 3 ο 4 ο 5 ο 6
b. Outside but within 25 feet of the cafeteria.
ο 1 ο 2 ο 3 ο 4 ο 5 ο 6
c. Other indoor areas. ο 1 ο 2 ο 3 ο 4 ο 5 ο 6
d. Outside school buildings, on school grounds.
ο 1 ο 2 ο 3 ο 4 ο 5 ο 6

Abt Associates Inc. Principal Survey 9
7. For times when vending machines are not available to students, how is access restricted? (Check all that apply.)
In the cafeteria Other
locations
a. Machines are turned off by timer. ο 1 ο 2 (Skip to Q 8)
b. Machines are turned off with a key. ο 1 ο 2
c. Machines are in a room that is locked. ο 1 ο 2
d. Machines are visually monitored. ο 1 ο 2
e. Other (Please specify): _____________
_________________________________
_________________________________
ο 1 ο 2
7a. Who is responsible for turning off, locking, or monitoring vending machines? (Please
explain.)
8. For the vending machines available to students at your school, who determines the location,
hours of availability, and types of foods/beverages that may be sold? (Please check all that apply.)
a.
Location
b. Hours of
availability
c. Types of foods/ beverages sold
School board ο 1 ο 2 ο 3
Superintendent ο 1 ο 2 ο 3
District business manager ο 1 ο 2 ο 3
Principal ο 1 ο 2 ο 3
Food service director ο 1 ο 2 ο 3
Cafeteria manager ο 1 ο 2 ο 3
Other (Please specify): _________________
_____________________________________
_____________________________________
ο 1 ο 2 ο 3

10 Principal Survey Abt Associates Inc.
In addition to regulations, laws, or guidelines put in place by USDA, state, or school district authorities, please tell us if your school restricts vending machine items based on price or nutrition criteria. 9. Do vending machine items have to fall within any particular price range? ρ 1 Yes ρ 2 No ρ 3 Don’t know If yes, please explain or attach copy of price criteria.
10. Do vending machine items have to meet any particular nutrition standards? ρ 1 Yes ρ 2 No ρ 3 Don’t know If yes, please explain or attach copy of nutrition criteria.
11. In addition to regulations, laws, or guidelines put in place by USDA, state, or school district
authorities, does your school prohibit any specific foods or beverages from being sold in vending machines?
ρ 1 Yes ρ 2 No (Skip to Q 12) ρ 3 Don’t know (Skip to Q 12)

Abt Associates Inc. Principal Survey 11
11a. What foods or beverages are prohibited? (Check all that apply.) ρ 1 Coffee or coffee-based beverages ρ 2 Tea or tea-based beverages (including iced teas) ρ 3 All caffeinated beverages (some coffees, teas, colas, energy drinks) ρ 4 Carbonated soft drinks ρ 5 Juice drinks (less than 50% fruit juice, with added sweeteners) ρ 6 Other sweetened beverages (sports drinks, flavored waters with added
sweetener) ρ 7 All artificially sweetened beverages (diet soft drinks, Fruit20) ρ 8 Fried vegetables (french fries) ρ 9 High-fat snacks or baked goods ρ 10 High-sugar foods ρ 11 Candy ρ 12 Gum ρ 13 Other (Please specify): ____________________________________
Please attach a copy of the document that specifies the foods or beverages prohibited from being sold in the vending machines in your school.
12. In addition to regulations, laws, or guidelines put in place by USDA, state, or school district
authorities, does your school require any specific foods or beverages to be sold in vending machines?
ρ 1 Yes ρ 2 No (Skip to Q 13) ρ 3 Don’t know (Skip to Q 13) 12a. What foods or beverages are required? (Check all that apply.) ρ 1 Bottled water (unflavored, with no added sweeteners) ρ 2 Juice (100% juice) ρ 3 Milk (any type) ρ 4 Milk—skim, nonfat or 1% lowfat ρ 5 Low-fat snacks or baked goods ρ 6 Low-sugar foods ρ 7 Fresh fruit or vegetables ρ 8 Lean meats ρ 9 Whole grains ρ 10 Diet, “lite,” or sugar-free beverages ρ 11 Other (Please specify): ____________________________________
Please attach a copy of the document that specifies the foods or beverages required to be sold in the vending machines in your school.

12 Principal Survey Abt Associates Inc.
13. Please characterize the purchasing arrangements for vending machines at your school. (Check all that apply.)
ρ 1 Contract with single distributor who stocks machines ρ 2 Contract with multiple distributors who stock machines ρ 3 Food service director orders all or some items for machines in district ρ 4 School cafeteria staff orders all or some items for machines in school ρ 5 Other (Please specify): _______________________________ ρ 3 Don’t know 14. Please characterize the stocking arrangements for vending machines at your school. (Check
all that apply.) ρ 1 Contract with single distributor who stocks machines ρ 2 Contract with multiple distributors who stock machines ρ 3 Food service director stocks all or some items for machines in district ρ 4 School cafeteria staff stocks all or some items for machines in school ρ 5 Other (Please specify): _______________________________ ρ 3 Don’t know 15. Do you have or can you obtain information on the number sold for each product in some or
all vending machines at your school? ρ 1 Yes ρ 2 No (Skip to Q 16) 15a. For what time period is the information available? (Check all that apply.) ρ 1 Per week
ρ 2 Per month ρ 3 An average month ρ 4 Per year ρ 5 Other (Please specify): ____________________________________ Please attach a copy of your most recent invoice(s) or other documentation that includes this
information.

Abt Associates Inc. Principal Survey 13
16. Who receives the profits (i.e., revenue less costs) from the vending machines at your school? (Check all that apply.)
ρ 1 Food service department ρ 2 School ρ 3 Athletic department ρ 4 Other school department or fund ρ 5 Student club ρ 6 Other (Please specify): ____________________________________ 16a. Approximately how much total profit is earned from all vending machines available for
student use at your school (per year, month, or week)? Do not include profits that go to the school food service.
$__________ per __________ 16b. How are profits from vending machine sales used? (Check all that apply.) ρ 1 General fund ρ 2 Specific purpose (Please specify): _______________________________ 17. Are beverage sales in your school covered by a “pouring rights” contract (that is, a long-term
contract with a beverage company that establishes the company as a sole -source vendor for some types of beverages)?
ρ 1 Yes ρ 2 No (Skip to Section D) ρ 3 Don’t know (Skip to Section D) 17a. Who receives the commissions and/or incentives from the beverage contract? ρ 1 Food service department ρ 2 School ρ 3 Athletic department ρ 4 Other school department or fund ρ 5 Student club ρ 6 Other (Please specify): ____________________________________ 17b. Since starting the beverage contract, has the number of vending machines in your
school increased? ρ 1 Yes ρ 2 No

14 Principal Survey Abt Associates Inc.

Abt Associates Inc. Principal Survey 15
D. Snack Bars (Including Canteens, Food Carts, Kiosks)
The term “snack bar” is used in this section to refer to places that sell food to students, other than cafeteria lines, a la carte windows, vending machines, or school stores. This may include canteens, food carts, kiosks, or concession stands open to students during the school day. 1. Are there any snack bars located on school property that sell food or beverages to students? ρ 1 Yes (Go to Q 2) ρ 2 No (Please answer Q 1a, then skip to Section E) 1a. What is the most important reason your school does not operate snack bars for
students?
2. Who decided to operate the snack bar(s) at your school? (Check all that apply.) ρ 1 School board ρ 2 Superintendent ρ 3 School district business manager ρ 4 Food service director ρ 5 Principal ρ 6 Cafeteria manager ρ 7 Other (Please specify): ____________________________________

16 Principal Survey Abt Associates Inc.
3. Please answer the following questions regarding the location and type of all snack bars available for students during the school day at your school.
In your school, how many snack bars are located…
How many snack bars of each type are available in each location?
a. In the cafeteria?
______________
____ Canteens
____ Food carts
____ Kiosks
____ Concession stands
____ Other (Specify): _________
_______________________
b. Outside but within 25 feet of the cafeteria?
______________
____ Canteens
____ Food carts
____ Kiosks
____ Concession stands
____ Other (Specify): _________
_______________________
c. In other indoor areas?
______________
____ Canteens
____ Food carts
____ Kiosks
____ Concession stands
____ Other (Specify): _________
_______________________
d. Outside school buildings, on school grounds?
______________
____ Canteens
____ Food carts
____ Kiosks
____ Concession stands
____ Other (Specify): _________
_______________________
4. Availability of snack bars. (Check all time periods when snack bars in your school are
available for student use.)
Location
Before classes begin
During breakfast
Before lunch
During lunch
After lunch
After last
class a. In the cafeteria. ο 1 ο 2 ο 3 ο 4 ο 5 ο 6
b. Outside but within 25 feet of the cafeteria.
ο 1 ο 2 ο 3 ο 4 ο 5 ο 6
c. Other indoor areas. ο 1 ο 2 ο 3 ο 4 ο 5 ο 6
d. Outside school buildings, on school grounds.
ο 1 ο 2 ο 3 ο 4 ο 5 ο 6
5. Are the snack bar(s) usually open every school day? ρ 1 Yes (Skip to Q 6) ρ 2 No ρ 3 Varies by snack bar type

Abt Associates Inc. Principal Survey 17
5a. Which days of the week are the snack bars usually open? (Check all that apply.) ρ 1 Monday ρ 2 Tuesday ρ 3 Wednesday ρ 4 Thursday ρ 5 Friday ρ 6 Various days or no set schedule 6. What types of payment are accepted for food and beverages sold at the snack bar(s)? (Check
all that apply.) ρ 1 Cash ρ 2 Electronic debit ρ 3 Prepaid account (cards, tickets, vouchers) ρ 4 Other (Please specify): _________________________________ 7. For the snack bar(s) at your school, who determines the location, hours of availability, and
types of foods/beverages that may be sold? (Check all that apply.)
a.
Location
b. Hours of
availability
c. Types of foods/ beverages sold
School board ο 1 ο 2 ο 3
Superintendent ο 1 ο 2 ο 3
District business manager ο 1 ο 2 ο 3
Principal ο 1 ο 2 ο 3
Food service director ο 1 ο 2 ο 3
Cafeteria manager ο 1 ο 2 ο 3
Other (Please specify): _________________
_____________________________________
_____________________________________
ο 1 ο 2 ο 3
In addition to regulations, laws, or guidelines put in place by USDA, state, or school district authorities, please tell us if your school restricts snack bar items based on price or nutrition criteria. 8. Do snack bar items have to fall within any particular price range? ρ 1 Yes ρ 2 No ρ 3 Don’t know

18 Principal Survey Abt Associates Inc.
If yes, please explain or attach copy of price criteria.
9. Do snack bar items have to meet any particular nutrition standards? ρ 1 Yes ρ 2 No ρ 3 Don’t know If yes, please explain or attach copy of nutrition criteria.
10. In addition to regulations, laws, or guidelines put in place by USDA, state, or school district
authorities, does your school prohibit any specific foods or beverages from being sold at the snack bar(s)?
ρ 1 Yes ρ 2 No (Skip to Q 11) ρ 3 Don’t know (Skip to Q 11) 10a. What foods or beverages are prohibited? (Check all that apply.) ρ 1 Coffee or coffee-based beverages ρ 2 Tea or tea-based beverages (including iced teas) ρ 3 All caffeinated beverages (some coffees, teas, colas, energy drinks) ρ 4 Carbonated soft drinks ρ 5 Juice drinks (less than 50% fruit juice, with added sweeteners) ρ 6 Other sweetened beverages (sports drinks, flavored waters with added
sweetener) ρ 7 All artificially sweetened beverages (diet soft drinks, Fruit20) ρ 8 Fried vegetables (french fries) ρ 9 High-fat snacks or baked goods ρ 10 High-sugar foods ρ 11 Candy ρ 12 Gum ρ 13 Other (Please specify): ____________________________________

Abt Associates Inc. Principal Survey 19
Please attach a copy of the document that specifies the foods or beverages prohibited from being sold at snack bars in your school.
11. In addition to regulations, laws, or guidelines put in place by USDA, state, or school district authorities, does your school require any specific foods or beverages to be sold at the snack bar(s)?
ρ 1 Yes ρ 2 No (Skip to Q 12) ρ 3 Don’t know (Skip to Q 12) 11a. What foods or beverages are required? (Check all that apply.) ρ 1 Bottled water (unflavored, with no added sweeteners) ρ 2 Juice (100% juice) ρ 3 Milk (any type) ρ 4 Milk—skim, nonfat or 1% lowfat ρ 5 Low-fat snacks or baked goods ρ 6 Low-sugar foods ρ 7 Fresh fruit or vegetables ρ 8 Lean meats ρ 9 Whole grains ρ 10 Diet, “lite,” or sugar-free beverages ρ 11 Other (Please specify): ____________________________________
Please attach a copy of the document that specifies the foods or beverages required to be sold at snack bars in your school.
12. Can students select a USDA reimbursable meal from any of the snack bar(s)? ρ 1 Yes (Please specify snack bar type(s)): ___________________________ ρ 2 No ρ 3 Don’t know 13. Who operates the snack bar(s) at your school? (Check all that apply.) ρ 1 Food service department ρ 2 School ρ 3 Athletic department ρ 4 Other school department or fund ρ 5 Student club ρ 6 Other (Please specify): ____________________________________

20 Principal Survey Abt Associates Inc.
14. Who receives the profits from the snack bar(s) at your school? (Check all that apply.) ρ 1 Food service department ρ 2 School ρ 3 Athletic department ρ 4 Other school department or fund ρ 5 Student club ρ 6 Other (Please specify): ____________________________________ 14a. Approximately how much profit is received by the school from the snack bar(s) (per
year, month, or week)? Do not include profits that go to the school food service. $__________ per __________ 14b. How are the school’s profits from snack bar sales used? (Check all that apply.) ρ 1 General fund ρ 2 Specific purpose (Please specify): _______________________________

Abt Associates Inc. Principal Survey 21
E. School Stores
1. Are there any school stores located on school property that sell food or beverages to students? ρ 1 Yes (Go to Q 2) ρ 2 No (Please answer Q 1a, then skip to Section F) 1a. What is the most important reason your school does not operate a school store that
sells food or beverages?
2. Who decided to operate the school store(s) in your school? (Check all that apply.) ρ 1 School board ρ 2 Superintendent ρ 3 School district business manager ρ 4 Food service director ρ 5 Principal ρ 6 Cafeteria manager ρ 7 Other (Please specify): ____________________________________ 3. How many school stores sell food or beverages to students? (If more than one, please answer
Questions 4 through 7 in this section for the store that generates the most revenue from food and beverage sales to students.)
__________ 4. Where is the school store located? ρ 1 In the cafeteria ρ 2 Outside but within 25 feet of the cafeteria ρ 3 Other indoor area ρ 4 Outside school buildings, on school grounds 5. Is the school store usually open every school day? ρ 1 Yes (Skip to Q 6) ρ 2 No

22 Principal Survey Abt Associates Inc.
5a. Which days of the week is the school store usually open? (Check all that apply.) ρ 1 Monday ρ 2 Tuesday ρ 3 Wednesday ρ 4 Thursday ρ 5 Friday ρ 6 Various days or no set schedule 6. When is the school store usually open? (Check all that apply.) ρ 1 Before classes begin ρ 2 During the breakfast period ρ 3 Before lunch ρ 4 During lunch periods ρ 5 After lunch ρ 6 After last class ρ 4 Other (Please specify): _________________________________ 7. What types of payment are accepted for food and beverages sold at the school store? (Check
all that apply.) ρ 1 Cash ρ 2 Electronic debit ρ 3 Prepaid account (cards, tickets, vouchers) ρ 4 Other (Please specify): _________________________________ 8. Thinking about all of the school store(s) at your school, who determines the location, hours of
availability, and types of foods/beverages that may be sold? (Check all that apply.)
a.
Location
b. Hours of
availability
c. Types of foods/ beverages sold
School board ο 1 ο 2 ο 3
Superintendent ο 1 ο 2 ο 3
District business manager ο 1 ο 2 ο 3
Principal ο 1 ο 2 ο 3
Food service director ο 1 ο 2 ο 3
Cafeteria manager ο 1 ο 2 ο 3
Other (Please specify): _________________
_____________________________________
_____________________________________
ο 1 ο 2 ο 3

Abt Associates Inc. Principal Survey 23
In addition to regulations, laws, or guidelines put in place by USDA, state, or school district authorities, please tell us if your school restricts school store foods and beverages based on price or nutrition criteria. 9. Do school store food and beverage items have to fall within any particular price range? ρ 1 Yes ρ 2 No ρ 3 Don’t know If yes, please explain or attach copy of price criteria.
10. Do school store food and beverage items have to meet any particular nutrition standards? ρ 1 Yes ρ 2 No ρ 3 Don’t know If yes, please explain or attach copy of nutrition criteria.
11. In addition to regulations, laws, or guidelines put in place by USDA, state, or school district
authorities, does your school prohibit any specific foods or beverages from being sold in the school store?
ρ 1 Yes ρ 2 No (Skip to Q 12) ρ 3 Don’t know (Skip to Q 12)

24 Principal Survey Abt Associates Inc.
11a. What foods or beverages are prohibited? (Check all that apply.) ρ 1 Coffee or coffee-based beverages ρ 2 Tea or tea-based beverages (including iced teas) ρ 3 All caffeinated beverages (some coffees, teas, colas, energy drinks) ρ 4 Carbonated soft drinks ρ 5 Juice drinks (less than 50% fruit juice, with added sweeteners) ρ 6 Other sweetened beverages (sports drinks, flavored waters with added
sweetener) ρ 7 All artificially sweetened beverages (diet soft drinks, Fruit20) ρ 8 Fried vegetables (french fries) ρ 9 High-fat snacks or baked goods ρ 10 High-sugar foods ρ 11 Candy ρ 12 Gum ρ 13 Other (Please specify): ____________________________________
Please attach a copy of the document that specifies the foods or beverages prohibited from being sold in the school store at your school.
12. In addition to regulations, laws, or guidelines put in place by USDA, state, or school district
authorities, does your school require any specific foods or beverages to be sold in the school store?
ρ 1 Yes ρ 2 No (Skip to Q 13) ρ 3 Don’t know (Skip to Q 13) 12a. What foods or beverages are required? (Check all that apply.) ρ 1 Bottled water (unflavored, with no added sweeteners) ρ 2 Juice (100% juice) ρ 3 Milk (any type) ρ 4 Milk—skim, nonfat or 1% lowfat ρ 5 Low-fat snacks or baked goods ρ 6 Low-sugar foods ρ 7 Fresh fruit or vegetables ρ 8 Lean meats ρ 9 Whole grains ρ 10 Diet, “lite,” or sugar-free beverages ρ 11 Other (Please specify): ____________________________________
Please attach a copy of the document that specifies the foods or beverages required to be sold in the school store at your school.

Abt Associates Inc. Principal Survey 25
13. Who operates the school store at your school? ρ 1 Food service department (Skip to Q 15) ρ 2 School ρ 3 Athletic department ρ 4 Other school department or fund ρ 5 Student club ρ 6 Other (Please specify): ____________________________________ 14. Do you have or can you obtain information on the number sold for each food and beverage
item in the school store at your school? ρ 1 Yes ρ 2 No (Skip to Q 15) 14a. For what time period is the information available? (Check all that apply.) ρ 1 Per week ρ 2 Per month ρ 3 An average month ρ 4 Per year ρ 5 Other (Please specify): ____________________________________ Please attach a copy of your most recent invoice(s) or other documentation that includes this
information. 15. Who receives the profits from food and beverage sales at the school store(s) in your school?
(Check all that apply.) ρ 1 Food service department ρ 2 School ρ 3 Athletic department ρ 4 Other school department or fund ρ 5 Student club ρ 6 Other (Please specify): ____________________________________ 15a. Approximately how much profit is received by the school from food and beverage
sales at the school store in total (per year, month, or week)? Do not include profits that go to the school food service.
$__________ per __________

26 Principal Survey Abt Associates Inc.
15b. How are the school’s profits from the school store food and beverage sales used? (Check all that apply.)
ρ 1 General fund ρ 2 Specific purpose (Please specify): _______________________________

Abt Associates Inc. Principal Survey 27

28 Principal Survey Abt Associates Inc.
F. Off-Campus Eating Establishments
1. Are students allowed to leave the school during their lunch period? ρ 1 Yes, all students may leave (Skip to Q 2) ρ 2 Yes, some students may leave ρ 3 No, no students may leave the school (Skip to Q 2) 1a. Which grades are allowed to leave during their lunch period? (Circle all that apply.)
K 1 2 3 4 5 6 7 8 9 10 11 12 2. Are students allowed to leave the school during their free period(s)? (Check one) ρ 1 Yes, all students are allowed to leave (Skip to Q 3) ρ 1 Yes, some students are allowed to leave
ρ 2 No, no students are allowed to leave (Skip to Q 3) ρ 3 Not applicable, students do not have free periods (Skip to Q 3) 2a. Which grades are allowed to leave during their free period(s)? (Circle all that apply.)
K 1 2 3 4 5 6 7 8 9 10 11 12 3. Approximately how many of the following eating establishments are close enough for
students to walk or drive to from campus during a lunch period?
Source Number Within
Walking Distance Number Within Driving Distance
Fast food restaurants _____________ _____________
Other restaurants, cafeterias, or diners
_____________ _____________
Food markets, grocery, convenience, or other stores
_____________ _____________
Lunch wagons or push carts _____________ _____________
Food courts (e.g., in a shopping mall)
_____________ _____________
Other (please specify):
______________________________
______________________________
_____________ _____________

Abt Associates Inc. Principal Survey 29

30 Principal Survey Abt Associates Inc.
G. Other Sources of Food or Beverages
1. In this school, are parents or teachers permitted to offer students foods or beverages in the classroom?
ρ 1 Yes ρ 2 No (Skip to Q 4) 2. Does your school provide guidelines to parents or teachers for foods that can be offered to
students in the classroom? (Check all that apply.) ρ 1 Guidelines are provided to parents ρ 2 Guidelines are provided to teachers ρ 3 No guidelines are provided to parents or teachers 3. Are there any restrictions on the types of food or beverages that parents or teachers may offer
students in the classroom? ρ 1 Yes ρ 2 No (Skip to Q 4)
3a. What foods or beverages are not permitted? (Please specify or attach a copy of the document that lists the restricted items.)
4. Are fundraisers that offer baked items, candy, or other food or beverages for sale to students
ever held at this school? ρ 1 Yes ρ 2 No (Skip to Section H) 5. Which organizations hold fundraisers that offer food or beverages for sale to students?
(Check all that apply.) ρ 1 Athletic department ρ 2 Student clubs or service organizations ρ 3 Music or art department ρ 4 Parent-teacher organizations ρ 5 Other (Please specify): ____________________________________ ρ 8 Don’t know

Abt Associates Inc. Principal Survey 31
6. On average, how often do the following types of activities take place during the breakfast period? (If your school does not serve breakfast, skip to Q 7.)
Every
day
3-4 times per
week
1-2 times per
week
1-2 times per
month
Less than 1
time per month
Not appli-cable
a. Bake sales ο 1 ο 2 ο 3 ο 4 ο 5 ο 8
b. Candy sales ο 1 ο 2 ο 3 ο 4 ο 5 ο 8
c. Other fundraisers selling food (please specify):
______________________
______________________
ο 1 ο 2 ο 3 ο 4 ο 5 ο 8
7. On average, how often do the following types of activities take place during the lunch period?
Every
day
3-4 times per
week
1-2 times per
week
1-2 times per
month
Less than 1
time per month
Not appli-cable
a. Bake sales ο 1 ο 2 ο 3 ο 4 ο 5 ο 8
b. Candy sales ο 1 ο 2 ο 3 ο 4 ο 5 ο 8
c. Other fundraisers selling food (please specify):
______________________
______________________
ο 1 ο 2 ο 3 ο 4 ο 5 ο 8
8. Are there any restrictions on the types of food or beverages that may be sold to students for
fundraising purposes? ρ 1 Yes ρ 2 No (Go to Section H) 8a. What foods or beverages are not permitted for sale? (Please specify or attach a copy
of the document that lists restricted items.)

32 Principal Survey Abt Associates Inc.
H. Nutrition Initiatives
1. Other than initiatives that target USDA school meals, is your school currently implementing any of the following activities to promote the availability of healthful food choices for students at school? (Check all that apply.)
ρ 1 The school has a health or nutrition advisory council made up of school staff, students,
and parents that provides input about the types of foods available at school.
ρ 2 School food service staff participate in making decisions and policies that affect the kinds of foods available to students outside of school meal programs.
ρ 3 School groups are encouraged to raise funds by selling non-food items.
ρ 4 Food is not used by teachers or other school staff as a reward or punishment (e.g., withholding snacks for misbehavior) for students.
ρ 5 Parents are encouraged to provide healthy food choices for bag lunches brought from home.
ρ 6 The school has nutrition criteria for foods and beverages offered at parties, celebrations, and social events held after school or on weekends.
ρ 7 Foods and beverages sold outside the school meal program are not more highly marketed than the reimbursable school meals.
ρ 8 The school conducts promotional activities to encourage healthy food choices, and does not permit advertising of less nutritious foods and beverages.
ρ 9 The school bans particular types of soda, other soft drinks, or sweetened fruit beverages (less than 100% juice) that may be sold to students in the school or on school grounds (including vending machines).
ρ 10 Other school food initiatives (Please specify):
______________________________________________________________________
______________________________________________________________________
______________________________________________________________________

Abt Associates Inc. Principal Survey 33

34 Principal Survey Abt Associates Inc.
I. Daily Attendance
Please provide the total daily attendance for the week of May 19, 2003 – May 23, 2003.
Number of Students
Monday, May 19 _______
Tuesday, May 20 _______
Wednesday, May 21 _______
Thursday, May 22 _______
Friday, May 23 _______
J. Survey Information
1. Did you need to consult other school personnel to complete this survey? ρ 1 Yes ρ 2 No (Skip to Q. 2)
1a. For each section of the survey, please check if other personnel were consulted and
indicate their title. ρ 1 School lunch and breakfast programs ______________________________
ρ 2 A la carte ____________________________________________________
ρ 3 Vending machines _____________________________________________
ρ 4 Snack bars ___________________________________________________
ρ 5 School stores _________________________________________________
ρ 6 Off-campus eating establishments ________________________________
ρ 7 Other sources of food or beverages ________________________________
ρ 8 Nutrition initiatives ____________________________________________
ρ 8 Daily attendance ______________________________________________ 2. Please estimate the time it took you to complete the following: Gathering information: __________________________________
Consulting with other staff: ______________________________
Completing questionnaire: _______________________________

Abt Associates Inc. Principal Survey 35
Thank you for taking the time to complete this survey. Your cooperation is very much appreciated.

Study of Foods in the School Environment
If you have questions or need assistance, please call 617-349-2674 or 617-349-2661
Spring 2003 The Study of Foods in the School Environment is being conducted for the: Food and Nutrition Service US Department of Agriculture 3101 Park Center Drive Alexandria, Virginia 22302 By: Abt Associates Inc. 55 Wheeler Street Cambridge, Massachusetts 02138
Survey of School Food Authority (SFA) Directors


Abt Associates Inc. Survey of SFA Directors 1
This questionnaire asks about sources of foods available to students in your district during the school day, other than USDA reimbursable meals. If the SFA serves multiple school districts or a district as well as independent charter schools, please answer for the district containing [SCHOOL]. The questions are about school district policies regarding:
• A la carte foods and beverages • Vending machines • Snacks bars, including canteens, food carts, kiosks • School stores • Exclusive beverage contracts
The questionnaire also includes questions about the school food environment at [SCHOOL]. Please note that the questionnaire will instruct you to skip over sections that do not apply to your district or [SCHOOL].
A. A la Carte
For the purposes of this survey, “a la carte” refers to foods and beverages sold in or near the cafeteria(s) by school food service staff, other than milk, full reimbursable meals, and vending machine items. For example, a la carte items may be sold on the cafeteria line with reimbursable meals, or from a separate line or window within the cafeteria. 1. Are a la carte food and beverage sales offered during lunch to students in any of the schools
in your district? ρ 1 Yes ρ 2 No (Skip to Section B) 1a. Which types of schools offer a la carte food and beverage sales during lunch? (Check
all that apply.) ρ 1 Elementary schools ρ 2 Middle or junior high schools ρ 3 High schools In addition to regulations, laws, or guidelines put in place by USDA or state authorities, please tell us if your school district restricts a la carte items based on price or nutrition criteria. 2. Do a la carte items have to fall within any particular price range? ρ 1 Yes ρ 2 No ρ 3 Don’t know
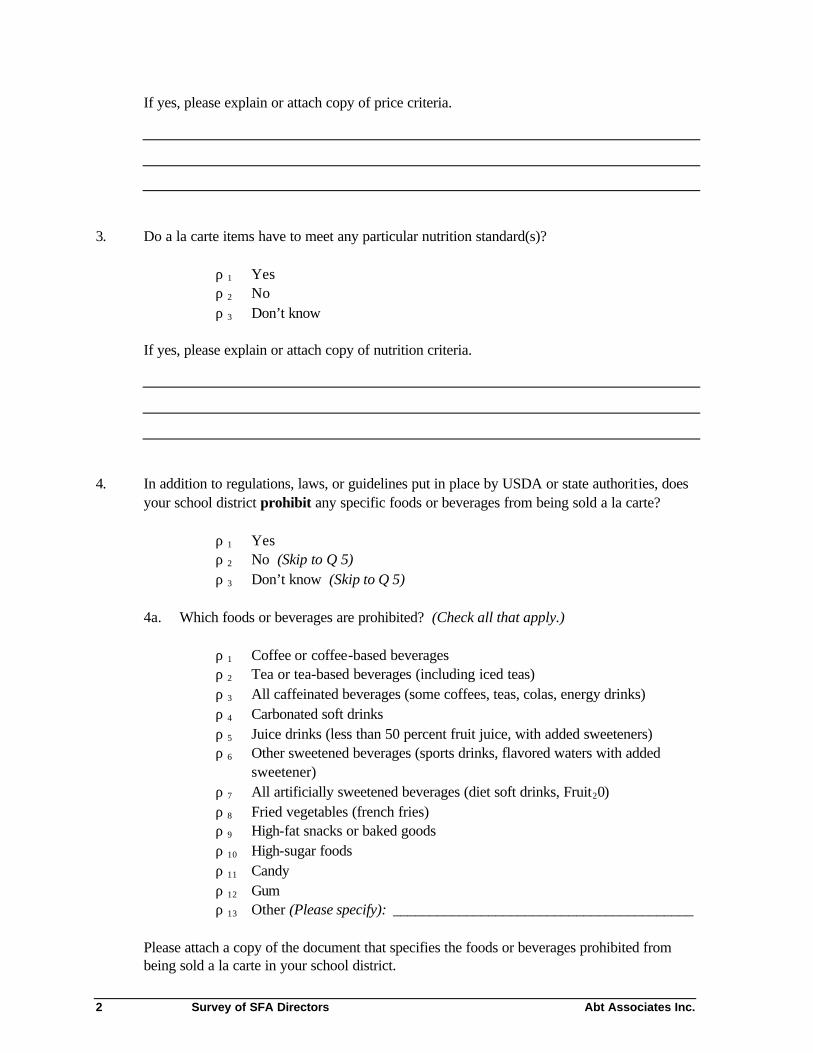
2 Survey of SFA Directors Abt Associates Inc.
If yes, please explain or attach copy of price criteria.
3. Do a la carte items have to meet any particular nutrition standard(s)? ρ 1 Yes ρ 2 No ρ 3 Don’t know If yes, please explain or attach copy of nutrition criteria.
4. In addition to regulations, laws, or guidelines put in place by USDA or state authorities, does
your school district prohibit any specific foods or beverages from being sold a la carte? ρ 1 Yes ρ 2 No (Skip to Q 5) ρ 3 Don’t know (Skip to Q 5) 4a. Which foods or beverages are prohibited? (Check all that apply.) ρ 1 Coffee or coffee-based beverages ρ 2 Tea or tea-based beverages (including iced teas) ρ 3 All caffeinated beverages (some coffees, teas, colas, energy drinks) ρ 4 Carbonated soft drinks ρ 5 Juice drinks (less than 50 percent fruit juice, with added sweeteners) ρ 6 Other sweetened beverages (sports drinks, flavored waters with added
sweetener) ρ 7 All artificially sweetened beverages (diet soft drinks, Fruit20) ρ 8 Fried vegetables (french fries) ρ 9 High-fat snacks or baked goods ρ 10 High-sugar foods ρ 11 Candy ρ 12 Gum ρ 13 Other (Please specify): _________________________________________
Please attach a copy of the document that specifies the foods or beverages prohibited from being sold a la carte in your school district.

Abt Associates Inc. Survey of SFA Directors 3
5. In addition to regulations, laws, or guidelines put in place by USDA or state authorities, does
your school district require any specific foods or beverages to be sold a la carte? ρ 1 Yes ρ 2 No (Skip to Q 6) ρ 3 Don’t know (Skip to Q 6) 5a. Which foods or beverages are required? (Check all that apply.) ρ 1 Bottled water (unflavored, with no added sweeteners) ρ 2 Juice (100 percent juice) ρ 3 Milk (any type) ρ 4 Milk (skim, nonfat, or 1 percent low-fat) ρ 5 Low-fat snacks or baked goods ρ 6 Low-sugar foods ρ 7 Fresh fruit or vegetables ρ 8 Lean meats ρ 9 Whole grains ρ 10 Diet, “lite,” or sugar-free beverages ρ 11 Other (Please specify): _________________________________________
Please attach a copy of the document that specifies the foods or beverages required to be sold a la carte your school district.
6. In schools with a la carte food and beverage sales, are components of the USDA reimbursable
lunch, other than milk, offered on an a la carte basis? ρ 1 Yes ρ 2 No 7. Is there a single standard price for a la carte entrees in schools with a la carte food or
beverage sales? ρ 1 Yes ρ 2 No ρ 3 Not applicable; entrees not sold a la carte in the district (Skip to Q 11) 8. How does the price of an a la carte entree compare to the full price of a complete
reimbursable meal? (Check all that apply.) ρ 1 A la carte entree price is always higher ρ 2 A la carte entree price is sometimes higher ρ 3 A la carte entrees and full reimbursable meals are priced the same ρ 4 A la carte entree price is sometimes lower ρ 5 A la carte entree price is always lower

4 Survey of SFA Directors Abt Associates Inc.
9. Do any schools in your district offer “branded foods,” that is, foods from national or regional
brand-name or chain restaurants (McDonald’s, Taco Bell, Domino’s, Subway, etc.) or from a local restaurant?
ρ 1 Yes ρ 2 No (Skip to Q 11) 10. How does the price of branded entrees compare to the price of other entrees ... 10a. When offered in reimbursable meals? (Check all that apply.) ρ 1 Branded entree price is always higher ρ 2 Branded entree price is sometimes higher ρ 3 Branded entrees and other entrees are priced the same ρ 4 Branded entree price is sometimes lower ρ 5 Branded entree price is always lower ρ 6 Not applicable 10b. When offered a la carte? (Check all that apply.) ρ 1 Branded entree price is always higher ρ 2 Branded entree price is sometimes higher ρ 3 Branded entrees and other entrees are priced the same ρ 4 Branded entree price is sometimes lower ρ 5 Branded entree price is always lower 11. Thinking about all foods and beverages that are offered a la carte, what factors does your
school district consider in setting a la carte prices? (Check all that apply.) ρ 1 Food costs ρ 2 Product costs (wages, benefits, utilities, equipment, supplies, etc.) ρ 4 Administrative or indirect costs ρ 5 Incentive for student participation in reimbursable meal program ρ 6 Incentive for choosing more healthful foods/beverages (e.g., fruit priced
lower than baked goods) ρ 7 Ease of collecting payment ρ 8 Other (Please specify): _________________________________________ 12. How would you characterize the profitability of a la carte food and beverage sales in your
school district? ρ 1 Generate a profit ρ 2 Break even (Skip to Section B) ρ 3 Generate a loss (Skip to Section B)
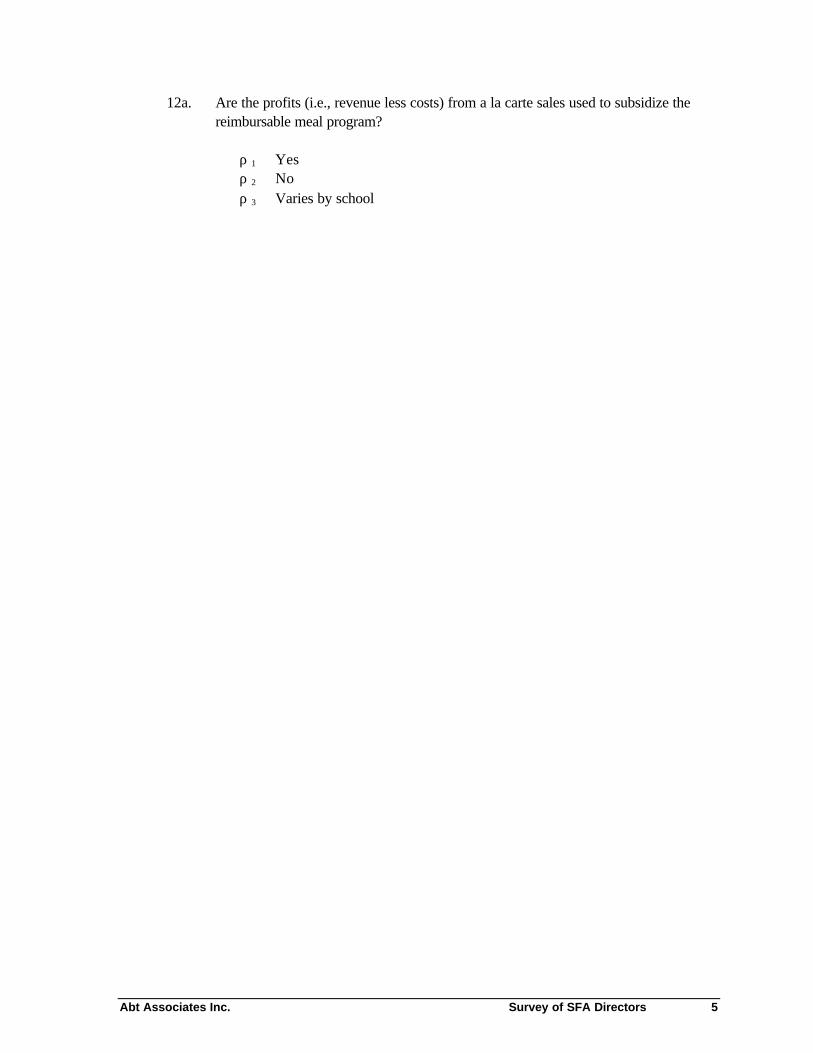
Abt Associates Inc. Survey of SFA Directors 5
12a. Are the profits (i.e., revenue less costs) from a la carte sales used to subsidize the reimbursable meal program?
ρ 1 Yes ρ 2 No ρ 3 Varies by school

6 Survey of SFA Directors Abt Associates Inc.

Abt Associates Inc. Survey of SFA Directors 7
B. Vending Machines
1. What types of schools in your district have vending machines available for student use? ρ 1 Elementary schools ρ 2 Middle or junior high schools ρ 3 High schools ρ 4 No schools have vending machines for students (Skip to Section C) 2. In what types of schools does the school food service operate or have primary responsibility
for vending machines available for student use? ρ 1 Elementary schools (Go to Q 3) ρ 2 Middle or junior high schools (Go to Q 3) ρ 3 High schools (Go to Q 3) ρ 4 No schools have vending machines for which the school food service is
responsible (Please answer Q 2a., then skip to Section C) 2a. What is the most important reason the school food service does not operate vending
machines for students in some or all schools in your district?
In addition to regulations, laws, or guidelines put in place by USDA or school district authorities, please tell us if your school district restricts vending machine items based on price or nutrition criteria. 3. Do vending machine items have to fall within any particular price range? ρ 1 Yes ρ 2 No ρ 3 Don’t know If yes, please explain or attach copy of price criteria.

8 Survey of SFA Directors Abt Associates Inc.
4. Do vending machine items have to meet any particular nutrition standards? ρ 1 Yes ρ 2 No ρ 3 Don’t know If yes, please explain or attach copy of nutrition criteria.
5. In addition to regulations, laws, or guidelines put in place by USDA or state authorities, does
your school district prohibit any specific foods or beverages from being sold in vending machines?
ρ 1 Yes ρ 2 No (Skip to Q 6) ρ 3 Don’t know (Skip to Q 6) 5a. Which foods or beverages are prohibited? (Check all that apply.) ρ 1 Coffee or coffee-based beverages ρ 2 Tea or tea-based beverages (including iced teas) ρ 3 All caffeinated beverages (some coffees, teas, colas, energy drinks) ρ 4 Carbonated soft drinks ρ 5 Juice drinks (less than 50 percent fruit juice, with added sweeteners) ρ 6 Other sweetened beverages (sports drinks, flavored waters with added
sweetener) ρ 7 All artificia lly sweetened beverages (diet soft drinks, Fruit20) ρ 8 Fried vegetables (french fries) ρ 9 High-fat snacks or baked goods ρ 10 High-sugar foods ρ 11 Candy ρ 12 Gum ρ 13 Other (Please specify): _________________________________________
Please attach a copy of the document that specifies the foods or beverages prohibited from being sold in the vending machines in your school district.

Abt Associates Inc. Survey of SFA Directors 9
6. In addition to regulations, laws, or guidelines put in place by USDA or state authorities, does your school district require any specific foods or beverages to be sold in vending machines?
ρ 1 Yes ρ 2 No (Skip to Q 7) ρ 3 Don’t know (Skip to Q 7) 6a. Which foods or beverages are required? (Check all that apply.) ρ 1 Bottled water (unflavored, with no added sweeteners) ρ 2 Juice (100 percent juice) ρ 3 Milk (any type) ρ 4 Milk (skim, nonfat, or 1 percent low-fat) ρ 5 Low-fat snacks or baked goods ρ 6 Low-sugar foods ρ 7 Fresh fruit or vegetables ρ 8 Lean meats ρ 9 Whole grains ρ 10 Diet, “lite,” or sugar-free beverages ρ 11 Other (Please specify): _________________________________________
Please attach a copy of the document that specifies the foods or beverages required to be sold in the vending machines in your school district.
The following questions refer only to vending machines available for students for which the school food service has primary responsibility.
7. Please characterize the purchasing arrangements for vending machines in your district. (Check all that apply.)
ρ 1 Contract with single distributor who stocks machines ρ 2 Contract with multiple distributors who stock machines ρ 3 Food service director orders all or some items for machines in district ρ 4 School cafeteria staff order all or some items for machines in their schools ρ 5 Other (Please specify): ________________________________________ 8. Please characterize the stocking arrangements for vending machines in your district. (Check
all that apply.) ρ 1 Contract with single distributor who stocks machines ρ 2 Contract with multiple distributors who stock machines ρ 3 Food service director stocks all or some items for machines in district ρ 4 School cafeteria staff stock all or some items for machines in their schools ρ 5 Other (Please specify): ________________________________________

10 Survey of SFA Directors Abt Associates Inc.
9. Which of the following factors does your school district consider in setting prices for food and beverage items sold in vending machines? (Check all that apply.)
ρ 1 Food costs ρ 2 Product costs (wages, benefits, utilities, equipment, supplies, etc.) ρ 4 Administrative or indirect costs ρ 5 Incentive for student participation in reimbursable meal program ρ 6 Incentive for choosing more healthful foods/beverages (e.g., milk priced
lower than soft drinks) ρ 7 Other (Please specify): _________________________________________ 10. Do you have nutrition information for foods and beverages sold in vending machines in your
school district? That is, information on nutrient content from the manufacturer or distributor? ρ 1 Yes, for all foods/beverages ρ 2 Yes, for some foods/beverages ρ 3 No Please answer the following questions for the vending machines for which the school food service is primarily responsible at [SCHOOL]. 11. Do you have or can you obtain information on the number sold for each product in vending
machines at [SCHOOL]? ρ 1 Yes ρ 2 No (Skip to Q 12) 11a. For what time period is the information available? (Check all that apply.) ρ 1 Per week ρ 2 Per month ρ 3 An average month ρ 4 Per year ρ 5 Other (Please specify): _________________________________________ Please attach a copy of your most recent invoice(s) or other documentation that includes this
information.

Abt Associates Inc. Survey of SFA Directors 11
12. Who receives the profits (i.e., revenue less costs) from the vending machines for which the school food service is responsible at [SCHOOL]? (Check all that apply.)
ρ 1 Food service department ρ 2 School ρ 3 Athletic department ρ 4 Other school department or fund ρ 5 Student club ρ 6 Other (Please specify): _________________________________________ 12a. Approximately how much total profit is received by the school food service from all
vending machines available for student use at [SCHOOL] (per year, month, or week)? Do not include profits that go to the principal or other school departments or funds.
$__________ per __________ 12b. How are the school food service profits from vending machine sales used? (Check all
that apply.) ρ 1 General fund ρ 2 Specific purpose (Please specify): ________________________________

12 Survey of SFA Directors Abt Associates Inc.
C. Snack Bars (including Canteens, Food Carts, Kiosks)
The term “snack bar” is used in this section to refer to places that sell food to students, other than cafeteria lines, a la carte windows, vending machines, or school stores. This may include canteens, food carts, kiosks, or concession stands open to students during the school day. 1. Does the school food service in your district operate any snack bars that sell food or
beverages to students during the school day? ρ 1 Yes, district-wide (Go to Q 2) ρ 3 Yes, some schools (Please answer Q 1a, then go to Q 2) ρ 2 No (Please answer Q 1a, then skip to Section D) 1a. What is the most important reason the school food service does not operate snack
bars for students in some or all schools in your district?
2. In what types of schools does the school food service operate snack bars? ρ 1 Elementary schools ρ 2 Middle or junior high schools ρ 3 High schools 3. What types of snack bars does the school food service operate in your district? (Check all
that apply.) ρ 1 Canteens ρ 2 Food carts ρ 3 Kiosks ρ 4 Concession stands ρ 5 Other snack bar types (Please specify): ___________________________ In addition to regulations, laws, or guidelines put in place by USDA or state authorities, please tell us if your school district restricts snack bar items based on price or nutrition criteria. 4. Do snack bar items have to fall within any particular price range? ρ 1 Yes ρ 2 No ρ 3 Don’t know

Abt Associates Inc. Survey of SFA Directors 13
If yes, please explain or attach copy of price criteria.
5. Do snack bar items have to meet any particular nutrition standards? ρ 1 Yes ρ 2 No ρ 3 Don’t know If yes, please explain or attach copy of nutrition criteria.
6. In addition to regulations, laws, or guidelines put in place by USDA or state authorities, does
your school district prohibit any specific foods or beverages from being sold at snack bars? ρ 1 Yes ρ 2 No (Skip to Q 7) ρ 3 Don’t know (Skip to Q 7) 6a. Which foods or beverages are prohibited? (Check all that apply.) ρ 1 Coffee or coffee-based beverages ρ 2 Tea or tea-based beverages (including iced teas) ρ 3 All caffeinated beverages (some coffees, teas, colas, energy drinks) ρ 4 Carbonated soft drinks ρ 5 Juice drinks (less than 50 percent fruit juice, with added sweeteners) ρ 6 Other sweetened beverages (sports drinks, flavored waters with added
sweetener) ρ 7 All artificially sweetened beverages (diet soft drinks, Fruit20) ρ 8 Fried vegetables (french fries) ρ 9 High-fat snacks or baked goods ρ 10 High-sugar foods ρ 11 Candy ρ 12 Gum ρ 13 Other (Please specify): _________________________________________
Please attach a copy of the document that specifies the foods or beverages prohibited from being sold at snack bars in your school district.

14 Survey of SFA Directors Abt Associates Inc.
7. In addition to regulations, laws, or guidelines put in place by USDA or state authorities, does your school district require any specific foods or beverages to be sold at snack bars?
ρ 1 Yes ρ 2 No (Skip to Q 8) ρ 3 Don’t know (Skip to Q 8) 6a. Which foods or beverages are required? (Check all that apply.) ρ 1 Bottled water (unflavored, with no added sweeteners) ρ 2 Juice (100 percent juice) ρ 3 Milk (any type) ρ 4 Milk (skim, nonfat, or 1 percent low-fat) ρ 5 Low-fat snacks or baked goods ρ 6 Low-sugar foods ρ 7 Fresh fruit or vegetables ρ 8 Lean meats ρ 9 Whole grains ρ 10 Diet, “lite,” or sugar-free beverages ρ 11 Other (Please specify): _________________________________________
Please attach a copy of the document that specifies the foods or beverages required to be sold at snack bars in your school district.
8. Which of the following factors does your school district consider in setting prices for snack
bar items? (Check all that apply.) ρ 1 Food costs ρ 2 Product costs (wages, benefits, utilities, equipment, supplies, etc.) ρ 3 Administrative or indirect costs ρ 4 Incentive for student participation in reimbursable meal program ρ 5 Incentive for choosing more healthful foods/beverages (e.g., fruit priced
lower than baked goods) ρ 6 Ease of collecting payments ρ 7 Other (Please specify): _________________________________________ 9. Do you have nutrition information for foods and beverages sold in the snack bars in your
school district? That is, information on nutrient content from the manufacturer or distributor? ρ 1 Yes, for all foods/beverages ρ 2 Yes, for some foods/beverages ρ 2 No 10. Does the school food service operate a snack bar that sells food or beverages to students at
[SCHOOL]?

Abt Associates Inc. Survey of SFA Directors 15
ρ 1 Yes ρ 2 No (Skip to Section D) Please answer the following questions for the snack bar(s) operated by the school food service at [SCHOOL]. 11. Who receives the profits (i.e., revenue less costs) from the snack bar(s) at [SCHOOL]?
(Check all that apply.) ρ 1 Food service department ρ 2 School ρ 3 Athletic department ρ 4 Other school department or fund ρ 5 Student club ρ 6 Other (Please specify): _________________________________________ 11a. Approximately how much total profit is received by the school food service from the
snack bar(s) at [SCHOOL] (per year, month, or week)? Do not include profits that go to the principal or other school departments or funds.
$__________ per __________ 11b. How are the school food service profits from snack bar sales used? (Check all that
apply.) ρ 1 General fund ρ 2 Specific purpose (Please specify): ________________________________

16 Survey of SFA Directors Abt Associates Inc.
D. School Stores
1. Does the school food service in your district operate any school stores that sell food or beverages to students during the school day?
ρ 1 Yes, district-wide ρ 2 Yes, some schools ρ 3 No (Skip to Section E) 2. In what types of schools does the school food service operate school stores that sell food or
beverages? ρ 1 Elementary schools ρ 2 Middle or junior high schools ρ 3 High schools In addition to regulations, laws, or guidelines put in place by USDA or state authorities, please tell us if your school district restricts school store food/beverage items based on price or nutrition criteria. 3. Do school store food/beverage items have to fall within any particular price range? ρ 1 Yes ρ 2 No ρ 3 Don’t know If yes, please explain or attach copy of price criteria.
4. Do school store food/beverage items have to meet any particular nutrition standards? ρ 1 Yes ρ 2 No ρ 3 Don’t know If yes, please explain or attach copy of nutrition criteria.

Abt Associates Inc. Survey of SFA Directors 17
5. In addition to regulations, laws, or guidelines put in place by USDA or state authorities, does your school district prohibit any specific foods or beverages from being sold at the school store?
ρ 1 Yes ρ 2 No (Skip to Q 5) ρ 3 Don’t know (Skip to Q 6) 5a. Which foods or beverages are prohibited? (Check all that apply.) ρ 1 Coffee or coffee-based beverages ρ 2 Tea or tea-based beverages (including iced teas) ρ 3 All caffeinated beverages (some coffees, teas, colas, energy drinks) ρ 4 Carbonated soft drinks ρ 5 Juice drinks (less than 50 percent fruit juice, with added sweeteners) ρ 6 Other sweetened beverages (sports drinks, flavored waters with added
sweetener) ρ 7 All artificially sweetened beverages (diet soft drinks, Fruit20) ρ 8 Fried vegetables (french fries) ρ 9 High-fat snacks or baked goods ρ 10 High-sugar foods ρ 11 Candy ρ 12 Gum ρ 13 Other (Please specify): _________________________________________
Please attach a copy of the document that specifies the foods or beverages prohibited from being sold at school stores in your school district.
6. In addition to regulations, laws, or guidelines put in place by USDA or state authorities, does
your school district require any specific foods or beverages to be sold at the school store? ρ 1 Yes ρ 2 No (Skip to Q 7) ρ 3 Don’t know (Skip to Q 7)

18 Survey of SFA Directors Abt Associates Inc.
6a. Which foods or beverages are required? (Check all that apply.) ρ 1 Bottled water (unflavored, with no added sweeteners) ρ 2 Juice (100 percent juice) ρ 3 Milk (any type) ρ 4 Milk (skim, nonfat, or 1 percent low-fat) ρ 5 Low-fat snacks or baked goods ρ 6 Low-sugar foods ρ 7 Fresh fruit or vegetables ρ 8 Lean meats ρ 9 Whole grains ρ 10 Diet, “lite,” or sugar-free beverages ρ 11 Other (Please specify): _________________________________________
Please attach a copy of the document that specifies the foods or beverages required to be sold at school stores in your school district.
7. Which of the following factors does your school district consider in setting prices for food
and beverage items sold in the school store(s)? (Check all that apply.) ρ 1 Food costs ρ 2 Administrative or indirect costs ρ 3 Incentive for choosing more healthful foods/beverages (e.g., spring water
priced lower than soft drinks) ρ 4 Ease of collecting payments ρ 5 Other (Please specify): _________________________________________ 8. Do you have nutrition information for foods and beverages sold in the school stores in your
district? That is, information on nutrient content from the manufacturer or distributor? ρ 1 Yes, for all foods/beverages ρ 2 Yes, for some foods/beverages ρ 3 No 9. Does the school food service operate any school stores that sell food and/or beverages to
students during the school day at [SCHOOL]? ρ 1 Yes ρ 2 No (Skip to Section E) Please answer the following questions for the school store(s) operated by the school food service at [SCHOOL].

Abt Associates Inc. Survey of SFA Directors 19
10. Do you have or can you obtain information on the number sold for each food and beverage item in the school store(s) at [SCHOOL]?
ρ 1 Yes ρ 2 No (Skip to Q 11) Please attach a copy of your most recent invoice(s) or other documentation that includes this
information. 11. Who receives the profits (i.e., revenue less costs) from food and beverage sales at the school
store at [SCHOOL]? (Check all that apply.) ρ 1 Food service department ρ 2 School ρ 3 Athletic department ρ 4 Other school department or fund ρ 5 Student club ρ 6 Other (Please specify): _________________________________________ 11a. Approximately how much total profit is received by the school food service from
food and beverage sales at the school store(s) in [SCHOOL] (per year, month, or week)? Do not include profits that go to the principal or other school departments or funds.
$__________ per __________ 11b. How are school food service profits from food and beverage sales at the school store
in [SCHOOL] used? (Check all that apply.) ρ 1 General fund ρ 2 Specific purpose (Please specify): ________________________________

20 Survey of SFA Directors Abt Associates Inc.
E. Exclusive Beverage Contracts
1. Is your school district, or are any schools in your district, engaged in a “pouring rights” contract (that is, a long-term contract with a beverage company that establishes the company as a sole source vendor for some types of beverages? (Check one.)
ρ 1 Yes, district-wide ρ 2 Yes, some schools ρ 3 No (Skip to Section F) 1a. Who decides whether or not to enter into a pouring rights contract in your school
district? (Check all that apply.) ρ 1 School board ρ 2 Superintendent ρ 3 School district business manager ρ 4 Food service director ρ 5 Principal ρ 6 Cafeteria manager ρ 7 Other (Please specify): ____________________________________ 1b. Which types of schools are covered by the pouring rights contract? (Check all that
apply.) ρ 1 All elementary schools ρ 2 All middle or junior high schools ρ 3 All high schools ρ 4 Other (Please explain): ________________________________________ 2. Who is the contract with?
________________________________________ 3. For how many years does the contract last? _____ years

Abt Associates Inc. Survey of SFA Directors 21
4. What types of beverages are covered under the contract? (Check all that apply.) ρ 1 Carbonated soft drinks ρ 2 Naturally or artificially flavored fruit juices and fruit juice-containing
drinks ρ 3 Fruit-flavored drinks ρ 4 Ready-to-drink tea products ρ 5 Sports drinks ρ 6 Bottled water (all types) ρ 7 Other (Please specify): _________________________________________ 5. What is the guaranteed annual minimum commission provided by the beverage contract? $____________________ commission ρ Not applicable 6. What types of non-monetary benefits does the contract provide? (Check all that apply.) ρ 1 Athletic equipment ρ 2 Scoreboard ρ 3 Music department equipment ρ 4 Product for fundraisers ρ 5 Other (Please specify): _________________________________________ ρ 6 No non-monetary benefits provided 7. What percentage of beverage sales dollars are paid to the district and/or schools? _____% 8. Who receives the commission from the beverage contract? (Check all that apply.) ρ 1 Food service department ρ 2 School ρ 3 Athletic department ρ 4 Other school department or fund ρ 5 Student club ρ 6 Other (Please specify): _________________________________________ 9. What types of incentive payments are included in the contract? (Check all that apply.) ρ 1 Payment for exceeding target sales ρ 2 Payment for each vending machine placed ρ 3 Other (Please specify): _________________________________________ ρ 4 No incentive payments (Skip to Q 11)

22 Survey of SFA Directors Abt Associates Inc.
10. Who receives the incentives from the beverage contract? (Check all that apply.) ρ 1 Food service department ρ 2 School ρ 3 Athletic department ρ 4 Other school department or fund ρ 5 Student club ρ 6 Other (Please specify): _________________________________________ 11. Since starting the beverage contract, has the number of vending machines in your school
district increased? ρ 1 Yes ρ 2 No 12. Since starting the beverage contract, has the number of other in-school sites in your district
selling beverages, such as snack bars, school stores, or concession stands, increased? ρ 1 Yes ρ 2 No 13. Is your school district, or are any schools in your district, engaged in a long-term contract that
establishes a company as the sole source vendor for any food items (other than beverages)? ρ 1 Yes ρ 2 No (Skip to Section F) ρ 3 Don’t know (Skip to Section F)
13a. Who is the contract with? ________________________________________
13b. What types of food items are covered under the contract? __________________________________________________________________
__________________________________________________________________

Abt Associates Inc. Survey of SFA Directors 23

24 Survey of SFA Directors Abt Associates Inc.
F. Menu Planning and Computer Systems
1. Which of the following menu-planning options is currently used for [SCHOOL]? ρ 1 Nutrient Standard Menu Planning (NuMenus) ρ 2 Assisted Nutrient Standard Menu Planning (Assisted NuMenus) ρ 3 Enhanced Food-Based Menu Planning ρ 4 Traditional Food-Based Menu Planning ρ 5 Other (Please specify): _________________________________________ 2. Is a computerized system used for any of the following functions for [SCHOOL]? (Check all
that apply.) ρ 1 Nutrient analysis of menus ρ 2 Nutrient analysis of a la carte items ρ 3 Point-of-sale payment/meal counts ρ 4 Food inventory ρ 5 None of the above (Skip to Section G)
2a. Which software system is used for each of the function(s) indicated above? (If more than one system is used, please check the one used most often.)
Nutrient analysis menus
Nutrient analysis a la carte POS
Food inventory
Bon Appetite ο 1 ο 2 ο 3 ο 4
B.O.S.S. (Back Office Software Solutions)
ο 1 ο 2 ο 3 ο 4
CAFS (Computer-Assisted Food Service)
ο 1 ο 2 ο 3 ο 4
CAFE Terminal ο 1 ο 2 ο 3 ο 4
CompuHelp ο 1 ο 2 ο 3 ο 4
CNP Manager ο 1 ο 2 ο 3 ο 4
Keeping TRAC ο 1 ο 2 ο 3 ο 4
KYRUS (formerly AccuSERIES) ο 1 ο 2 ο 3 ο 4
Lunch Box (Kyrus Corp.) ο 1 ο 2 ο 3 ο 4
Mealtime (Energetics) ο 1 ο 2 ο 3 ο 4
Mealtime (CLM Group, Inc.) ο 1 ο 2 ο 3 ο 4
Meal Tracker (Accu-Scan) ο 1 ο 2 ο 3 ο 4
Netel ο 1 ο 2 ο 3 ο 4
NutriKids ο 1 ο 2 ο 3 ο 4

Abt Associates Inc. Survey of SFA Directors 25
Nutrient analysis menus
Nutrient analysis a la carte POS
Food inventory
NutriMenu 2001 ο 1 ο 2 ο 3 ο 4
Nutrition Data Systems ο 1 ο 2 ο 3 ο 4
PCS Revenue Control Systems ο 1 ο 2 ο 3 ο 4
SNAP Systems ο 1 ο 2 ο 3 ο 4
WinSNAP/WebSMARTT ο 1 ο 2 ο 3 ο 4
Custom-developed system ο 1 ο 2 ο 3 ο 4
Other software system (Please specify): __________________________________________________________
ο 1 ο 2 ο 3 ο 4
No software for this function ο 1 ο 2 ο 3 ο 4

26 Survey of SFA Directors Abt Associates Inc.
G. Food Service Management
1. Is the food service operation in your school district currently under the direction of a food service management company?
ρ 1 Yes ρ 2 No (Skip to Section H)
1a. Are you employed by the food service management company or by the school
district? (Check one.) ρ 1 Management company ρ 2 School district ρ 3 Consultant ρ 4 Other (Please specify): _________________________________________
1b. Who employs the food service cafeteria workers at [SCHOOL]?
ρ 1 Management company ρ 2 School district ρ 3 Other (Please specify): _________________________________________
2. Is the food service management company involved in providing a la carte service at
[SCHOOL]? ρ 1 Yes ρ 2 No (Skip to Section H)
2a. For each of the a la carte food service functions listed below, indicate if it is
performed by the school district, the food service management company, or jointly by the school district and the food service management company. (Check one answer for each line.)
Food service functions School district
Food service management
company Jointly
performed
Planning a la carte menus ο 1 ο 2 ο 3
A la carte food purchases, including:
Vendor selection ο 1 ο 2 ο 3
Food selection ο 1 ο 2 ο 3
Determining quantities ordered ο 1 ο 2 ο 3
Preparing a la carte items ο 1 ο 2 ο 3
Serving a la carte items ο 1 ο 2 ο 3

Abt Associates Inc. Survey of SFA Directors 27
3. Other than reimbursable meals or a la carte service, is the food service management company involved in providing other sources of food at [SCHOOL]?
ρ 1 Yes ρ 2 No (Skip to Section H)
3a. For which other sources of foods is the management company involved? ρ 1 Vending machines ρ 2 Snack bars (including canteens, food carts, kiosks) ρ 3 School store ρ 4 Other (Please specify): _________________________________________

28 Survey of SFA Directors Abt Associates Inc.
H. Survey Information
1. Did you need to consult other district or school personnel to complete this survey? ρ 1 Yes ρ 2 No (Skip to Q 2)
1a. For each section of the survey, please check if other personnel were consulted and
indicate their title. ρ 1 A la carte ____________________________________________________
ρ 2 Vending machines _____________________________________________
ρ 3 Snack bars ___________________________________________________
ρ 4 School stores _________________________________________________
ρ 5 Exclusive beverage contracts ____________________________________
ρ 6 Menu planning and computer systems _____________________________
ρ 7 Food service management _______________________________________
2. Please estimate the time it took you to complete the following: Gathering information: __________________________________
Consulting with other staff: __________________________________
Completing questionnaire: __________________________________
Thank you for taking the time to complete this survey. Your cooperation is very much appreciated.

Study of Foods in the School Environment
Cafeteria Survey
Target Week:
Monday _____ / _____ / _____ MONTH DAY YEAR
through
Friday _____ / _____ / _____
MONTH DAY YEAR
If you have questions or need assistance, please call 617-349-2674 or 617-349-2661
Spring 2003 The Study of Foods in the School Environment is being conducted for the: Food and Nutrition Service US Department of Agriculture 3101 Park Center Drive Alexandria, Virginia 22302 By: Abt Associates Inc. 55 Wheeler Street Cambridge, Massachusetts 02138

Daily Meal Counts Form
School Name: ______________________________________ For each day of the target week, please write in the number of USDA reimbursable meals served in your school. Please write the number of free meals, reduced-price meals, and full-price meals, as well as the total number of meals. Do not include meals for which you do not claim reimbursement, for example, second lunches sold to students on an a la carte basis. Number of Reimbursable Lunches Served
Day of Week Free Reduced-
Price Full-Price Total
Monday
Tuesday
Wednesday
Thursday
Friday
Number of Reimbursable Breakfasts Served
Day of Week Free Reduced-
Price Full-Price Total
Monday
Tuesday
Wednesday
Thursday
Friday
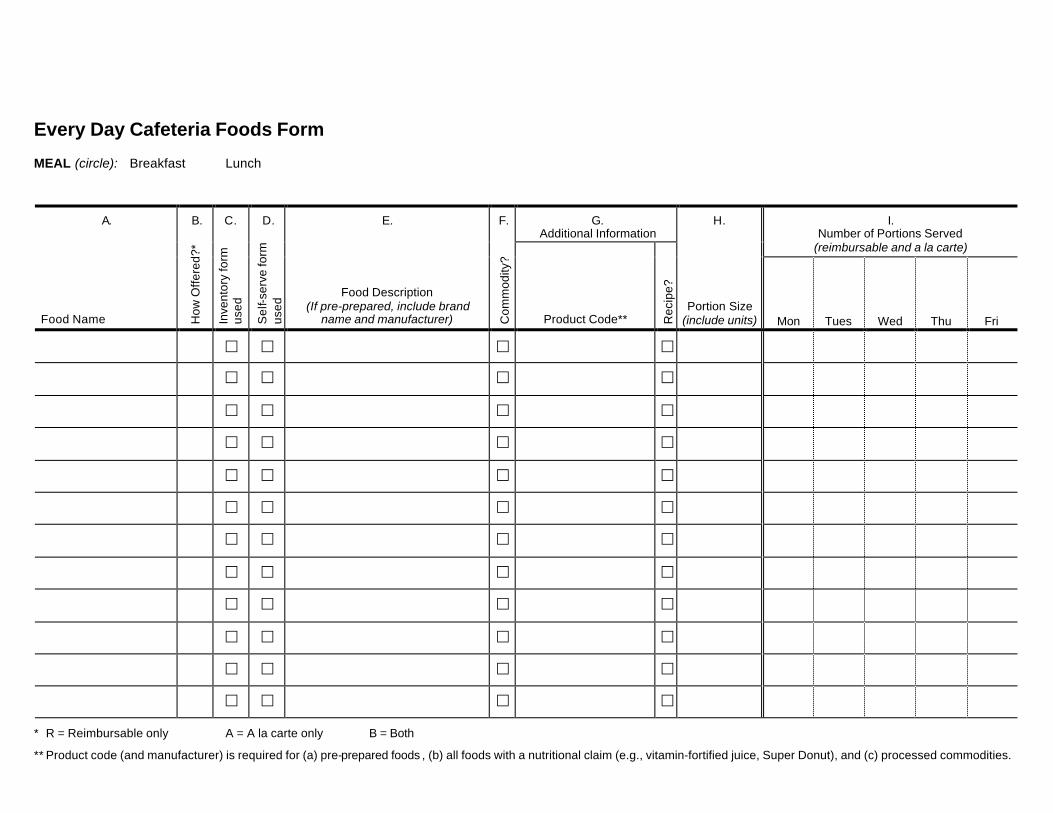
Every Day Cafeteria Foods Form MEAL (circle): Breakfast Lunch
A. B. C. D. E. F. G. Additional Information
H. I. Number of Portions Served
(reimbursable and a la carte)
Food Name How
Offe
red?
*
Inve
ntor
y fo
rm
used
Sel
f-ser
ve fo
rm
used
Food Description (If pre-prepared, include brand
name and manufacturer) Com
mod
ity?
Product Code** Rec
ipe?
Portion Size (include units) Mon Tues Wed Thu Fri
£ £ £ £
£ £ £ £
£ £ £ £
£ £ £ £
£ £ £ £
£ £ £ £
£ £ £ £
£ £ £ £
£ £ £ £
£ £ £ £
£ £ £ £
£ £ £ £
* R = Reimbursable only A = A la carte only B = Both
** Product code (and manufacturer) is required for (a) pre-prepared foods , (b) all foods with a nutritional claim (e.g., vitamin-fortified juice, Super Donut), and (c) processed commodities.

Inventory of Every Day Prepackaged Foods Use this form for prepackaged foods offered every day and requiring no preparation, and prepackaged condiments.
A. B. C. D. Starting Inventory
E. Deliveries
(Specify units, e.g., cs = case, pk = pkg, ea = each)
F. Ending Inventory
Food Name/Description (include brand name and manufacturer)
Bulk Packaging Information
(Type and number per pkg)
Individual Package Size
(e.g., # ounces)
# Cases/ Pkgs
# Indiv. Pkgs Mon Tues Wed Thur Fri
# Cases/ Pkgs
# Indiv. Pkgs
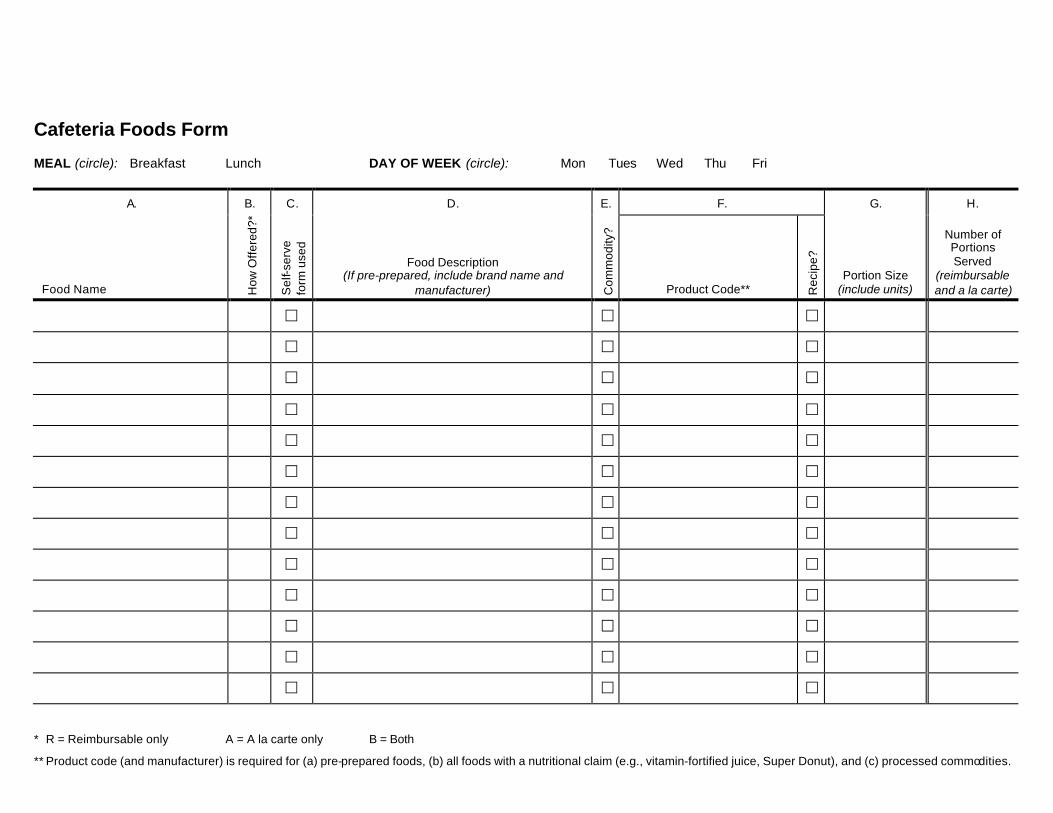
Cafeteria Foods Form MEAL (circle): Breakfast Lunch DAY OF WEEK (circle): Mon Tues Wed Thu Fri
A. B. C. D. E. F. G. H.
Food Name How
Offe
red?
*
Sel
f-ser
ve
form
use
d
Food Description (If pre-prepared, include brand name and
manufacturer) Com
mod
ity?
Product Code** Rec
ipe?
Portion Size (include units)
Number of Portions Served
(reimbursable and a la carte)
£ £ £
£ £ £
£ £ £
£ £ £
£ £ £
£ £ £
£ £ £
£ £ £
£ £ £
£ £ £
£ £ £
£ £ £
£ £ £
* R = Reimbursable only A = A la carte only B = Both
** Product code (and manufacturer) is required for (a) pre-prepared foods, (b) all foods with a nutritional claim (e.g., vitamin-fortified juice, Super Donut), and (c) processed commodities.

Self-Serve Bar Form Name of Bar: ________________________________________ Number of Servings from Bar: __________ MEAL (circle): Breakfast Lunch DAY OF WEEK (circle): All Mon Tues Wed Thu Fri
A. B. C. D. Additional Information
E. F. Production Information
Food Name
Food Description (If pre-prepared, include brand name and
manufacturer) Com
mod
ity?
Product Code* Rec
ipe?
Portion Size (if pre-portioned or portioned by
server) Starting Amount
Amount Added
Amount Left Over
£ £
£ £
£ £
£ £
£ £
£ £
£ £
£ £
£ £
£ £
£ £
£ £
£ £
* Product code (and manufacturer) is required for (a) pre-prepared foods, (b) all foods with a nutritional claim (e.g., vitamin-fortified juice, Super Donut), and (c) processed commodities.

Recipe Form Recipe/Food Name: _____________________________________________________________________ Meal (circle): Breakfast Lunch Day of Week (circle): All Mon Tues Wed Thu Fri No. servings prepared: __________ Size of one se rving: __________ Check the box next to the option you select for completing this form: £ Side 1 and side 2 of Recipe Form completed
£ Copy of recipe attached to side 1 of Recipe Form. Side 2 of form completed. Note: If you attach a copy of a printed recipe, remember to edit the recipe, if necessary, to show how the recipe was prepared in your school.
A. B. C. D. Additional Information
E.
Ingredient Name
Ingredient Description (If pre-prepared, include brand name and
manufacturer) Com
mod
ity?
Product Code* Rec
ipe?
Amount in Recipe (include
units)
£ £
£ £
£ £
£ £
£ £
£ £
£ £
£ £
£ £
£ £
£ £
£ £
£ £
£ £
£ £
* Product code (and manufacturer) is required for (a) pre-prepared foods, (b) all foods with a nutritional claim (e.g.,
vitamin-fortified juice, Super Donut), and (c) processed commodities.

Recipe Form (Side 2)
Please check (T) the boxes below to describe the procedures used in preparing this recipe. 1. If recipe was cooked, what cooking method did you use? (Check all that apply.)
£ Bake/roast £ Pan fry/sauté £ Boil £ Oven heat £ floured £ Steam £ Microwave/warmer £ battered £ Other (Please specify): £ Broil/grill £ Deep fry ___________________ £ floured ___________________ £ battered £ Does not apply to recipe
2. If recipe contains meat or poultry, was amount measured raw or cooked? £ Does not apply to recipe (Skip to Q4) £ Raw £ Cooked 3. If recipe contains meat or poultry did you . . . (Check all that apply.)
Trim the visible fat? £ Yes £ No £ Does not apply to recipe
Drain fat after cooking? £ Yes £ No £ Does not apply to recipe
Rinse with hot water, drain fat, and then rinse again?
£ Yes £ No £ Does not apply to recipe
Remove skin before cooking? £ Yes £ No £ Does not apply to recipe 4. If recipe contains noodles, rice, or vegetables did you add salt to the cooking water?
Noodles/pasta or rice £ Yes £ No £ Does not apply to recipe
Vegetables £ Yes £ No £ Does not apply to recipe
5. If recipe contains canned vegetables or canned fruit, did you drain off all of the liquid?
£ Yes £ No £ Does not apply to recipe
COMMENTS

Food Outside Meal Periods Checklist
Instructions: Answer Question 1 below. If your answer is “no,” you do not need to complete this checklist. If you answer “yes,” continue to Question 2 and complete the checklist.
1. Are students allowed to come to the cafeteria to purchase food or beverages between meals? 1 Yes (Continue) 2 No (Do not complete this form) 2. What hours may students purchase food or beverages between meals? (Check all that apply and
specify hours.) 1 Before breakfast, from ____ : ____ to ____ : ____ a.m. 2 After breakfast and before classes start, from ____ : ____ to ____ : ____
a.m. 3 After start of classes and before lunch, from ____ : ____ to ____ : ____ 4 After lunch and before school ends, from ____ : ____ to ____ : ____ p.m. 5 After last class, from ____ : ____ to ____ : ____ p.m. Place a check mark in the box corresponding to each food and/or beverage for sale outside the regular breakfast and lunch periods during the target week. For example, if students can purchase muffins between breakfast and lunch, or if any foods are available all day, check them on this form. Do not include foods sold only to teachers or other adults.
A. Beverages 1 Carbonated soft drinks (cola – sweetened, cola – diet, non-cola – sweetened,
non-cola – diet) 2 Juice (ρ 100% juice / ρ 50% juice) 3 Juice drinks (cranberry drink, fruit blends, Hi-C, lemonade, punch) 4 Water (ρ spring water, sparkling water, mineral water, seltzer water /
ρ flavored water with sweetener or fruit juice) 5 Coffee or coffee-based (ρ Regular / ρ Decaffeinated) 6 Tea or tea-based (ρ Regular / ρ Decaffeinated) 7 Hot chocolate 8 Yogurt drinks 9 Energy and sports drinks (Gatorade, Powerade, Red Bull) 10 Other (Please specify): __________________________________________

B. Dairy 1 Whole milk 2 Low fat (2%) white milk 3 1% white milk 4 Fat-free milk (skim, nonfat) 5 Flavored milk (ρ Whole or 2% / ρ Fat- free or 1%) 6 Yogurt 7 Cheese (ρ Part-skim, string / ρ Regular fat) C. Baked Goods - Dessert 1 Cake-type (brownies, cupcakes, Twinkies) 2 Cookies 3 Pastries (pies, turnovers) 4 Other (Please specify): __________________________________________ D. Bread or Grain Products 1 Regular bread (bread, rolls, bagels) 2 Other bread (biscuits, croissants, hot pretzels) 3 Muffins 4 Granola bars 5 Pretzels 6 Crackers/Cracker sandwiches (ρ peanut butter / ρ cheese) 7 Cereal/Cereal bars 8 Other (Please specify): __________________________________________ E. Frozen Desserts 1 Frozen non-dairy (fruit bars, Jello Pops, Popsicles) 2 Ice cream (Bars, cups, Fudgsicles, sundaes) 3 Low-fat frozen desserts (frozen yogurt, ice milk, sherbet) F. Fruit and Vegetables 1 Canned, cooked fruit 2 Fresh fruit 3 Fruit salad (ρ fresh / ρ canned) 4 Dried fruit 5 Vegetables, side salad 6 Other fresh vegetables

G. Snacks 1 Chips (corn, potato, puffed cheese, tortilla) 2 Nuts and seeds (almonds, peanuts, sunflower seeds, trail mix) 3 Fruit roll-ups or fruit snacks 4 Popcorn 5 Meat snacks (jerky, pork rinds) 3 Candy (ρ with chocolate / ρ without chocolate) 6 Energy bars (Balance Bars, Luna Bars, Power Bars) 7 Other (Please specify): __________________________________________ H. Pre-prepared Entrees 1 Hamburgers or cheeseburgers 2 Hot dogs 3 Other sandwiches 4 Meal-side salad 5 Pizza 6 Pasta I. Other (Please specify): ____________________________________________________ ________________________________________________________________________ ________________________________________________________________________ ________________________________________________________________________ ________________________________________________________________________ ________________________________________________________________________

Snack Bar Foods Form Location of Snack Bar: __________________________________________________________
A. B. C. D. E. F. Additional Information
G. H.
Number of Items Sold
Food Name How
Offe
red?
*
Inve
ntor
y F
orm
Use
d
Food Description (If pre-prepared, include brand name
and manufacturer) Com
mod
ity?
Product Code** Rec
ipe?
Portion Size (include units) Mon Tues Wed Thu Fri
£ £ £
£ £ £
£ £ £
£ £ £
£ £ £
£ £ £
£ £ £
£ £ £
£ £ £
£ £ £
£ £ £
£ £ £
* R = Reimbursable only A = A la carte only B = Both
** Product code (and manufacturer) is required for (a) pre-prepared foods, (b) all foods with a nutritional claim (e.g., vitamin-fortified juice, Super Donut), and (c) processed commodities.

Starting Inventory Taken: __ __ : __ __ a.m./p.m.
Ending Inventory Taken: __ __ : __ __ a.m./p.m.
Inventory of Snack Bar Prepackaged Foods Use this form for prepackaged snack bar foods requiring no preparation and prepackaged condiments.
A. B. C. D. Starting Inventory
E. Deliveries
(Specify units, e.g., cs = case, pk = pkg, ea = each)
F. Ending Inventory
Food Name/Description (Include brand name and manufacturer)
Bulk Packaging Information
(Type and number per pkg)
Individual Package Size
(e.g., no. ounces)
# Cases/ Pkgs
# Indiv. Pkgs Mon Tues Wed Thur Fri
# Cases/ Pkgs
# Indiv. Pkgs

Starting Inventory Taken: __ __ : __ __ a.m./p.m.
Ending Inventory Taken: __ __ : __ __ a.m./p.m.
Inventory of School Store Food and Beverage Items Location of School Store: _______________________________________________________
A. B. C. D. Starting Inventory
E. Deliveries
(Specify units, e.g., cs = case, pk = pkg, ea = each)
F. Ending Inventory
Food Name/Description (Include brand name and manufacturer)
Bulk Packaging Information
(Type and number per pkg)
Individual Package Size
(e.g., no. ounces)
# Cases/ Pkgs
# Indiv. Pkgs Mon Tues Wed Thur Fri
# Cases/ Pkgs
# Indiv. Pkgs

Starting Inventory Taken: __ __ : __ __ a.m./p.m.
Ending Inventory Taken: __ __ : __ __ a.m./p.m.
Inventory of Vending Machine Items Location of Vending Machine: __________________________________________________________ Vending Machine # (if applicable): _____________
A. B. C. Number of Items in Vending Machine
E. Number Added Vending Slot
Number/Code (if applicable)
Food Name/Description (Include brand name and manufacturer. If prepared item,
attach recipe)
Individual Package Size
(e.g., no. ounces)
D. Starting Number Mon Tues Wed Thur Fri
F. Ending Number


![[ FUNCTIONAL FOODS & NATURAL HEALTH PRODUCTS ] · PDF file[ FUNCTIONAL FOODS & NATURAL HEALTH PRODUCTS ] Canada’s competitive advantages [ FUNCTIONAL FOODS & NATURAL HEALTH PRODUCTS](https://img.dokumen.tips/doc/110x75/5ab052247f8b9a190d8e7c56/-functional-foods-natural-health-products-functional-foods-natural-health-products.jpg)