Embed Size (px)
Citation preview

Measuring and Modeling of Formwork Pressure of Self-Consolidating
Concrete
Prof. David Lange and Jacob HenschenUniversity of Illinois at Urbana-Champaign
Regensburg, Germany – March 12, 2014

Greetings from the University of Illinois

Self-consolidating concrete (SCC)
• Continuous casting
• Higher casting rates
• No vibration necessary
• Casting in dense reinforcement
www.selfconsolidatingconcrete.org
3

Formwork Pressure
• Higher fluidity leads to higher lateral pressures on the formwork
4
5
Over 40ft tall wall
Nominal strength1600 pcf
One pour.How fast?

Formwork standards• ACI 347
– Forms for highly fluid concrete must withstand full hydrostatic pressure
• DIN 18218:2010-01
– Recently revised to account for fluidity of SCC
6
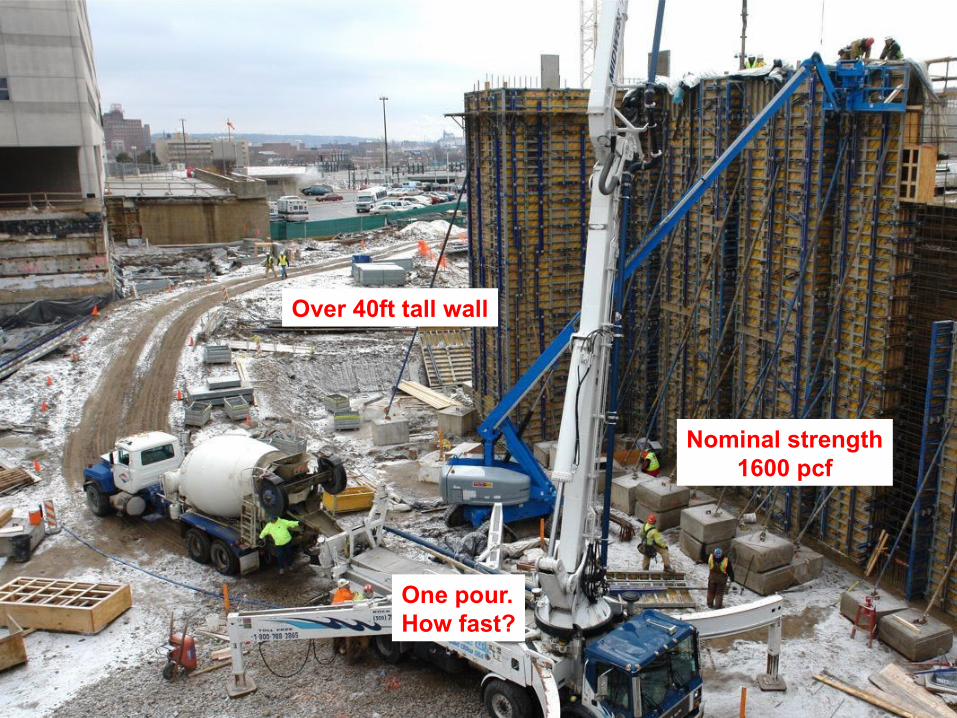
Measured pressures
• Maximum pressures typically lower than hydrostatic
7

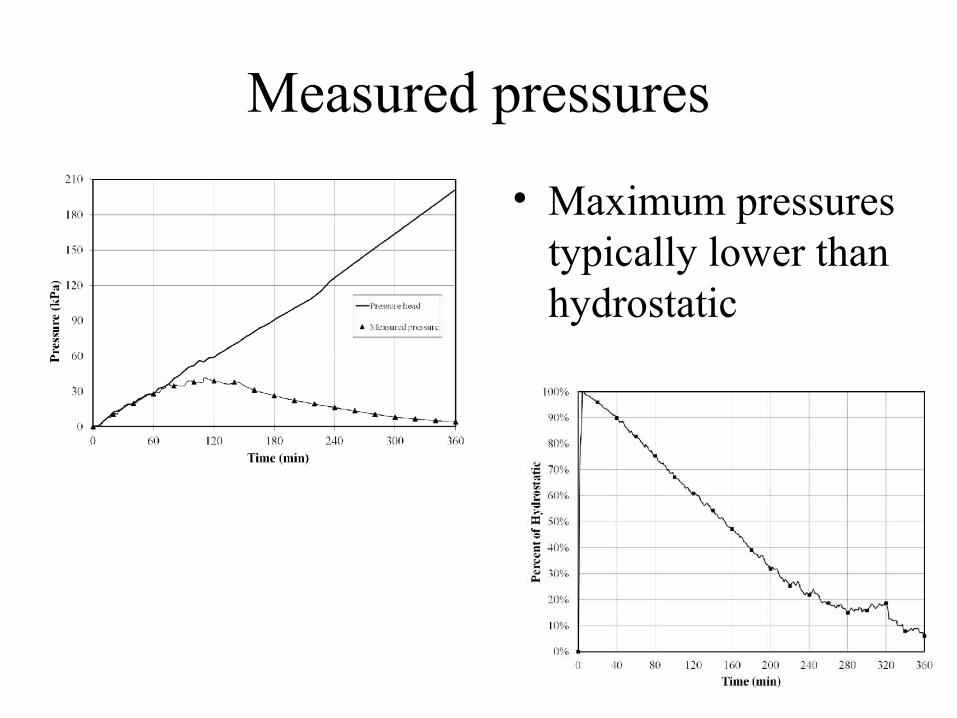
Field measurements have shown that…
h
Maximum Pressure Envelope
Maximum Pressure Envelope
h
8

Field measurements have shown that…
h
Maximum Pressure Envelope
Maximum Pressure Envelope
h
9

Field measurements have shown that…
h
Maximum Pressure Envelope
Maximum Pressure Envelope
h
10

Field measurements have shown that…
h
Maximum Pressure Envelope
Maximum Pressure Envelope
h
11
Field measurements have shown that…
h
Maximum Pressure Envelope
Maximum Pressure Envelope
h
12

Field measurements have shown that…
h
Maximum Pressure Envelope
Maximum Pressure Envelope
h
13
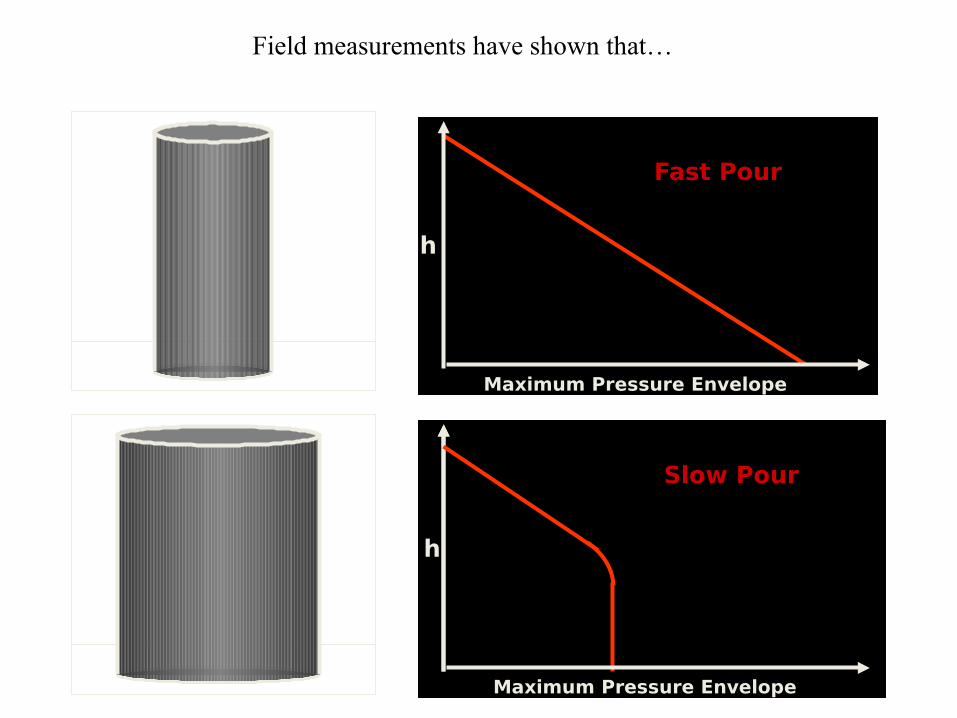
Field measurements have shown that…
h
h
Maximum Pressure Envelope
Maximum Pressure Envelope
Fast Pour
Slow Pour
14

Mechanisms of form pressure decay
• The main factors:
– Internal friction
– Aggregate contact and tendency to settle/consolidate
– “Skeleton” structure
– Higher agg content leads to rapid pressure decay
– Thixotropy
– Tendency of concrete to gel when at rest
– Shear strength increases even before “set” occurs
– Greater thixotropy leads to rapid pressure decay

Can we accurately model formwork pressure?
• Minimize testing
• Accurate and robust
• Field deployment
16

First step, measuring formwork pressure
• Honeywell full bridge pressure transducer
• Sensor brackets hold sensor face flush to formwork surface
17

Lab testing• Pressure decay rate consistent
at varying depths
• Vibration and admixtures alter pressure decay
18
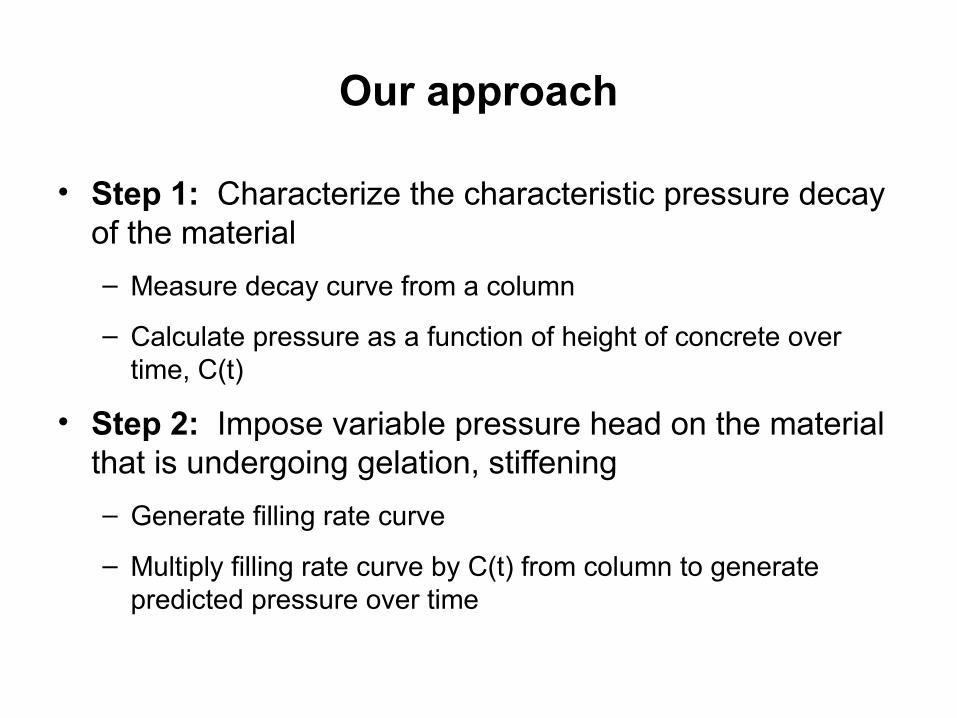
Our approach
• Step 1: Characterize the characteristic pressure decay of the material
– Measure decay curve from a column
– Calculate pressure as a function of height of concrete over time, C(t)
• Step 2: Impose variable pressure head on the material that is undergoing gelation, stiffening
– Generate filling rate curve
– Multiply filling rate curve by C(t) from column to generate predicted pressure over time

Step 1
1 m
Filled quickly to generate maximum pressure
Pressure measured while material is at rest
20

“decay signature”
• Normalize pressure
• Apply numerical approximation of curve
21
( )α1)(
2
0mod
+=
at
CtC

Step 2
• Apply overburden pressure head
• Use unit weight of concrete
Pressure = Model x Unit weight x Casting rate
22
)()()( thtCtP ××= γ

Field Validations
• Illinois DOT I-74 retaining walls
• OSF Hospital Milestone Project
• Stockholm Round Robin Tests
23

Field Validation #1Illinois DOT I-74 retaining walls
24

I-74 Retaining wall
• SCC used for aesthetics
• Slump flow: 71 cm
• Wall height: ~7 m
• Placed with tremie or pump
25

Wall 8511 Panel 9-10
• Height 6.0 m
• 2 sensors at 5.6 m from top
– 1 at bulkhead
– 2 under drop chute
26

Wall 81 Panel R
• Height: 2 m
• 2 sensors at 1.7 m
– 1 under drop chute
– 2 at bulkhead
27

Field Validation #2OSF Hospital Milestone Project
28
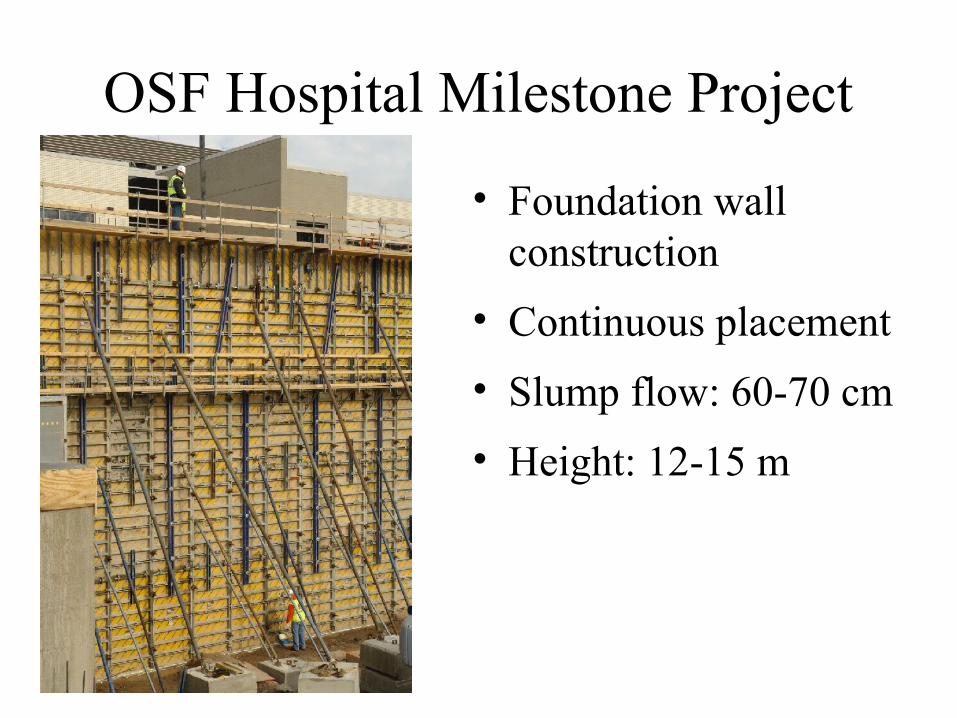
OSF Hospital Milestone Project
• Foundation wall construction
• Continuous placement
• Slump flow: 60-70 cm
• Height: 12-15 m
29

Wall #1
30

Wall #2
31

Wall #3Plan View
Drop chutes
32

Field Trial Summary
33

34
IlliForm: Model implemented in Excel

Field Validation #3Stockholm Round Robin Tests
35

Round robin tests in Stockholm for 10 different form pressure models
• RILEM TC 233-FPC
– Stockholm, June 2012
– Comparison of 10 models
– Theoretical
– Lab tests
– Field tests
– 8 wall sections tested over 4 days
Height: 4.2 m
Height: 6.6 m
36
Reference: Billberg, P et. al, “Field validation of models for predicting lateral form pressure exerted by SCC,” Cement and Concrete Composites, accepted 2014.

Corresponding author: Peter H. Billberga
Nicolas Rousselb, Sofiane Amzianec, Marc Beitzeld, George Charitoue,Björn Freundf, John N. Gardnerg, Guillaume Grampeixh, Carl-Alexander Graubneri, Lloyd Kellerj, Kamal H. Khayatk, David A. Langel, Ahmed F. Omranm, Arnaud Perrotn, Tilo Proskeo, Robert Quattrociocchip, Yannic Vanhoveq
37
Reference: Billberg, P et. al, “Field validation of models for predicting lateral form pressure exerted by SCC,” Cement and Concrete Composites, accepted 2014.
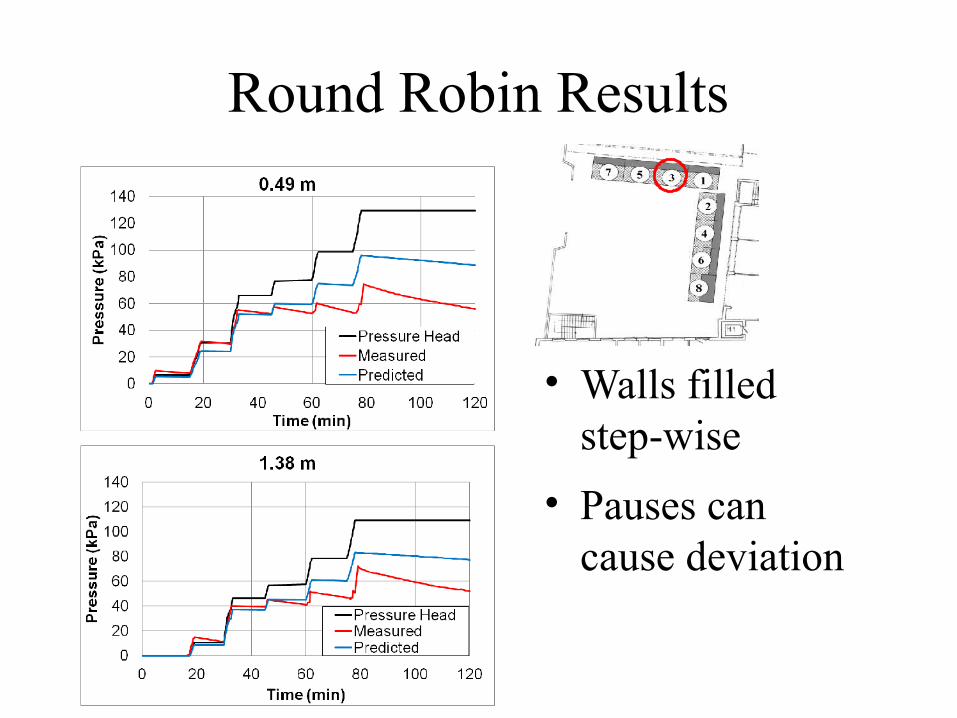
Round Robin Results
• Walls filled step-wise
• Pauses can cause deviation
38

Round Robin Results
39
Decay curves Maximum pressure
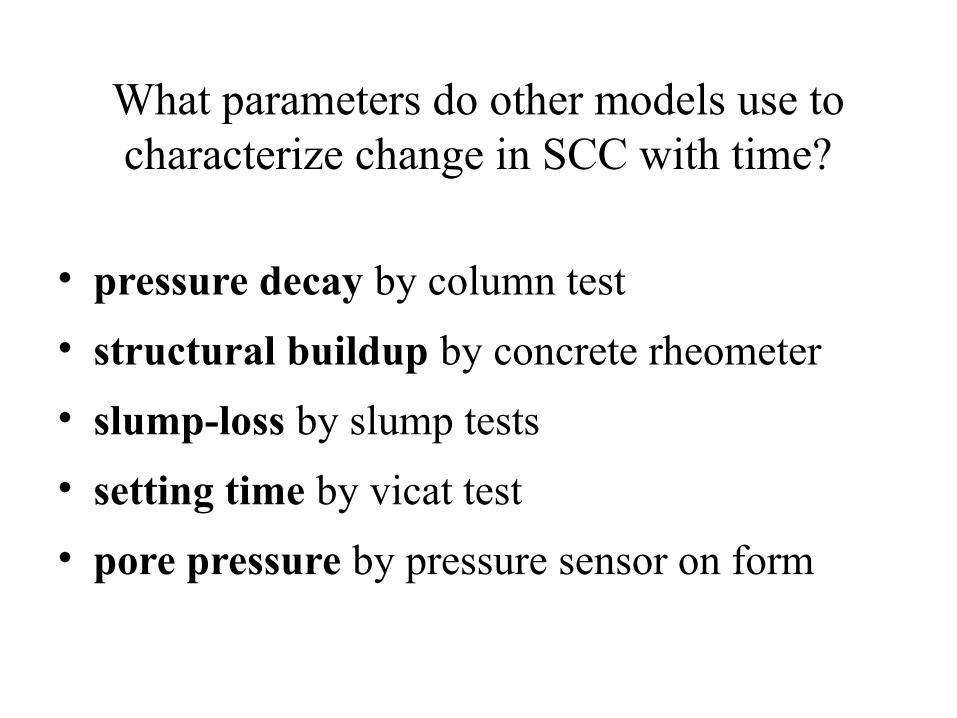
What parameters do other models use to characterize change in SCC with time?
• pressure decay by column test
• structural buildup by concrete rheometer
• slump-loss by slump tests
• setting time by vicat test
• pore pressure by pressure sensor on form
40

0
20
40
60
80
100
120
140
0 20 40 60 80 100 120 140
Predicted pressure (kPa)
Measured pressure (kPa)
Wall 2 Wall 3Wall 4 Wall 5Wall 6 Wall 7Wall 8 1:1
y = 1,09xR² = 0,80
N=25
0
20
40
60
80
100
120
140
0 20 40 60 80 100 120 140
Predicted pressure (kPa)
Measured pressure (kPa)
Wall 1 Wall 2Wall 3 Wall 4Wall 5 Wall 6Wall 7 Wall 81:1
y = 1,16xR² = 0,79
N=28
0
20
40
60
80
100
120
140
0 20 40 60 80 100 120 140
Predicted pressure (kPa)
Measured pressure (kPa)
Wall 1 Wall 2Wall 3 Wall 4Wall 5 Wall 6Wall 7 Wall 81:1
y = 1,22xR² = 0,77
N=28
0
20
40
60
80
100
120
140
0 20 40 60 80 100 120 140
Predicted pressure (kPa)
Measured pressure (kPa)
Wall 1 Wall 2Wall 3 Wall 4Wall 5 Wall 6Wall 7 Wall 81:1
y = 1,20xR² = 0,81
N=28
0
20
40
60
80
100
120
140
0 20 40 60 80 100 120 140
Predicted pressure (kPa)
Measured pressure (kPa)
Wall 1 Wall 2Wall 3 Wall 4Wall 5 Wall 6Wall 7 Wall 81:1
y = 1,30xR² = 0,86
N=28
0
20
40
60
80
100
120
140
0 20 40 60 80 100 120 140
Predicted pressure (kPa)
Measured pressure (kPa)
Wall 1 Wall 2Wall 3 Wall 4Wall 5 Wall 6Wall 7 Wall 81:1
y = 1,23xR² = 0,82
N=28
0
20
40
60
80
100
120
140
0 20 40 60 80 100 120 140
Predicted pressure (kPa)
Measured pressure (kPa)
Wall 1 Wall 2Wall 3 Wall 4Wall 5 Wall 6Wall 7 Wall 81:1
y = 1,37xR² = 0,85
N=28
0
20
40
60
80
100
120
140
0 20 40 60 80 100 120 140
Predicted pressure (kPa)
Measured pressure (kPa)
Wall 1 Wall 2Wall 3 Wall 4Wall 5 Wall 6Wall 7 Wall 81:1
y = 1,42xR² = 0,85
N=28
0
20
40
60
80
100
120
140
0 20 40 60 80 100 120 140
Predicted pressure (kPa)
Measured pressure (kPa)
Wall 1 Wall 2Wall 3 Wall 4Wall 5 Wall 6Wall 7 Wall 81:1
y = 1,23xR² = 0,69
N=28
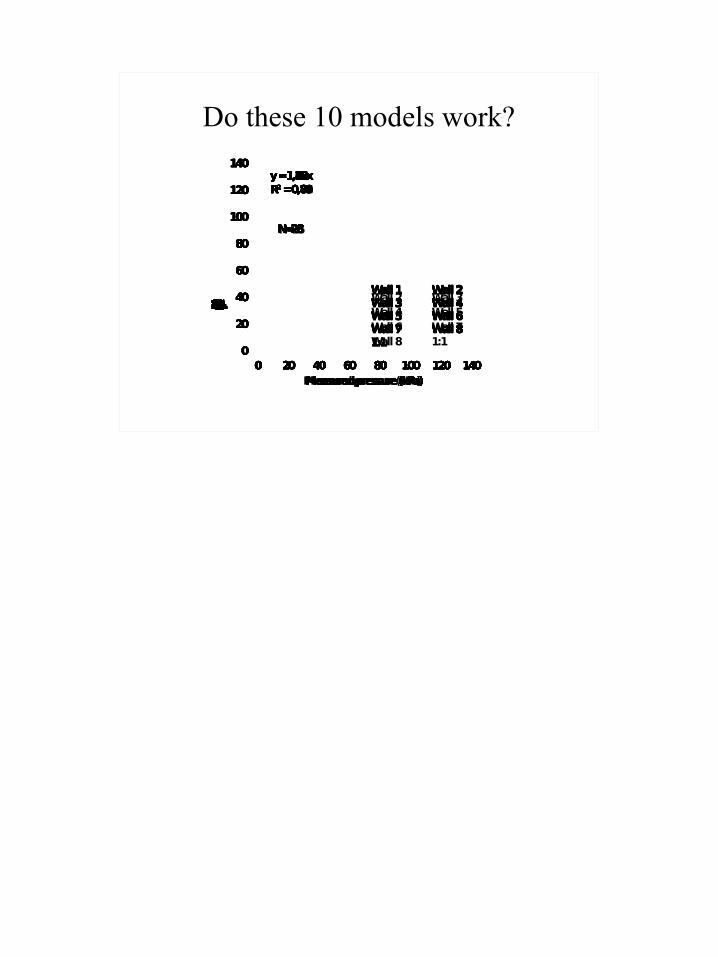
Do these 10 models work?
41
0
20
40
60
80
100
120
140
0 20 40 60 80 100 120 140
Predicted pressure (kPa)
Measured pressure (kPa)
Wall 1 Wall 2Wall 3 Wall 4Wall 5 Wall 6Wall 7 Wall 81:1
y = 1,40xR² = 0,85
N=28

Comparison of Models
42
Model Slope R2
Khayat/Omran 1.16 0.78Ovarlez/Roussel 1.22 0.77Lange/Tejeda-Dominguez 1.09 0.80Perrot et al 1.20 0.71Gardner et al 1.30 0.86Beitzel 1.23 0.82Proske mean 1.23 0.69Proske design 1.40 0.85DIN 18218 mean 1.37 0.85DIN 18218 design 1.42 0.85Average 1.26

Summary
• Formwork pressure of SCC is difficult to characterize with a single parameter i.e. filling rate or slump flow
• Pressure decay signature approach provides reasonable prediction of formwork pressure
• Several modeling approaches have been developed based, giving industry a choice of tools to use for pressure prediction
43

Acknowledgements
Swedish Cement and Concrete Research Institute (CBI)
Development Fund of the Swedish Construction Industry (SBUF)
44
Our projects: Stockholm Round Robin:

Measuring and Modeling of Formwork Pressure of Self-Consolidating
Concrete
Prof. David Lange and Jacob HenschenUniversity of Illinois at Urbana-Champaign
Regensburg, Germany – March 12, 2014
1

2
Greetings from the University of Illinois

Self-consolidating concrete (SCC)
• Continuous casting
• Higher casting rates
• No vibration necessary
• Casting in dense reinforcement
www.selfconsolidatingconcrete.org
3

Formwork Pressure
• Higher fluidity leads to higher lateral pressures on the formwork
4

5
5
5
Over 40ft tall wall
Nominal strength1600 pcf
One pour.How fast?

Formwork standards• ACI 347
– Forms for highly fluid concrete must withstand full hydrostatic pressure
• DIN 18218:2010-01
– Recently revised to account for fluidity of SCC
6

Measured pressures
• Maximum pressures typically lower than hydrostatic
7

8
Field measurements have shown that…
h
Maximum Pressure Envelope
Maximum Pressure Envelope
h
8

9
Field measurements have shown that…
h
Maximum Pressure Envelope
Maximum Pressure Envelope
h
9

10
Field measurements have shown that…
h
Maximum Pressure Envelope
Maximum Pressure Envelope
h
10

11
Field measurements have shown that…
h
Maximum Pressure Envelope
Maximum Pressure Envelope
h
11

12
Field measurements have shown that…
h
Maximum Pressure Envelope
Maximum Pressure Envelope
h
12

13
Field measurements have shown that…
h
Maximum Pressure Envelope
Maximum Pressure Envelope
h
13

14
Field measurements have shown that…
h
h
Maximum Pressure Envelope
Maximum Pressure Envelope
Fast Pour
Slow Pour
14

15
Mechanisms of form pressure decay
• The main factors:
– Internal friction
– Aggregate contact and tendency to settle/consolidate
– “Skeleton” structure
– Higher agg content leads to rapid pressure decay
– Thixotropy
– Tendency of concrete to gel when at rest
– Shear strength increases even before “set” occurs
– Greater thixotropy leads to rapid pressure decay

Can we accurately model formwork pressure?
• Minimize testing
• Accurate and robust
• Field deployment
16

First step, measuring formwork pressure
• Honeywell full bridge pressure transducer
• Sensor brackets hold sensor face flush to formwork surface
17

Lab testing• Pressure decay rate consistent
at varying depths
• Vibration and admixtures alter pressure decay
18
Vibration analysis in SCC1Admix effect data in main6foot col no vib 060806 in scc1
18

Our approach
• Step 1: Characterize the characteristic pressure decay of the material
– Measure decay curve from a column
– Calculate pressure as a function of height of concrete over time, C(t)
• Step 2: Impose variable pressure head on the material that is undergoing gelation, stiffening
– Generate filling rate curve
– Multiply filling rate curve by C(t) from column to generate predicted pressure over time

Step 1
1 m
Filled quickly to generate maximum pressure
Pressure measured while material is at rest
20
2008022820

“decay signature”
• Normalize pressure
• Apply numerical approximation of curve
21
( )α1)(
2
0mod
+=
at
CtC
2008022821

Step 2
• Apply overburden pressure head
• Use unit weight of concrete
Pressure = Model x Unit weight x Casting rate
22
)()()( thtCtP ××= γ
2008022822

Field Validations
• Illinois DOT I-74 retaining walls
• OSF Hospital Milestone Project
• Stockholm Round Robin Tests
23

Field Validation #1Illinois DOT I-74 retaining walls
24

I-74 Retaining wall
• SCC used for aesthetics
• Slump flow: 71 cm
• Wall height: ~7 m
• Placed with tremie or pump
25

Wall 8511 Panel 9-10
• Height 6.0 m
• 2 sensors at 5.6 m from top
– 1 at bulkhead
– 2 under drop chute
26
Wall 090-8511 wp09-10 in new model approach26

Wall 81 Panel R
• Height: 2 m
• 2 sensors at 1.7 m
– 1 under drop chute
– 2 at bulkhead
27
Wall 81 panel R fernando model27

Field Validation #2OSF Hospital Milestone Project
28

OSF Hospital Milestone Project
• Foundation wall construction
• Continuous placement
• Slump flow: 60-70 cm
• Height: 12-15 m
29

Wall #1
30
2007112830

Wall #2
31
200821531

Wall #3Plan View
Drop chutes
32

Field Trial Summary
33

34
34
IlliForm: Model implemented in Excel

Field Validation #3Stockholm Round Robin Tests
35

Round robin tests in Stockholm for 10 different form pressure models
• RILEM TC 233-FPC
– Stockholm, June 2012
– Comparison of 10 models
– Theoretical
– Lab tests
– Field tests
– 8 wall sections tested over 4 days
Height: 4.2 m
Height: 6.6 m
36
Reference: Billberg, P et. al, “Field validation of models for predicting lateral form pressure exerted by SCC,” Cement and Concrete Composites, accepted 2014.

Corresponding author: Peter H. Billberga
Nicolas Rousselb, Sofiane Amzianec, Marc Beitzeld, George Charitoue,Björn Freundf, John N. Gardnerg, Guillaume Grampeixh, Carl-Alexander Graubneri, Lloyd Kellerj, Kamal H. Khayatk, David A. Langel, Ahmed F. Omranm, Arnaud Perrotn, Tilo Proskeo, Robert Quattrociocchip, Yannic Vanhoveq
37
Reference: Billberg, P et. al, “Field validation of models for predicting lateral form pressure exerted by SCC,” Cement and Concrete Composites, accepted 2014.

Round Robin Results
• Walls filled step-wise
• Pauses can cause deviation
38

Round Robin Results
39
Decay curves Maximum pressure

What parameters do other models use to characterize change in SCC with time?
• pressure decay by column test
• structural buildup by concrete rheometer
• slump-loss by slump tests
• setting time by vicat test
• pore pressure by pressure sensor on form
40
0
20
40
60
80
100
120
140
0 20 40 60 80 100 120 140
Predicted pressure (kPa)
Measured pressure (kPa)
Wall 2 Wall 3Wall 4 Wall 5Wall 6 Wall 7Wall 8 1:1
y = 1,09xR² = 0,80
N=25
0
20
40
60
80
100
120
140
0 20 40 60 80 100 120 140
Predicted pressure (kPa)
Measured pressure (kPa)
Wall 1 Wall 2Wall 3 Wall 4Wall 5 Wall 6Wall 7 Wall 81:1
y = 1,16xR² = 0,79
N=28
0
20
40
60
80
100
120
140
0 20 40 60 80 100 120 140
Predicted pressure (kPa)
Measured pressure (kPa)
Wall 1 Wall 2Wall 3 Wall 4Wall 5 Wall 6Wall 7 Wall 81:1
y = 1,22xR² = 0,77
N=28
0
20
40
60
80
100
120
140
0 20 40 60 80 100 120 140
Predicted pressure (kPa)
Measured pressure (kPa)
Wall 1 Wall 2Wall 3 Wall 4Wall 5 Wall 6Wall 7 Wall 81:1
y = 1,20xR² = 0,81
N=28
0
20
40
60
80
100
120
140
0 20 40 60 80 100 120 140
Predicted pressure (kPa)
Measured pressure (kPa)
Wall 1 Wall 2Wall 3 Wall 4Wall 5 Wall 6Wall 7 Wall 81:1
y = 1,30xR² = 0,86
N=28
0
20
40
60
80
100
120
140
0 20 40 60 80 100 120 140
Predicted pressure (kPa)
Measured pressure (kPa)
Wall 1 Wall 2Wall 3 Wall 4Wall 5 Wall 6Wall 7 Wall 81:1
y = 1,23xR² = 0,82
N=28
0
20
40
60
80
100
120
140
0 20 40 60 80 100 120 140
Predicted pressure (kPa)
Measured pressure (kPa)
Wall 1 Wall 2Wall 3 Wall 4Wall 5 Wall 6Wall 7 Wall 81:1
y = 1,37xR² = 0,85
N=28
0
20
40
60
80
100
120
140
0 20 40 60 80 100 120 140
Predicted pressure (kPa)
Measured pressure (kPa)
Wall 1 Wall 2Wall 3 Wall 4Wall 5 Wall 6Wall 7 Wall 81:1
y = 1,42xR² = 0,85
N=28
0
20
40
60
80
100
120
140
0 20 40 60 80 100 120 140
Predicted pressure (kPa)
Measured pressure (kPa)
Wall 1 Wall 2Wall 3 Wall 4Wall 5 Wall 6Wall 7 Wall 81:1
y = 1,23xR² = 0,69
N=28
Do these 10 models work?
41
0
20
40
60
80
100
120
140
0 20 40 60 80 100 120 140
Predicted pressure (kPa)
Measured pressure (kPa)
Wall 1 Wall 2Wall 3 Wall 4Wall 5 Wall 6Wall 7 Wall 81:1
y = 1,40xR² = 0,85
N=28

Comparison of Models
42
Model Slope R2
Khayat/Omran 1.16 0.78Ovarlez/Roussel 1.22 0.77Lange/Tejeda-Dominguez 1.09 0.80Perrot et al 1.20 0.71Gardner et al 1.30 0.86Beitzel 1.23 0.82Proske mean 1.23 0.69Proske design 1.40 0.85DIN 18218 mean 1.37 0.85DIN 18218 design 1.42 0.85Average 1.26

Summary
• Formwork pressure of SCC is difficult to characterize with a single parameter i.e. filling rate or slump flow
• Pressure decay signature approach provides reasonable prediction of formwork pressure
• Several modeling approaches have been developed based, giving industry a choice of tools to use for pressure prediction
43

Acknowledgements
Swedish Cement and Concrete Research Institute (CBI)
Development Fund of the Swedish Construction Industry (SBUF)
44
Our projects: Stockholm Round Robin: