Embed Size (px)
Citation preview
Rochester Institute of TechnologyRIT Scholar Works
Presentations and other scholarship
10-18-1999
Measuring and Modeling Image QualityMark FairchildRochester Institute of Technology
Follow this and additional works at: http://scholarworks.rit.edu/other
This Presentation is brought to you for free and open access by RIT Scholar Works. It has been accepted for inclusion in Presentations and otherscholarship by an authorized administrator of RIT Scholar Works. For more information, please contact [email protected].
Recommended CitationFairchild, M.D. (1999). Measuring and modeling image quality [PowerPoint slides]. Presented at the Center for Imaging ScienceIndustrial Associates Meeting, Rochester, NY., 18 October.

RITRIT Munsell Munsell Color Science Laboratory Color Science Laboratory
Measuring and ModelingMeasuring and ModelingImage QualityImage Quality
Center for Imaging Science Industrial Associates MeetingCenter for Imaging Science Industrial Associates Meeting
October 18, 1999October 18, 1999
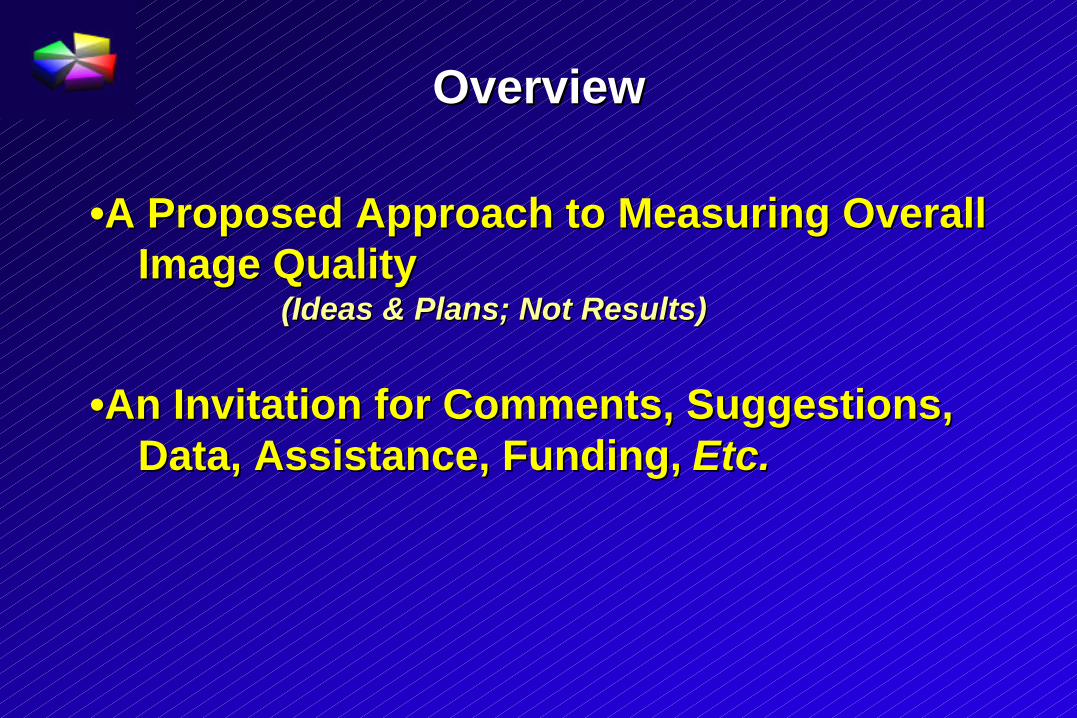
OverviewOverview
•A Proposed Approach to Measuring Overall•A Proposed Approach to Measuring OverallImage QualityImage Quality
(Ideas & Plans; Not Results)(Ideas & Plans; Not Results)
•An Invitation for Comments, Suggestions,•An Invitation for Comments, Suggestions,Data, Assistance, Funding, Data, Assistance, Funding, Etc.Etc.

OutlineOutline
•What is Image Quality?•What is Image Quality?
•Previous Approaches•Previous Approaches
•Overview of a Proposed Approach•Overview of a Proposed Approach
•Ongoing Research•Ongoing Research
•Future Questions•Future Questions
(Focus is on Static Images; Temporal Aspects Ignored for Today)(Focus is on Static Images; Temporal Aspects Ignored for Today)

What is Image Quality?What is Image Quality?
Reductions in image quality correspond toReductions in image quality correspond toperceptible visual perceptible visual differencesdifferences from some from someideal and the ideal and the magnitudemagnitude of such differences. of such differences.

Image Quality as an Interval ScaleImage Quality as an Interval Scale
Interval scales have no meaningful zero.Interval scales have no meaningful zero.(What is zero image quality?)(What is zero image quality?)
Reduction in image quality can be a ratio scale.Reduction in image quality can be a ratio scale.(Zero reduction in IQ is a sub-threshold difference.)(Zero reduction in IQ is a sub-threshold difference.)

Meaningful Range of ValuesMeaningful Range of Values
ReductionReductionin I.Q.in I.Q.
DifferenceDifferenceMetricMetric
Measurable
Meaningful
Detectable

Some ApproachesSome Approaches
Generally, various dimensions of image qualityGenerally, various dimensions of image qualityare treated individually while either ignoring,are treated individually while either ignoring,or holding constant, other dimensions.or holding constant, other dimensions.
•Color Dimensions•Color Dimensions
•Spatial Dimensions•Spatial Dimensions
•Image Specifications•Image Specifications

Color DimensionsColor Dimensions
For Simple (Constant) Viewing Conditions:For Simple (Constant) Viewing Conditions:•CIELAB •CIELAB EE9494
•Patch-by-Patch (or Pixel-by-Pixel)•Patch-by-Patch (or Pixel-by-Pixel)•Min., Mean, Max., Histogram•Min., Mean, Max., Histogram
Color Appearance Models SometimesColor Appearance Models SometimesApplied to More Complex Conditions:Applied to More Complex Conditions:
•CIECAM97s•CIECAM97s

Spatial DimensionsSpatial Dimensions
•Models of Spatial Vision •Models of Spatial Vision (“Detection Models”)(“Detection Models”)
•Detectable Differences in Various Spatial•Detectable Differences in Various SpatialFrequency Channels? (Overall?)Frequency Channels? (Overall?)
•Based on Human CSF / Threshold Data•Based on Human CSF / Threshold Data
••e.g.,e.g., Daly’sDaly’s “Visible Differences Predictor”, “Visible Differences Predictor”,Lubin’sLubin’s “ “Sarnoff Sarnoff Model”Model”

Image SpecificationsImage Specifications
•Bits per Pixel•Bits per Pixel•Pixels per Image •Pixels per Image (or inch, or degree, (or inch, or degree, etcetc.).)
•Noise, Granularity•Noise, Granularity•Luminance, Contrast, Gamut Volume•Luminance, Contrast, Gamut Volume
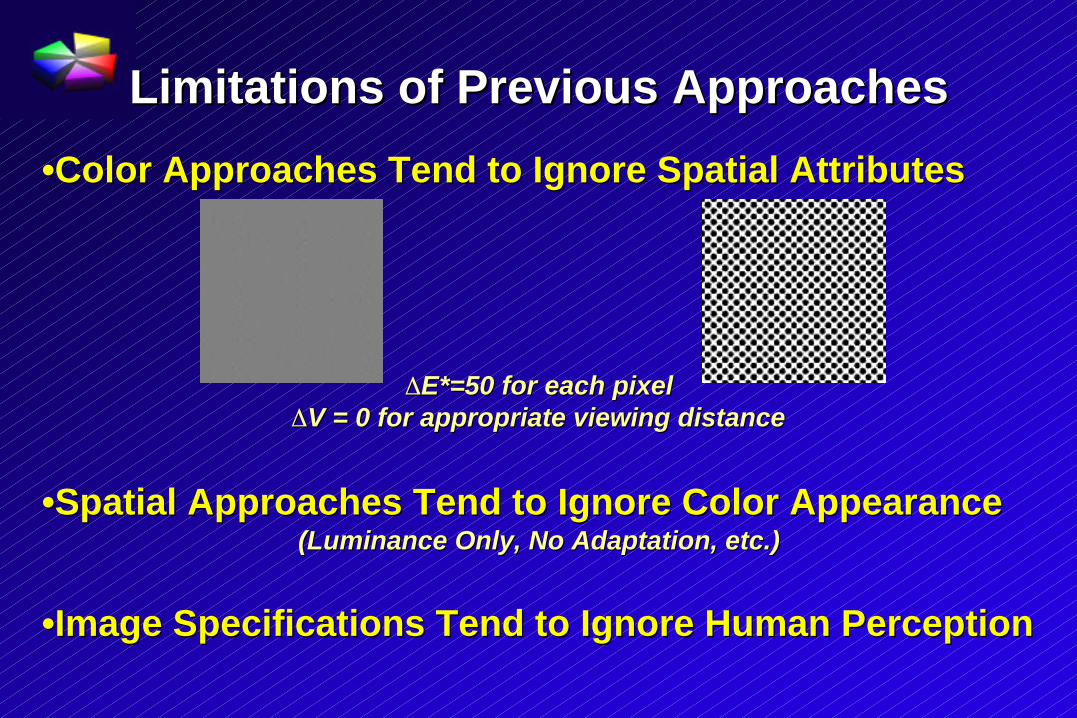
Limitations of Previous ApproachesLimitations of Previous Approaches
•Color Approaches Tend to Ignore Spatial Attributes•Color Approaches Tend to Ignore Spatial Attributes
EE*=*=50 for each pixel50 for each pixelV = 0 for appropriate viewing distanceV = 0 for appropriate viewing distance
•Spatial Approaches Tend to Ignore Color Appearance•Spatial Approaches Tend to Ignore Color Appearance(Luminance Only, No Adaptation, etc.)(Luminance Only, No Adaptation, etc.)
•Image Specifications Tend to Ignore Human Perception•Image Specifications Tend to Ignore Human Perception

A Unified ApproachA Unified ApproachAn image quality metric can be derived as a measureAn image quality metric can be derived as a measure
of perceived difference from an ideal image.of perceived difference from an ideal image.
I.Q. IntervalI.Q. IntervalScaleScale
Alternative: “Image Preference Scale”Alternative: “Image Preference Scale”

Steps in a Unified ApproachSteps in a Unified Approach
•Use Psychophysics to Scale Image Quality•Use Psychophysics to Scale Image Quality(Not Just Measure Thresholds)(Not Just Measure Thresholds)
•Use a Vision Model to Build a Difference Metric•Use a Vision Model to Build a Difference Metric
•Derive a Relationship between Difference•Derive a Relationship between DifferenceMetric and Perceived QualityMetric and Perceived Quality
(Interval Scale)(Interval Scale)
•Aim Image Used to Anchor Interval Scale•Aim Image Used to Anchor Interval Scale(Any Image Could be Used)(Any Image Could be Used)
The PiecesThe Pieces
1. Human Vision Model1. Human Vision Model
2. Degradation-Free Images2. Degradation-Free Images
3. Visual Quality Scale3. Visual Quality Scale

1. Vision Model1. Vision Model
S.N.S.N. Pattanaik Pattanaik, J.A., J.A. Ferwerda Ferwerda, M.D. Fairchild, and D.P. Greenberg,, M.D. Fairchild, and D.P. Greenberg,AA multiscale multiscale model of adaptation and spatial vision for image model of adaptation and spatial vision for imagedisplay, display, Proceedings of SIGGRAPH 98,Proceedings of SIGGRAPH 98, 287-298 (1998). 287-298 (1998).
S.N.S.N. Pattanaik Pattanaik, M.D. Fairchild, J.A., M.D. Fairchild, J.A. Ferwerda Ferwerda, and D.P. Greenberg,, and D.P. Greenberg,MultiscaleMultiscale model of adaptation, spatial vision, and color model of adaptation, spatial vision, and colorappearance, appearance, IS&T/SID 6th Color Imaging Conference,IS&T/SID 6th Color Imaging Conference, Scottsdale, Scottsdale,2-7 (1998).2-7 (1998).
•A Spatial Vision Model that Incorporates•A Spatial Vision Model that IncorporatesColor-Appearance ConceptsColor-Appearance Concepts

Vision Model Flow ChartVision Model Flow Chart
bandpasscontrastimages
S
bandpasscontrastimages
M
bandpasscontrastimages
L
perceivedcontrastsignals
A
perceivedcontrastsignals
C1
perceivedcontrastsignals
C2
S-coneresponseimage
S
M-coneresponseimage
M
L-coneresponseimage
L
Rodresponseimage
rod
lowpassGaussianpyramid
S
lowpassGaussianpyramid
M
lowpassGaussianpyramid
L
lowpassGaussianpyramid
rod
bandpasscontrastimages
rod
adaptedcontrastsignals
S
adaptedcontrastsignals
M
adaptedcontrastsignals
L
adaptedcontrastsignals
rod
opponent color space transformation
nonlinear contrast transduction, thresholding
band-limited, local, adaptation processing
inversion of visual encoding for display
adaptedcontrastsignals
A
adaptedcontrastsignals
C1
adaptedcontrastsignals
C2
adaptedcontrastsignals
rod
upscaling, subtraction
pyramidal image decomposition
calculation of photoreceptor responses
simulated retinal image
scene representation
spatial sampling, optical image formationV
isua
l Enc
odin
gD
ispl
ay M
appi
ngSpectral RadianceSpectral Radiance
Optics, SamplingOptics, Sampling
Retinal ImageRetinal Image
Rods & ConesRods & Cones
Low Pass PyramidLow Pass Pyramid
Bandpass Bandpass PyramidPyramid
Adapted Contrast PyramidAdapted Contrast Pyramid
Nonlinear Nonlinear TransductionTransduction
Color Space TransformColor Space Transform
Appearance MapsAppearance Maps
Difference MetricDifference Metric

Vision Model OutputsVision Model Outputs
High-Dynamic-Range Imaging:High-Dynamic-Range Imaging:Linear OutputLinear Output Vision-Model OutputVision-Model Output
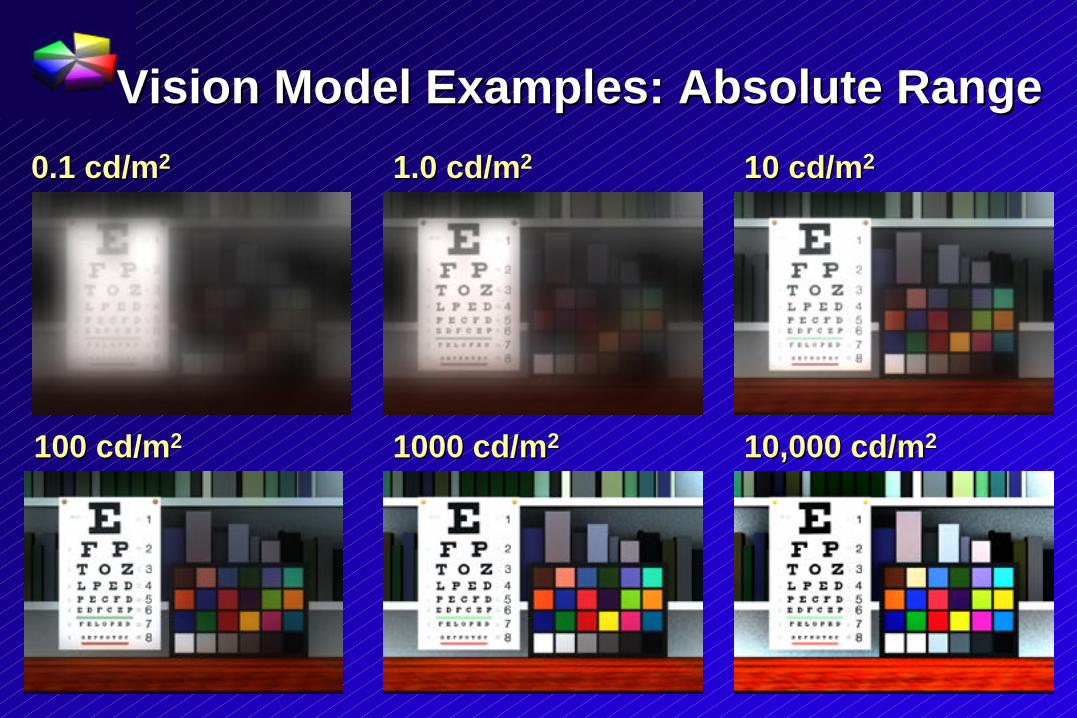
Vision Model Examples: Absolute RangeVision Model Examples: Absolute Range
100 cd/m100 cd/m22 1000 cd/m1000 cd/m22 10,000 cd/m10,000 cd/m22
0.1 cd/m0.1 cd/m22 1.0 cd/m1.0 cd/m22 10 cd/m10 cd/m22
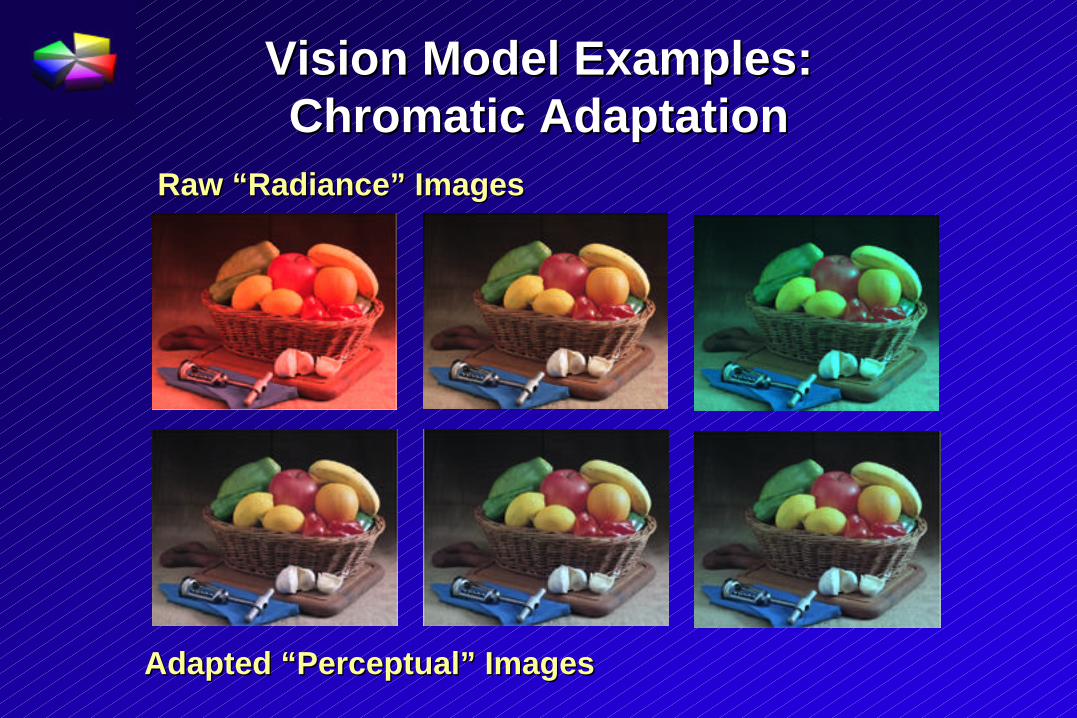
Vision Model Examples:Vision Model Examples:Chromatic AdaptationChromatic Adaptation
Raw “Radiance” ImagesRaw “Radiance” Images
Adapted “Perceptual” ImagesAdapted “Perceptual” Images

Alternate Model: S-CIELABAlternate Model: S-CIELABZhang & Wandell

2. Degradation-Free Images2. Degradation-Free Images
G.M. Johnson, and M.D. Fairchild,G.M. Johnson, and M.D. Fairchild, Full-spectral color Full-spectral colorcalculations in realistic image synthesis, calculations in realistic image synthesis, IEEE ComputerIEEE ComputerGraphics & ApplicationsGraphics & Applications 19:419:4, 47-53 (1999)., 47-53 (1999).
G.M. Johnson and M.D. Fairchild,G.M. Johnson and M.D. Fairchild, Computer synthesis of Computer synthesis ofspectroradiometricspectroradiometric images for color imaging systems images for color imaging systemsanalysis, analysis, IS&T/SID 6th Color Imaging Conference,IS&T/SID 6th Color Imaging Conference, Scottsdale, Scottsdale,150-153 (1998).150-153 (1998).
•Synthesis of Spectral Images•Synthesis of Spectral Images•More Realistic Test Targets•More Realistic Test Targets
•Noise Free•Noise Free•Arbitrary Resolution•Arbitrary Resolution•Spectral Radiance•Spectral Radiance

Rendered Illuminant Rendered Illuminant MetamersMetamers
0
0.1
0.2
0.3
0.4
0.5
0.6
0.7
0.8
0.9
1
400 500 600 700
WAVELENGTH
RE
FL
EC
TA
NC
E

Macbeth Macbeth ““CoworCheckerCoworChecker””

Spectral Cows in their Natural HabitatSpectral Cows in their Natural Habitat
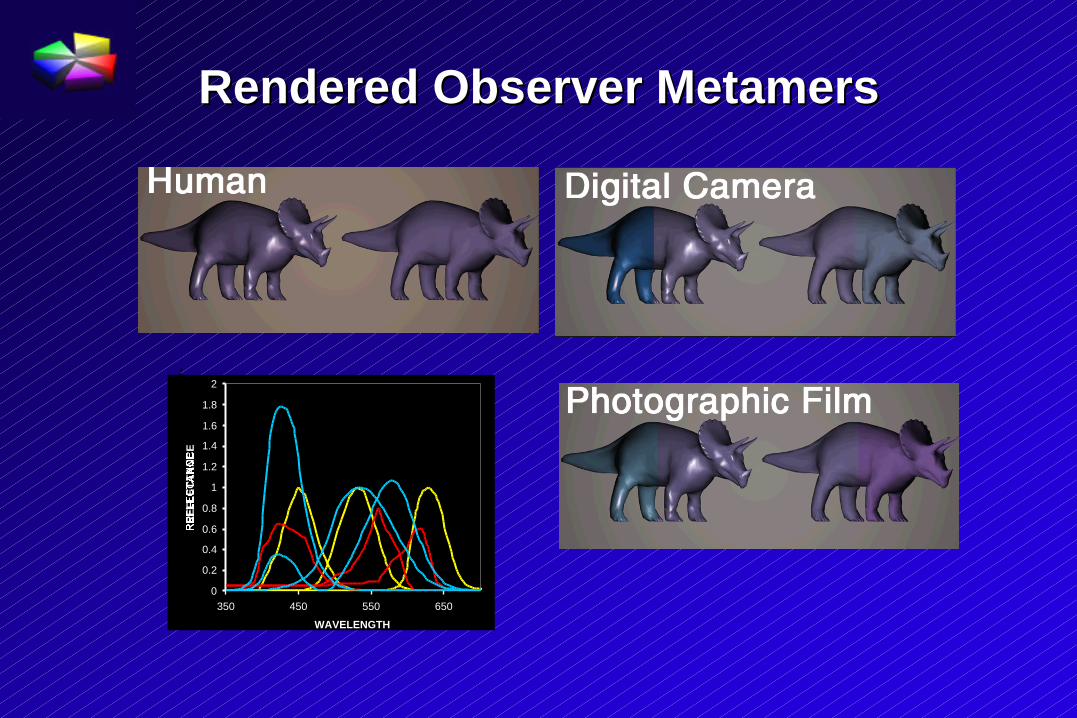
Rendered ObserverRendered Observer Metamers Metamers
0
0.2
0.4
0.6
0.8
1
1.2
1.4
1.6
1.8
2
350 450 550 650
WAVELENGTH
RE
FL
EC
TA
NC
E

Rendered FluorescenceRendered Fluorescence
0
0.2
0.4
0.6
0.8
1
1.2
1.4
1.6
300 350 400 450 500 550 600 650 700 750
WAVELENGTH

Textured TargetsTextured Targets

3. Visual Quality Scale3. Visual Quality Scale
A.A. Vaysman Vaysman and M.D. Fairchild, and M.D. Fairchild, Degree of Degree of quantization quantization and andspatialspatial addressability addressability trade- trade-offsoffs in perceived quality of in perceived quality ofcolor images, color images, Color Imaging: Device Independent Color, ColorColor Imaging: Device Independent Color, ColorHardcopy, and Graphic Arts III,Hardcopy, and Graphic Arts III, Proc Proc. SPIE. SPIE 3300, 250-261 3300, 250-261(1998).(1998).
•Image Quality as a Function of Bits/Pixel and DPI•Image Quality as a Function of Bits/Pixel and DPI
•Visually Equivalent (Normal Viewing, Pictorial)•Visually Equivalent (Normal Viewing, Pictorial)8 bits/pixel @ 300dpi8 bits/pixel @ 300dpi5 bits/pixel @ 100dpi5 bits/pixel @ 100dpi4 bits/pixel @ 150dpi4 bits/pixel @ 150dpi3 bits/pixel @ 300dpi3 bits/pixel @ 300dpi
Ongoing ResearchOngoing Research
•Extension of Vision Model•Extension of Vision Model
•Enhancement of Image Synthesis Techniques•Enhancement of Image Synthesis Techniques
•Derivation of New Image Quality Scales•Derivation of New Image Quality Scales
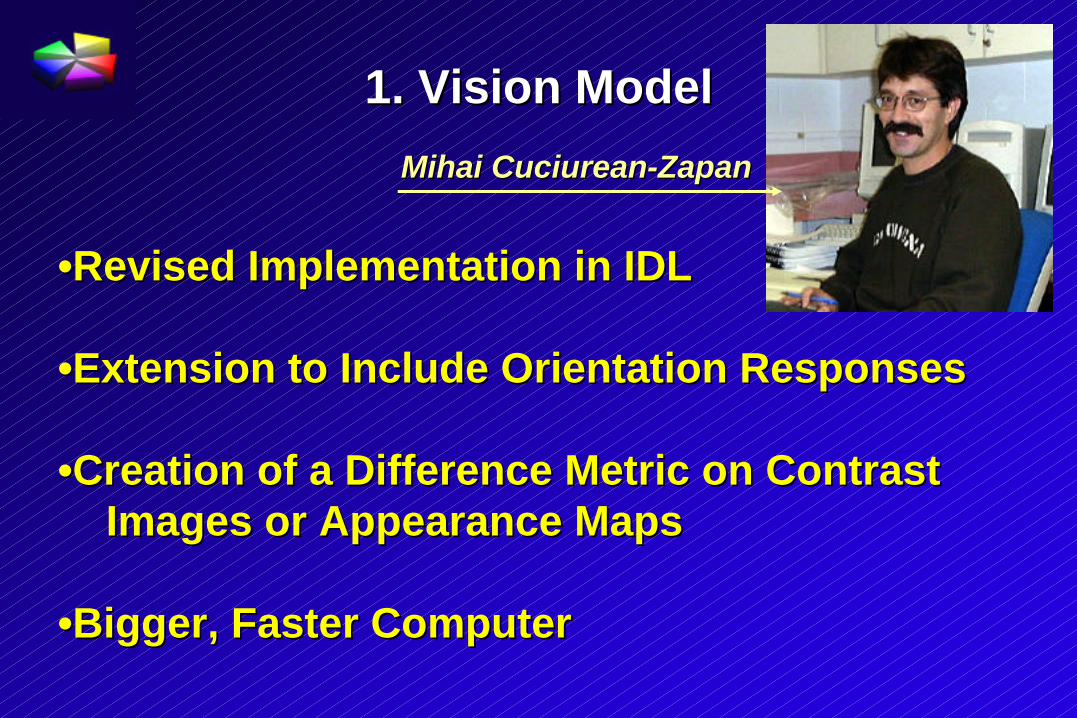
1. Vision Model1. Vision Model
•Revised Implementation in IDL•Revised Implementation in IDL
•Extension to Include Orientation Responses•Extension to Include Orientation Responses
•Creation of a Difference Metric on Contrast•Creation of a Difference Metric on ContrastImages or Appearance MapsImages or Appearance Maps
•Bigger, Faster Computer•Bigger, Faster Computer
Mihai CuciureanMihai Cuciurean--ZapanZapan
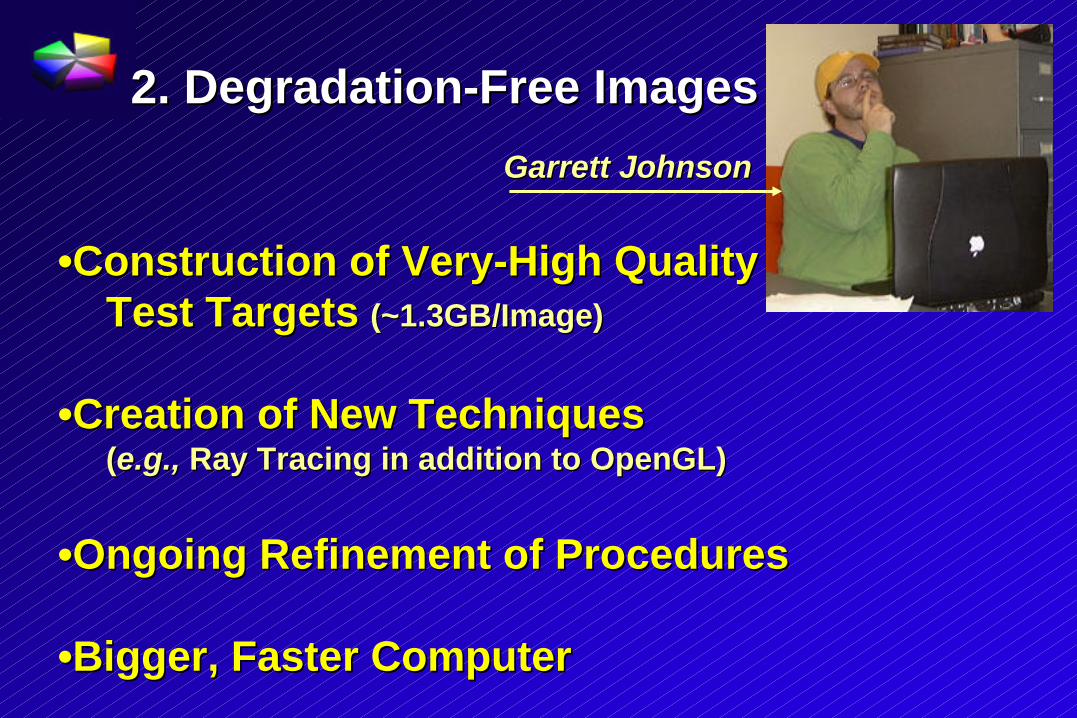
2. Degradation-Free Images2. Degradation-Free Images
•Construction of Very-High Quality•Construction of Very-High QualityTest Targets Test Targets (~1.3GB/Image)(~1.3GB/Image)
•Creation of New Techniques•Creation of New Techniques((e.g.,e.g., Ray Tracing in addition to OpenGL) Ray Tracing in addition to OpenGL)
•Ongoing Refinement of Procedures•Ongoing Refinement of Procedures
•Bigger, Faster Computer•Bigger, Faster Computer
Garrett JohnsonGarrett Johnson

3. Visual Quality Scale3. Visual Quality Scale
•Start with Synthetic Image•Start with Synthetic Image
• Degrade Along Several Typical Dimensions• Degrade Along Several Typical Dimensions(dpi, (dpi, bppbpp, color , color responsiivityresponsiivity, tone , tone reporductionreporduction, , etcetc.).)
•Visually Scale Quality•Visually Scale QualityPaired Comparison w/AnchorPaired Comparison w/AnchorSingle Viewing Condition for NowSingle Viewing Condition for Now
•Bigger, Faster Computer•Bigger, Faster Computer
Garrett JohnsonGarrett Johnson
Putting It All TogetherPutting It All Together
•Measures from •Measures from MihaiMihai
•Scales from Garrett•Scales from Garrett
•Does it Work??•Does it Work??

Future QuestionsFuture Questions
•Improved Vision Model / Other Vision Models?•Improved Vision Model / Other Vision Models?(A Simpler Approach?)(A Simpler Approach?)
•More Extensive Image Degradations•More Extensive Image Degradations(Real and Simulated)(Real and Simulated)
•More Visual Data•More Visual Data
•Iterate•Iterate
1. Vision Model1. Vision Model
Could other models work as well or better?Could other models work as well or better?
Is the complexity justified?Is the complexity justified?(S-CIELAB approach enough?)(S-CIELAB approach enough?)
What is the optimum combination?What is the optimum combination?(Analogous to color appearance model evolution?)(Analogous to color appearance model evolution?)
2. Degradation-Free Images2. Degradation-Free Images
•Improved Efficiency•Improved Efficiency
•Improved Realism•Improved Realism
•Important Subject Matter•Important Subject Matter(e.g., Portraits: (e.g., Portraits: Qun Qun “Sam” Sun)“Sam” Sun)
•Improved Simulation of Imaging Systems•Improved Simulation of Imaging Systems(Capture —> Display)(Capture —> Display)
3. Visual Quality Scale3. Visual Quality Scale
•More Scaling Experiments•More Scaling Experiments
•Collection of Data from Other Sources•Collection of Data from Other Sources
•What Works, What Sells, •What Works, What Sells, EtcEtc..

How Can You Help?How Can You Help?
•Contribute Data•Contribute Data
•Point Out Apparent Flaws•Point Out Apparent Flaws
•Suggest Other Models to Try•Suggest Other Models to Try
•Comment on Utility of the Answer•Comment on Utility of the Answer
•Suggest Enhancements to This Approach•Suggest Enhancements to This Approach
•Fund a Research Project!•Fund a Research Project!
•Students: Join in on this Research!•Students: Join in on this Research!
AcknowledgementsAcknowledgements
Fuji Photo-Film Fuji Photo-Film (Kazuhiko (Kazuhiko TakemuraTakemura))Supporting research on vision model and image qualitySupporting research on vision model and image quality
scaling.scaling.
Eastman Kodak Eastman Kodak (Paula (Paula AlessiAlessi))Supporting research on spectral image synthesis andSupporting research on spectral image synthesis and
spectral portraiture.spectral portraiture.

How Can You Help?How Can You Help?
•Contribute Data•Contribute Data
•Point Out Apparent Flaws•Point Out Apparent Flaws
•Suggest Other Models to Try•Suggest Other Models to Try
•Comment on Utility of the Answer•Comment on Utility of the Answer
•Suggest Enhancements to This Approach•Suggest Enhancements to This Approach
•Fund a Research Project!•Fund a Research Project!
•Students: Join in on this Research!•Students: Join in on this Research!