Embed Size (px)
Citation preview

USDOT Region V Regional University Transportation Center Final Report
IL IN
WI
MN
MI
OH
NEXTRANS Project No. 067OY03
MEASURING AND DOCUMENTING TRUCK ACTIVITY TIMES
AT INTERNATIONAL BORDER CROSSINGS By
Mark R. McCord, Professor The Ohio State University
Prem Goel, Professor Emeritus The Ohio State University
Colin N. Brooks, Senior Research Scientist Michigan Tech Research Institute
Nicole Sell, Graduate Research Associate The Ohio State University
Jiaqi Zaetz, Graduate Research Associate The Ohio State University
David Dean, Assistant Research Scientist Michigan Tech Research Institute
Report Submission Date: April 2, 2014

i
ACKNOWLEDGMENTS AND DISCLAIMER
The investigators gratefully acknowledge the external support of Ray Cossette (CEVA Logistics), Kirk Pettit (formerly, CEVA Logistics), and Tony Shallow (Transport Canada), as well as the assistance of Richard Dobson (MTRI), Michael Billmire (MTRI), Jim Whitehead (MTRI), Zhengyu Hu (OSU), and Brooke Rabe (formerly, OSU). Funding for this project was provided by the NEXTRANS Center, Purdue University under Grant No. DTRT07-G-005 of the U.S. Department of Transportation, Research and Innovative Technology Administration (RITA), University Transportation Centers Program, and by the Ohio State University’s College of Engineering Transportation Research Endowment Program. The contents of this report reflect the views of the authors, who are responsible for the facts and the accuracy of the information presented, and not of any collaborator or funding institution. This document is disseminated under the sponsorship of the Department of Transportation, University Transportation Centers Program, in the interest of information exchange. The U.S. Government assumes no liability for the contents or use thereof.

USDOT Region V Regional University Transportation Center Final Report
TECHNICAL SUMMARY
NEXTRANS Project No 019PY01Technical Summary - Page 1
IL IN
WI
MN
MI
OH
NEXTRANS Project No. 067OY03 Final Report, Date April 2, 2014
Measuring and Documenting Truck Activity Times at International Border Crossings
Introduction
Documenting the times trucks incur when crossing an international border facility is
valuable both to the private freight industry and to gateway facility operators and planners.
Members of the project team previously developed and implemented an approach to
document truck activity times associated with an international border crossing by using
technologies that are already in use by truck fleets. The approach relies on position,
navigation, and timing (PNT) systems in the form of on-board GPS-enabled data units,
virtual perimeters called geo-fences that surround areas of interest, and a mechanism for
data transmission. The investigators teamed with a major North American freight hauler
whose trucks regularly traverse two of the busiest North American freight border crossings
– the privately owned Ambassador Bridge, connecting Detroit, MI, and Windsor, ON, and
the publicly owned Blue Water Bridge, connecting Port Huron, MI, and Sarnia, ON– to
determine times associated with the multiple activities associated with using the facilities
at these border crossing sites. Data were collected from the fleet over several months and
processed to produce distributions of overall crossing times, queuing times, and inspection
times for U.S.-bound and Canada-bound trucks.
Parallel to these efforts, Transport Canada (TC) and the Ontario Ministry of Transportation
were using a Bluetooth-based approach to collect truck data at these major border crossing
facilities. Investigators previously obtained a representative sample of TC data.
Preliminary investigations showed that the geo-fence-based approach produced much
higher resolution information than the TC data on truck activities at these crossings.
However, the geo-fence data were obtained from a large, but single carrier whose trucks
were all FAST (Free and Secure Trade) certified, whereas the TC data encompassed a much
broader population of trucks. Anticipating the possibility that the single-carrier, high
resolution geo-fence data, as well as the less detailed TC data from the broader truck
population could continue to be collected, it would be productive to understand if the two
types of data are substitutes for each other or if they could provide complementary
information.

NEXTRANS Project No 019PY01Technical Summary - Page 2
In this study, the geo-fence approach and the data collection and processing efforts are
described. Changes in roadway infrastructure at the border crossing facilities that could
affect results obtained with presently implemented geo-fences are also summarized.
Empirical comparisons are conducted between truck volumes and crossing times in the
geo-fence and Transport Canada datasets. In addition, interest in the type of results
produced from the geo-fence approach expressed by individuals associated with border
crossing times is summarized.
Findings
Eighteen months of geo-fence based data were collected from trucks using the Ambassador
Bridge and Blue Water Bridge border crossing facilities and preliminarily processed.
Empirical comparisons made between the geo-fence based crossing times and concurrent
crossing times previously produced by Transport Canada and the Ontario Ministry of
Transport from data collected using a Bluetooth-based approach showed strong, positive
associations. However, the average time-of-day patterns produced from the two datasets
were sufficiently different that one could not consider the two datasets to be substitutes for
each other.
Strong interest in the type of results that can be produced by the geo-fence based approach
was expressed by experienced border personnel.
Important infrastructure changes were noted at the border crossing facilities.
Recommendations
The strong interest expressed by experienced border personnel motivates continued data
collection and processing to produce what appears to be unique information on truck
activity times at the high volume and high value Ambassador Bridge and Blue Water Bridge
border crossings facilities. Given the infrastructure changes noted at the facilities, it will be
important to determine the effect of these changes on activity times determined from presently
implemented geo-fences and to assess the need for new geo-fences. The positive association
between concurrent geo-fence and Transport Canada crossing times but lack of a strong relation
in average time-of-day patterns motivates an investigation of ways to combine the two datasets
to provide better estimates of activity times at these important North American border crossing
facilities.

NEXTRANS Project No 019PY01Technical Summary - Page 3
Contacts
For more information:
Mark R. McCord The Ohio State University 470 Hitchcock Hall 2070 Neil Avenue Columbus, OH 43210 (614) 292-2388 (614) 292-3780 Fax [email protected] Colin N. Brooks Michigan Tech Research Institute 3600 Green Court, Suite 100 Ann Arbor, MI 48105 (734) 913-6858 (734) 913-6880 Fax
NEXTRANS Center Purdue University - Discovery Park 2700 Kent B-100 West Lafayette, IN 47906 [email protected] (765) 496-9729 (765) 807-3123 Fax www.purdue.edu/dp/nextrans

ii
Table of Contents
List of Figures .................................................................................................................... iii
List of Tables ...................................................................................................................... v
1. Introduction ..................................................................................................................... 1
2. The Geo-Fence Approach ............................................................................................... 3
3. Geo-Fence Data Acquisition and Processing .................................................................. 8
4. Comparisons of Geo-Fence Based and Bluetooth Based Data ....................................... 9
5. Documentation of Infrastructure Changes Affecting Geo-Fences ................................ 21
6. Expressed Stakeholder Interest ..................................................................................... 26
7. Summary and Conclusions ........................................................................................... 26
References ......................................................................................................................... 27

iii
List of Figures
Figure 2-1: General depiction of geo-fences in operation during this project and of the original geo-fences (inset) at the Ambassador Bridge crossing facility 4
Figure 2-2: General depiction of geo-fences in operation during this project and of the original geo-fences (inset) at the Blue Water Bridge crossing facility 4
Figure 2-3: Detail on geo-fences in operation during this project at the Ambassador Bridge crossing facility 5
Figure 2-4: Detail of geo-fences in operation during this project at the Blue Water Bridge
crossing facility 6
Figure 4-1: CEVA (Oct. 2008 – Mar. 2010) truck volumes by hour of day 10
Figure 4-2: Transport Canada (02/09/2009 - 04/29/2009) truck volumes by hour of day 10
Figure 4-3: Locations between which TC crossing times (A and B) and CEVA crossing
times (a and b) are determined for Ambassador Bridge from Michigan to Ontario 11
Figure 4-4: Locations between which TC crossing times (A and B) and CEVA crossing
times (a and b) are determined for Ambassador Bridge from Ontario to Michigan 12
Figure 4-5: Locations between which TC crossing times (A and B) and CEVA crossing times (a and b) are determined for Blue Water Bridge from Michigan to Ontario 12
Figure 4-6: Locations between which TC crossing times (A and B) and CEVA crossing
times (a and b) are determined for Blue Water Bridge from Ontario to Michigan 13
Figure 4-7: Time-of-day plots for CEVA crossing times and TC crossing times for
Ambassador Bridge from Michigan to Ontario 13
Figure 4-8: Time-of-day plots for CEVA crossing times and TC crossing times for
Ambassador Bridge from Ontario to Michigan 14
Figure 4-9: Time-of-day plots for CEVA crossing times and TC crossing times for Blue Water Bridge from Michigan to Ontario 14
Figure 4-10: Time-of-day plots for CEVA crossing times and TC crossing times for Blue Water Bridge from Ontario to Michigan 15
iv
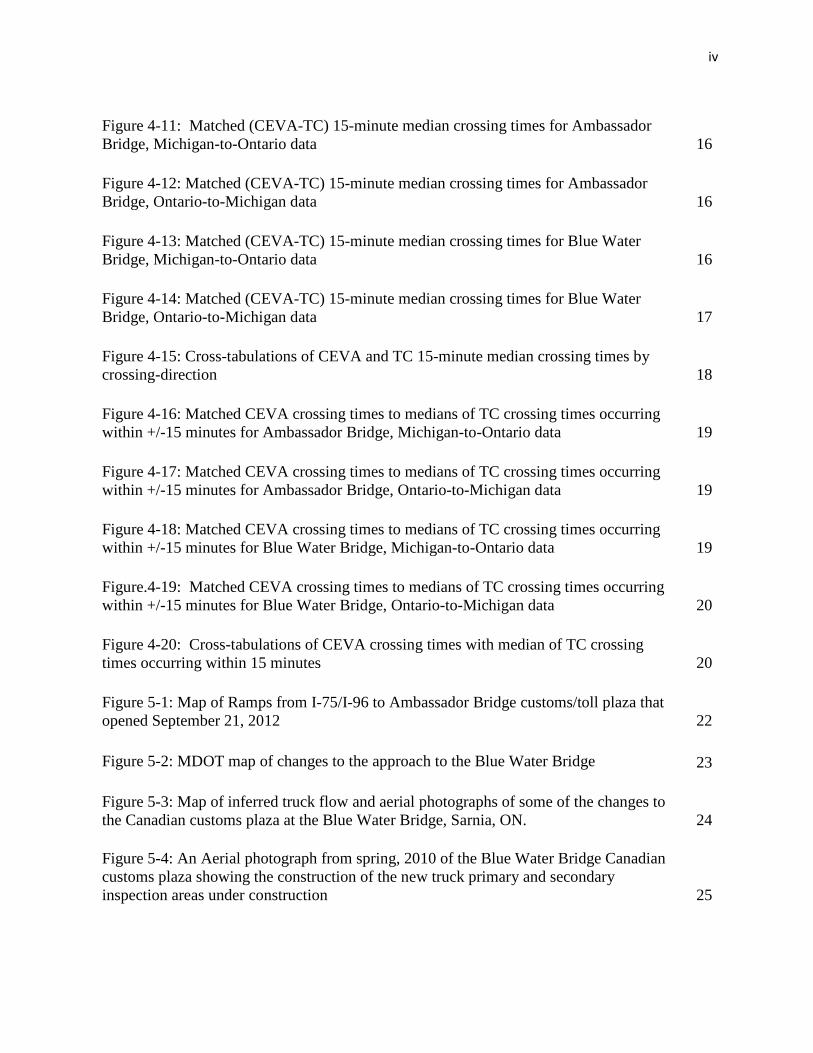
Figure 4-11: Matched (CEVA-TC) 15-minute median crossing times for Ambassador Bridge, Michigan-to-Ontario data 16
Figure 4-12: Matched (CEVA-TC) 15-minute median crossing times for Ambassador Bridge, Ontario-to-Michigan data 16
Figure 4-13: Matched (CEVA-TC) 15-minute median crossing times for Blue Water
Bridge, Michigan-to-Ontario data 16
Figure 4-14: Matched (CEVA-TC) 15-minute median crossing times for Blue Water
Bridge, Ontario-to-Michigan data 17
Figure 4-15: Cross-tabulations of CEVA and TC 15-minute median crossing times by crossing-direction 18
Figure 4-16: Matched CEVA crossing times to medians of TC crossing times occurring within +/-15 minutes for Ambassador Bridge, Michigan-to-Ontario data 19
Figure 4-17: Matched CEVA crossing times to medians of TC crossing times occurring
within +/-15 minutes for Ambassador Bridge, Ontario-to-Michigan data 19
Figure 4-18: Matched CEVA crossing times to medians of TC crossing times occurring
within +/-15 minutes for Blue Water Bridge, Michigan-to-Ontario data 19
Figure.4-19: Matched CEVA crossing times to medians of TC crossing times occurring
within +/-15 minutes for Blue Water Bridge, Ontario-to-Michigan data 20
Figure 4-20: Cross-tabulations of CEVA crossing times with median of TC crossing times occurring within 15 minutes 20
Figure 5-1: Map of Ramps from I-75/I-96 to Ambassador Bridge customs/toll plaza that
opened September 21, 2012 22
Figure 5-2: MDOT map of changes to the approach to the Blue Water Bridge 23
Figure 5-3: Map of inferred truck flow and aerial photographs of some of the changes to the Canadian customs plaza at the Blue Water Bridge, Sarnia, ON. 24
Figure 5-4: An Aerial photograph from spring, 2010 of the Blue Water Bridge Canadian customs plaza showing the construction of the new truck primary and secondary inspection areas under construction 25

v
List of Tables
Table 2-1: Description of geo-fences in operation during this project at the Ambassador Bridge crossing facility 7
Table 2-2: Description of geo-fences in operation during this project at the Blue Water Bridge crossing facility 8

1
1. Introduction Documenting the times trucks incur when crossing an international border facility is valuable both to the private freight industry and to gateway facility operators and planners. Private carriers and shippers can benefit from having objective travel time measures for trip planning and scheduling. By monitoring trends in the documented travel times, facilities operators and planners can detect when conditions have sufficiently changed to warrant changes in infrastructure or operations. In addition, developing, calibrating, and validating predictive models of how travel times respond to alternate infrastructure configurations or operations policies requires extensive and valid data on crossing times. Contributing to the magnitude and variability in truck crossing times are the multiple activities involved with international truck crossings – e.g., approaching the gateway on freeways or surface streets, paying tolls, waiting in queues, undergoing customs inspection, possibly visiting duty free facilities. Decomposing the overall travel time into its components helps in the identification of the critical activities affecting the overall crossing times, the management of components of the cross-border trip, and the development of behaviorally responsive models. For example, studies that predict the effects of increased demand would require an understanding of the interaction between customs screening rates and traffic volumes in producing queuing-induced delays. In addition, for planning and monitoring purposes, it is important to adjust overall crossing times to remove the effect of voluntary activities, such as visiting duty free facilities, that add to the observed time incurred when crossing the border. Carrier management may also wish to monitor the participation of its trucks in duty free activities to ensure that they are not contributing to reduced productivity.
Traditional methods of collecting crossing time data (1), (2) rely on surveillance personnel or technologies placed at locations along the infrastructure to record truck identifiers as the trucks pass the location. Implementing these methods is complicated at international crossings because the multiple activities involve infrastructure and operations associated with multiple agencies located in two countries. Moreover, the spatial extent of the multiple activities and the temporal variability in the activity times make it difficult to obtain synoptic, representative activity time data. Times are only obtained between the fixed surveillance locations. To collect times for all the activities of interest, a large amount of equipment or personnel must be deployed. Personnel and mobile equipment used for project level studies can only be stationed for relatively short periods of time. This limitation does not allow for long term trend monitoring and can lead to unrepresentative samples over time. Technologies, such as RFID or Bluetooth readers (3), used to detect the time that a truck passes the fixed location offer advantages in re-identifying the truck at a downstream surveillance location. However, these technologies require installation of roadside infrastructure and can suffer from the same difficulties as the traditional methods in decomposing times into multiple activities. Members of the project team previously developed and tested an approach (4), (5) to document truck activity times associated with an international border crossing by using technologies that are already in use by truck fleets. The approach relies on position, navigation, and timing (PNT) systems in the form of on-board GPS-enabled data units, virtual perimeters called geo-fences that surround areas of interest, and a mechanism for data transmission. It needs no roadside

2
infrastructure and is, thus, easy to implement, as long as fleet operators are willing to share data (which has been the case in our previous study). The “geo-fence-based” approach is also rapidly reconfigurable, which is attractive when infrastructure at the gateway changes – e.g., during and after infrastructure rehabilitation or expansion. The investigators teamed with CEVA Logistics, a major North American freight hauler whose trucks regularly traverse two of the busiest North American freight crossings – the privately owned Ambassador Bridge, connecting Detroit, MI, and Windsor, ON, and the publicly owned Blue Water Bridge, connecting Port Huron, MI, and Sarnia, ON– to collect times associated with multiple border crossing activities. Data were collected from the fleet over several months and processed to produce distributions of overall crossing times, queuing times, and inspection times for U.S.-bound and Canada-bound trucks. Parallel to these efforts, Transport Canada (TC) and the Ontario Ministry of Transportation were using a Bluetooth-based approach to collect truck data at these major crossings. Investigators from the project team had preliminary discussions with Canadian investigators and obtained a representative sample of their data. Data obtained from the geo-fence-based approach produced much higher resolution information than the TC data on truck activities at these crossings. However, the geo-fence data were obtained from a large, but single carrier whose trucks were all FAST (Free and Secure Trade) certified, whereas the TC data encompassed a much broader population of trucks. Anticipating the possibility that the single-carrier, high resolution geo-fence data, as well as the less detailed TC data from the broader truck population could continue to be collected, it would be productive to understand if the two types of data are substitutes for each other or if they could provide complementary information. This report documents investigations of the feasibility and desirability of using the geo-fence approach to collect activity times in an operational manner at two major North American truck border crossings. The major tasks pursued involved comparing the information produced from the data collected by the project team to the Transport Canada data, collecting additional geo-fence data for subsequent analysis, and pursuing potential stakeholders for eventual use of the information produced. In Section 2, an overview of the geo-fence approach and its operational implementation is presented. Data acquisition and processing efforts are discussed in Section 3, where difficulties encountered with processing newly collected data into activity times are presented. Empirical comparisons conducted between truck volumes and crossing times in the geo-fence and Transport Canada datasets are described in Section 4. During the timeframe of this project changes to the roadway infrastructure at the border crossing facilities were observed. These changes, which could affect the interpretation of activity times determined from the presently implemented geo-fences, are summarized in Section 5. Interest in the type of results produced from the geo-fence approach expressed by individuals associated with border crossing times is summarized in Section 6. Finally, findings are summarized and future work is proposed in Section 7.

3
2. The Geo-fence Approach Detailed explanations of our geo-fence-based approach can be found in (4), (5). Briefly, the approach relies on data records that are triggered when a truck carrying an Onboard Data Unit (OBDU) crosses an electronic geo-fence, a virtual perimeter of an area (a polygon) that defines a region of interest. The coordinates of the points that define the geo-fence are digitized "in the office" and remotely transmitted to the OBDU. The unit continuously checks GPS location signals against the electronic geo-fence boundary to determine if the truck entered or exited a geo-fenced polygon. Once it has been determined that the truck has entered or exited a geo-fenced polygon, a crossing record is transmitted to a database with location, time, and accompanying descriptive information. By using the unique identifier of the truck (through its OBDU) included in the data records and additional logic, one can identify and examine records for the various geo-fences crossed during an individual truck trip and the direction of crossing. By taking the difference in geo-fence crossing times of the matched records, the travel time between the corresponding locations is determined.
Since many fleets use the underlying technologies for management purposes, no additional infrastructure is required to obtain these records. For example, the geo-fences used in this project were previously implemented on CEVA Logistics trucks by members of the project team (5). CEVA had already been using geo-fences that indicated when their trucks crossed the border or were in the vicinity of border crossing facilities. However, the structure of the geo-fences allowed neither useful information on general crossing times nor decomposition into multiple activities. Members of the project team specified geo-fences at strategic locations that delineate important activities so that the times incurred in the activities could be determined. They also developed the data cleaning and chaining logic required to transform the raw data into useful, valid information on truck activities. Geographic depictions of the geo-fences in operation on CEVA trucks during this project and of the original CEVA geo-fences appear in Figures 2-1 and 2-2 for the Ambassador Bridge and Blue Water Bridge crossing facilities, respectively. More detailed depictions of the geo-fences in operation are presented in Figures 2-3 and 2-4, and descriptions of the fences are presented in Tables 2-1 and 2-2.

4
Figure 2-1: General depiction of geo-fences in operation during this project and of the original
geo-fences (inset) at the Ambassador Bridge crossing facility; from (5)
Figure 2-2: General depiction of geo-fences in operation during this project and of the original geo-fences (inset) at the Blue Water Bridge crossing facility; from (5)

5
Figure 2-3: Detail on geo-fences in operation during this project at the Ambassador Bridge crossing facility; from (5)
amb_caapproach
amb_ca2ndcust
amb_huronchrchrd
amb_usplazatollfCA
amb_ustoll
amb_usplaza
amb_usplaza_toll2CAexit
amb_usdutyfree
amb_usplaza_toll2CA
amb_cabridge
amb_usbridge
amb_usapproach
amb_cadutyfree
amb_caplaza

6
Figure 2-4: Detail of geo-fences in operation during this project at the Blue Water Bridge crossing facility; from (5)
bwb_6994split
bwb_splitplaza
bwb_rte25collect
bwb_usplazabridge
bwb_caplazabridge bwb_caapproach
bwb_cadutyfree
7
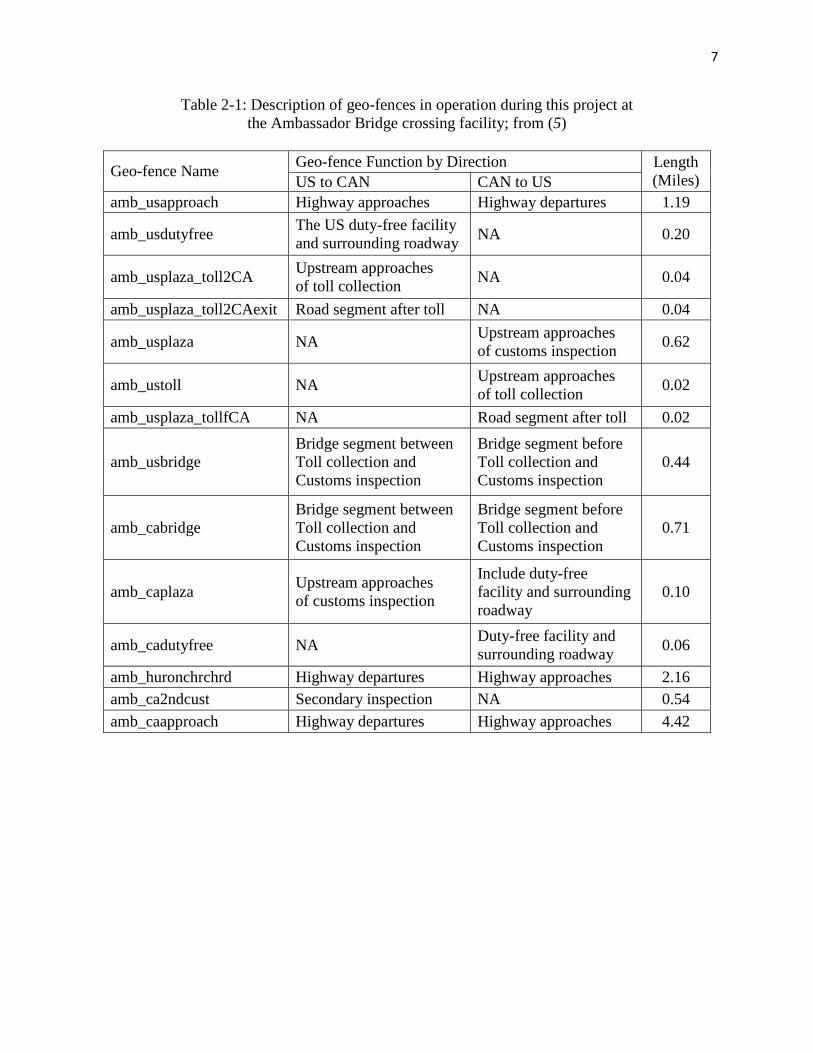
Table 2-1: Description of geo-fences in operation during this project at the Ambassador Bridge crossing facility; from (5)
Geo-fence Name Geo-fence Function by Direction Length (Miles) US to CAN CAN to US
amb_usapproach Highway approaches Highway departures 1.19
amb_usdutyfree The US duty-free facility and surrounding roadway NA 0.20
amb_usplaza_toll2CA Upstream approaches of toll collection NA 0.04
amb_usplaza_toll2CAexit Road segment after toll NA 0.04
amb_usplaza NA Upstream approaches of customs inspection 0.62
amb_ustoll NA Upstream approaches of toll collection 0.02
amb_usplaza_tollfCA NA Road segment after toll 0.02
amb_usbridge Bridge segment between Toll collection and Customs inspection
Bridge segment before Toll collection and Customs inspection
0.44
amb_cabridge Bridge segment between Toll collection and Customs inspection
Bridge segment before Toll collection and Customs inspection
0.71
amb_caplaza Upstream approaches of customs inspection
Include duty-free facility and surrounding roadway
0.10
amb_cadutyfree NA Duty-free facility and surrounding roadway 0.06
amb_huronchrchrd Highway departures Highway approaches 2.16 amb_ca2ndcust Secondary inspection NA 0.54 amb_caapproach Highway departures Highway approaches 4.42

8
Table 2-2: Description of geo-fences in operation during this project at the Blue Water Bridge crossing facility; from (5)
Geo-fence Name Geo-fence Function by Direction Length
(Miles) US to CAN CAN to US bwb_6994split Highway approaches Highway departures 1.32 bwb_splitplaza Highway approaches Highway departures 3.00
bwb_rte25collect Upstream approaches of toll collection
Road segment downstream of customs inspection 0.25
bwb_usplazabridge Bridge segment between Toll collection and Customs inspection
Upstream approaches of customs inspection 0.61
bwb_caplazabridge Upstream approaches of customs inspection
Bridge segment between Toll collection and Customs inspection
0.71
bwb_cadutyfree NA Duty-free facility and surrounding roadway 0.07
bwb_caapproach Highway departures Highway approaches 4.10 3. Geo-fence Data Acquisition and Processing Location and timing data obtained from CEVA trucks using the Ambassador Bridge and Blue Water Bridge facilities continued to be collected with the geo-fences described in the previous section. Data were collected for the dates 03-01-2010 through 08-27-2012. There were 901 dates in the dataset; no data were transmitted from the data provider for the dates March 2-3, 2011, January 22, 23, 30, 31, 2012 and July 26 – 29, 2012. Preliminary data processing was completed in five batches, resulting in a total of 7,649,821 records in the database. To eliminate data points far from the Ambassador Bridge and Blue Water Bridge facilities, geographic regions of interest (ROI) had been previously determined and digitized into GIS software. The data were filtered into the two ROIs using a PostGIS module to tag each record with geo-spatial information present in the input files. The data were then exported into .csv files. Of the 7,649,821 records in the database, 2,180,445 records were within the Ambassador Bridge ROI, and 544,962 records were within the Blue Water Bridge ROI. Preliminary data processing involves the following steps:
• E-mails are received nightly at Michigan Tech Research Institute (MTRI) from the truck company’s contracted data provider (Webtech Wireless) containing the previous day’s CEVA truck tracking data.
• Data in the e-mails are downloaded (3 or 4 .csv data files), renamed using a standardized file naming protocol, and saved to the MTRI network.
• Data to be processed are copied into a working directory and a backup directory. • Data are compiled and imported into (open source) PostgreSQL database using Python
scripts.

9
• In PostgreSQL, scripts are run to o Delete duplicate records o Export data for BWB and AMB into separate .csv files o Create a database backup file
The resulting .csv files are posted to an ftp server for download by Ohio State University (OSU) investigators. The data are then downloaded by the OSU investigators and imported into PostgreSQL to construct a database for subsequent processing in the statistical analysis software R. To import data into the PostgreSQL database on the OSU server, the downloaded .csv file must be transformed to a format compatible in a Linux environment. The research assistant who previously worked on this transformation had graduated, and the information to complete this step had not been passed on to the rest of the project team. Thus, the team was unable to process new data during the project’s timeframe. A research assistant with the appropriate skills was sought for the following year. In the meantime, investigations were conducted with data that had previously been processed. 4. Comparisons of Geo-fence Based and Bluetooth Based Data As discussed above, geo-fence based data that can be used to produce times CEVA trucks incur in multiple activities at the Ambassador Bridge and Blue Water Bridge border crossing facilities have been collected in the past and continue to be collected. The previously processed dataset contained information on border crossing and activity times between October 2008 and March 2010. Transport Canada (TC) and the Ontario Ministry of Transportation had been collecting data on border crossing times from a broader population of trucks using a Bluetooth-based approach. (Although it was known that the TC data covered a truck population broader than that represented by the FAST-certified CEVA truck fleet, the project team did not have access to the characteristics of truck population in the TC data.) The TC dataset contained crossing time records between February 9 and April 29, 2009. If the two data sets are substitutable in the general crossing time information they provide, it may not be useful to continue collecting both sets of data. If the sets are not substitutable, it would eventually be useful to investigate the possibility of using information from the two sets in a way that could take advantage of the distinctive characteristics of the two data sets. Therefore, multiple investigations were conducted to determine similarities in the data sets in terms of temporal patterns of truck volumes and of times incurred at the border crossing. Volume comparisons: To investigate whether the set of FAST-certified CEVA trucks and the set of TC trucks sampled from a broader population had the same temporal demand pattern, Figure 4-1 shows truck volumes by hour of day in the CEVA data for all records in the dataset (October 2008-March 2010). Figure 4-2 shows volumes by hour of day in the TC dataset, which as described, above encompasses dates between 02/09/2009 and 04/29/2009.

10
Figure 4-1: CEVA (Oct. 2008 – Mar. 2010) truck volumes by hour of day
Figure 4-2: Transport Canada (02/09/2009 - 04/29/2009) truck volumes by hour of day
Comparing the plots in the two figures reveals that some general trends are similar in the two data sets – e.g., decreased volumes beginning at approximately 7 pm for all bridge directions, peaking (global peaking for the CEVA truck volumes, local peaking for the TC truck data) in volumes in the late afternoon and early evening in both directions at the Ambassador Bridge crossings – but that there also seem to be important differences. It is also noted that the CEVA volumes appear to be much more balanced across directions for the same facility than are the TC data. Crossing-time comparisons: The temporal patterns of the CEVA and TC truck volumes at the border crossings appear sufficiently different that one would suspect that the distributions of

11
freight being transported in the two data sets have different characteristics. The border crossing times obtained from the two data sets were next compared to investigate whether these differences led to different border crossing times – possibly as a result of different paths taken through the border crossing facility or differences in processing times – or if, despite the difference exhibited in the time-of-day volume patterns, the vehicles could be considered as substitutable “probe vehicles” that provide similar information on crossing times. The locations at which the TC and CEVA data timestamps were triggered were different. Figures 4-3 through 4-6 indicate these locations. TC crossing times were determined between the points labeled A and B along the yellow line, and CEVA crossing time were determined between geo-fence boundary crossings labeled a and b. Because of these differences, patterns in the crossing times and deviations from the patterns, rather than magnitudes of the crossing times, were compared.
Figure 4-3: Locations between which TC crossing times (A and B) and CEVA crossing
times (a and b) are determined for Ambassador Bridge from Michigan to Ontario

12
Figure 4-4: Locations between which TC crossing times (A and B) and CEVA crossing
times (a and b) are determined for Ambassador Bridge from Ontario to Michigan
Figure 4-5: Locations between which TC crossing times (A and B) and CEVA crossing
times (a and b) are determined for Blue Water Bridge from Michigan to Ontario

13
Figure 4-6: Locations between which TC crossing times (A and B) and CEVA crossing
times (a and b) are determined for Blue Water Bridge from Ontario to Michigan Median hourly crossing times for the CEVA and TC data by hour of day are plotted for each crossing-direction in Figures 4-7 through 4-10. As mentioned above the magnitude of the times would not be expected to match. Rather, the temporal patterns in the plots are of interest. From these figures, the temporal patterns in the two datasets do not appear similar other than in the Ontario-to-Michigan direction at the Ambassador Bridge crossing (Figure 4-8).
Figure 4-7: Time-of-day plots for CEVA crossing times and TC crossing times for Ambassador
Bridge from Michigan to Ontario

14
Figure 4-8: Time-of-day plots for CEVA crossing times and TC crossing times for Ambassador
Bridge from Ontario to Michigan
Figure 4-9: Time-of-day plots for CEVA crossing times and TC crossing times for Blue Water
Bridge from Michigan to Ontario

15
Figure 4-10: Time-of-day plots for CEVA crossing times and TC crossing times for Blue Water
Bridge from Ontario to Michigan Although further investigations would be required before making definitive conclusions, the lack of strong correspondence in time-of-day patterns between the two data sets, other than in the Ontario-to-Michigan direction at the Ambassador Bridge crossing, would indicate that CEVA and TC data may not be substitutes in terms of determining general time-of-day patterns. To investigate if the datasets are similar in indicating conditions at a given time, crossing times for trucks from the two datasets arriving at the crossings at approximately the same time (time-of-day on same date) were matched and compared. First, median CEVA and TC crossing times were determined for 15-minute intervals on each date. Medians were then matched if they corresponded to the same 15-minute interval on the same date. Scatterplots of these matched 15-minute crossing time medians are plotted for each crossing-direction in Figures 4-11 through 4-14. The line in each figure represents the least-square regression line.

16
Figure 4-11: Matched (CEVA-TC) 15-minute median crossing times for Ambassador Bridge,
Michigan-to-Ontario data
Figure 4-12: Matched (CEVA-TC) 15-minute median crossing times for Ambassador Bridge, Ontario-to-Michigan data
Figure 4-13: Matched (CEVA-TC) 15-minute median crossing times for Blue Water Bridge,
Michigan-to-Ontario data
TC Median Crossing Time (mins)
TC Median Crossing Time (mins)
TC Median Crossing Time (mins)
CEVA
Med
ian
Cros
sing
Tim
e (m
ins)
CE
VA M
edia
n Cr
ossin
g Ti
me
(min
s)
CEVA
Med
ian
Cros
sing
Tim
e (m
ins)

17
Figure 4-14: Matched (CEVA-TC) 15-minute median crossing times for Blue Water Bridge,
Ontario-to-Michigan data The fitted regression lines in the scatterplots indicate positive association between the two data sets, but the apparent increasing trend in the data could be affected by influential points in the regression and not necessarily represent the true relationship. To investigate the association between the data more carefully, cross-tabulations of the paired data were formed. The cross tabulations were based on whether the specific 15-minute median times were less than or equal to the “overall median” of their respective median times. Specifically, the data were divided into four mutually exclusive and collectively exhaustive groups:
• Group 1: (TC 15-min median crossing time ≤ overall median TC crossing time, CEVA 15-min median crossing time ≤ overall median CEVA crossing time)
• Group 2: (TC 15-min median crossing time > overall median TC crossing time, CEVA 15-min median crossing time ≤ overall median CEVA crossing time)
• Group 3: (TC 15-min median crossing time ≤ overall median TC crossing time, CEVA 15-min median crossing time > overall median CEVA crossing time)
• Group 4: (TC 15-min median crossing time > overall median TC crossing time, CEVA 15-min median crossing time > overall median CEVA crossing time)
The resulting cross-tabulation tables for each crossing-direction are presented in Figure 4-15.
TC Median Crossing Time (mins)
CEVA
Med
ian
Cros
sing
Tim
e (m
ins)

18
Direction: AMB: MI-ON Direction: AMB: ON-MI
Median crossing time
Median crossing time
CEVA 5.83 mins
CEVA 10.25 mins
TC 6.1 mins
TC 7.6 mins
TC
TC
p-value: 0.05807 N <= median N > median p-value: <0.0001 N <= median
N > median
CEVA N <= median 264 221
CEVA N <= median 500 132
N > median 233 251 N > median 134 497 Direction: BWB: MI-ON Direction: BWB: ON-MI
Median crossing time
Median crossing time
CEVA 7.62 mins
CEVA 5.27 mins
TC 5.1 mins
TC 7.4 mins
TC
TC
p-value: 0.5469 N <= median N > median p-value: 0.001368 N <= median
N > median
CEVA N <= median 59 53
CEVA N <= median 109 73
N > median 53 58 N > median 77 104
Figure 4-15: Cross-tabulations of CEVA and TC 15-minute median crossing times by crossing-direction
The larger number of observations in the upper left and lower right cells, corresponding to Groups 1 and 4, respectively, indicate the positive association between the paired crossing times. That is, when the CEVA time during a specific 15-minute interval is lower (higher) than its median, the TC time during the same 15-minute interval tends to be lower (higher) than its median. Except for the Blue Water Bridge Michigan-to-Ontario crossing, the p-values resulting from Pearson’s Chi-square test of independence in the tables are very low resulting in a rejection of the null hypothesis that the specific 15-minute block data are independent of each other in favor of a strong association between the data sets. The higher number of diagonal counts, compared to the off-diagonal counts, indicates that the strong associations between the data sets observed for three of the four crossing-directions are positive. To refine the investigation, the individual data were matched in a manner that is believed to better represent common times when CEVA and TC trucks were crossing the border. Specifically, each CEVA crossing time was matched with the median of all TC crossing times that occurred on the same date within ±15 minutes of when the CEVA truck was recorded at the crossing. Figures 4-16 through 4-19 depict the resulting scatterplots. (The axes are flipped

19
between Figures 4-11 through 4-14 and Figures 4-16 and 4-19.) Cross-tabulation tables using the same grouping scheme as above are presented in Figure 4-20.
Figure 4-16: Matched CEVA crossing times to medians of TC crossing times occurring within +/-15 minutes for Ambassador Bridge, Michigan-to-Ontario data
Figure 4-17: Matched CEVA crossing times to medians of TC crossing times occurring within +/-15 minutes for Ambassador Bridge, Ontario-to-Michigan data
Figure 4-18: Matched CEVA crossing times to medians of TC crossing times occurring within
+/-15 minutes for Blue Water Bridge, Michigan-to-Ontario data
CEVA Median Crossing Time (mins)
CEVA Median Crossing Time (mins)
CEVA Median Crossing Time (mins)
TC M
edia
n Cr
ossin
g Ti
me
(min
s)
TC M
edia
n Cr
ossin
g Ti
me
(min
s)
TC M
edia
n Cr
ossin
g Ti
me
(min
s)

20
Figure.4-19: Matched CEVA crossing times to medians of TC crossing times occurring within
+/-15 minutes for Blue Water Bridge, Ontario-to-Michigan data
Direction: AMB: MI-ON Direction:
AMB: ON-MI
Medians of CEVA-TC median crossing time pairs Medians of CEVA-TC median crossing time pairs CEVA 10.6 Mins
CEVA 22.7 mins
TC 6.15 Mins
TC 7.7 mins
TC
TC
p-value: 0.002152 N <=
median N >
median p-value: <0.0001 N <=
median N >
median
CEVA N <= median 521 445
CEVA N <= median 810 243
N > median 455 516 N > median 243 811
Direction: BWB: MI-ON Direction:
BWB: ON-MI
Medians of CEVA-TC median crossing time pairs Medians of CEVA-TC median crossing time pairs CEVA 8.9 Mins
CEVA 10.9 mins
TC 5 Mins
TC 7.7 mins
TC
TC
p-value: 0.001737 N <=
median N >
median p-value: 0.006761 N <=
median N >
median
CEVA N <= median 129 94
CEVA N <= median 185 149
N > median 94 127 N > median 149 185
Figure 4-20: Cross-tabulations of CEVA crossing times with median of
TC crossing times occurring within 15 minutes
CEVA Median Crossing Time (mins)
TC M
edia
n Cr
ossin
g Ti
me
(min
s)

21
The results again strongly support positive associations between the general pattern (greater than or less than median) of crossing times obtained from CEVA trucks and from the broader population of trucks in the TC data. With this refined matching, a low p-value is seen in the Blue Water Bridge Michigan-to-Ontario crossing, as well as in the other three crossing-directions in Figure 4-20, so that a strong, positive association between the two sets of crossing times is now seen in all four crossing-directions. In summary, the lack of similarity in time-of-day crossing time patterns, as portrayed in Figures 4-7 through 4-10, indicates that the TC and CEVA data are likely not substitutable in terms of portraying general temporal patterns at the border crossings. However, the strong positive associations seen in the matched data analyses indicate that both sets of data are depicting similar deviations from base case conditions. Such similar depictions motivate future investigations of ways in which the different types of data could be combined to provide a more complete representation of crossing times, and the times incurred in the multiple activities associated with crossing the border, at the Ambassador Bridge and Blue Water Bridge facilities. 5. Documentation of Infrastructure Changes Affecting Geo-fences As discussed above, during this project period data could not be processed into final truck trip information because of misaligned skill sets in project personnel. Nevertheless, data were collected throughout the project period and preprocessed for future processing. During the project duration, infrastructure changes were noted that could influence the interpretation of truck times produced in the future. This section details noted changes that occurred at the two crossing facilities and their effects on the geo-fences in operation throughout the project period. Knowledge of these changes will be valuable for interpreting data that will be processed in the future and for potentially designing new geo-fences at the crossing facilities. Ambassador Bridge: Significant changes to the U.S. plaza configuration at the Ambassador Bridge affect the interpretation of the present geo-fence configurations. The presently implemented geo-fences at Ambassador Bridge, as seen in Figure 2-3, do not reflect Canada bound truck traffic flow through the US plaza as the Michigan Department of Transportation’s (MDOT) Gateway Project approached completion. Reconfiguration of the geo-fences would be required to accurately reflect the final configuration of the U.S. plaza. Truck traffic flow infrastructure on the U.S. and side of the Ambassador Bridge as of mid-September, 2012, is documented in Figure 5-1. According to MDOT’s Gateway project website (www.michigan.gov/gateway; accessed 9/26/2012, the ramps from NB & SB I-75 and EB I-96 to the plaza opened Friday, September 21, 2012 (Figure 5-1).

22
Figure 5-1: Map of Ramps from I-75/I-96 to Ambassador Bridge customs/toll
plaza that opened September 21, 2012. Source: http://www.michigan.gov/documents/mdot/MDOT_DBGatewayOpeningMap_398615_7.pdf
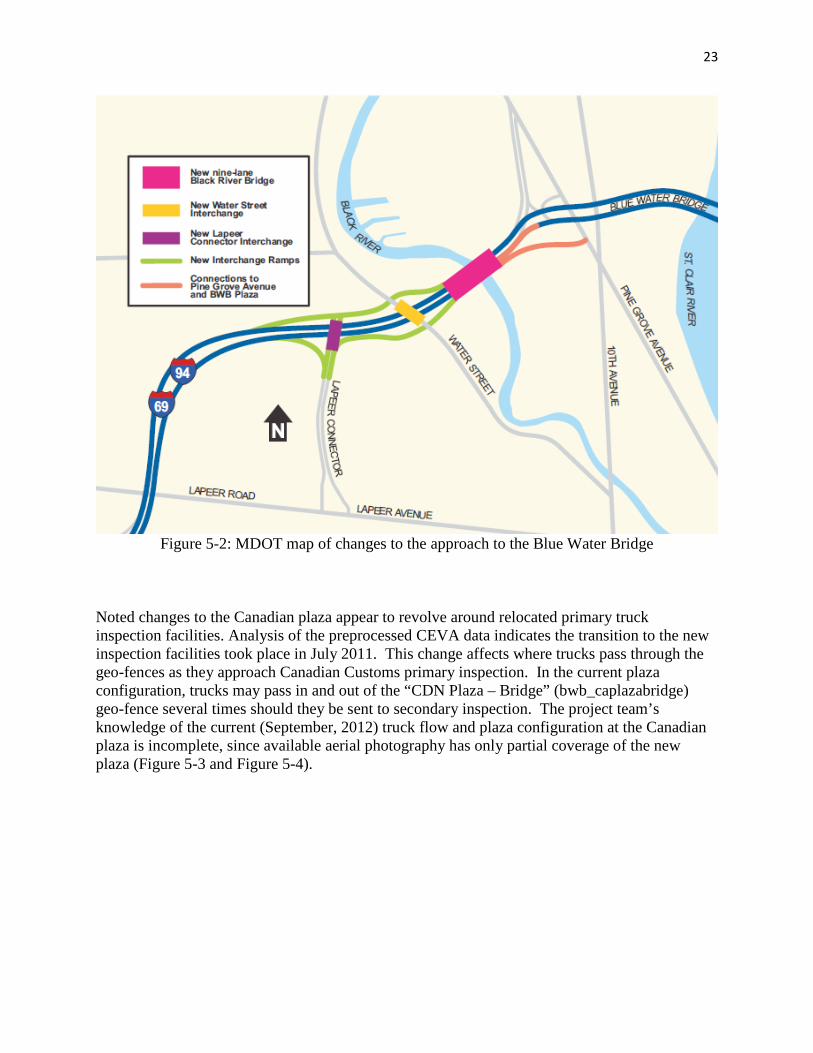
Blue Water Bridge: At the Blue Water Bridge crossing, changes to the I-69/I-94 approach to the U.S. plaza and to the location of primary and secondary inspection on the Canadian side of the crossing are noted, as are changes to Highway 402 intended to improve traffic flow approaching the bridge. On the U.S. side of the bridge, the I-69 / I-94 Black River Bridge replacement project began in March 2011 and was scheduled to be completed in November, 2012 (Figure 5-2). Infrastructure upgrades are to include a new nine-lane bridge over the Black River, a new Lapeer Road connector interchange, a new Water Street interchange, and new ramps and connectors to the Blue Water Bridge plaza and Pine Grove Avenue. These changes do not affect the layout of the Blue Water Bridge U.S. plaza, and all changes are within the footprint of existing geo-fences (Figure 2-4).
23
Figure 5-2: MDOT map of changes to the approach to the Blue Water Bridge
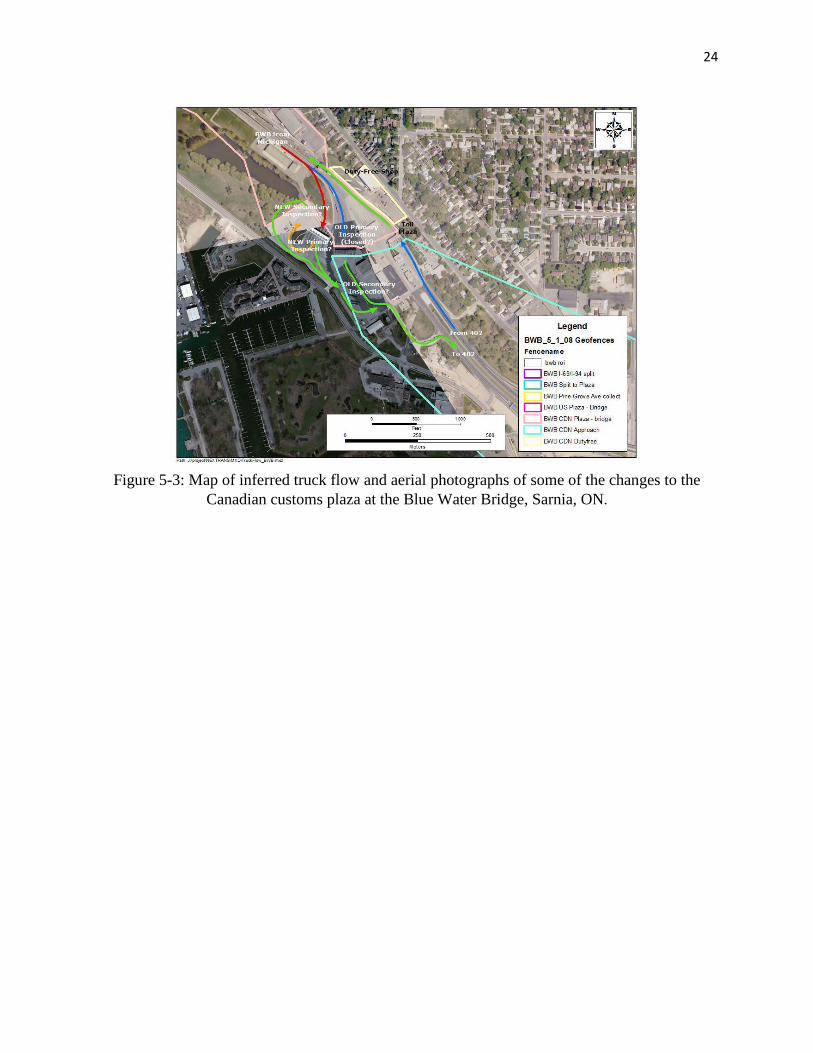
Noted changes to the Canadian plaza appear to revolve around relocated primary truck inspection facilities. Analysis of the preprocessed CEVA data indicates the transition to the new inspection facilities took place in July 2011. This change affects where trucks pass through the geo-fences as they approach Canadian Customs primary inspection. In the current plaza configuration, trucks may pass in and out of the “CDN Plaza – Bridge” (bwb_caplazabridge) geo-fence several times should they be sent to secondary inspection. The project team’s knowledge of the current (September, 2012) truck flow and plaza configuration at the Canadian plaza is incomplete, since available aerial photography has only partial coverage of the new plaza (Figure 5-3 and Figure 5-4).
24
Figure 5-3: Map of inferred truck flow and aerial photographs of some of the changes to the
Canadian customs plaza at the Blue Water Bridge, Sarnia, ON.

25
Figure 5-4: An Aerial photograph from spring, 2010 of the Blue Water Bridge Canadian customs
plaza showing the construction of the new truck primary and secondary inspection areas under construction. Source: http://www.lambtongis.ca/siteselector/
26
6. Expressed Stakeholder Interest One of the project investigators previously presented results obtained using the geo-fence approach at the Ambassador Bridge and Blue Water Bridge crossings at a regional freight conference. Attending the presentation were a senior vice president from the Detroit bureau of a large, multinational customs and international trade services provider and an economic and regulations officer from the Canadian Consulate. These individuals approached the project investigator after the presentation commenting on the uniqueness and potential value of the quantitative results produced and requesting further documentation. Documentation was prepared and sent and several follow-up teleconferences were held during the timeframe of this project. In addition, the Canadian Consulate officer visited the project senior investigators. Without solicitation, the Michigan Department of Transportation also contacted the investigators for information regarding their efforts during the timeframe of this project. The difficulties with processing new data discussed in Section 3 precluded serious outreach to be undertaken during this project. 7. Summary and Conclusions Large quantities of truck movement data at two of the busiest and most valuable international truck border crossings in North America were collected using a geo-fence based approach that takes advantage of technologies presently deployed on large truck fleets. Although the data were successfully preprocessed, misaligned technical skills of data analysts did not allow processing of the data to produce activity times. Personnel with appropriate skills will be sought to allow processing of data recently collected and data that will be collected in the future. Empirical comparisons were made between crossing times produced using the geo-fence based approach with data previously collected and processed by project personnel and crossing times previously produced from data collected by Transport Canada and the Ontario Ministry of Transport using a Bluetooth-based approach. The geo-fence based data produced information on multiple activities associated with crossing the border, whereas the Transport Canada data only produced crossing times. However the Transport Canada data covered a broader population of trucks. The empirical comparisons indicate strong, positive associations in concurrent crossing times produced from the two datasets. However, the average time-of-day patterns produced from the two datasets are sufficiently different that one cannot consider the two datasets to be substitutes for each other. Rather it would useful to investigate ways to combine the two datasets to provide better estimates of activity times at these important North American border facilities. Infrastructure changes at the facilities were noted. It will be important to determine the effect of these changes on activity times determined from presently implemented geo-fences and to assess the need for new geo-fences. Finally, strong interest expressed by experienced border personnel motivates continued data collection and processing to produce what appears to be unique information on truck activity times at these two major border crossings.

27
References (1) Neto, O., et al. Tracking Large Trucks in Real Time with License Plate Recognition and Text-Mining Techniques. Paper presented at the 88th Annual Meeting of the Transportation Research Board, Washington, DC. 2009. (2) Texas Transportation Institute and Battelle Memorial Institute. Evaluation of Travel Time Methods to Support Mobility Performance Monitoring: FY 2001 Synthesis Report. http://ops.fhwa.dot.gov/freight/freight_analysis/brdr_synthesis/ 2002, accessed July 26, 2007. (3) Sabean, J. and C. Jones. Inventory of Current Programs for Measuring Wait Times at Land Border Crossings. Transport Canada and Federal Highway Administration, for the U.S. Department of Homeland Security and Canada Border Services Agency. 25 pp. http://www.thetbwg.org/downloads/Inventory%20of%20Current%20Wait%20Time%20Programs_May%2021%202008.pdf , 2008, accessed February 11, 2009. (4) McCord, M.R., P.K. Goel, C. Brooks, P. Kapat, R. Wallace, H. Dong, D.E. Keefauver, “Documenting Truck Activity Times at International Border Crossings Using Redesigned Geo-fences and Existing On-board Systems,” Transportation Research Record, vol.2162(1): 81-89, 2010. (5) McCord, M.R., P. Goel, P. Kapat, C. Merry , M. Hickman, P. Mirchandani, C. Broods, and E. Keefauver, R. Wallace, CRESTA: Consortium on Remote Sensing of Freight Flows in Congested Border Crossings and Work Zones,” Final Report prepared for US DOT-Research and Innovative Technologies Administration, 2011, 156 pp.