Embed Size (px)
Citation preview

Measurements performed on a generator with housing 5RN90L04V
and a 4-pole armature equipped with neodymium magnets
ing. A. Kragten
March 2001
Reviewed March 2015
KD 78
It is allowed to copy this report for private use.
Engineering office Kragten Design
Populierenlaan 51
5492 SG Sint-Oedenrode
The Netherlands
telephone: +31 413 475770
e-mail: [email protected]
website: www.kdwindturbines.nl

2
Contents page
1 Introduction 3
2 Measurements general 3
3 Unloaded and short-circuited measurements for star and delta 4
4 Measurements for different constant voltages in star 7
5 Measurements for different constant voltages in delta 9
6 Measurements for different constant currents in star 12
7 Measurements for different constant rotational speeds in star 14
8 Discussion about the results 18
9 Measurements for different constant resistances in star 19
10 References 25

3
1 Introduction
General information about PM-generators developed by Kragten Design is given in the free
public report KD 341 (ref. 1). The measured generator was developed for a small windmill
with a rotor diameter of maximal 3 m. The windmill rotor is mounted directly to the generator
shaft. The generator is made using the housing of a standard 4-pole asynchronous motor
which is provided with a new stainless steel shaft and an armature with neodymium magnets.
The following motor was chosen: Manufacture: Rotor B.V. Eibergen, type:
5RN90L04V (with over-sized stator), provided with a standard 230/400V, 3-phase winding,
nominal mechanical power 2.5 kW, mass 19.5 kg. The drawing number of the generator with
the standard 230/400 V winding is 1101-02. This generator, with the winding rectified in delta
for 24 V battery charging, is used for the VIRYA-2.68. The drawing number of the generator
with the modified 115/200 winding is 0512-02. This generator, with the winding rectified in
star for 24 V battery charging, is used for the VIRYA-3 and the VIRYA-3B3. The winding is
modified by connecting the first and the second layer in parallel in stead of in series.
2 Measurements general
The generator was measured on a torque measuring device of the Laboratory of
Electro-mechanics of the Eindhoven University of Technology in March 2001. Originally, the
figures in the measuring report were hand written but in 2015 the figures have been made
digital using Excel. The lay out of the report was changed and extra chapters were added.
The driving motor is supported pendulous in two air film bearings and therefore the
torque can be measured very accurately. The rotational speed is measured by a counter which
counts the number of sleeves of a disk mounted to the driving motor shaft. As the disk has 60
sleeves, the number of pulses per second is equal to the rotational speed in rpm. The torque
measuring device was hired at a tariff of dfl 25,- / hour.
The measurements were performed for star and for delta rectification. A heavy 3-phase
bridge rectifier was used made of three blocks with each 2 diodes. For battery charging, the
generator was measured for the speed range in between 0 and 1000 rpm and for several
constant voltages. The generator has been measured for constant voltages of 13 V, 26 V, 52 V
and 76 V (it was planned to measure for 78 V but by mistake 76 V was chosen). For 13 V and
26 V low power, the battery charge controller of the VIRYA-2.2S windmill was used. For
26 V high power and for 52 V and 76 V a variable resistance was used as load. The
combination of the resistance and the rotational speed was chosen such that the voltage had
the correct constant value. Because this takes more time than with the battery charge
controller, the generator becomes warmer at the end of a set of measurements and this will
have influenced the result somewhat because the resistance of the windings increases by
temperature. Rectification of the VIRYA generators is explained in report KD 340 (ref. 2).
The effective voltage of a 1-phase AC voltage UAC eff is given as a function of the peak
value UAC peak by the formula:
UAC eff = ½ 2 * UAC peak (V) (1)
The open DC voltage UDC for star rectification, neglecting the voltage drop over the diodes, is
given by:
UDC = 0.955 * 2 * 3 * UAC eff = 2.3393 * UAC eff (V) (2)
The open DC voltage UDC for delta rectification is given by:
UDC = 0.955 * 2 * UAC eff = 1.3506 * UAC eff (V) (3)

4
If the windmill is coupled directly to a positive displacement pump, the pump torque and
therefore the required current will be about constant. Therefore also measurements have been
executed for star rectification for constant currents of 1 A up to 8 A.
For possible other applications than use in a windmill, the generator was also measured
at 500, 750, 1000, 1250 and 1500 rpm for star rectification with a variable resistance as load.
The measured magnitudes are: torque Q (Nm), rotational speed n (rpm), rectified
voltage U (V) and rectified current I (A). Calculated were: the resistance R (), the required
mechanical power Pmech (W), the generated electrical power after rectification Pel (W) and the
efficiency (%).
For all measurements the generator was cooled with an external ventilator because the
original motor ventilator was cancelled for the windmill generator. If the generator is used at
higher rotational speeds, and therefore at higher powers, the original ventilator might be
necessary and this will cause a small decrease in efficiency because of the power consumption
of the ventilator.
After each set of measurements the generator was cooled for about half an hour so that
all measurements start at room temperature. The generator was measured for the following
configurations:
1 Unloaded, rectified in star and delta for 0 < n < 1500 rpm (see chapter 3).
2 Short-circuit before the rectifier in star and delta for 0 < n < 1000 rpm (see chapter 3).
3 Rectified in star for 26 V, 52 V and 76 V for 0 < n < 1000 rpm (see chapter 4).
4 Rectified in delta for 13 V, 26 V, 52 V and 76 V for 0 < n < 1000 rpm (see chapter 5).
5 Rectified in star for constant currents of 1 A, 2 A, 3 A, 4 A, 5 A, 6 A, 7 A and 8 A
(see chapter 6).
6 Rectified in star for a variable resistance as load for n = 500 rpm, 750 rpm, 1000 rpm,
1250 rpm and 1500 rpm (see chapter 7)
The measurements for rectification in star and a variable resistance as load are not given as a
function of the rotational speed n, like it is done for the other measurements, but as a function
of the resistance R. However, in chapter 9 a method has been developed to give these
measurements as a function of the rotational speed.
3 Unloaded and short-circuited measurements for star and delta
0
50
100
150
200
250
300
350
400
450
500
0 100 200 300 400 500 600 700 800 900 1000 1100 1200 1300 1400 1500
rotational speed n (rpm)
DC
vo
lta
ge
U (
V)
star unloaded
delta unloaded
fig. 1 Unloaded DC voltage U as a function of n for star and delta

5
0
0,2
0,4
0,6
0,8
1
1,2
1,4
1,6
1,8
2
0 100 200 300 400 500 600 700 800 900 1000 1100 1200 1300 1400 1500
rotational speed n (rpm)
torq
ue
Q (
Nm
)
star unloaded
delta unloaded
fig. 2 Unloaded torque Q as a function of n for star and delta
0
20
40
60
80
100
120
140
160
180
200
220
240
260
280
300
0 100 200 300 400 500 600 700 800 900 1000 1100 1200 1300 1400 1500
rotational speed n (rpm)
po
wer
P (
W)
star unloaded
delta unloaded
fig. 3 Unloaded power P as a function of n for star and delta
6
0
2
4
6
8
10
12
14
16
18
20
22
24
26
28
30
32
34
36
38
0 100 200 300 400 500 600 700 800 900 1000 1100
rotational speed n (rpm)
torq
ue
Q (
Nm
)
star short-circ.
delta short-circ.
fig. 4 Torque Q for short circuit in star and delta as a function of n
0
500
1000
1500
2000
2500
3000
3500
0 100 200 300 400 500 600 700 800 900 1000 1100
rotational speed n (rpm)
po
wer
P (
W)
star short-circ.
delta short-circ.
fig. 5 Power P for short circuit in star and delta as a function of n
7
4 Measurements for different constant voltages in star
0
5
10
15
20
25
30
35
40
45
50
55
60
65
70
75
80
0 100 200 300 400 500 600 700 800 900 1000 1100
rotational speed n (rpm)
DC
vo
ltag
e U
(V
)
26 V star
52 V star
76 V star
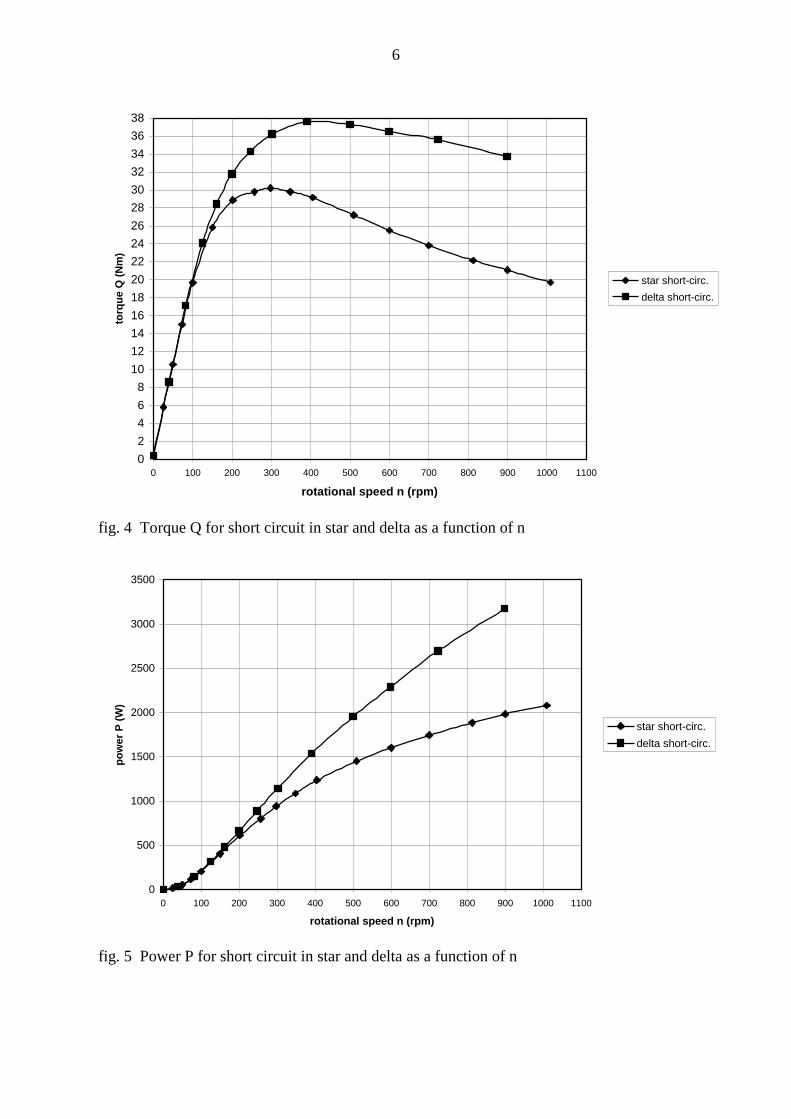
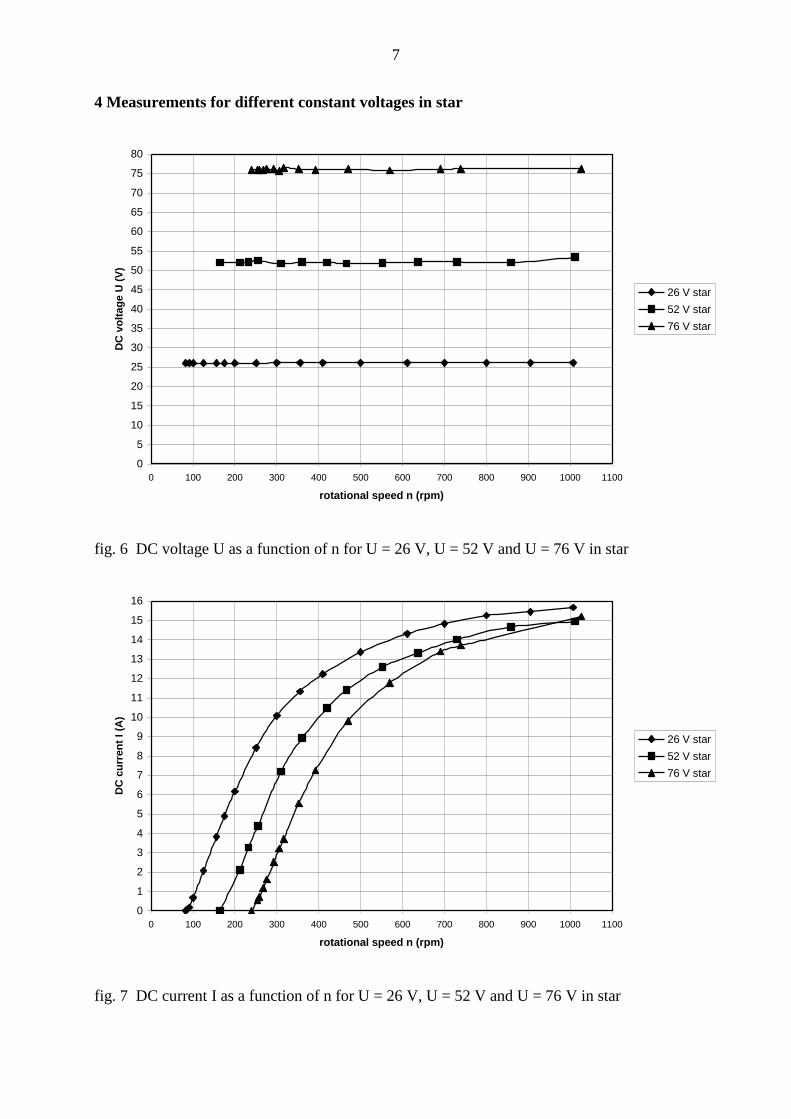
fig. 6 DC voltage U as a function of n for U = 26 V, U = 52 V and U = 76 V in star
0
1
2
3
4
5
6
7
8
9
10
11
12
13
14
15
16
0 100 200 300 400 500 600 700 800 900 1000 1100
rotational speed n (rpm)
DC
cu
rren
t I
(A)
26 V star
52 V star
76 V star
fig. 7 DC current I as a function of n for U = 26 V, U = 52 V and U = 76 V in star

8
0
2
4
6
8
10
12
14
16
18
20
22
24
26
28
30
0 100 200 300 400 500 600 700 800 900 1000 1100
rotational speed n (rpm)
torq
ue Q
(N
m)
26 V star
52 V star
76 V star
fig. 8 Torque Q as a function of n for U = 26 V, U = 52 V and U = 76 V in star
0
200
400
600
800
1000
1200
1400
1600
1800
2000
2200
2400
2600
2800
3000
0 100 200 300 400 500 600 700 800 900 1000 1100
rotational speed n (rpm)
po
wer
P (
W)
Pmech 26 V star
Pmech 52 V star
Pmech 76 V star
Pel 26 V star
Pel 52 V star
Pel 76 V star
fig. 9 Mechanical power Pmech and electrical power Pel as a function of n for U = 26 V,
U = 52 V and U = 76 V in star

9
0
5
10
15
20
25
30
35
40
45
50
55
60
65
70
75
80
0 100 200 300 400 500 600 700 800 900 1000 1100
rotational speed n (rpm)
eff
icie
nc
y
(%
)
26 V star
52 V star
76 V star
fig. 10 Efficiency as a function of n for U = 26 V, U = 52 V and U = 76 V in star
5 Measurements for different constant voltages in delta
0
5
10
15
20
25
30
35
40
45
50
55
60
65
70
75
80
0 50 100 150 200 250 300 350 400 450 500 550 600 650 700 750 800 850 900 950 100
0
rotational speed n (rpm)
DC
vo
ltag
e U
(V
)
13 V delta
26 V delta
52 V delta
76 V delta
fig. 11 DC voltage U as a function of n for U = 13 V, U = 26 V, U = 52 V and U = 76 V in
delta

10
0
2
4
6
8
10
12
14
16
18
20
22
24
26
28
30
0 50 100 150 200 250 300 350 400 450 500 550 600 650 700 750 800 850 900 950 100
0
rotational speed n (rpm)
DC
cu
rren
t I
(A)
13 V delta
26 V delta
52 V delta
76 V delta
fig. 12 DC current I as a function of n for U = 13 V, U = 26 V, U = 52 V and U = 76 V in
delta
0
2
4
6
8
10
12
14
16
18
20
22
24
26
28
30
32
34
36
38
0 50 100 150 200 250 300 350 400 450 500 550 600 650 700 750 800 850 900 950 100
0
rotational speed n (rpm)
torq
ue
Q (
Nm
)
13 V delta
26 V delta
52 V delta
76 V delta
fig. 13 Torque Q as a function of n for U = 13 V, U = 26 V, U = 52 V and U = 76 V in
delta

11
0
200
400
600
800
1000
1200
1400
1600
1800
2000
2200
2400
2600
2800
3000
3200
3400
3600
3800
0 50 100 150 200 250 300 350 400 450 500 550 600 650 700 750 800 850 900 950 1000
rotational speed n (rpm)
po
wer
P (
W)
Pmech 13 V delta
Pmech 26 V delta
Pmech 52 V delta
Pmech 76 V delta
Pel 13 V delta
Pel 26 V delta
Pel 52 V delta
Pel 76 V delta
fig. 14 Mechanical power Pmech and electrical power Pel as a function of n for U = 13 V,
U = 26 V, U = 52 V and U = 76 V in delta
0
5
10
15
20
25
30
35
40
45
50
55
60
65
70
75
80
0 50 100 150 200 250 300 350 400 450 500 550 600 650 700 750 800 850 900 950 100
0
rotational speed n (rpm)
eff
icie
nc
y
(%
)
13 V delta
26 V delta
52 V delta
76 V delta
fig. 15 Efficiency as a function of n for U = 13 V, U = 26 V, U = 52 V and U = 76 V in
delta

12
6 Measurements for different constant currents in star
0
20
40
60
80
100
120
140
160
180
200
220
240
260
280
300
0 50 100 150 200 250 300 350 400 450 500 550 600 650 700 750 800 850 900
rotational speed n (rpm)
DC
vo
ltag
e U
(A
)
I = 0 A
I = 1 A
I = 2 A
I = 3 A
I = 4 A
I = 5 A
I = 6 A
I = 7 A
I = 8 A
fig. 16 DC voltage U as a function of n for D C currents I = 0 A, I = 1 A, I = 2 A, I = 3 A,
I = 4 A, I = 5 A, I = 6 A, I = 7 A and I = 8 A
0
2
4
6
8
10
12
14
16
18
20
22
24
0 50 100 150 200 250 300 350 400 450 500 550 600 650 700 750 800 850 900
rotational speed n (rpm)
torq
ue Q
(N
m)
I = 0 A
I = 1 A
I = 2 A
I = 3 A
I = 4 A
I = 5 A
I = 6 A
I = 7 A
I = 8 A
fig. 17 Torque Q as a function of n for D C currents I = 0 A, I = 1 A, I = 2 A, I = 3 A,
I = 4 A, I = 5 A, I = 6 A, I = 7 A and I = 8 A
13
0
200
400
600
800
1000
1200
1400
1600
1800
2000
2200
0 50 100 150 200 250 300 350 400 450 500 550 600 650 700 750 800 850 900
rotational speed n (rpm)
mech
an
ical
po
wer
Pm
ech (
W) I = 0 A
I = 1 A
I = 2 A
I = 3 A
I = 4 A
I = 5 A
I = 6 A
I = 7 A
I = 8 A
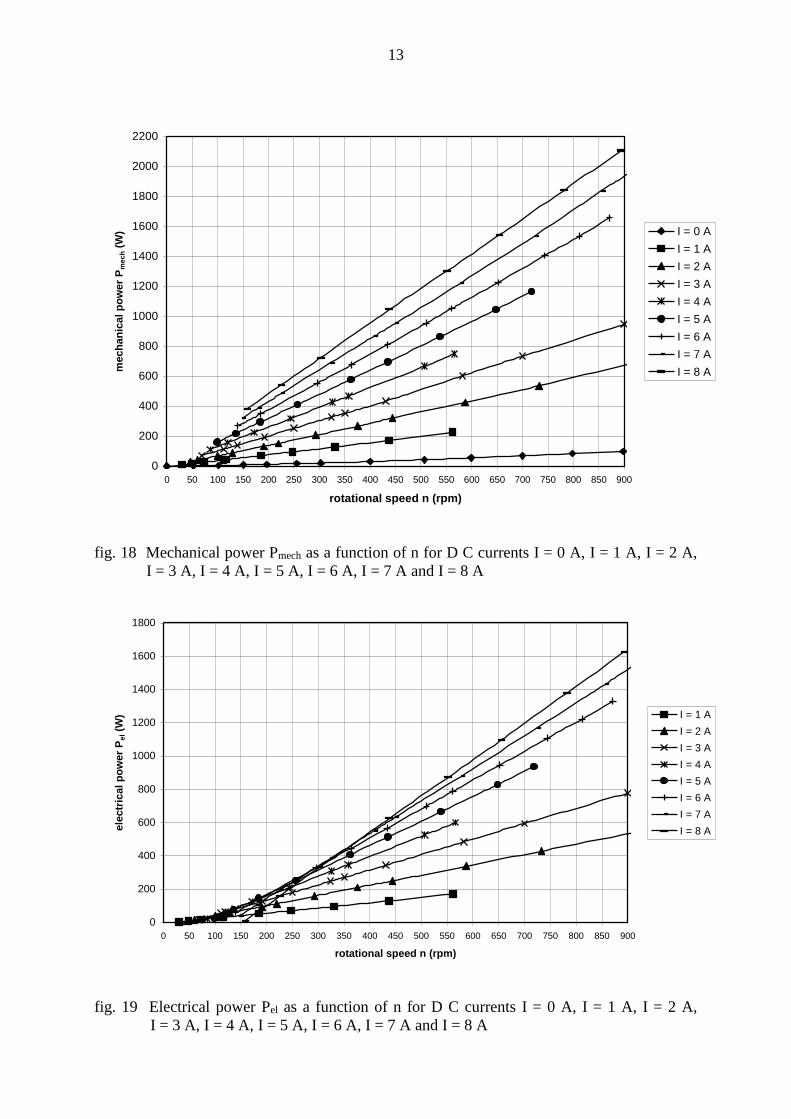
fig. 18 Mechanical power Pmech as a function of n for D C currents I = 0 A, I = 1 A, I = 2 A,
I = 3 A, I = 4 A, I = 5 A, I = 6 A, I = 7 A and I = 8 A
0
200
400
600
800
1000
1200
1400
1600
1800
0 50 100 150 200 250 300 350 400 450 500 550 600 650 700 750 800 850 900
rotational speed n (rpm)
ele
ctr
ical
po
wer
Pel (
W) I = 1 A
I = 2 A
I = 3 A
I = 4 A
I = 5 A
I = 6 A
I = 7 A
I = 8 A
fig. 19 Electrical power Pel as a function of n for D C currents I = 0 A, I = 1 A, I = 2 A,
I = 3 A, I = 4 A, I = 5 A, I = 6 A, I = 7 A and I = 8 A

14
0
10
20
30
40
50
60
70
80
90
0 50 100 150 200 250 300 350 400 450 500 550 600 650 700 750 800 850 900
rotational speed n (rpm)
eff
icie
nc
y
(%
)
I = 1 A
I = 2 A
I = 3 A
I = 4 A
I = 5 A
I = 6 A
I = 7 A
I = 8 A
fig. 20 Efficiency as a function of n for D C currents I = 0 A, I = 1 A, I = 2 A, I = 3 A,
I = 4 A, I = 5 A, I = 6 A, I = 7 A and I = 8 A
7 Measurements for different constant rotational speeds in star
0
20
40
60
80
100
120
140
160
180
200
220
240
260
280
300
320
340
360
380
400
420
440
460
0 10 20 30 40 50 60 70 80 90 100 110 120 130 140 150 160 170 180
resistance R (Ohm)
DC
vo
ltag
e U
(V
)
n = 500 rpm
n = 750 rpm
n = 1000 rpm
n = 1250 rpm
n = 1500 rpm
fig. 21 DC voltage U as a function of R for n = 500 rpm, n = 750 rpm, n = 1000 rpm,
n = 1250 rpm and n = 1500 rpm in star
15
0
1
2
3
4
5
6
7
8
9
10
11
12
13
14
15
16
0 10 20 30 40 50 60 70 80 90 100 110 120 130 140 150 160 170 180
resistance R (Ohm)
DC
Cu
rren
t I
(A)
n = 500 rpm
n = 750 rpm
n = 1000 rpm
n = 1250 rpm
n = 1500 rpm
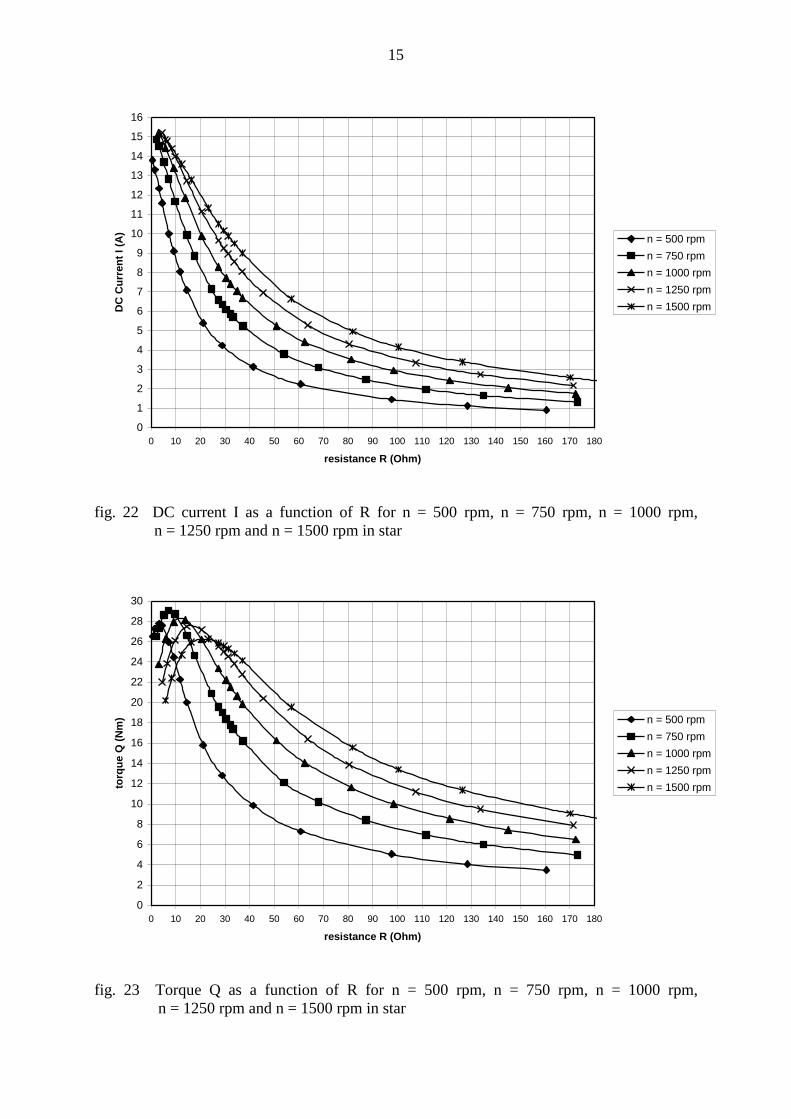
fig. 22 DC current I as a function of R for n = 500 rpm, n = 750 rpm, n = 1000 rpm,
n = 1250 rpm and n = 1500 rpm in star
0
2
4
6
8
10
12
14
16
18
20
22
24
26
28
30
0 10 20 30 40 50 60 70 80 90 100 110 120 130 140 150 160 170 180
resistance R (Ohm)
torq
ue
Q (
Nm
) n = 500 rpm
n = 750 rpm
n = 1000 rpm
n = 1250 rpm
n = 1500 rpm
fig. 23 Torque Q as a function of R for n = 500 rpm, n = 750 rpm, n = 1000 rpm,
n = 1250 rpm and n = 1500 rpm in star

16
0
200
400
600
800
1000
1200
1400
1600
1800
2000
2200
2400
2600
2800
3000
3200
3400
3600
3800
4000
4200
0 10 20 30 40 50 60 70 80 90 100 110 120 130 140 150 160 170 180
resistance R (Ohm)
mech
an
ical
po
wer
Pm
ech (
W)
n = 500 rpm
n = 750 rpm
n = 1000 rpm
n = 1250 rpm
n = 1500 rpm
fig. 24 Mechanical power Pmech as a function of R for n = 500 rpm, n = 750 rpm,
n = 1000 rpm, n = 1250 rpm and n = 1500 rpm in star
0
200
400
600
800
1000
1200
1400
1600
1800
2000
2200
2400
2600
2800
3000
3200
0 10 20 30 40 50 60 70 80 90 100 110 120 130 140 150 160 170 180
resistance R (Ohm)
ele
ctr
ical
po
wer
Pel (
W)
n = 500 rpm
n = 750 rpm
n = 1000 rpm
n = 1250 rpm
n = 1500 rpm
fig. 25 Electrical power Pel as a function of R for n = 500, n = 750, n = 1000, n = 1250 and
n = 1500 rpm in star

17
0
10
20
30
40
50
60
70
80
90
0 10 20 30 40 50 60 70 80 90 100 110 120 130 140 150 160 170 180
resistance R (Ohm)
eff
icie
nc
y
(%
)
n = 500 rpm
n = 750 rpm
n = 1000 rpm
n = 1250 rpm
n = 1500 rpm
fig. 26 Efficiency as a function of R for n = 500, n = 750, n = 1000, n = 1250 and
n = 1500 rpm in star

18
8 Discussion about the results
The unloaded U-n curves are straight lines through the origin (see figure 1). The ratios
between the measured open voltages correspond about to formulas 2 and 3 (see figure 1). The
effective alternating voltage of 1-phase was not measured so this voltage could not be
checked but earlier measurement has shown that this ratio is also correct. The unloaded Q-n
line for delta is lying a lot higher than the unloaded Q-n line for star (see figure 2). This is
caused by higher harmonic currents circulating in the triangle for delta rectification. Therefore
delta rectification may cause starting problems if the windmill rotor has a low starting torque
coefficient.
The maximum short-circuit torque level for delta rectification is a lot higher than for
star rectification (see figure 4). The maximum torque for short-circuit in delta is 37.7 Nm and
short-circuit in star is 30.2 Nm. Short-circuit in delta gives a maximum torque which is about
a factor 1.25 higher. So stopping the windmill rotor by making short-circuit of the generator
winding is most effective if short-circuit is made in delta. However, the braking effect for
short-circuit in star will be the same as for short-circuit in delta if the star point is
short-circuited too.
The Q-n curves for constant voltages all have about the same shape and the same
maximum value. The curve for a higher voltage can be found by shifting the curve of a low
voltage to the right over a certain distance (see figures 8 and 13). The Pmech-n curves and the
Pel-n curves can be drawn in one graph (see figure 9 and 14). In these figures it can be seen
that the maximum electrical power at high rpm is highest for the highest voltage. As the
voltage is taken higher, the efficiency increases because the I2 R losses are relatively
smaller. The rpm range with good efficiency is also larger for higher voltages (see figures 10
and 15).
The U-n curves for measurements with constant currents are all straight lines (see
figure 16). For some currents ( I = 1 A, I = 4 A and I = 5 A) the measurements have not been
performed for high rotational speeds but the values for high rotational speeds can easily be
found by interpolation. The Q-n lines for constant currents are almost straight horizontal lines
(see figure 17). The Pmech-n and the Pel-n curves are also almost straight lines (see figure 18
and 19). The efficiencies increase very fast at increasing rotational speed (see figure 20).
The Q-R lines for a resistance as load and for the five constant rotational speeds have a
maximum at very low values of the resistance R (see figure 23). For these measurements,
efficiencies of more than 80 % are measured if the resistance is not too low (see figure 26).
This is very good for a generator of this size especially because the rectifier losses are
included in the generator efficiency. Efficiencies of more than 75 % are obtained for all rpm if
the resistance is larger than about 25 . The highest efficiency has been measured for
1250 rpm. It was found that max = 83 % for R = 63.7 . The electrical power at this load,
Pel = 1783 W (see figure 25). At n = 1500 rpm, a maximum electrical power, Pel = 3063 W is
generated for a resistance R = 31.4 (see figure 25). This power is a factor 1.225 higher than
the nominal motor power of 2500 W. The efficiency at this power is 77.1 % which is still
rather good.
19
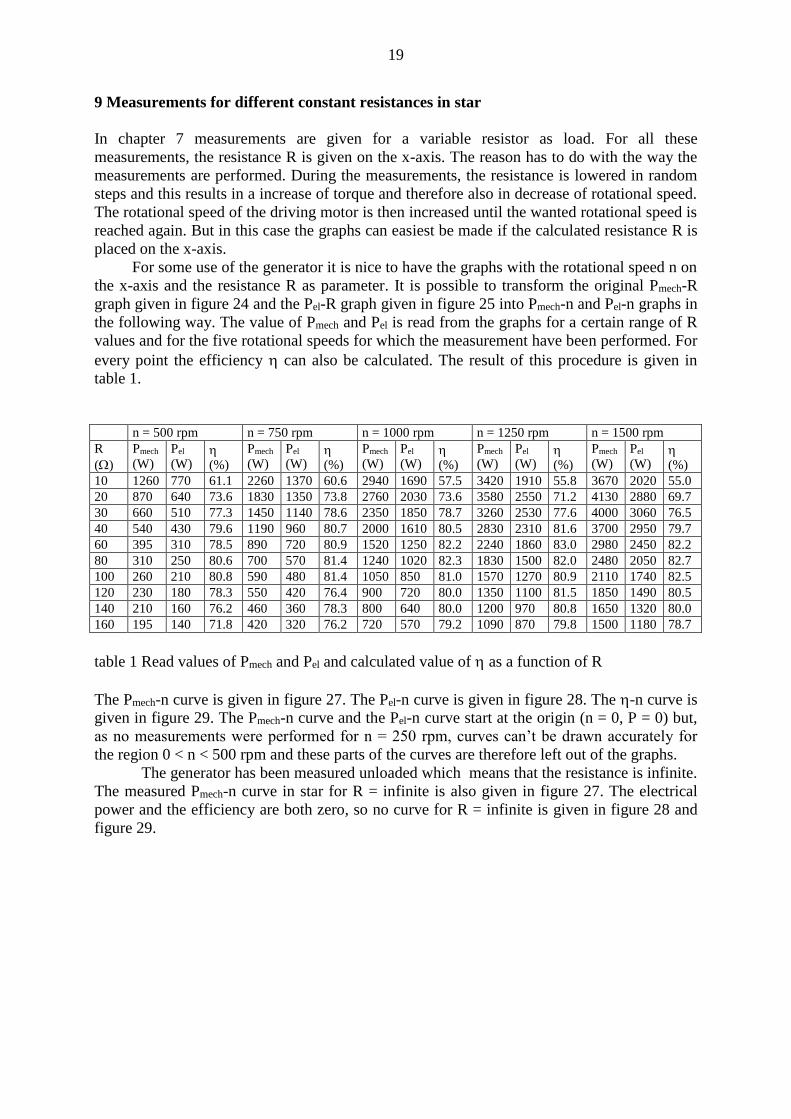
9 Measurements for different constant resistances in star
In chapter 7 measurements are given for a variable resistor as load. For all these
measurements, the resistance R is given on the x-axis. The reason has to do with the way the
measurements are performed. During the measurements, the resistance is lowered in random
steps and this results in a increase of torque and therefore also in decrease of rotational speed.
The rotational speed of the driving motor is then increased until the wanted rotational speed is
reached again. But in this case the graphs can easiest be made if the calculated resistance R is
placed on the x-axis.
For some use of the generator it is nice to have the graphs with the rotational speed n on
the x-axis and the resistance R as parameter. It is possible to transform the original Pmech-R
graph given in figure 24 and the Pel-R graph given in figure 25 into Pmech-n and Pel-n graphs in
the following way. The value of Pmech and Pel is read from the graphs for a certain range of R
values and for the five rotational speeds for which the measurement have been performed. For
every point the efficiency can also be calculated. The result of this procedure is given in
table 1.
n = 500 rpm n = 750 rpm n = 1000 rpm n = 1250 rpm n = 1500 rpm
R
()
Pmech
(W)
Pel
(W) (%)
Pmech
(W)
Pel
(W) (%)
Pmech
(W)
Pel
(W) (%)
Pmech
(W)
Pel
(W) (%)
Pmech
(W)
Pel
(W) (%)
10 1260 770 61.1 2260 1370 60.6 2940 1690 57.5 3420 1910 55.8 3670 2020 55.0
20 870 640 73.6 1830 1350 73.8 2760 2030 73.6 3580 2550 71.2 4130 2880 69.7
30 660 510 77.3 1450 1140 78.6 2350 1850 78.7 3260 2530 77.6 4000 3060 76.5
40 540 430 79.6 1190 960 80.7 2000 1610 80.5 2830 2310 81.6 3700 2950 79.7
60 395 310 78.5 890 720 80.9 1520 1250 82.2 2240 1860 83.0 2980 2450 82.2
80 310 250 80.6 700 570 81.4 1240 1020 82.3 1830 1500 82.0 2480 2050 82.7
100 260 210 80.8 590 480 81.4 1050 850 81.0 1570 1270 80.9 2110 1740 82.5
120 230 180 78.3 550 420 76.4 900 720 80.0 1350 1100 81.5 1850 1490 80.5
140 210 160 76.2 460 360 78.3 800 640 80.0 1200 970 80.8 1650 1320 80.0
160 195 140 71.8 420 320 76.2 720 570 79.2 1090 870 79.8 1500 1180 78.7
table 1 Read values of Pmech and Pel and calculated value of as a function of R
The Pmech-n curve is given in figure 27. The Pel-n curve is given in figure 28. The -n curve is
given in figure 29. The Pmech-n curve and the Pel-n curve start at the origin (n = 0, P = 0) but,
as no measurements were performed for n = 250 rpm, curves can’t be drawn accurately for
the region 0 < n < 500 rpm and these parts of the curves are therefore left out of the graphs.
The generator has been measured unloaded which means that the resistance is infinite.
The measured Pmech-n curve in star for R = infinite is also given in figure 27. The electrical
power and the efficiency are both zero, so no curve for R = infinite is given in figure 28 and
figure 29.

20
0
200
400
600
800
1000
1200
1400
1600
1800
2000
2200
2400
2600
2800
3000
3200
3400
3600
3800
4000
4200
0 100 200 300 400 500 600 700 800 900 1000 1100 1200 1300 1400 1500
rotational speed n (rpm)
mech
an
ical
po
wer
Pm
ech (
W)
R = 10 Ohm
R = 20 Ohm
R = 30 Ohm
R = 40 Ohm
R = 60 Ohm
R = 80 Ohm
R = 100 Ohm
R = 120 Ohm
R = 140 Ohm
R = 160 Ohm
R = infinite
fig. 27 Mechanical power Pmech as a function of n for different values of R
0
200
400
600
800
1000
1200
1400
1600
1800
2000
2200
2400
2600
2800
3000
3200
0 100 200 300 400 500 600 700 800 900 1000 1100 1200 1300 1400 1500
rotational speed n (rpm)
ele
ctr
icall
po
wer
Pel (
W)
R = 10 Ohm
R = 20 Ohm
R = 30 Ohm
R = 40 Ohm
R = 60 Ohm
R = 80 Ohm
R = 100 Ohm
R = 120 Ohm
R = 140 Ohm
R = 160 Ohm
fig. 28 Electrical power Pel as a function of n for different values of R
21
0
10
20
30
40
50
60
70
80
90
0 100 200 300 400 500 600 700 800 900 1000 1100 1200 1300 1400 1500
rotational speed n (rpm)
eff
icie
ncy
(%
)
R = 10 Ohm
R = 20 Ohm
R = 30 Ohm
R = 40 Ohm
R = 60 Ohm
R = 80 Ohm
R = 100 Ohm
R = 120 Ohm
R = 140 Ohm
R = 160 Ohm
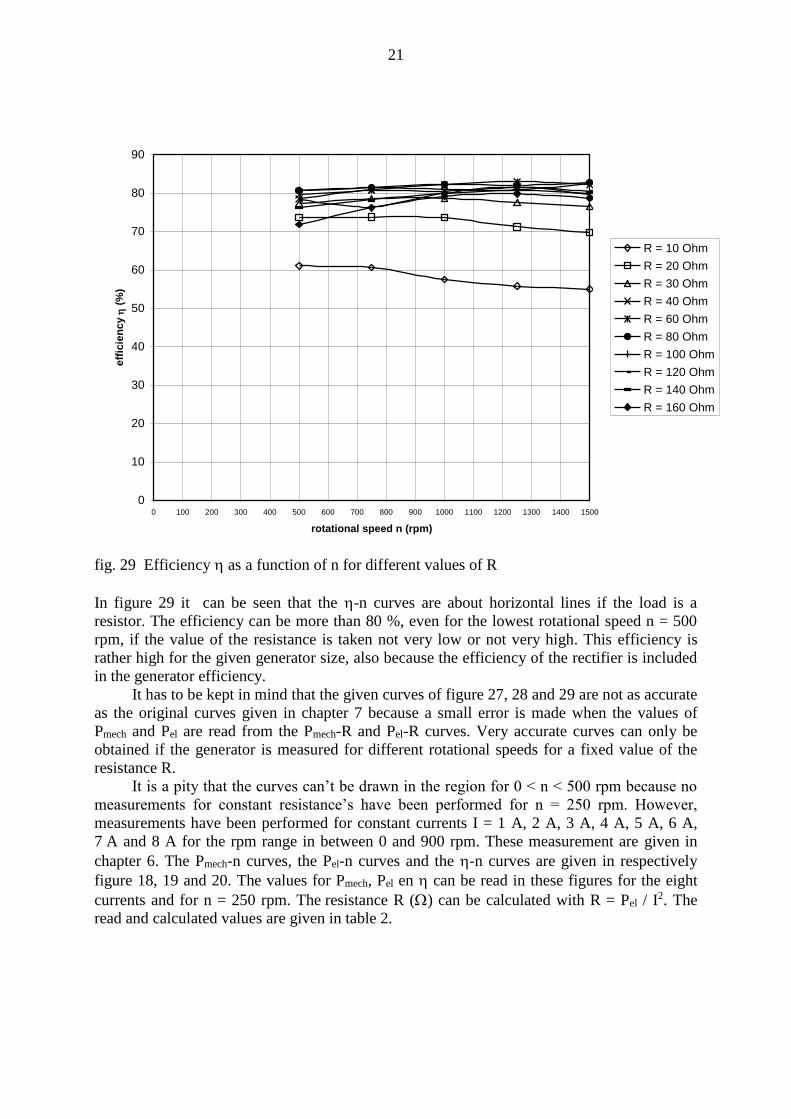
fig. 29 Efficiency as a function of n for different values of R
In figure 29 it can be seen that the -n curves are about horizontal lines if the load is a
resistor. The efficiency can be more than 80 %, even for the lowest rotational speed n = 500
rpm, if the value of the resistance is taken not very low or not very high. This efficiency is
rather high for the given generator size, also because the efficiency of the rectifier is included
in the generator efficiency.
It has to be kept in mind that the given curves of figure 27, 28 and 29 are not as accurate
as the original curves given in chapter 7 because a small error is made when the values of
Pmech and Pel are read from the Pmech-R and Pel-R curves. Very accurate curves can only be
obtained if the generator is measured for different rotational speeds for a fixed value of the
resistance R.
It is a pity that the curves can’t be drawn in the region for 0 < n < 500 rpm because no
measurements for constant resistance’s have been performed for n = 250 rpm. However,
measurements have been performed for constant currents I = 1 A, 2 A, 3 A, 4 A, 5 A, 6 A,
7 A and 8 A for the rpm range in between 0 and 900 rpm. These measurement are given in
chapter 6. The Pmech-n curves, the Pel-n curves and the -n curves are given in respectively
figure 18, 19 and 20. The values for Pmech, Pel en can be read in these figures for the eight
currents and for n = 250 rpm. The resistance R () can be calculated with R = Pel / I2. The
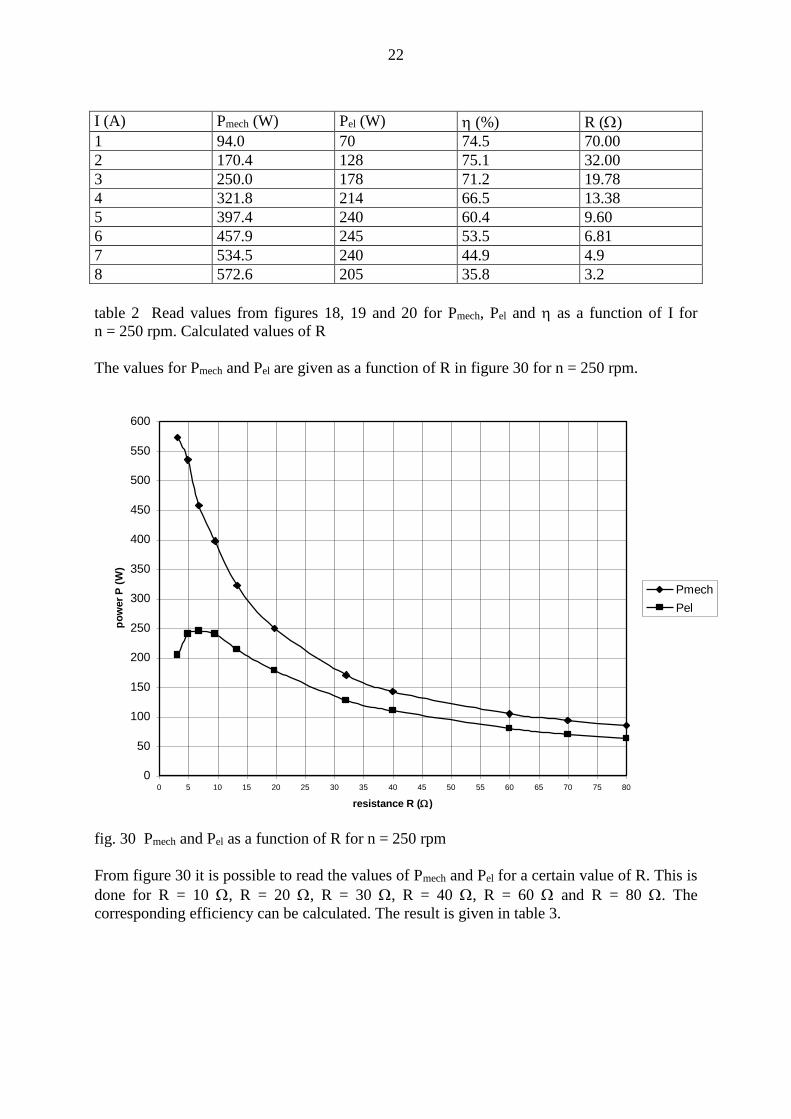
read and calculated values are given in table 2.
22
I (A) Pmech (W) Pel (W) (%) R ()
1 94.0 70 74.5 70.00
2 170.4 128 75.1 32.00
3 250.0 178 71.2 19.78
4 321.8 214 66.5 13.38
5 397.4 240 60.4 9.60
6 457.9 245 53.5 6.81
7 534.5 240 44.9 4.9
8 572.6 205 35.8 3.2
table 2 Read values from figures 18, 19 and 20 for Pmech, Pel and as a function of I for
n = 250 rpm. Calculated values of R
The values for Pmech and Pel are given as a function of R in figure 30 for n = 250 rpm.
0
50
100
150
200
250
300
350
400
450
500
550
600
0 5 10 15 20 25 30 35 40 45 50 55 60 65 70 75 80
resistance R ()
po
wer
P (
W)
Pmech
Pel
fig. 30 Pmech and Pel as a function of R for n = 250 rpm
From figure 30 it is possible to read the values of Pmech and Pel for a certain value of R. This is
done for R = 10 , R = 20 , R = 30 , R = 40 , R = 60 and R = 80 . The
corresponding efficiency can be calculated. The result is given in table 3.

23
R () Pmech (W) Pel (W) (%)
10 390 240 61.5
20 245 175 71.4
30 175 130 74.3
40 142 110 77.5
60 105 80 76.2
80 85 63 74.1
table 3 Values of Pmech and Pel read from figure 30
The read values for R = 40 , 60 and 80 are also given in figure 30 to check if the
estimated values are correctly positioned on the Pmech-R and Pel-R curves.
Figure 27, 28 and 29 are now copied as figure 31, 32 and 33. Only the curves for R = 10 ,
R = 20 , R = 30 , R = 40 , R = 60 R = 80 and R = infinite are given. However, the
values of Pmech, Pel and for n = 250 rpm as found in table 3 are now also included in the
curves. The values for Pmech and Pel for n = 0 rpm are also included (all these values are zero).
The efficiency is not given for n = 0 rpm because it is not allowed to divide by zero.
0
200
400
600
800
1000
1200
1400
1600
1800
2000
2200
2400
2600
2800
3000
3200
3400
3600
3800
4000
4200
0 100 200 300 400 500 600 700 800 900 1000 1100 1200 1300 1400 1500
rotational speed n (rpm)
mech
an
ical p
ow
er
Pm
ech (
W)
R = 10 Ohm
R = 20 Ohm
R = 30 Ohm
R = 40 Ohm
R = 60 Ohm
R = 80 Ohm
R = infinite
fig. 31 Mechanical power Pmech as a function of n for different values of R

24
0
200
400
600
800
1000
1200
1400
1600
1800
2000
2200
2400
2600
2800
3000
3200
0 100 200 300 400 500 600 700 800 900 1000 1100 1200 1300 1400 1500
rotational speed n (rpm)
ele
ctr
icall p
ow
er
Pel (
W)
R = 10 Ohm
R = 20 Ohm
R = 30 Ohm
R = 40 Ohm
R = 60 Ohm
R = 80 Ohm
fig. 32 Electrical power Pel as a function of n for different values of R
0
10
20
30
40
50
60
70
80
90
100
0 100 200 300 400 500 600 700 800 900 1000 1100 1200 1300 1400 1500
rotational speed n (rpm)
eff
icie
ncy
(%
)
R = 10 Ohm
R = 20 Ohm
R = 30 Ohm
R = 40 Ohm
R = 60 Ohm
R = 80 Ohm
fig. 33 Efficiency as a function of n for different values of R

25
10 References
1 Kragten A. Development of the permanent magnet (PM) generators of the VIRYA
windmills, May 2007, reviewed March 2015, free public report KD 341, engineering
office Kragten Design, Populierenlaan 51, 5492 SG Sint-Oedenrode, The Netherlands.
2 Kragten A. Rectification of 3-phase VIRYA windmill generators, May 2007, reviewed
October 2014, free public report KD 340, engineering office Kragten Design,
Populierenlaan 51, 5492 SG Sint-Oedenrode, The Netherlands.