Embed Size (px)
Citation preview

Federal Committee on STATISTICAL METHODOLOGY
Measurement on the Move: Designing Questionnaires for Mobile First
Frances M. Barlas, PhD, Randall K. Thomas, & Patricia Graham
GfK Custom Research
2015 Research Conference, December 1-3, 2015
© 2015 GfK | Delivering Growth from Knowledge

30%
25%
20%
15%
10%
5%
2010 2011 2012 2013 2014
Background The proportion of participants taking online surveys with a mobile device, including smartphones and tablets, is increasing, often making up 20 to 30% of participants in general population studies today.
Mobile Survey Starts Over Time – GfK surveys
• Too big to ignore • Demographically
different: • Smartphone:
young minority low SES
• Tablet: middle-age higher SES
© 2015 GfK | Delivering Growth from Knowledge 2

Screen Size – Diversity of Screen Real Estate Most online surveys to date have been designed from scratch by people using desktops/laptops without considering how the survey will render on a mobile device.
In the modern era of online surveys, we are being forced to design our questionnaires to be presented on an extremely wide range of screen sizes.
221 unique screen
resolutions
18.6%
© 2015 GfK | Delivering Growth from Knowledge

Study 1
© 2015 GfK | Delivering Growth from Knowledge 4

Study 1 – Method • Study was conducted with the Advertising Research
Foundation as part of the Foundations of Quality 2 Project (FOQ2) initiative.
• Participants were 18+ U.S. residents and were obtained from 17 different opt-in sample providers, each providing approximately 3,000 completes.
• There were 57,104 completes.
• The web-based study was fielded in January 2013.
• Not designed to be mobile-friendly.
© 2015 GfK | Delivering Growth from Knowledge 5

Study 1 – Method • Among those for whom we could reliably detect the
device used to take the survey (based on operating system, browser, and device characteristics):
Participants Percent
Desktop/Laptop 51,641 92.2%
Tablet 2,276 4.1%
Smartphone 2,089 3.7%
Total 56,006 100.0%
© 2015 GfK | Delivering Growth from Knowledge 6

40.,8 40
35
30 27.4 ti) 24.9 Cl) 25 -::::J C: 20 ·-2
15
10
5
0 Desktop/ Laptop Tab let Sm1 artphone
Study 1 Results – Survey Duration
Median Time to Complete by Device Type
© 2015 GfK | Delivering Growth from Knowledge 7

30.8% 30°/c)
25°/c)
20°/c)
14.9% 15°/c) 12.2%
10°/c)
501o
0% Desktop/Laptop Tablet Smartphone
Study 1 – Breakoffs Suspend by Device Type
© 2015 GfK | Delivering Growth from Knowledge 8
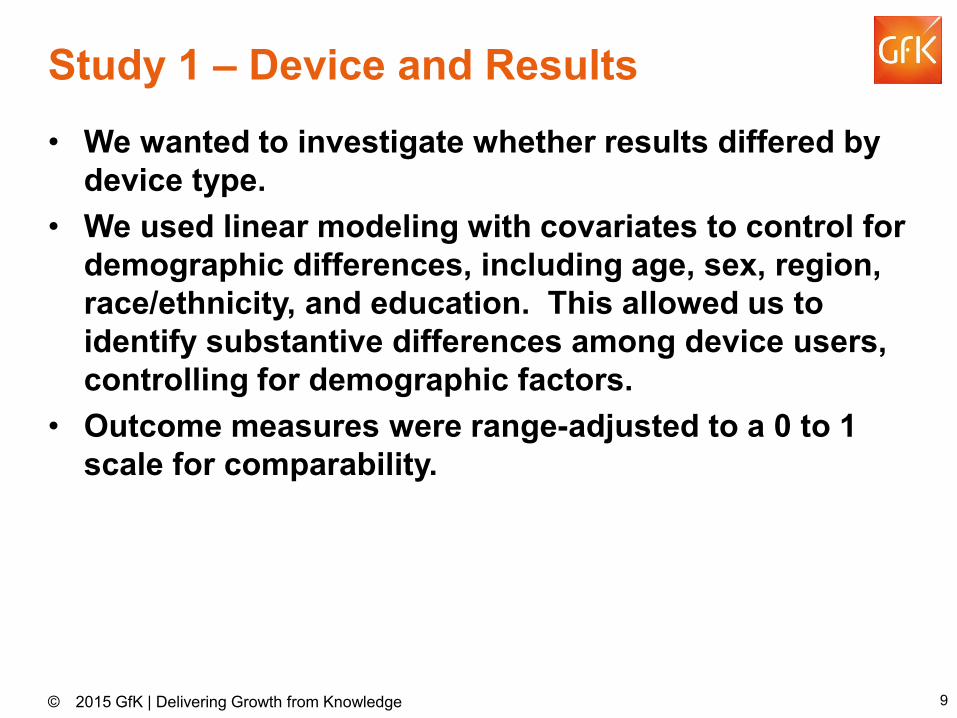
Study 1 – Device and Results • We wanted to investigate whether results differed by
device type. • We used linear modeling with covariates to control for
demographic differences, including age, sex, region, race/ethnicity, and education. This allowed us to identify substantive differences among device users, controlling for demographic factors.
• Outcome measures were range-adjusted to a 0 to 1 scale for comparability.
© 2015 GfK | Delivering Growth from Knowledge 9

Study 1 – Results Attitudes by Device Type
m ·o 0
{J)
m .c. a. 0 C .c. 0 a, r-
L.. C s .Q -""C ·-a, C a, 0)
z8
� Desktop/Laptop � Tablet � Smartphone
Change behavior to suit different people
Important to be liked by others
Like technology
New technology has improved life
Like situations that require thinking
Prefer complex to simple problems
o 0.1 0.2 o.3 o.4 o.s o.6 o.7
S > D
D, T > S
T , S > D
T > D, S
S > D, T
S > D
© 2015 GfK | Delivering Growth from Knowledge 10

Study 1 – Results Health and Health Related Behaviors by Device Type
� Desktop/Laptop � Tablet � Smartphone
Past 30 day binge drinking
Ever smoked
Healthiness
o 0.1 0.2 o.3 0.4 o.s o.6 o.7
S > D
S > D, T; D > T
T > D
© 2015 GfK | Delivering Growth from Knowledge 11
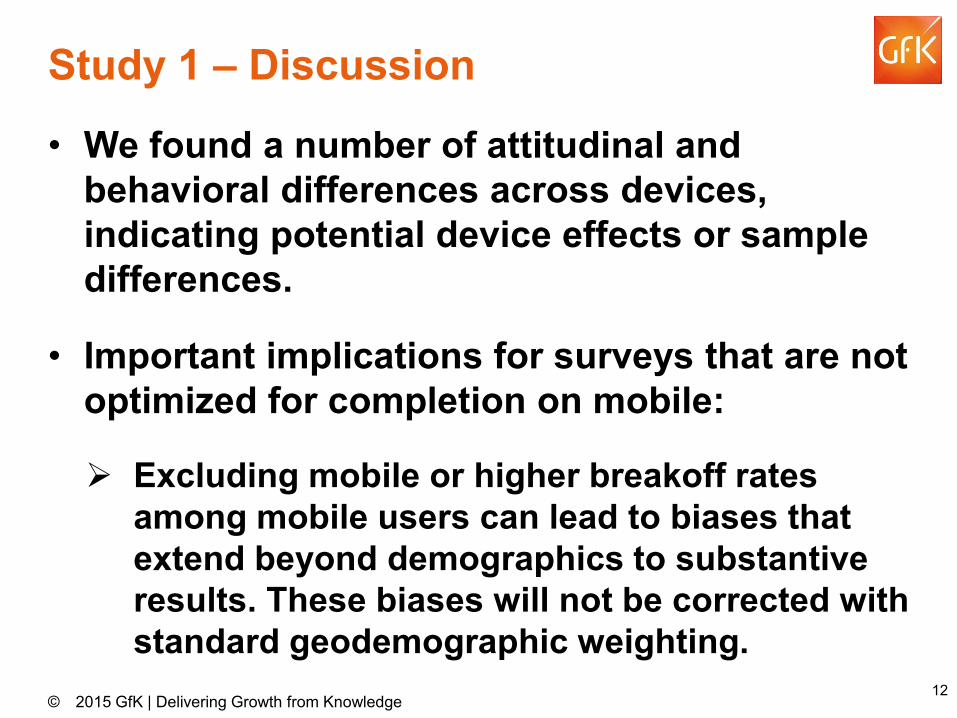
Study 1 – Discussion
• We found a number of attitudinal and behavioral differences across devices, indicating potential device effects or sample differences.
• Important implications for surveys that are not optimized for completion on mobile:
Excluding mobile or higher breakoff rates among mobile users can lead to biases that extend beyond demographics to substantive results. These biases will not be corrected with standard geodemographic weighting.
© 2015 GfK | Delivering Growth from Knowledge 12

Research on Research To control self-selection bias, conducted a study using GfK's KnowledgePanel® and randomly assigned participants to completion device.
Invited Responded Used assigned device
7,837 4,555 10,672
1,497 Desktop/laptop respondents
1,483 Smartphone respondents
1,575 Tablet respondents
© 2015 GfK | Delivering Growth from Knowledge
I I I I
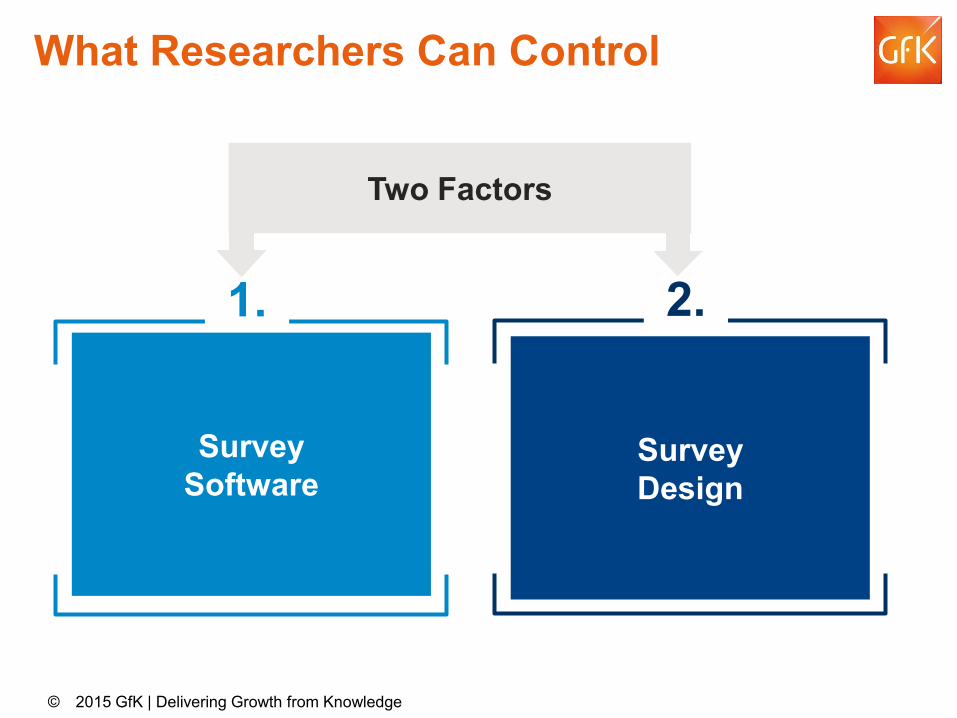
What Researchers Can Control
Two Factors
1. 2.
Survey Design
Survey Software
© 2015 GfK | Delivering Growth from Knowledge

Experimental Assignment
Survey Software Template
12% 88% Traditional template Responsive template
© 2015 GfK | Delivering Growth from Knowledge
LIG' .,II 82% � 12:05 PM
a https://qcsurvey~ C m1 R How many bedrooms are in your house, apartmeni, or mobile home? That is, how many bedrooms would you list if your house, apartment, or mobile home were oo the market !Of sale orrenl?
~lec1one answffoo ly
O No bedrooms O lbedroom O 2bedrooms O 3bedrooms 0 4bedrooms O 51)(morebedrooms
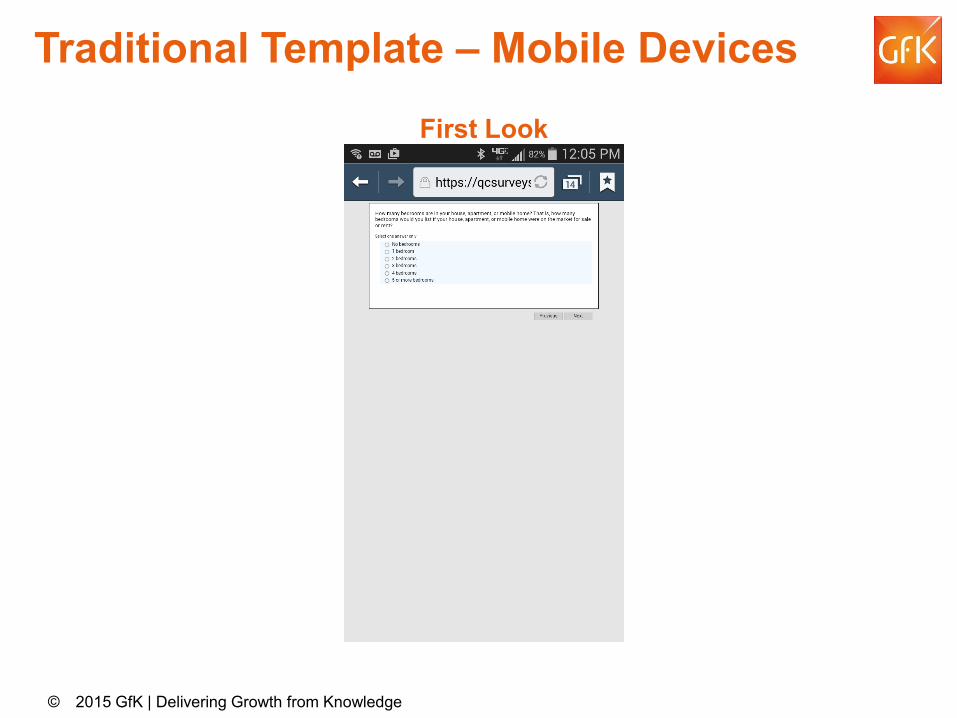
Traditional Template – Mobile Devices First Look
© 2015 GfK | Delivering Growth from Knowledge

Traditional Template – Mobile Devices
First Look After Zooming ~ ~ ~ * 4 G" .,II 82% � 12:05 PM
+- � A How many l>edrooms are in your house, apartment, or mobile home? That is. how many bedrooms would you list if your house, apartment, or mobile home were on the market for sale orrent?
Sriect oneanswtionly
O Nobedrooms O 1 bedroom 0 2bedrooms O 3bedrooms O 4bedrooms O 5 or more bedrooms
-ml * 4 G' .di 82% � 12:05 PM
a https://qcsurveyi C m1 A How many bedrooms are in your house, ap; bedrooms would you list if your house, apa1 or rent?
Select one answer only
O No bedrooms O 1 bedroom O 2 bedrooms O 3 bedrooms O 4 bedrooms O 5 or more bedrooms
After zooming in, the question is still difficult to read. It
does not automatically
reformat to fit the screen, but requires scrolling left to right to read and answer
the question.
© 2015 GfK | Delivering Growth from Knowledge
D ";; I:!:: ~ * 4 G ,II ' � 1 0 37 AM
~ � -wR ' 1 c•~ r <' • , , , Need he!p7
How many bedrooms are in your house, apartment, or mobile home? That is, how many bedrooms would you list if your house, apartment, or mobile home were on the market for sa le or rent?
Select one answer only
No bedrooms
1 bedroom
2 bedrooms
3 bedrooms
4 bedrooms
5 or more bedrooms
___ P_r_e_v,_o_u_s_~I -
� X
~ C rl.1 https://qcsurveys.gfksay.com/mrll * sf, 201':, GfK Al l r qht recerved Need help7
How many bedrooms are in your house. apartment, or mobile home? That is, how many bedrooms would you list if your house, apartment, or mobi le home were on the market for sa le or rent?
Select one answer only
No bedrooms
1 bedroom
2 bedrooms
3 bedrooms
4 bedrooms
5 or more bedrooms
__ P_r_e_vi_o_us_~I -
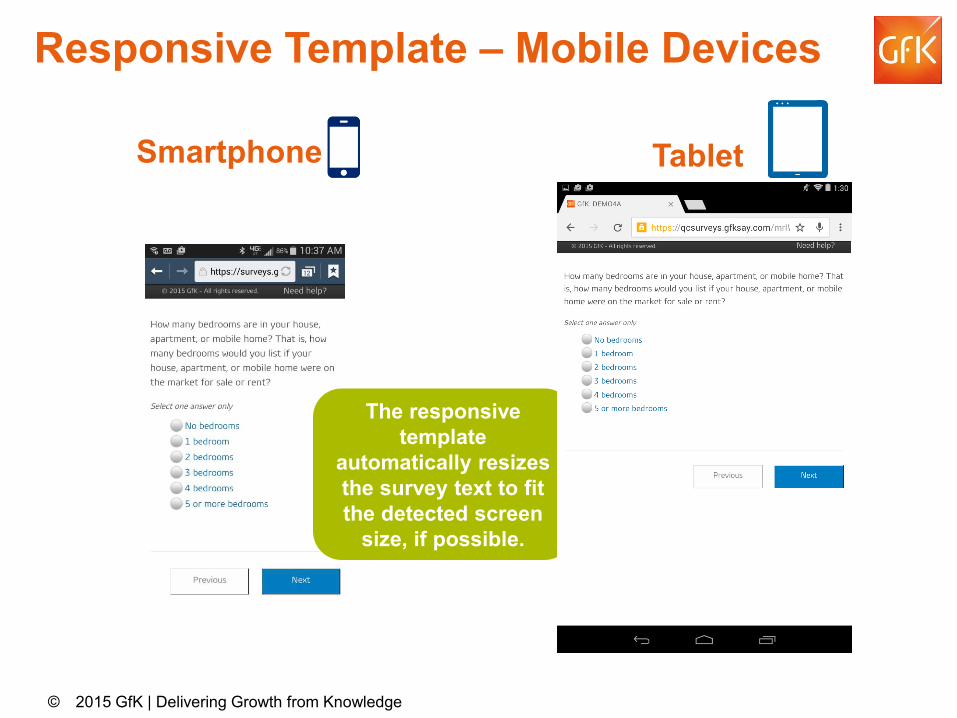
Responsive Template – Mobile Devices
Smartphone Tablet
The responsive template
automatically resizes the survey text to fit the detected screen
size, if possible.
© 2015 GfK | Delivering Growth from Knowledge
What 1s the highest level of school you have completed?
S<!l«ton~~nswt!ronly
No fo rmal education
1st, 2™', 3rd, or 4th grode
5th or 6th grade
7th or ath grade
9th grade
10th grade
111h grade
121h grode NO DIPLOMA HIGH SCHOOL GRADUATE - high •••••• .., .!. • • • • •
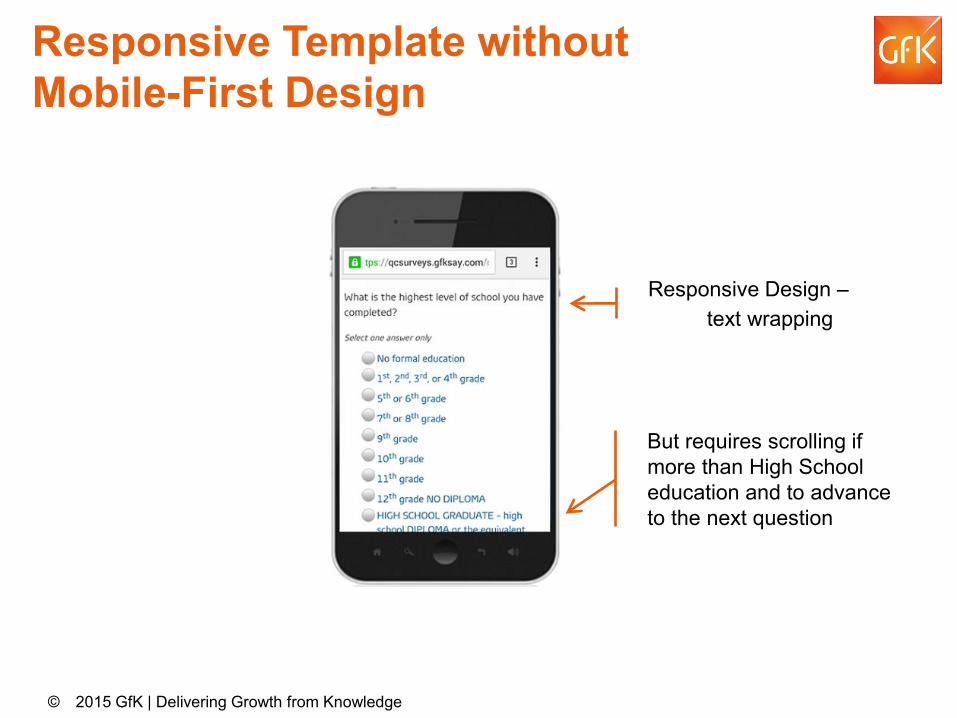
Responsive Template without Mobile-First Design
Responsive Design – text wrapping
But requires scrolling if more than High School education and to advance to the next question
© 2015 GfK | Delivering Growth from Knowledge
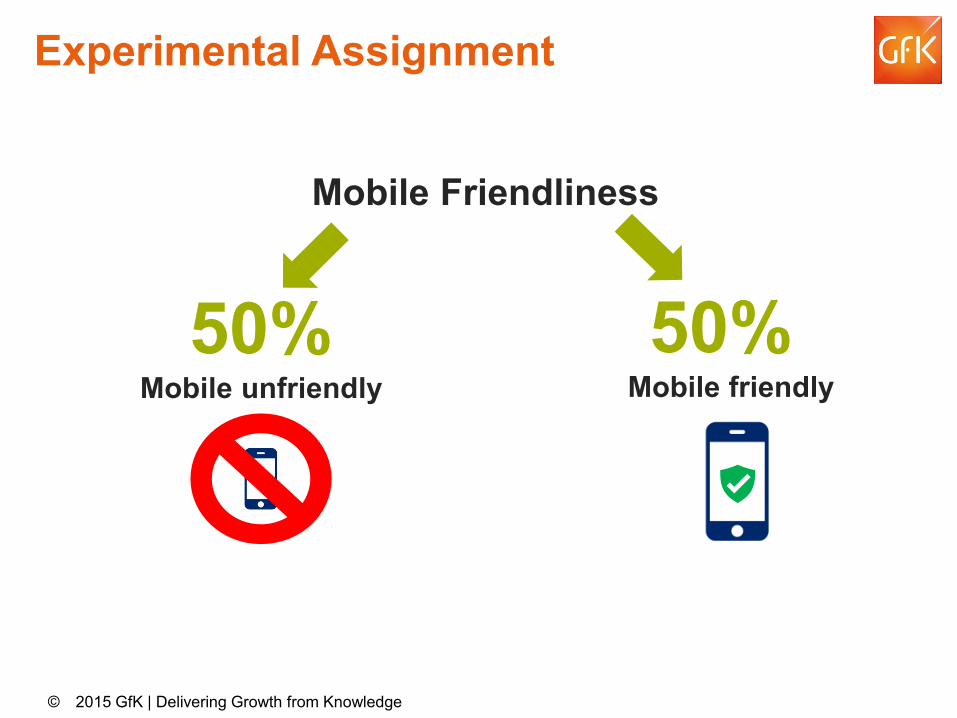
Experimental Assignment
Mobile Friendliness
50% 50% Mobile unfriendly Mobile friendly
© 2015 GfK | Delivering Growth from Knowledge

Which o the o ll rn,, irig best d esc ri bes the type o oe llphone you currently u:se? I you have mo re than one oell phone, please think o.cthe on:e you use mo-st o ·~ en arid se lect orie respnrliSe.
5elect on·e anSW'er o.,7/y
Basic oell phone - a wireless phone ha i:s used primarily or ca lls and mes:s3g ing. and may have he ab ility o
d ownlDDd music. videos. and r ing ,ones. A ba:sii: phone ,does not requ ire a ,data plan; examples include 5i!msun,g Brig ht:side. LG Ext rave rt ,or ~evere. Pan ,er:h Jest.
5martph,one - a wireless ph,one wi h an ,opera ing :syste ~05) , erin,g advanced capab ili ie.-s. incl ud ing he
ab ility o send and reoeive email. v isi any web si e and d ownl03d apps m m an app :store marklet. 5martphune exam p I e-5 ind ude i Phone. B la i:kBerry. And m id sma rtp hones 'Such as he Motorola Dmi d AAZR M. LG Luci d 2. ,or
he Sea msu ng Ga laxy 5 IV and Wi ndows Phones such as HTC Wi ndows Phune Bx a n,d Nokia Lu m ia 9 2 B. These phunes r,equ ire a data plan .
Do not have a ,eel Ip hone
Example: Mobile Friendly vs. Unfriendly
Mobile Unfriendly – longer question and response options
© 2015 GfK | Delivering Growth from Knowledge

Which o ·rthe o ll o:1r;in,g b-est describes the type or ce ll phon,e you currently u.se?
Select ome answer only
Ba:si c ee l Ip hone - used mostly or ca 11:s and exti n,g. does nut requ ire a data plan .
5 ma rtp hone - can be used or ca I ls. ,exti ng. browsing _he In emet ema i Ii ng. down I Dtl ding a p ps. and typ i ca I ly requ ires a da ca plan .
Do nut have a ,eel Ip hone
Previous f\J ext
Example: Mobile Friendly vs. Unfriendly
Mobile Friendly – shorter question and response options
© 2015 GfK | Delivering Growth from Knowledge

- - .....
Median Survey Completion Times M
inut
es
30
25
20
15
10
5
0
Desktop/Laptop Tablet Smartphone
24 22 20
18
Traditional, Traditional, Responsive, Responsive, Mobile Unfriendly Mobile Friendly Mobile Unfriendly Mobile Friendly
© 2015 GfK | Delivering Growth from Knowledge

0%
� � �
Survey Breakoff Rates
3%
2% 1%
5% 4%
3% 2%
10%
5% 5%
4%
Breakoff rates dropped by 50% when responsive and mobile friendly design used
Traditional, Traditional, Responsive, Responsive, Mobile Un- Mobile Friendly Mobile Un- Mobile Friendly
friendly friendly
Desktop/Laptop Tablet Smartphone
© 2015 GfK | Delivering Growth from Knowledge

isfacf on with persona finances
Happ·ness with US as place to live
lm1po1rtance of taste in drink purchase
Favorable brand rat·ng - MTV
o·sab ed cookies in browser
Perce·ved online anonymity
0 0..2 0.4 0.6
� Desktop/Laptop � Tablet � Smartphone
0..8 1
No device effects across range of topics:
© 2015 GfK | Delivering Growth from Knowledge

Enjoy surveys o n techno logy
Stiream s video
IFi 1rst to try new tech no llogy
Passionate about techno logy
0 0..2 0..4 0.6 0..8
� Desktop/Laptop � Tablet � Smartphone
T > D, S
T > D, S
T > D, S
T > D, S
Device Effects were present when measuring – Technology:
© 2015 GfK | Delivering Growth from Knowledge

Device Effects
• No interactions with template version or mobile friendliness of questionnaire – when present, device effects were consistent across these experimental conditions.
• No clear pattern of device effects by response format – assessed single item with varying scale lengths, vertical vs. horizontal response presentation, grids.
© 2015 GfK | Delivering Growth from Knowledge

Device Effects or Sample Composition?
To investigate whether or not technology-related device effects were due to nonresponse bias, we compared responses to five questions on early adoption of new products and technology between respondents and non-respondents by survey completion device.
Three of the five questions showed a statistically significant difference between respondents and non-respondents among tablet respondents only, with tablet respondents being more likely to be early adopters than tablet non-respondents.
This supports the idea that the technology-related device effects may actually be due to attitudes of responders rather than device effects.
© 2015 GfK | Delivering Growth from Knowledge

Conclusions
Device effects appeared to be more driven by survey content than response format.
On the whole, device usage does not appear to affect responses.
There may be some attitudinal differences even after controlling for demographics, such as attitudes toward technology-related issues.
Improving survey display for mobile respondents helps, but it is not enough – we also need to approach questionnaire design with a mobile-first mentality. We saw decreased completion times and breakoff rates with responsive template and mobile-friendly design.
© 2015 GfK | Delivering Growth from Knowledge