Embed Size (px)
Citation preview

Measurement of the UV Ree tivity ofAluminium in Dierent Stages ofOxidationSebastian Mann
Ba helorarbeit in Physikvorgelegt der
Fakultät für Mathematik, Informatik und Naturwissens haften derRheinis h-Westfälis hen Te hnis hen Ho hs hule Aa henim September 2012
angefertigt amIII. Physikalis hen Institut A


Guta hter und BetreuerProf. Dr. Thomas HebbekerIII. Physikalis hes Institut ARWTH Aa hen Universityi


Abstra tThis thesis examines the hange of the ree tivity of an aluminium surfa e used for light on entrators at various stages of oxidation. The experimental setup onsists of an LEDin the UV regime as light sour e and a bre spe trometer as dete tor. First, the lightbeam of the LED is measured by the dete tor bre to get the intensity of the unree tedlight beam. Se ondly, an aluminium surfa e is positioned into the opti al path, so thatthe intensity of the ree ted beam an be measured for three dierent in ident anglesof 45, 60 and 75. The ree tivity as ratio of the two intensities is measured fordierent periods of oxidised aluminium. The oxid thi kness on the aluminium surfa edoes not inuen e the ree tivity in the UV regime of the aluminium surfa e, so thateven after a long time use, the light on entrators in the FAMOUS teles ope will notde rease in their e ien y.ZusammenfassungDiese Arbeit bes häftigt si h mit der Veränderung einer Aluminiumoberä he, währenddie Oberä he oxidiert. Der experimentelle Aufbau besteht aus einer LED, die imUV-Berei h leu htet, als Li htquelle und einer Detektionsfaser, die an ein Faserspek-trometer gekoppelt ist. Zuerst wird der Li htstrahl der LED dur h die Detektionsfasergemessen, um die Intensität des unreektierten Li htstrahls zu erhalten. Als zweiteswird die Aluminiumoberä he in den Strahlengang gebra ht, um dann die Intensität desreektierten Li htstrahls zu messen. Dies ges hieht für drei vers hiedene Einfallswinkel45, 60 und 75. Für vers hieden lange Oxidationszeitspannen wird die Reektivitätals Verhältnis der beiden Intensitäten gemessen. Die Di ke der Oxids hi ht hat je-do h keinen Einuss auf die Reektivität der Aluminiumoberä he, sodass selbst na heinem langen Zeitraum die Ezienz der Li htkonzentratoren im FAMOUS Teleskopni ht sinken wird.
iii


Contents1 Motivation 12 Introdu tion 32.1 History of Cosmi Rays . . . . . . . . . . . . . . . . . . . . . . . . . . . 32.2 Energy Spe trum of Cosmi Rays . . . . . . . . . . . . . . . . . . . . . . 32.3 Extensive Air Showers . . . . . . . . . . . . . . . . . . . . . . . . . . . . 42.4 Fluores en e Light . . . . . . . . . . . . . . . . . . . . . . . . . . . . . . 52.5 FAMOUS . . . . . . . . . . . . . . . . . . . . . . . . . . . . . . . . . . . 72.5.1 Sili on Photomultipliers . . . . . . . . . . . . . . . . . . . . . . . 82.5.2 Winston Cones . . . . . . . . . . . . . . . . . . . . . . . . . . . . 93 Ree tivity of Aluminium 113.1 Refra tive Index of Aluminium . . . . . . . . . . . . . . . . . . . . . . . 113.2 Stages of Oxidation . . . . . . . . . . . . . . . . . . . . . . . . . . . . . . 133.3 Spike Ree tion . . . . . . . . . . . . . . . . . . . . . . . . . . . . . . . . 133.4 Diuse Ree tion Phenomena . . . . . . . . . . . . . . . . . . . . . . . . 143.4.1 Ba ks atter Ree tion . . . . . . . . . . . . . . . . . . . . . . . . 143.4.2 Lobe Ree tion . . . . . . . . . . . . . . . . . . . . . . . . . . . . 153.4.3 Lambertian Ree tion . . . . . . . . . . . . . . . . . . . . . . . . 154 Experimental Setup 174.1 Idea . . . . . . . . . . . . . . . . . . . . . . . . . . . . . . . . . . . . . . 174.2 Layout Des ription . . . . . . . . . . . . . . . . . . . . . . . . . . . . . . 174.3 Fibre Spe trometer . . . . . . . . . . . . . . . . . . . . . . . . . . . . . . 184.4 Light Sour e . . . . . . . . . . . . . . . . . . . . . . . . . . . . . . . . . . 204.5 Measurement Control using the Arduino . . . . . . . . . . . . . . . . . . 215 Data Analysis 235.1 Pro edure . . . . . . . . . . . . . . . . . . . . . . . . . . . . . . . . . . . 235.2 Ree tivity Measurement . . . . . . . . . . . . . . . . . . . . . . . . . . 265.2.1 Wavelength Dependen e . . . . . . . . . . . . . . . . . . . . . . . 265.2.2 Angular Dependen e . . . . . . . . . . . . . . . . . . . . . . . . . 305.3 Inuen e on the Winston Cone Operation . . . . . . . . . . . . . . . . . 306 Con lusion 35Bibliography 37A knowledgements 39v


List of Figures2.2.1 All-parti le energy spe trum . . . . . . . . . . . . . . . . . . . . . . . . . 42.4.1 Fluores en e light spe trum . . . . . . . . . . . . . . . . . . . . . . . . . 62.4.2 Sket h of the shower-dete tor-plane . . . . . . . . . . . . . . . . . . . . . 72.5.1 The logo of FAMOUS . . . . . . . . . . . . . . . . . . . . . . . . . . . . 72.5.2 S reenshot of the Geant4 simulation of FAMOUS . . . . . . . . . . . . . 82.5.3 SiPM photography, os illos ope s reenshot and a QDC spe trum . . . . 92.5.4 Cross se tion of a Winston one and angular distribution . . . . . . . . . 103.1.1 The refra tive index of aluminium . . . . . . . . . . . . . . . . . . . . . 123.3.1 Ree tivity of aluminium . . . . . . . . . . . . . . . . . . . . . . . . . . 143.4.1 Lobe surfa e . . . . . . . . . . . . . . . . . . . . . . . . . . . . . . . . . . 153.4.2 The dierent kinds of ree tion . . . . . . . . . . . . . . . . . . . . . . . 164.1.1 Sket h of the idea of the setup . . . . . . . . . . . . . . . . . . . . . . . . 184.2.1 The experimental setup . . . . . . . . . . . . . . . . . . . . . . . . . . . 194.3.1 Dete tion te hnique of the spe trometer . . . . . . . . . . . . . . . . . . 204.3.2 Conne tor diagram . . . . . . . . . . . . . . . . . . . . . . . . . . . . . . 204.4.1 LED spe trum . . . . . . . . . . . . . . . . . . . . . . . . . . . . . . . . 214.5.1 The ir uit diagram of an Arduino . . . . . . . . . . . . . . . . . . . . . 224.5.2 Wiring of a bipolar stepper . . . . . . . . . . . . . . . . . . . . . . . . . 225.1.1 The starting position of a measurement . . . . . . . . . . . . . . . . . . 245.1.2 Intensity versus angle . . . . . . . . . . . . . . . . . . . . . . . . . . . . . 255.2.1 Wavelength dependent spe trum at 45 . . . . . . . . . . . . . . . . . . 275.2.2 Wavelength dependent spe trum at 45 . . . . . . . . . . . . . . . . . . 285.2.3 Wavelength dependent spe trum at 45 . . . . . . . . . . . . . . . . . . 295.2.4 Angular dependen e of the ree tivity . . . . . . . . . . . . . . . . . . . 315.3.1 Spe ular lobe ree tion as a fun tion of the exit angle . . . . . . . . . . 325.3.2 The Geant4 simulation of the light ux e ien y . . . . . . . . . . . . . 33
vii


Chapter 1MotivationToday, astrophysi ists want to measure the ux of ultra high osmi rays (UHECRs)as exa t as possible, in luding their origin and hemi al omposition. These UHECRsare parti les from spa e hitting the atmosphere of the Earth. For in reasing energies ofthe UHECRs, their ux de reases and at energies above 1019 eV, only one parti le persquare kilometre and year is dete ted on the Earth. This requires experiments with abig exposure.The Pierre Auger Observatory is a large array of Cherenkov dete tors overing aninstrumentation area of more than 3000 km2 by a surfa e dete tor. A uores en e lightdete tor onsisting of 27 teles opes ompletes the dete tion instruments. A parti le en-tering the atmosphere of Earth produ es an avalan he of se ondary parti les (extensiveair shower) whi h ex ite the nitrogen mole ules of the atmosphere. These nitrogen mo-le ules emit light in the ultraviolet regime as they deex ite, whi h is olle ted by theteles opes and measured with ea h 440 photomultiplier tubes arranged in a hexagonalgrid.The FAMOUS teles ope is a proje t to use sili on photomultipliers (SiPMs) to dete tthe uores en e photons of the extensive air showers. SiPMs have several advantages ompared to onventional photomultipliers as they do not need a high voltage supplyand promise a higher photon dete tion e ien y. FAMOUS is an a ronym for "FirstAuger MPPC amera for the Observation of UHECR air Showers" and MPPC itselfstands for "Multi-Pixel Photon Counter".To in rease the e ien y and redu e the dead spa e of the sili on photomultipliers inthe fo al plane, Winston ones made of polished aluminium are used as light funnels.With time, the aluminium surfa e starts to oxidise. Therefore, it is ne essary to know,whi h are the deteriorations introdu ed to the ree tion of the surfa e. The analysisof these is the main topi of this thesis.
1


Chapter 2Introdu tionThe following hapter will shortly dis uss the history of the resear h of osmi rays,their hara teristi s and the methods of measurement and re onstru tion of extensiveair showers.2.1 History of Cosmi RaysIn 1912, Vi tor Hess rst dis overed osmi rays as he did several balloon as ends andstudied the ionisation rate of the air as a fun tion of the altitude [1. Before 1912, ra-dioa tive materials of Earth were believed to be the origin of the radiation, but V. Hessmeasured an in rease of the radiation as he moved higher into the sky. So he on ludedthe radiation to origin from outer spa e. In 1929, W. Bothe and W. Kolhörster foundout that the osmi radiation onsists of harged parti les. Kohlhörster studied the o-in ident signals between two Geiger Müller tubes and argued that the tubes measuredse ondary parti les being produ ed by the same primary parti les.As further resear hes were limited by a low osmi ray ux (parti les per time andarea), large sensitive areas and long exposure time, and onsequently new dete torte hniques were needed. Thus, in the middle of the 1940s, large dete tor arrays onthe ground of the Earth were installed using e.g. the atmosphere as a alorimeter tomeasure the extensive air showers - the beginning of the modern high energy osmi ray experiments.2.2 Energy Spe trum of Cosmi RaysIn the following de ades, several experiments were done to measure the dierent parti lesof the osmi rays in a vast energy range up to more than 1020 eV. The energy ux fallssteeply as a power law with the energy de reasing from more than 1000 parti les perse ond and square meter in the GeV region down to less than one parti le per squarekilometre and entury above 100EeV:d4ndEdtdΩdA ∝ E−γ (2.2.1)3

Chapter 2 Introdu tionwith the number of parti les n, the energy E, the solid angle Ω, the time t, the area Aand the spe tral index γ representing dierent values in dierent ranges of the energyspe trum. The spe trum is presented in gure 2.2.1. In a wide range of the spe trumup to primary energies of several PeV, known as the "knee", γ is equal to 2.7. Atthe "knee", the spe trum gets even steeper with γ hanging to 3.1. At approximately4 · 1017 eV (the so alled "se ond knee") the spe trum gets steeper and at 4 · 1018 eV(the "ankle") it gets atter again with γ = 2.6.
[eV]E
1310
1410
1510
1610
1710
1810
1910
2010
]-1
sr-1 s
-2m
1.6
[GeV
F(E)
2.6
E
1
10
210
310
410
Grigorov
JACEE
MGU
Tien-Shan
Tibet07
Akeno
CASA-MIA
HEGRA
Fly’s Eye
Kascade
Kascade Grande 2011
AGASA
HiRes 1
HiRes 2
Telescope Array 2011
Auger 2011
Knee
Ankle
Second Knee
Figure 2.2.1: All-parti le energy spe trum as obtained by measurements with dierentdete tors. Taken from [2.Understanding the knee is seen to be a big ornerstone of understanding the origin of osmi rays. Thus, many approa hes are urrently dis ussed in the literature [1. Apopular explanation for the knee is based on the upper limit of a eleration by gala ti supernovae. The ankle might be based on extragala ti parti les whi h are less intensebut dominate at higher energies. Also a leakage of parti les from the galaxy ould bea possible reason.2.3 Extensive Air ShowersAs an high energy osmi ray enters the atmosphere of the Earth, an avalan he of se -ondary parti les is produ ed. This phenomenon is referred to as extensive air shower.4

2.4 Fluores en e LightThere are several shower omponents. The ele tromagneti shower omponent is in-du ed by ele trons or positrons ausing bremsstrahlung or photons ausing pair pro-du tion of ele trons or positrons. Hadron-initiated showers in opposition to ele tro-magneti showers also produ e a signi ant myon omponent [1.The total energy loss of the ele trons an be gained via the formuladEdX = −α(E)−E
XR (2.3.1)with the atmospheri depth X, the ionisation energy loss α(E) given by the Bethe-Blo h formula and the radiation length XR whi h is XR ≈ 37 g/cm2 for air [1.A very simple model to understand the properties of ele tromagneti showers is theHeitler model. Under the assumption that an in oming parti le intera ts in the atmo-sphere after a distan e λem, it produ es two new parti les with ea h having half of theenergy of the origin parti le. This pro ess pro eeds until the new parti les fall belowa riti al energy EC, at whi h a parti le loses the same energy due to ionisation andparti le produ tion. The maximum number of parti les in a shower then is given byNmax = E0/EC (2.3.2)and the depth of the shower maximum
Xmax = λem log2(E0/EC) (2.3.3)This model shows two important features: Nmax at the shower maximum Xmax isproportional to the energy of the primary parti le whi h initiated the shower. Se ondly,Xmax in reases logarithmi ally with in reasing energy.In 1977, Gaisser and Hillas proposed a fun tion des ribing the longitudinal showerprole:
N(X) = Nmax( X −X0
Xmax −X0
)(Xmax−X)/λintexp
(
Xmax −X
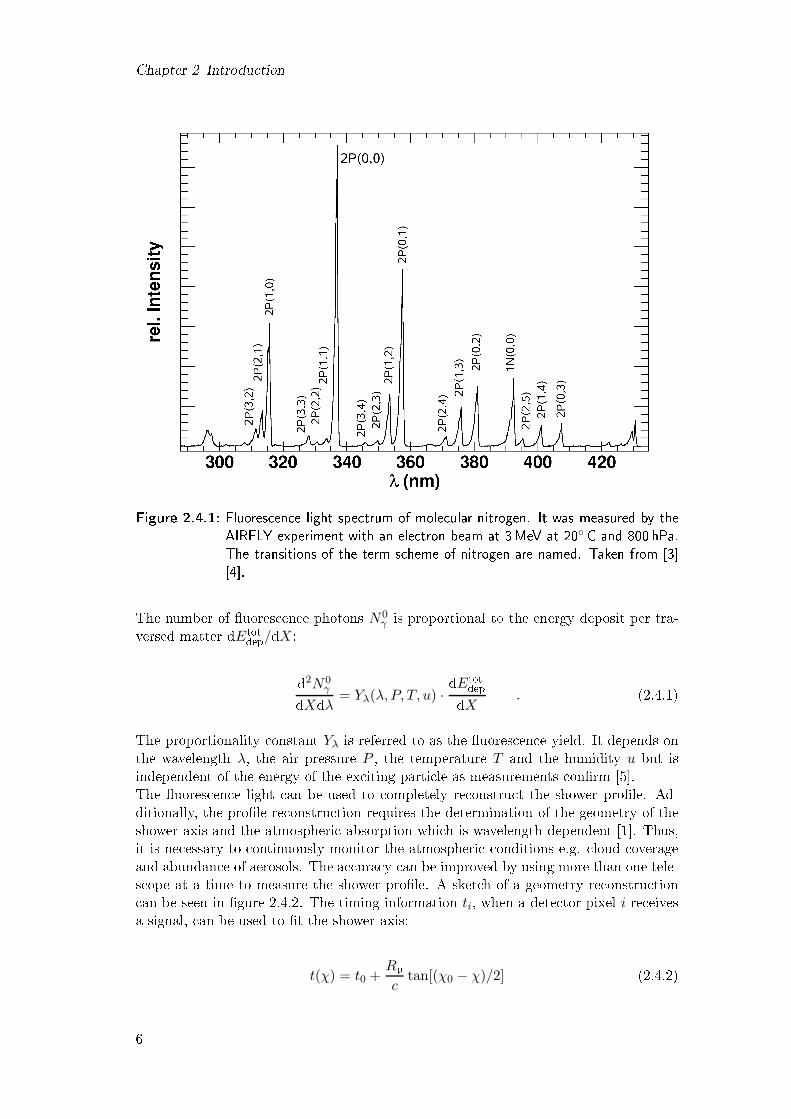
λint ) (2.3.4)with the maximum number of parti les Nmax, the depth of the rst intera tion X0, thedepth of the shower maximum Xmax and the mean intera tion length λint [1. For airthe mean intera tion length of a proton isλint, air = 80 g cm−2 (2.3.5)2.4 Fluores en e LightThe harged parti les of an extensive air shower ex ite the nitrogen mole ules of theair [1. These then emit uores en e light as they hange from an ex ited state to theground state. The emitted spe trum in the ultraviolet regime an be seen in gure2.4.1. The most prominent transition is at 333 nm. 5
Chapter 2 Introdu tion
Figure 2.4.1: Fluores en e light spe trum of mole ular nitrogen. It was measured by theAIRFLY experiment with an ele tron beam at 3MeV at 20 C and 800 hPa.The transitions of the term s heme of nitrogen are named. Taken from [3[4.The number of uores en e photons N0γ is proportional to the energy deposit per tra-versed matter dEtotdep/dX:d2N0
γdXdλ = Yλ(λ, P, T, u) ·dEtotdepdX . (2.4.1)The proportionality onstant Yλ is referred to as the uores en e yield. It depends onthe wavelength λ, the air pressure P , the temperature T and the humidity u but isindependent of the energy of the ex iting parti le as measurements onrm [5.The uores en e light an be used to ompletely re onstru t the shower prole. Ad-ditionally, the prole re onstru tion requires the determination of the geometry of theshower axis and the atmospheri absorption whi h is wavelength dependent [1. Thus,it is ne essary to ontinuously monitor the atmospheri onditions e.g. loud overageand abundan e of aerosols. The a ura y an be improved by using more than one tele-s ope at a time to measure the shower prole. A sket h of a geometry re onstru tion an be seen in gure 2.4.2. The timing information ti, when a dete tor pixel i re eivesa signal, an be used to t the shower axis:
t(χ) = t0 +Rpc
tan[(χ0 − χ)/2] (2.4.2)6

2.5 FAMOUS
Figure 2.4.2: Sket h of the shower-dete tor-plane. A signal Si arrives at the teles ope ata time ti and under an angle χi. RP is the shortest distan e between theteles ope and the shower axis. It is dete ted at t = t0. Taken from [6.2.5 FAMOUSFAMOUS is an a ronym for "First Auger Multi-Pixel Photon Counter amera for theObservation of Ultra high energy osmi ray air Showers". It is a prototype teles opeproje t with a refra tive opti and will use sili on photomultipliers (SiPMs) to measurethe uores en e light of extensive air showers [5.Figure 2.5.1: The logo of FAMOUS. FAMOUS is an a ronym for "First Auger MPPC amera for the Observation of UHECR air Showers"A s reenshot of the Geant41 simulation of the teles ope is presented in gure 2.5.2. Asthe refra ting element, a Fresnel lens (diameter D = fo al length f = 510mm) is usedsin e it has less weight and a lower absorption oe ient than a onventional lens and1Geant4 is a software framework to simulate parti les traversing matter. 7

Chapter 2 Introdu tion an be produ ed ost e ient from UV-transparent a ryli [7. The fo al plane on-sists of 64 pixels ea h instrumented by four squared 3x3 mm2 sili on photomultipliers(Hamamatsu s10985-100C). The pixels are arranged in a hexagonal stru ture. Winston ones work as light funnels to redu e dead spa e between the single SiPMs and thusin rease the e ien y of the dete tor. The length of the Winston one is 19.6mm, theentran e radius is 6.7mm and the exit radius is 3mm to rea h an area enlargementfa tor of 5.
Figure 2.5.2: S reenshot of the Geant4 simulation of FAMOUS showing the setup of theteles ope. A Fresnel lens (diameter D = fo al lens f = 510mm) fo usses thelight onto the fo al plane whi h onsists of hexagonally arranged Winston ones (entran e radius = 6.7mm and exit radius = 3mm) and SiPMs (ea h6x6mm2). Taken from [7.2.5.1 Sili on PhotomultipliersSili on photomultipliers (SiPMs) are photodiodes allowing the dete tion of single photonswith a time resolution of about 50 ps [7. They onsist of arrays of Geiger-mode ava-lan he photodiodes (G-APDs). If an in oming photon is absorbed, an ele tron-hole-pairis reated and then a elerated by the applied ele tri eld of the depletion zone of thediode jun tion. Impa t ionisation reates more ele tron-hole pairs. Thereby, a urrent an ow so that the voltage drops. This is the signal for having registered the in omingphoton ( .f. middle of gure 2.5.3). The avalan he is stopped by a so alled quen hingresistor.As the signal is not proportional to the number of photons Nγ for a single G-APD,multiple G-APDs are arranged in arrays on an SiPM, so that the output signal isproportional to the dete ted number of photons again if the light is distributed homo-geneously.The photon dete tion e ien y (PDE) depends on the geometri al ll fa tor fgeom(dead spa e redu es the e ien y), on the quantum e ien y QE (probability for anin oming photon reating an ele tron-hole-pair) and on the trigger probability Ptrigger(the probability that ele tron-hole-pairs ause an avalan he):8

2.5 FAMOUSPDE = QE · fgeom · Ptrigger. (2.5.1)In gure 2.5.3 a photography of an SiPM is shown (left). On the right side of the gure,a so alled nger spe trum an be seen. The rst peak (shifted to 10 be ause of anadditional internal pedestal of the QDC) refers to the pedestal, where the SiPM did notdete t any photons. The further peaks refer to the dete tion of one photon-equivalent(the se ond peak labelled as 1 p.e.), two photon-equivalents and so on. These peaksrefer to the negative peaks shown on the os illos ope s reenshot in the middle of gure2.5.3.
Figure 2.5.3: Left: Photography of a SiPM, Middle: Os illos ope s reenshot of ell trig-gers, Right: Measured harged spe trum of an SiPM. The frequen y of thedierent p.e. are plotted against the deposited harge. Taken from [7.There are dierent possibilities whi h an ause an avalan he pro ess. Thermally in-du ed breakdowns (strong thermal dependen y so that either the temperature or theovervoltage2 of the SiPM has to stay onstant) as well as opti al rosstalk betweensingle G-APDs (ele trons and holes re ombine emitting an photon during an avalan hepro ess) and afterpulsing (impurities in the sili on trap the ele trons and release themafter a while) an ause a signal [7.The ee ts of orrelated noise ( rosstalk and afterpulsing) an be ompensated by ades ent analysis. More information an be obtained in [8.2.5.2 Winston ConesWinston ones are light funnels. They are needed to de rease dead spa e between thesingle SiPMs in the teles ope FAMOUS and thus in rease the ee tive sensitive areaof an SiPM. This in reases the dete tor e ien y. A ross se tion through a Winston one is presented in gure 2.5.4 (left). It has a paraboli form and is symmetri withrespe t to the opti al axis (red line). The two radii r1 and r2 are the entran e and exitradius of the one. The exit radius is hosen to be 3mm as the mounted array of fourSiPMs (Hamamatsu s10985-100C) on the exit of the one has got an area of 6x6mm2.2The overvoltage Uover is dened as Uover = Ubias−Ubd with the bias-voltage Ubias and the breakdown-voltage Ubd. 9

Chapter 2 Introdu tionThe entran e radius is 6.7mm2 and results in an area enlargement of a fa tor of ve.All light, that enters the Winston one on the top under an angleθmax = arcsin
(
r2r1) ≈ 26 (2.5.2)or a smaller angle, is ree ted towards the exit of the one. All other light beams areree ted ba k towards the entran e of the one.
Figure 2.5.4: Left: Cross se tion through a Winston one. The orange, dashed lines arelight beams entering the one on the top and leaving on the bottom. Theblue lines show the paraboli form of the one and the red line the opti alaxis whi h is at the same time the rotational axis of symmetry. Right:Simulation of a parallel light beam entering the Winston one. For θin = 0and θin = 26 the simulated distribution for θout is presented. Taken from[7.The simulated distribution of the emergent angle for an in iden e angle is presented inthe right part of gure 2.5.4. Whereas for θin = 0 about 25% dire tly pass through the one without hitting the surfa e of the one at all, 75% are s attered to a wide rangeof possible angles θout, for θin = 26 all light beams are s attered [7. The e ien y ofthe SiPM as a fun tion of the in iden e angle of light is analysed in the ba helor thesisof Daniel Wilson [9.The simulated distribution for θout underlies spike ree tion for a perfe t surfa e. Im-purities in the material lead to dierent kinds of ree tion. The topi of this thesis willbe to analyse the ree tivity for aluminium by hanging dierent parameters like thein ident angle of the light or the stage of oxidation. A detailed dis ussion of the har-a teristi s of the aluminium and the dierent kinds of ree tivity of impure surfa eswill be dis ussed in the next hapter.10

Chapter 3Ree tivity of AluminiumThis hapter will dis uss the opti al hara teristi s of aluminium on erning its prop-erties of ree tion. Therefore, dierent kinds of ree tion me hanisms are explained.3.1 Refra tive Index of AluminiumThe refra tive index des ribes the hange of the phase velo ity of ele tromagneti waves,e.g. light, in matter ompared to the one in va uum [10n =
c
c′(3.1.1)with the speed of light in the va uum and the speed of light in matter '. Additionally,the velo ity of propagation ' does not only depend on the matter the light traversesbut also on the wavelength:
c′ = c′(λ) ⇒ n = n(λ) . (3.1.2)This dependen e of this velo ity of propagation ' on the wavelength λ is alled dis-persion. The refra tive index onsists of two fra tions, a real part n and an imaginarypart κ, whi h is responsible for absorption pro esses in matter. Both, the real and the omplex part of the refra tive index of aluminium, are presented in gure 3.1.1. Therefra tive index of aluminium for a wavelength of 400 nm isn = n+ iκ = 0.4879 + 4.8355i . (3.1.3)For aluminium, the omplex part dominates the absolute value of the refra tive indexand is responsible for the high ree tion properties as the skin depth is in the magnitudeof the wavelength. 11

Chapter 3 Ree tivity of Aluminium
10-4 10-3 10-2 10-1 100 101 102 103
λ/µm
10-7
10-6
10-5
10-4
10-3
10-2
10-1
100
101
102
103Re(n)
10-4 10-3 10-2 10-1 100 101 102 103
λ/µm
10-8
10-7
10-6
10-5
10-4
10-3
10-2
10-1
100
101
102
103
Im(n)
Figure 3.1.1: The ree tive index of aluminium: On the top plot the real part, on thebottom plot the omplex part versus the wavelength is shown. The dashedlines mark the ultraviolet regime between 300 nm and 450 nm. The axes areboth logarithmi ally s aled and the wavelength is given in µm. Data takenfrom [11.12
3.2 Stages of Oxidation3.2 Stages of OxidationAluminium surfa es oxidise during time, when the surfa e is exposed to air [12[13.This additional oating an redu e the ree tivity of the surfa e. Therefore it is ne es-sary to measure the ree tivity after denite periods of time to quantify hange.At rst, a ree tivity measurement of a fresh polished aluminium surfa e is re orded.More measurements were performed for oxidation periods of two days, twelve days andtwenty days. At last, after the last measurement of 20 days, the oxidation layer shouldbe saturated and no longer in rease in thi kness.3.3 Spike Ree tionThe ree tivity of a material is des ribed by the Fresnel equations [14. They des ribethe behaviour of ele tromagneti waves for the spe i ase of plane waves hittinga plane interfa e onsisting of two dierent isotropi and homogeneous media. TheFresnel equations are derived dire tly from Maxwell's equations and depend on thein ident angle of the light, on the refra tive index and thus also on the wavelength.It has to be distinguished between two dierent ases of polarised light. S-polarisedlight is the omponent of the light, that is perpendi ularly to the plane of in iden e,whereas p-polarised light orresponds to the parallel omponent with respe t to theplane of in iden e.For s-polarised light, the ree tivity is given byRs = ∣
∣
∣
∣
∣
∣
∣
∣
n1 cos θi − n2
√
1−(
n1
n2sin θi)2
n1 cos θi + n2
√
1−(
n1
n2sin θi)2
∣
∣
∣
∣
∣
∣
∣
∣
2 (3.3.1)and for p-polarised light, byRp =
∣
∣
∣
∣
∣
∣
∣
∣
n1
√
1−(
n1
n2sin θi)2
− n2 cos θin1
√
1−(
n1
n2sin θi)2
+ n2 cos θi ∣∣∣∣∣∣∣∣2 (3.3.2)with the in ident angle Θi and the two refra tive indi es n1 for the rst medium (e.g.air) and n2 for the se ond medium (e.g. aluminium).The light of an Light Emitting Diode (LED) is unpolarised by denition [15 andthus the means ree tivity is given byR =
Rs +Rp2
. (3.3.3)13

Chapter 3 Ree tivity of AluminiumThe ree tivity for n = 0.4879 + 4.8355i and λ = 400nm is plotted in gure 3.3.1.Both, s- and p-polarised light, as well as unpolarised light is plotted. The dependen eon the wavelength is learly visible. It has got a minimum around 75.
0 10 20 30 40 50 60 70 80 90angle in degree
0.80
0.85
0.90
0.95
1.00
Reflectivity
RS
RP
R
Figure 3.3.1: Ree tivity for aluminium with a refra tive index of n = 0.4879 + 4.8355iat λ = 400nm. Both, s- (dashed blue line) and p-polarised light (dottedgreen line), as well as unpolarised light (red ontinuous line) is presented.3.4 Diuse Ree tion PhenomenaFor spike ree tion the surfa e of interfa e is assumed to be perfe tly planar and thus aree ted photon is ree ted des ribed by the law of ree tion in the same way it wouldbe ree ted by a perfe t mirror [16.In omparison to that, there are some more kinds of ree tion that ontain the fa t,that the surfa e of an interfa e is not perfe tly plane.3.4.1 Ba ks atter Ree tionFor ba ks atter ree tion, a photon is ree ted ba k to the dire tion where it amefrom [16 Examples are Compton s attering used in ba ks atter X-ray or alpenglow.14

3.4 Diuse Ree tion Phenomena3.4.2 Lobe Ree tionLobe ree tion assumes the surfa e to onsist of mi ro-fa ets, whi h are mi ros opi small surfa es [16. These are tilted randomly with respe t to the average ma ro-surfa enormal a ording to a Gaussian distribution:f(α) =
1√2πσα
· exp(
−α2
2σ2α
) . (3.4.1)A s et h of a mi ro-fa et surfa e is presented in gure 3.4.1. The standard deviationof the Gaussian distribution is given by the parameter σα.
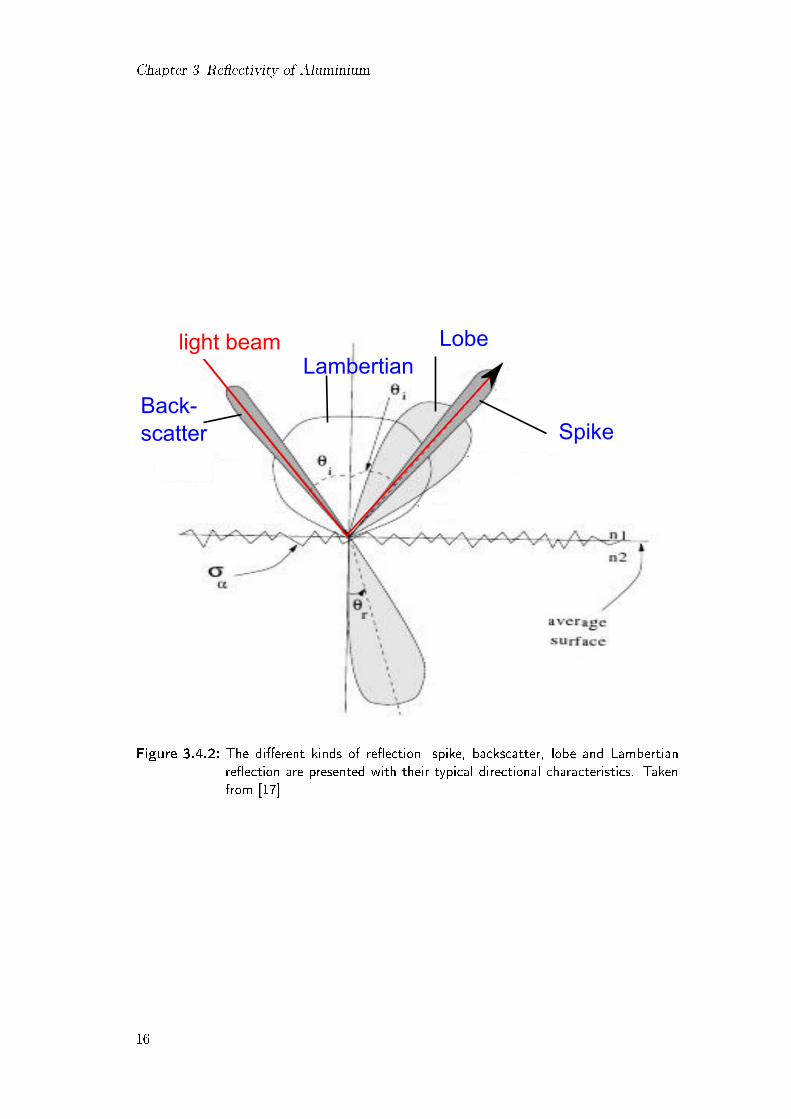
Figure 3.4.1: The surfa e onsists of many small mi ro-fa ets on the average surfa e. Thestandard deviation of the Gaussian distribution is given by the parameter σα.Taken from [16.3.4.3 Lambertian Ree tionFor Lambertian ree tion, the in oming photon will be ree ted a ording to Lambert'sCosine Law [16. This means the intensity distribution of the ree ted photons isproportional to the osine of the angle:I(θ) = const · cos(θ). (3.4.2)The dierent kinds of ree tion are presented in gure 3.4.2.
15
Chapter 3 Ree tivity of Aluminium
Lambertian
Back-
scatter
Lobe
Spike
light beam
Figure 3.4.2: The dierent kinds of ree tion -spike, ba ks atter, lobe and Lambertianree tion are presented with their typi al dire tional hara teristi s. Takenfrom [17
16

Chapter 4Experimental SetupIn this hapter, the general setup of the experiment is presented and the dierent omponents used in the onstru tion are explained.4.1 IdeaThe general idea about this setup is to measure rst the light of an unree ted beamand se ondly, the light being ree ted by the aluminium surfa e exiting the apertureof a ollimation tube. Then, the ree tivity is given byR =
IreflIbeam
(4.1.1)with the intensity of the ree ted beam Irefl and the intensity of the unree ted beamIbeam.As the light beam is extensive after leaving the aperture, the dete tor has to over anarea greater than its sensitive area. Therefore a stepper moves the bre, whi h is thedete tor, a xed distan e ∆x, so that after ea h step the dete tor an measure thein oming ux of the light beam at a ertain point. A sket h of the measurement ispresented in gure 4.1.1.Integration over all measurement points leads to a total intensity, whi h is ne essaryfor getting the ree tivity ( .f. equation 4.1.1).4.2 Layout Des riptionA photograph of the experimental setup is presented in gure 4.2.1. The light sour eis an LED in the UV regime around 400 nm and is lo ated in (1). To get the light,whi h leaves the LED not as a parallel light beam, as best ollimated as possible, it is ondu ted by a bre-opti light guide to a ollimation tube with a pin-hole aperture(2). The light exiting the aperture hits the aluminium ube and is ree ted a ordingto the Fresnel equations and strikes towards another bre-opti light guide. 17
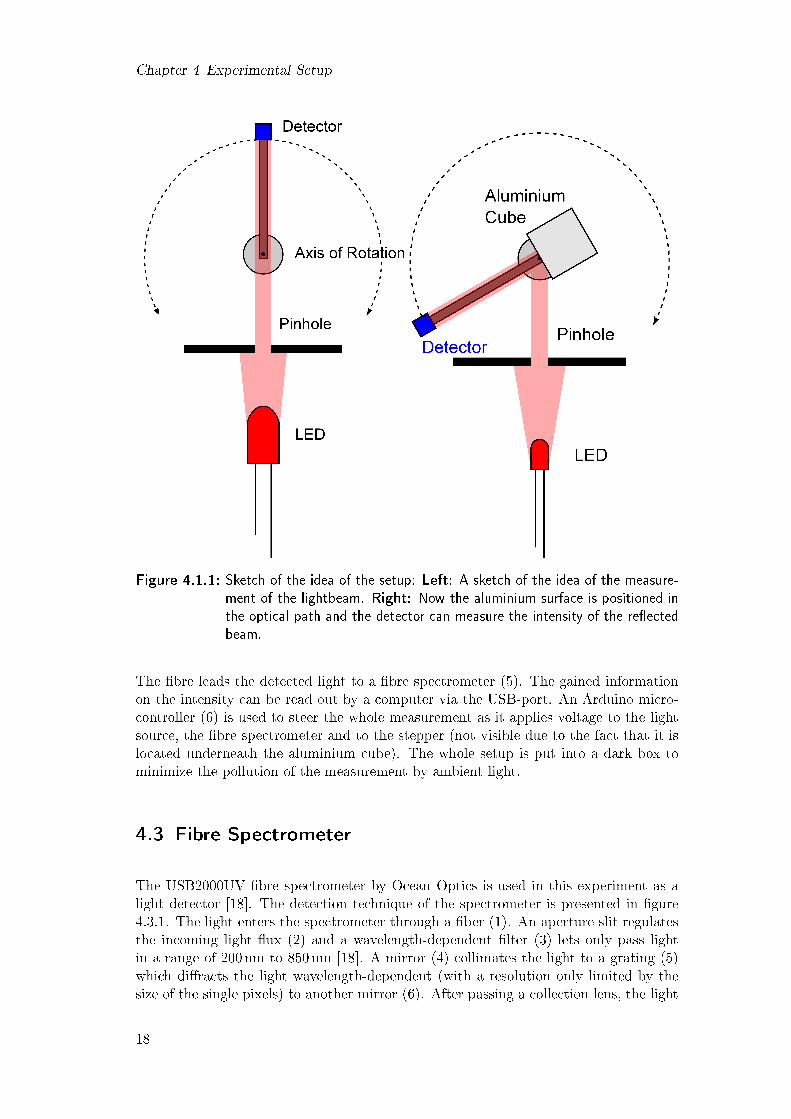
Chapter 4 Experimental Setup
Figure 4.1.1: Sket h of the idea of the setup: Left: A sket h of the idea of the measure-ment of the lightbeam. Right: Now the aluminium surfa e is positioned inthe opti al path and the dete tor an measure the intensity of the ree tedbeam.The bre leads the dete ted light to a bre spe trometer (5). The gained informationon the intensity an be read out by a omputer via the USB-port. An Arduino mi ro- ontroller (6) is used to steer the whole measurement as it applies voltage to the lightsour e, the bre spe trometer and to the stepper (not visible due to the fa t that it islo ated underneath the aluminium ube). The whole setup is put into a dark box tominimize the pollution of the measurement by ambient light.4.3 Fibre Spe trometerThe USB2000UV bre spe trometer by O ean Opti s is used in this experiment as alight dete tor [18. The dete tion te hnique of the spe trometer is presented in gure4.3.1. The light enters the spe trometer through a ber (1). An aperture slit regulatesthe in oming light ux (2) and a wavelength-dependent lter (3) lets only pass lightin a range of 200 nm to 850 nm [18. A mirror (4) ollimates the light to a grating (5)whi h dira ts the light wavelength-dependent (with a resolution only limited by thesize of the single pixels) to another mirror (6). After passing a olle tion lens, the light18
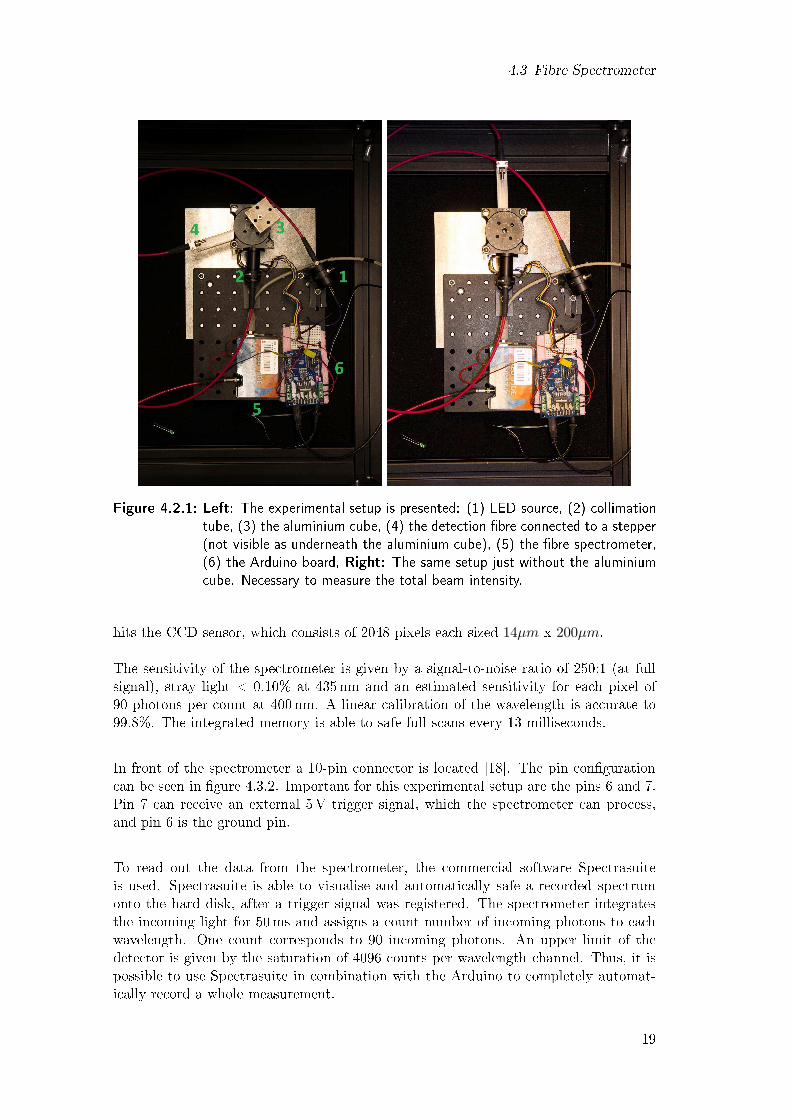
4.3 Fibre Spe trometer
Figure 4.2.1: Left: The experimental setup is presented: (1) LED sour e, (2) ollimationtube, (3) the aluminium ube, (4) the dete tion bre onne ted to a stepper(not visible as underneath the aluminium ube), (5) the bre spe trometer,(6) the Arduino board, Right: The same setup just without the aluminium ube. Ne essary to measure the total beam intensity.hits the CCD sensor, whi h onsists of 2048 pixels ea h sized 14µm x 200µm.The sensitivity of the spe trometer is given by a signal-to-noise ratio of 250:1 (at fullsignal), stray light < 0.10% at 435 nm and an estimated sensitivity for ea h pixel of90 photons per ount at 400 nm. A linear alibration of the wavelength is a urate to99.8%. The integrated memory is able to safe full s ans every 13 millise onds.In front of the spe trometer a 10-pin onne tor is lo ated [18. The pin onguration an be seen in gure 4.3.2. Important for this experimental setup are the pins 6 and 7.Pin 7 an re eive an external 5V trigger signal, whi h the spe trometer an pro ess,and pin 6 is the ground pin.To read out the data from the spe trometer, the ommer ial software Spe trasuiteis used. Spe trasuite is able to visualise and automati ally safe a re orded spe trumonto the hard disk, after a trigger signal was registered. The spe trometer integratesthe in oming light for 50ms and assigns a ount number of in oming photons to ea hwavelength. One ount orresponds to 90 in oming photons. An upper limit of thedete tor is given by the saturation of 4096 ounts per wavelength hannel. Thus, it ispossible to use Spe trasuite in ombination with the Arduino to ompletely automat-i ally re ord a whole measurement. 19
Chapter 4 Experimental Setup
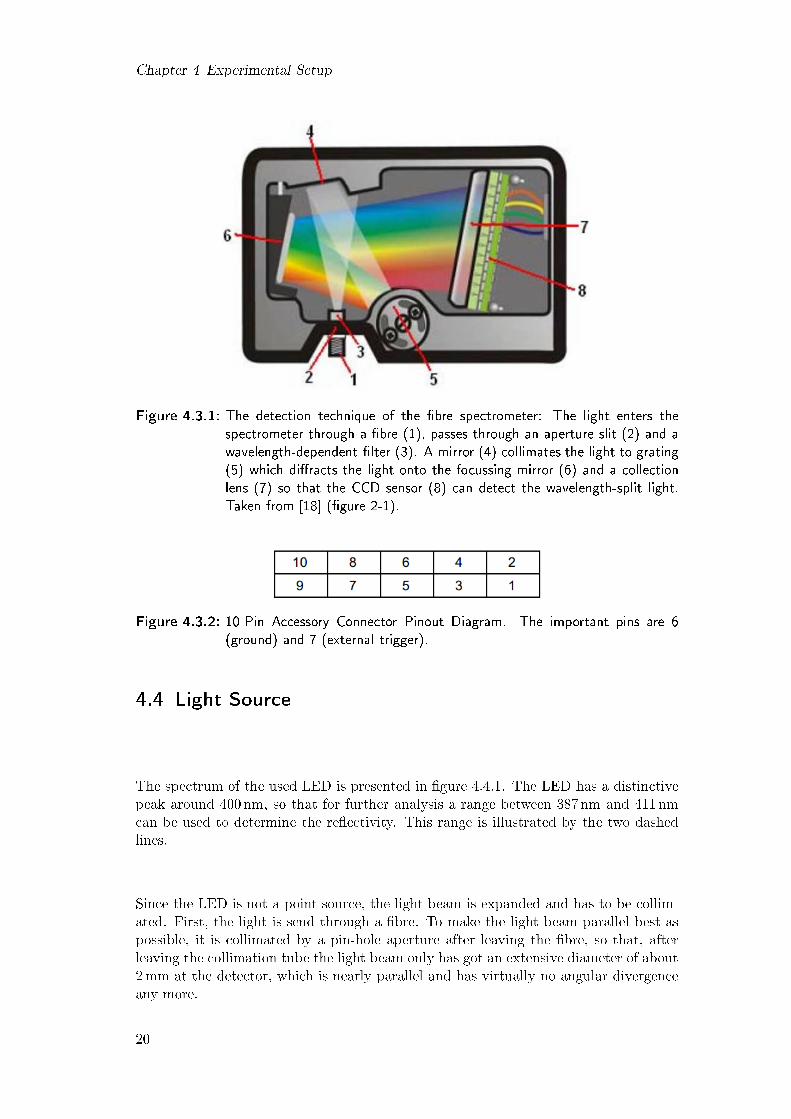
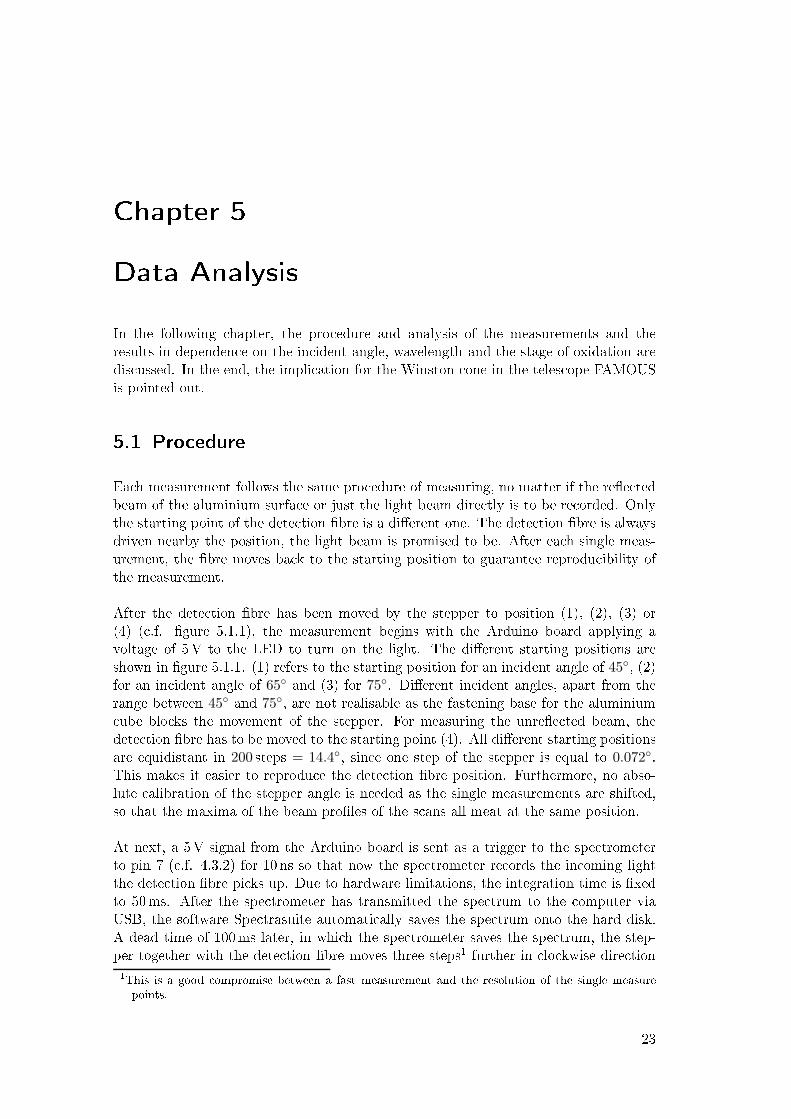
Figure 4.3.1: The dete tion te hnique of the bre spe trometer: The light enters thespe trometer through a bre (1), passes through an aperture slit (2) and awavelength-dependent lter (3). A mirror (4) ollimates the light to grating(5) whi h dira ts the light onto the fo ussing mirror (6) and a olle tionlens (7) so that the CCD sensor (8) an dete t the wavelength-split light.Taken from [18 (gure 2-1).Figure 4.3.2: 10-Pin A essory Conne tor Pinout Diagram. The important pins are 6(ground) and 7 (external trigger).4.4 Light Sour eThe spe trum of the used LED is presented in gure 4.4.1. The LED has a distin tivepeak around 400 nm, so that for further analysis a range between 387 nm and 411 nm an be used to determine the ree tivity. This range is illustrated by the two dashedlines.Sin e the LED is not a point sour e, the light beam is expanded and has to be ollim-ated. First, the light is send through a bre. To make the light beam parallel best aspossible, it is ollimated by a pin-hole aperture after leaving the bre, so that, afterleaving the ollimation tube the light beam only has got an extensive diameter of about2mm at the dete tor, whi h is nearly parallel and has virtually no angular divergen eany more.20

4.5 Measurement Control using the Arduino
300 350 400 450wavelength λ / nm
0.0
0.2
0.4
0.6
0.8
1.0
1.2
1.4counts / 1e+06
Figure 4.4.1: The spe trum of the LED around its maximum of 397 nm. On the x-axisonly a utout of 200 nm around the peak is shown. For an analysis of theree tivity, a range of 387 nm to 411 nm an be used (ranged by the twoblue, dashed lines).4.5 Measurement Control using the ArduinoAn Arduino Uno is a programmable mi ro ontroller, used to ontrol the whole experi-mental setup [19.A ir uit of the Arduino is presented in gure 4.5.1. In ombination with an extensionnamed "motor shield", the Arduino is able to drive a stepper motor. The steppermotor is bipolar stepper (ST2818M1006 Nema 11 from Nanote Ele troni ) providinga single step of (1.80 ± 0.09)[20. The wiring of the bipolar stepper is presented ingure 4.5.2. A gear box (GPLL 22-25 from Nanote Ele troni ) divides one single stepof the stepper into 25 intermediate steps with an e ien y of 70% [21.21

Chapter 4 Experimental SetupFibre
LED
Stepper
Arduino
Fibre
Spectrometer
9 V
Computer
Motor shield
Figure 4.5.1: The ir uit diagram of an Arduino: The Arduino is onne ted to the om-puter and an external power supply. The motor shield is plugged onto theArduino and is onne ted to the LED, the stepper and the bre spe trometer.
Figure 4.5.2: The wiring of a bipolar stepper. Two seperate ele tri ir uits with ea h one oil drive the stepper. Taken from [20.22
Chapter 5Data AnalysisIn the following hapter, the pro edure and analysis of the measurements and theresults in dependen e on the in ident angle, wavelength and the stage of oxidation aredis ussed. In the end, the impli ation for the Winston one in the teles ope FAMOUSis pointed out.5.1 Pro edureEa h measurement follows the same pro edure of measuring, no matter if the ree tedbeam of the aluminium surfa e or just the light beam dire tly is to be re orded. Onlythe starting point of the dete tion bre is a dierent one. The dete tion bre is alwaysdriven nearby the position, the light beam is promised to be. After ea h single meas-urement, the bre moves ba k to the starting position to guarantee reprodu ibility ofthe measurement.After the dete tion bre has been moved by the stepper to position (1), (2), (3) or(4) ( .f. gure 5.1.1), the measurement begins with the Arduino board applying avoltage of 5V to the LED to turn on the light. The dierent starting positions areshown in gure 5.1.1. (1) refers to the starting position for an in ident angle of 45, (2)for an in ident angle of 65 and (3) for 75. Dierent in ident angles, apart from therange between 45 and 75, are not realisable as the fastening base for the aluminium ube blo ks the movement of the stepper. For measuring the unree ted beam, thedete tion bre has to be moved to the starting point (4). All dierent starting positionsare equidistant in 200 steps = 14.4, sin e one step of the stepper is equal to 0.072.This makes it easier to reprodu e the dete tion bre position. Furthermore, no abso-lute alibration of the stepper angle is needed as the single measurements are shifted,so that the maxima of the beam proles of the s ans all meat at the same position.At next, a 5V signal from the Arduino board is sent as a trigger to the spe trometerto pin 7 ( .f. 4.3.2) for 10 ns so that now the spe trometer re ords the in oming lightthe dete tion bre pi ks up. Due to hardware limitations, the integration time is xedto 50ms. After the spe trometer has transmitted the spe trum to the omputer viaUSB, the software Spe trasuite automati ally saves the spe trum onto the hard disk.A dead time of 100ms later, in whi h the spe trometer saves the spe trum, the step-per together with the dete tion bre moves three steps1 further in lo kwise dire tion1This is a good ompromise between a fast measurement and the resolution of the single measurepoints. 23

Chapter 5 Data Analysiswhi h is equal to an angular movement of3 steps · 1.8
25/step = 0, 216.Waiting a short time (100ms) is ne essary to damp the vibration of the stepper.
Figure 5.1.1: The experimental setup presented again, now with the dierent start posi-tions of the dete ting bre: Measurement of the ree ted beam at 45 (1),at 60 (2), at 75 (3). For measuring the unree ted beam (without thealuminium surfa e in the opti al path), the dete tor starts at (4).The measurement pro ess is iterated 278 times. A spe trum is re orded, sent to thehard disk of the omputer and so on. After 278 spe tra were re orded and saved, thedete tion bre is automati ally moved ba k to the position at whi h the measurementhas started. 278 movements of three steps at the gear box of the stepper orrespondto a omplete angular distan e of 60. During the whole measurement the LED staysturned on keep the light output as stable as possible.Every measurement is repeated 8 times for the same set of parameters. Thus, a om-plete measurement in ludes eight times a re ord of spe tra for ea h of the three dierentin ident angles 45, 60 and 75 and eight re orded spe tra for the unree ted beam.Sin e one single measurement takes about two minutes, about half an hour is neededto arry out one omplete measurement.A measurement for an in ident angle of 45 is presented in gure 5.1.2. It displaysthe enlargement of the light beam shifted to the maximum of the dete ted light lo atedto ∆Θ = Θ−Θ0 = 0. The angle displayed on the x axis refers to the angles, the step-per drives through2. The un ertainties of the x values orrespond to the un ertainty ofthe stepper, the y axis un ertainties to the un ertainties of the number of ounts N :σN (Θ) =
√
N(∆Θ) (5.1.1)2This is not the in ident angle, but the angular position of the stepper in relation to the maximumpeak of the dete ted light beam.24

5.1 Pro edureThe rst of the 278 spe tra is used as a dark spe trum referen e, whi h is needed sin ethe noise of the spe trometer is approximately 100 ounts per 50ms. All other spe traare subtra ted by the dark spe trum. Thus, for the most angles presented in 5.1.2 thenumber of ounts is equal to zero, so that only a short range around the maximumof a few degrees to the left and right has to be viewed. This plot orresponds to awavelength of 397 nm. The enlargement of the ree ted beam (green ontinuous line) ompared to the unree ted beam is learly visible. The impure surfa e has expandedthe beam prole and has redu ed the intensity of the beam.
−2 0 2 4 6∆Θ=Θ−Θ0 in degree
0.0
0.2
0.4
0.6
0.8
1.0
counts
/ 1
e+
05
IU =(2.16 ± 0.03) · 1e+05/50ms
IR =(1.84 ± 0.11) · 1e+05/50ms
Figure 5.1.2: Exemplary plot of the measured intensity. It refers to an in ident angleof 45 at a wavelength of 397 nm. The green line refers to the ree tedbeam and blue line to the unree ted one. The ree tivity is al ulated to(85.3 ± 5.2%).The integral of the graph then leads dire tly to the intensity:I =
´
N(∆Θ)d∆Θ
t(5.1.2)The integral is not al ulated as a sum, instead a numeri al method alled Simpson'sRule is used to approximate the integral. The great advantage is, that the numberof steps done between to re ords of a spe trum does not make any dieren e for theresult. The single points of the graph an now be analysed as part of the Simpson'sRule's fun tion f(x). Its integral then an be approximated by
ˆ b
af(x) dx ≈
b− a
6
[
f(a) + 4f
(
a+ b
2
)
+ f(b)
] (5.1.3)25

Chapter 5 Data Analysisand is quadrati interpolation of a given fun tion f(x)[22. In this ase the intensitythen is approximated byIk(Θ) =
138∑
j=0
ˆ
−30+0.216·(j+1)
−30+0.216·jN(∆Θ)d∆Θ ≈
0.532
6[N(0.216) + 4N(0) +N(−0.216)](5.1.4)so that at the end a full angular range of 60 is passed through. All eight measurementsfor one onguration (wavelength, in ident angle) are individually integrated with thisSimpson's Rule and in the end the average is al ulated:
Imean =1
8
8∑
k=1
Ik (5.1.5)The un ertainty of the average is gained via the un ertainty on average:σImean =
√
√
√
√
1
8− 1
8∑
k=1
(Ik − Imean)2 (5.1.6)This un ertainty dominates the un ertainties from every single measurement (a ura yof the stepper, histogram error of the ounts) and is therefore the only one, that is onsidered for the following analysis.5.2 Ree tivity MeasurementThis hapter will on entrate on the analysis of the measured ree tivity in dependen eon the dierent parameters wavelength and the in ident angle. In the end, the inuen eof the results on the Geant4 simulation for the Winston one is dis ussed.5.2.1 Wavelength Dependen eTo ompare the wavelength dependent ree tivity for aluminium in dierent stages ofoxidation, at ve dierent times the light beams were dete ted. At rst, the ree tivityof the polished aluminium is determined. After two, twelve and 20 days, new measure-ments were performed to get information on how the ree tivity might hange duringtime. Another measurement with a humid surfa e should show whether there is anyinuen e on the ree tivity hara teristi s.The ree tivity is plotted in a new graph for every of the dierent stages of oxidationpolished, two days, twelve days and 20 days of oxidation and for the humid surfa e.If values for the ree tivity are greater than 1.0, whi h is not a physi al number for aree tivity, they are redu ed to a value of 1.0 with errorbars only downwards.26

5.2 Ree tivity MeasurementIn gure 5.2.1 the ree tivity for dierent stages of oxidation for an in ident angleof the light beam of 45 is presented. The blue solid line des ribes the ree tivityexpe tation from the Fresnel equations. It is useful to rst ompare the measured re-e tivity with the expe tation and se ond to ompare the ree tivity in dierent stagesof oxidation.0.4
0.5
0.6
0.7
0.8
0.9
1.0
Reflectivity
0.4
0.5
0.6
0.7
0.8
0.9
1.0
Reflectivity
385 390 395 400 405 410wavelength / nm
0.4
0.5
0.6
0.7
0.8
0.9
1.0
Reflectivity polished
2 days old12 days old20 days oldhumidFigure 5.2.1: The wavelength dependent spe trum for a range between 387 nm and411 nm. This measurement refers to an in ident angle of 45. The solidline in ea h subplot presents the expe tation from the Fresnel equations.Fo ussing on the ree tivity for the beam of polished aluminium (blue squares), theree tivity stays stable over the whole wavelength range and nearly meets the expe t-ation of the Fresnel equations. Only for the four smallest and greatest of the observedwavelength, the ree tivity u tuates to higher values. In these borderland region, theabsolute number of ounts is already mu h less than around 400 nm ( .f. gure 4.4.1)and as a result also the orresponding errors on the ree tivity are higher. After twodays of oxidation, the ree tivity has been measured again. The orresponding data isplotted by the red triangles. In nearly the whole wavelength range, the ree tivity isa little below the one on erning the polished aluminium, but within the un ertaintiesboth ree tivity measurements are in agreement towards ea h other.The measurements after twelve (bla k pentagons) and after twenty days (orange stars)also agree to the former data, although the ree tivity seems to be higher after twelvedays of oxidation - even higher than the Fresnel expe tation. But onsidering the er-rors, no tenden y towards worse or even better ree tivity is learly visible. 27

Chapter 5 Data AnalysisMeasuring the ree tivity for a humid aluminium surfa e (small green dots), one ansee rst that for a wide range of wavelength the ree tivity falls to values of 0.7 and theerror bars are far greater arising from stronger up- and downturns in the ree tivity inea h of the eight measurements. A tenden y for humid aluminium surfa es is dis ussedfurther downwards by des ribing the inuen e of the humidity at other in ident angles.In gure 5.2.2 the measured ree tivity for an in ident angle of the light at 60 isplotted again for a polished aluminium surfa e, for a two, twelve and twenty daysoxidised surfa e and for a humid surfa e.0.4
0.5
0.6
0.7
0.8
0.9
1.0
Reflectivity
0.4
0.5
0.6
0.7
0.8
0.9
1.0
Reflectivity
385 390 395 400 405 410wavelength / nm
0.4
0.5
0.6
0.7
0.8
0.9
1.0
Reflectivity polished
2 days old12 days old20 days oldhumidFigure 5.2.2: The wavelength dependent spe trum for a range between 387 nm and411 nm. This measurement refers to an in ident angle of 60. The solidline in ea h subplot presents the expe tation from the Fresnel equations.The ree tivity for the polished aluminium surfa e (blue squares) indeed u tuatesover the wavelength range, but with no spe ial tenden y, as the error bars again aregreater than the u tuation of the single ree tivity measurements. The measurementsfor two days of oxidation (red triangles) u tuate again and are not as stable on onedistin tive ree tivity level as it was for 45. Nevertheless, the values are again in theregion of ree tivity as those of polished aluminium. After twelve days of oxidation themeasured ree tivity de reases of an average of 8% to 10% (bla k pentagons). As aftereight more days of oxidation (orange stars), the ree tivity again in reases to the valuesof polished aluminium, the on lusion is lose, that also for an in ident angle of 60, theree tivity does not hange during the oxidation pro ess. For nearly all wavelengths,28

5.2 Ree tivity Measurementthe ree tivity is measured to a higher value than the Fresnel equations would expe t- ex ept for the twelve day oxide layer and for the humid aluminium surfa e. Thede rease after twelve days of oxidation thus has to be reasoned dierently. Possibleexplanations might be the state of dierent external parameters like the temperatureor air moisture or pressure. The intensity of the LED is temperature dependent andthus the LED needs some time to warm-up after it is turned on.For the humid surfa e, the ree tivity drops to u tuating values around 0.85, whi h isindeed less than for the oxidised surfa e. Only the twelve days oxide layer orrespondsto the humid surfa e whi h ould be an eviden e for a high air humidity at that day,the twelve day oxide layer was measured, has deteriorated the ree tivity.0.30.40.50.60.70.80.91.0
Reflectivity
0.30.40.50.60.70.80.91.0
Reflectivity
385 390 395 400 405 410wavelength / nm
0.30.40.50.60.70.80.91.0
Reflectivity polished
2 days old12 days old20 days oldhumidFigure 5.2.3: The wavelength dependent spe trum for a range between 387 nm and411 nm. This measurement refers to an in ident angle of 75. The solidline in ea h subplot presents the expe tation from the Fresnel equations.For an in ident angle of 75, again ve measurements at dierent stages of oxidationor in one ase of humidity were performed. The results are presented in gure 5.2.3.The rst data that really diers from the other plots is the really low ree tivity ofthe humid aluminium surfa e. For high in ident angles humidity seems to get moreproblemati than it was the ase for smaller ones.The ree tivity for polished aluminium (blue squares) is approximately lo ated around0.85 with u tuations up to 0.9 at the top and 0.8 at the bottom. Comparing theree tivity for 2 days (red triangles), twelve days (bla k pentagons) and twenty days ofoxidation (orange stars), the ree tivity is higher than for a polished aluminium sur-29

Chapter 5 Data Analysisfa e and thus even higher than expe ted from the Fresnel equations. However, strongu tuations depending on the wavelength and high errorbars indi ate the data to alldierent stages of oxidation to des ribe the same value of ree tivity and no lear tend-en y is visible, that the ree tivity hanges during oxidation pro esses.Con luding the analysis of the wavelength dependent ree tivity, one an say thatthere is no eviden e for the oxidation layer on the aluminium surfa e to redu e the re-e tivity. In ase of the three dierent in ident angles 45, 60 and 75 the ree tivitystays around 90%. Flu tuations of single measurements that dier from this value, still orrespond to the value of 90% due to high errors.If the aluminium surfa e gets humid, this might ause ree tivity to partly de reaseenormous, as it was presented for 75.5.2.2 Angular Dependen eAs stated before, the ree tivity depends on the in ident angle as already presented ingure 3.3.1. The angular dependen e for a wavelength of 400 nm is plotted in gure5.2.4. For an in ident angle of 45, the ree tivity is - with one ex eption -below theFresnel expe tion. In ontrast to that, the values of ree tivity for 60 and 75 arereally s attered around the expe tation.The missing data espe ially for the humid surfa e at 75 is not plotted in this gure,be ause the value is far below 0.6.5.3 Inuen e on the Winston Cone OperationThe ree tivity of the aluminium surfa e has dire t inuen e on the e ien y of thewhole FAMOUS teles ope and espe ially on the dete tion of the sili on photomultiplier.In gure 5.3.1 the fra tion of the dete ted light as a fun tion of the exit angle ispresented. The dieren e between a 100% spike ree ting (blue) and for 100% loberee ting surfa e (red) o urs in both the angular distribution and the transmission.The lobed surfa e leads to a higher range of possible exit angles and the transmissionde reases from 91% to 78%.Therefore, a Geant4 simulation of the light ux as a fun tion of the in ident and exitangle of the Winston one was made to re ognise dieren es in the dete ted light uxe ien y. In gure 5.3.2 the distribution of the light ux as a fun tion of the in identangle on the Winston one is presented. The plot on the top refers to omplete spikeree tion, whereas the plot on the bottom des ribes the situation for fully lobe ree tedlight. The dete tion e ien y of the Winston- one-SiPM-system is presented in blue olour ode. The darker, the more e ient.Comparing the two plots, one an see, that for a ompletely spiky surfa e, the e- ien y is onstant for in ident angles up to 26 (whi h is the maximum in ident angle, .f. 2.5.2) for a light ux of up to 100 photons per ns.30

5.3 Inuen e on the Winston Cone Operation
0 10 20 30 40 50 60 70 80 90angle in degree
0.60
0.65
0.70
0.75
0.80
0.85
0.90
0.95
1.00
Reflectivity
R
Rp
Rs
polished2 days old12days old20 days oldhumidFigure 5.2.4: The angular dependen e of the ree tivity. The data is a little shifted aroundthe three in ident angles of 45, 60 and 75 to better improve visibility onthe x-axis.In ontrast to that, the dete tion e ien y for a surfa e with 100% lobe ree tivityhas got a strong dependen e on the in ident angle. The highest e ien y is given forsmall in ident angles and a small light ux and de reases strong for rising in identangles or a rising light ux. Furthermore the maximum dete tion e ien y with 0.18is approximately 5% smaller than for spike ree ted surfa es (up to 0.23).
31

Chapter 5 Data Analysis
Figure 5.3.1: The angular distribution of a 100% spike ree ting (blue) and for 100% loberee ting surfa e (red). The lobe surfa e leads to a higher range of possibleexit angles and transmission de reases.
32

5.3 Inuen e on the Winston Cone Operation
Figure 5.3.2: The Geant4 Simulation of the light ux e ien y of the Winston-Cone-SiPM-system. Top: The ree tivity of the Winston one is set to 100%spike ree tivity. Bottom: The ree tivity of the Winston one is set to100% lobe ree tion and σα is set to 12 33


Chapter 6Con lusionThe uores en e teles ope FAMOUS will onsist of a refra tive Fresnel lens with thediameter and the fo al length D = f = 510mm. The fo al plane onsists of 64 singlesili on photomultipliers aranged in a hexagonal stru ture. To in rease the size of thefo al plane and de rease dead spa e between the single SiPMs, Winston ones will beused as light funnels. They have got an entran e radius of r1 = 6.7mm and an exitradius of r2 = 3mm. This auses the ee tive area in rease by a fa tor of ve.The Winston ones are made of polished aluminium to have a high transmission. For awavelength of 400 nm, the refra tive index of aluminium is n = n+iκ = 0.4879+4.8355i.Making use of the Fresnel equations, the ree tivity for an unpolarised light sour e,hitting a plane, surfa e an be determined to be in a range between 0.9 and 0.95 in awide range of in ident angles. Impurities aused by oxidation pro esses an redu e theree tivity to deteriorate and instead of just a spike ree tion (the surfa e a ts like aperfe t mirror), lobe (the surfa e onsists of small mi rofa ets s attering the light todierent dire tions) or Lambertian ree tion (the ree tivity of the surfa e follows theLambertian Law, whi h is prin ipally a osine fun tion) an o ur.For the experimental setup, an LED in the UV region is used as a light sour e and adete tion bre onne ted to a bre spe trometer is used to measure the intensity of theLED beam at a wavelength resolution of 1 nm.First, the intensity of the light beam is measured. Se ondly, the aluminium surfa e ispositioned in the opti al path to measure the intensity of the ree ted light beam. Theratio of the intensities dire tly gives the value of ree tivity. It was determined to stay onstantly at values between 0.7 and 0.95 depending on the dierent in ident angles of45, 60 and 75 on the aluminium surfa e. The ree tivity was measured for dierentstages of oxidation of the aluminium - after two, twelve and 20 days, but no ee tof a de reasing ree tivity was re ognised within the resolution of the un ertainties.However, a humid surfa e does partially redu e the ree tivity enormously up to 30%.Thus, even a long term use of the Winston ones in the FAMOUS teles ope will notredu e the e ien y of the ree tivity properties of the aluminium surfa e. The Win-ston ones are now ready to be used in the teles ope to enable measurements of rstlight at end of this year.
35

Bibliography[1 Johannes Blümer, Ralph Engel, and Jörg R. Hörandel, Cosmi Rays from theKnee to the Highest Energies, 2009.[2 K. Nakamura et al. (Parti le Data Group), 2011 Review of Parti le Physi s, J.Phys. G 37, 075021 (2010) and 2011 partial update for the 2012 edition.[3 F. Ar ipetre et al. Nu l. Phys. Pro . Suppl. 150, pp. 186189, 2006.[4 M. Ave et al. (AIRFLY Collab.) Nu l. Instr. Meth. A 597, p. 41, 2008.[5 Tim Niggemann, New Teles ope Design with Sili on Photomultipliers for Fluor-es en e Light Dete tion of Extensive Air Showers, Master's thesis, 2012.[6 Tim Niggemann, Thomas Hebbeker, Markus Laus her, Christine Meurer, LukasMiddendorf, Johannes S huma her & Mauri e Stephan, The Opti s and Dete tor-Simulation of the Air Fluores en e Teles ope FAMOUS for the Dete tion of Cosmi Rays, SPIE, vol. 8444.[7 Mauri e Stephan, Thomas Hebbeker, Markus Laus her, Christine Meurer, TimNiggemann & Johannes S huma her, Future use of sili on photomultipliers forthe uores en e dete tion of ultra-high-energy osmi rays, SPIE, vol. 8155.[8 Markus Laus her, Chara terisation Studies of Sili on Photomultipliers for theDete tion of Fluores en e Light from Extensive Air Showers, Master's thesis,2012.[9 Daniel Wilson, Angular Dependen e of the Relative Photon Dete tion E ien yof Sili on Photomultipliers. to be published in September 2012.[10 Wolfgang Demtröder, Experimentalphysik 2 - Elektrizität und Optik. SpringerVerlag, 2004.[11 http://refra tiveindex.info/?group=metals&material=aluminium, 05.09.2012.[12 J.I. Larruquert, J.A. Mendez, J.A. Aznarez, Far-UV ree tan e of UHV-preparedAl lms and its degradation after exposure to O2, Applied Opti s, vol. 33, 1994.[13 Minghong Yang, Alexandre Gatto, Norbert Kaiser, Highly ree ting aluminum-prote ted opti al oatings for the va uum-ultraviolet spe tral range, Applied Op-ti s, vol. 45, 2006.[14 Physi s 323, Le ture 16, Opti s. 37
Bibliography[15 Polarisierte Li htquelle (de 10 2007 053 297 .2) [0002, 11 2007.[16 Martin Jane ek, William W. Moses, Simulating S intillator Light Colle tion Us-ing Measured Opti al Ree tan e, 2010.[17 Paloma Diaz, Simulating light olle tion,[18 www.o eanopti s. om/te hni al/usb2000%20operating%20instru tions.pdf,31.08.2012.[19 http://arduino. /en/main/arduinoboarduno, 09.09.2012.[20 http://de.nanote . om/downloads/pdf/3724/st2818s1006%20layout1%20(1).pdf,03.09.2012.[21 http://de.nanote . om/downloads/pdf/3367/gpll22-gearbox+datenblatter%20layout1%20(1).pdf, 03.09.2012.[22 http://mathworld.wolfram. om/simpsonsrule.html, 05.09.2012.
38
A knowledgementsDanksagungenHier mö hte i h mi h bei allen Leuten bedanken, die mi h bei dem Erstellen dieserArbeit unterstützt und dabei begleitet haben. Es ist unmögli h, allen Leuten hier per-sönli h zu danken. Daher danke i h au h all denen, die mir während der Anfertigungmeiner Ba helorarbeit geholfen haben, aber ni ht namentli h erwähnt werden.Besonderen Dank gilt es vor allem an Herrn Prof. Dr. Hebbeker zu ri hten, der esmir überhaupt erst ermögli ht hat, diese Ba helorarbeit an seinem Institut und unterseiner Leitung anzufertigen. Vielen Dank dafür.Des Weiteren mö hte i h mi h bei meinem Betreuer Tim Niggemann bedanken, dermi h in endlosen Stunden unterstützt hat, von der Ausarbeitung eines Experimenti-erablaufs bis hin zur fertigen Ba helorarbeit zu gelangen und mir immer wieder mitwertvollen Tips sowie Hilfestellungen zur Seite stand. Ohne di h hätte i h geradeim Einstieg in die mir komplett neue Programmierspra he Python groÿe Problemebekommen. Herrn Dr. Markus Mers hmeyer danke i h für seine Geduld, wenn i h zumwiederholten Male zum glei hen Thema seine Hilfe in Anspru h nehmen musste.I h bedanke mi h au h bei allen Mitarbeitern der Auger-Arbeitsgruppe, die mir inwö hentli hen Meetings neue Ideen und Anstöÿe gegeben haben, um mi h weiter mitder Materie auseinanderzusetzen und von anderen Gesi htspunkten zu betra hten. Ins-besondere mö hte i h mi h dabei bei den Mitarbeitern unserer FAMOUS-Kollaborationbedanken, neben Tim Niggemann bestehend aus Christine Peters, Mauri e Stephan,Markus Laus her, Rebe a Meiÿner und Daniel Wilson.Groÿen Dank gilt an die Mitarbeiter der Institutswerkstatt, die mir meinen Messauf-bau gebaut haben und immer geholfen haben, als i h Materialien brau hte oder dieAluminiumoberä he neu poliert haben musste. Besonders mö hte i h Herrn BarthelPhilipps meinen Dank ausdrü ken für die Konstruktion des Messaufbaus sowie dass hnelle Umsetzen von spontanten Änderungen am Aufbau.Zu guter Letzt danke i h meiner Familie und Freunde für den guten Rü khalt und diementale Unterstützung während meiner Ba helorarbeit.39


ErklärungI h versi here, dass i h die Arbeit selbstständig verfasst und keine anderen als dieangegebenen Quellen und Hilfsmittel benutzt habe. Alle Stellen, die dem Wortlautoder Sinn na h anderen Quellen entnommen sind, habe i h in jedem einzelnen Fallunter genauer Angabe dieser deutli h als Entlehnung kenntli h gema ht.Aa hen, den 13.9 .2012Sebastian Mann
41