Embed Size (px)
DESCRIPTION
Measurement of the Speed of Cosmic Rays. Cosmic Rays are very high energy particles and thus most move at nearly the cosmic speed limit – the speed of light. Thus we are effectively measuring the speed of light , c. - PowerPoint PPT Presentation
Citation preview

Measurement of the Speed of Cosmic Rays

• Cosmic Rays are very high energy particles and thus most move at nearly the cosmic speed limit – the speed of light. Thus we are effectively measuring the speed of light , c.
• Galileo (of Leaning Tower of Pisa fame) was probably the first to try to measure c in about 1600.
• Galileo also was the first to understand the pendulum and thus periodic motion which is the basis of early clocks. He did not have a good portable clock and probably used his pulse as the clock for this experiment – one heart beat is about one second.
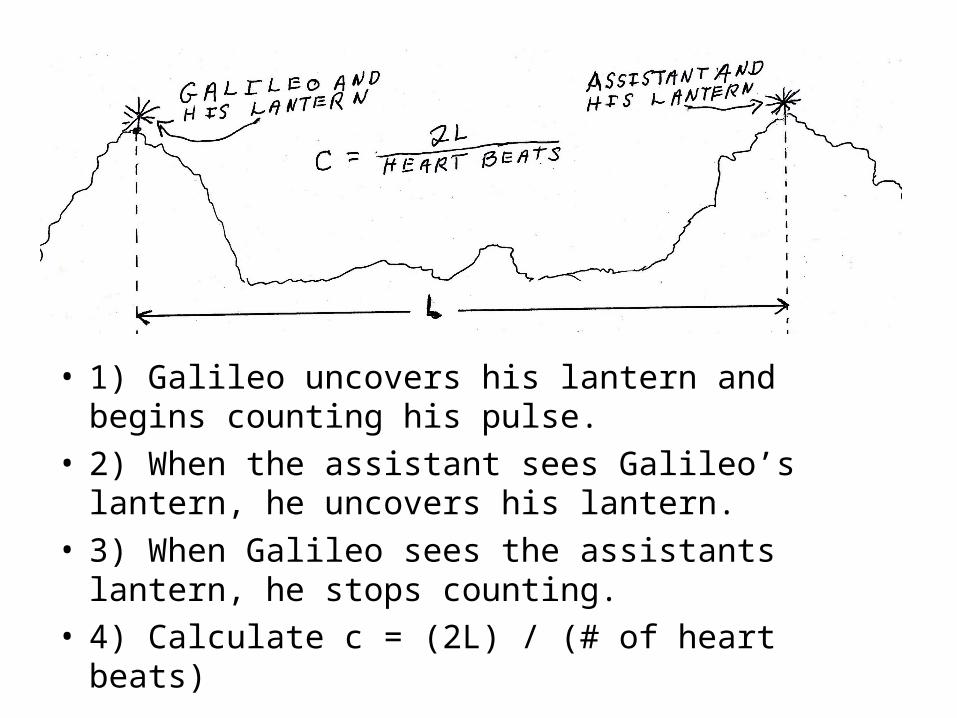
• 1) Galileo uncovers his lantern and begins counting his pulse.
• 2) When the assistant sees Galileo’s lantern, he uncovers his lantern.
• 3) When Galileo sees the assistants lantern, he stops counting.
• 4) Calculate c = (2L) / (# of heart beats)

• Results: Barely a heartbeat, consistent with the reaction time for assistant to uncover his lantern.
• Conclusion: Light is too fast to measure this way.
• Retrospective: Light goes a distance of about 8 times around the earth in a second. Galileo needed an impractically long base line to use with his one second clock.
• Progress: About 75 years later Roemer and Huygens used the successive eclipses of one of Jupiter’s moons as the signal and the diameter of the earth’s orbit as the baseline. They got a result within about 10% of the current value for the speed of light.

• For our experiment we use the heart beat of a computer clock, 1.25 nanosec = 1.25e-9 sec and plastic scintillators coupled to photomultiplier tubes. These detectors introduce delays of a few nanosec. This delay is stable to about a nanosec for a photomultiplier but varies by a few nanosec from tube to tube.
• We use the scintillators in telescope mode with two at the top separated by a few meters from the two at the bottom. If ts is the time a cosmic ray goes through the top scintillator, it gives a signal at time ts + d where d is the (unknown) delay of the top detector. A detector a distance s below the top gives a signal at ts+d’+(s/c).


Procedure
• 1) Set up close pairs separated by as much distance as you can manage with the c1,c2 pair at the top and run until a few hundred muons are registered. Write both files.
• 2) Repeat with c1 and c3 interchanged.• 3) measure c1 to c3 distance• 4) Read .csv files into spread sheet and for each event
calculate c3 rise time – c1 rise time.• 5) Calculate averages for the two runs• 6) Note that you computed c3-c1 for both runs while the
formalism uses c1-c3 for the r run. Flip the sign for the r run and calculate c.
What can go wrong?
• We assumed that each 4-fold coincidence was made by a muon going through all four counters. Different muons which come at nearly the same time through the top and bottom pairs also give a coincidence. The next slide shows a histogram of the c1,c3 time difference from a 6 week (1178 hr) run taken to explore this problem. Note that it is a log plot. If this were shown on a regular (linear) plot with the background at 1 mm height, the peak would be a hundred meters high!
• The bins horizontal axis is clock ticks and the bins are 1 clock tick. • A tick is 1.25 nanoseconds.• The vertical axis is counts per tick.• The curve is a Gaussian (Bell) curve which has been fitted to the
data.• Note the background as well as the broadening near the bottom.


• The background due to different muons through the top and bottom pairs should be flat. Replotting the same data in 2 tick bins and using a larger range on the horizontal axis shows this background more clearly and also shows the range of time differences accepted as triggers.


Comments – Interpretation
• The flat background is clear and there is also a problem in the wings of the Gaussian. The center of the Gaussian is the best estimate of the c1,c3 time difference. The peak is so strong that these affects do not perturb the mean and RMS significantly from the fitted values.
• The range of the background is from -140 to +130 ticks. Gate 960 and TDC 384 were used and are clearly adequate for the larger spacing in the expeiment in the stair well with a spacing of two floors.

• The 2-muon background is about 1.5 counts per bin and there are 135 occupied bins or a total of 202 of these events in this 1178 hr run. For a one hour run, expect 202/1178 or 0.17 such events.
• The fattness at the bottom of the Gaussian has a comparable number of events.
• In a long run the peak is clear. Fluctuations in the small number of background and “fattness” events is occasionally a problem for short runs of an hour or so.