Embed Size (px)
Citation preview
Measurement of the Bs-Bs Oscillation Frequency
Nuno Leonardo Massachusetts Institute of Technology
for the CDF Collaboration
Argonne National Laboratory, June14th 2006
0 0
N. Leonardo, MIT ANL Seminar, June 2006
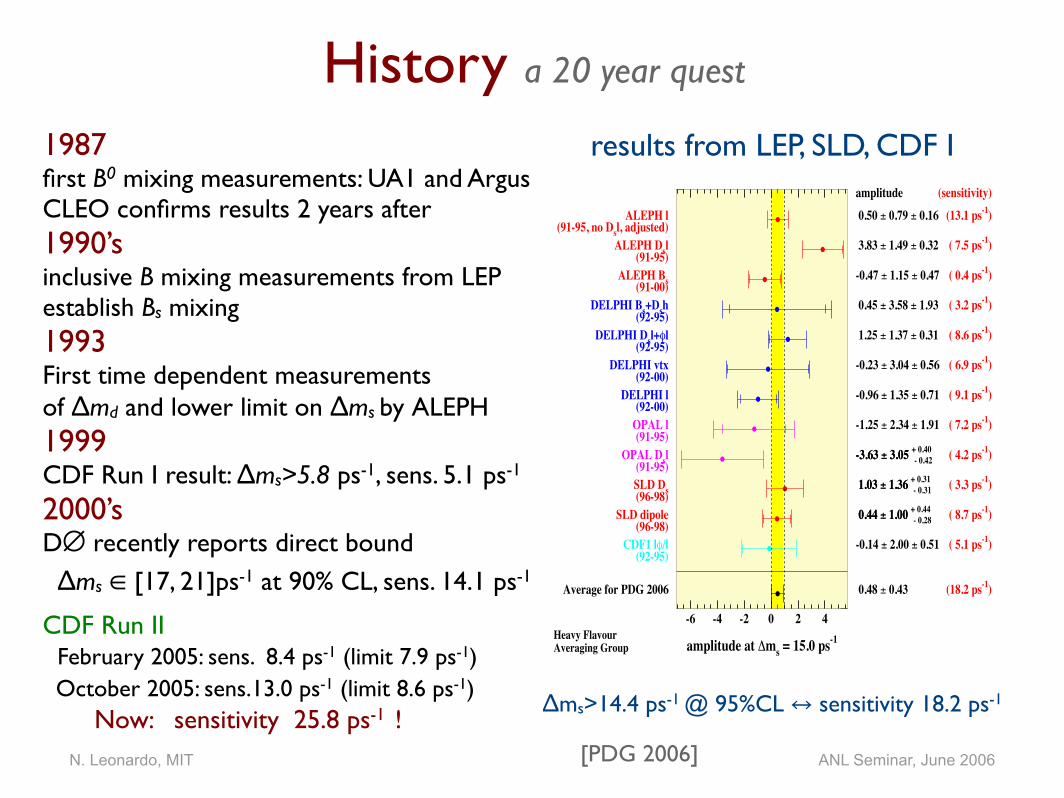
History a 20 year quest
-6 -4 -2 0 2 4
amplitude at !ms = 15.0 ps-1
Average for PDG 2006 0.48 ± 0.43
amplitude
(18.2 ps-1)
(sensitivity)
CDF1 l"/l(92-95)
-0.14 ± 2.00 ± 0.51 ( 5.1 ps-1)
SLD dipole(96-98)
0.44 ± 1.00 + 0.44 0.44 ± 1.00 - 0.28 ( 8.7 ps-1)
SLD Ds(96-98) 1.03 ± 1.36 + 0.31 1.03 ± 1.36 - 0.31 ( 3.3 ps-1)
OPAL Dsl(91-95)-3.63 ± 3.05 + 0.40-3.63 ± 3.05 - 0.42 ( 4.2 ps-1)
OPAL l(91-95)
-1.25 ± 2.34 ± 1.91 ( 7.2 ps-1)
DELPHI l(92-00)
-0.96 ± 1.35 ± 0.71 ( 9.1 ps-1)
DELPHI vtx(92-00)
-0.23 ± 3.04 ± 0.56 ( 6.9 ps-1)
DELPHI Dsl+"l(92-95)
1.25 ± 1.37 ± 0.31 ( 8.6 ps-1)
DELPHI Bs+Dsh(92-95) 0.45 ± 3.58 ± 1.93 ( 3.2 ps-1)
ALEPH Bs(91-00)-0.47 ± 1.15 ± 0.47 ( 0.4 ps-1)
ALEPH Dsl(91-95) 3.83 ± 1.49 ± 0.32 ( 7.5 ps-1)
ALEPH l(91-95, no Dsl, adjusted)
0.50 ± 0.79 ± 0.16 (13.1 ps-1)
Heavy FlavourAveraging Group
results from LEP, SLD, CDF I
Δms>14.4 ps-1 @ 95%CL ↔ sensitivity 18.2 ps-1
[PDG 2006]
1987first B0 mixing measurements: UA1 and ArgusCLEO confirms results 2 years after1990’sinclusive B mixing measurements from LEP establish Bs mixing1993First time dependent measurements of Δmd and lower limit on Δms by ALEPH1999CDF Run I result: Δms>5.8 ps-1, sens. 5.1 ps-1
2000’sD∅ recently reports direct bound
Δms ∈ [17, 21]ps-1 at 90% CL, sens. 14.1 ps-1
CDF Run II February 2005: sens. 8.4 ps-1 (limit 7.9 ps-1) October 2005: sens.13.0 ps-1 (limit 8.6 ps-1) Now: sensitivity 25.8 ps-1 !

N. Leonardo, MIT ANL Seminar, June 2006
Flavor Oscillations• neutral mesons undergo particle-antiparticle oscillations
• two-state system
• two mass eigenstates
‣ separately evolve in time
• mass difference
determines oscillation frequency of the system
0
0.2
0.4
0.6
0.8
0 1 2 3 4 5proper decay time, t [ps]
Prob
abilit
y De
nsity
unmixedmixedtotal
P(B → B̄) ∼e−t/τ
2τ(1 − cos ∆m t)
{|B(b̄s)〉, |B̄(bs̄)〉}
{|BH〉, |BL〉}
∆m = MH − ML
N. Leonardo, MIT ANL Seminar, June 2006
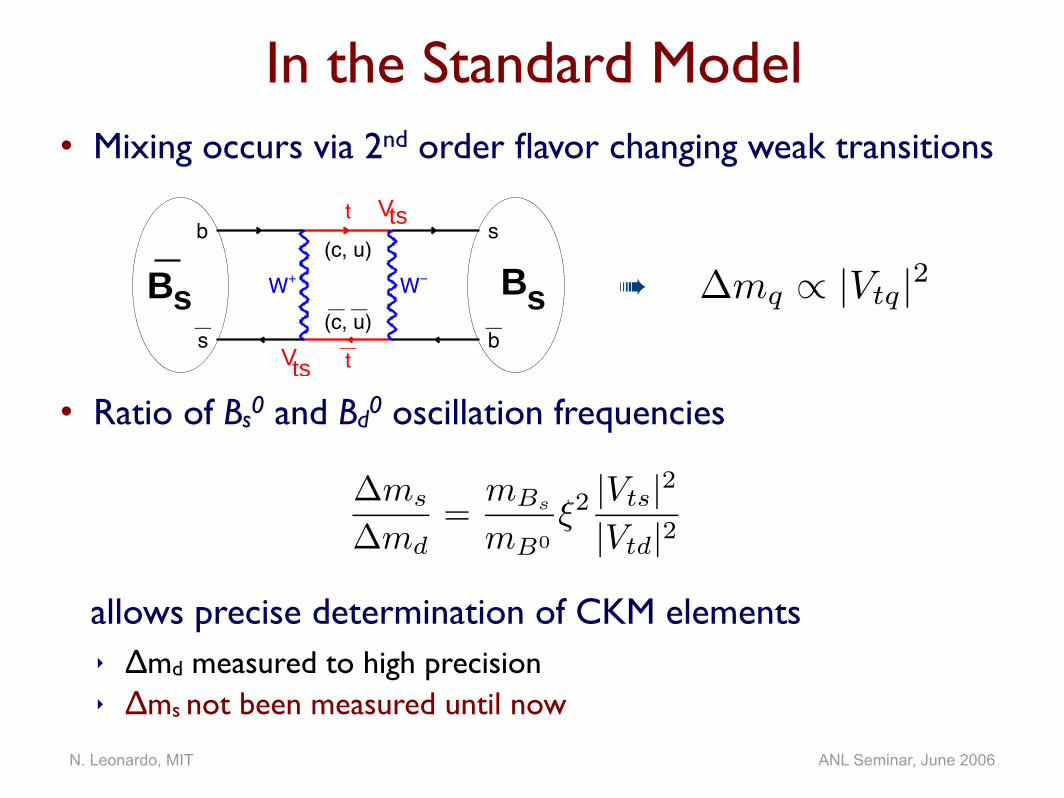
In the Standard Model• Mixing occurs via 2nd order flavor changing weak transitions
• Ratio of Bs0 and Bd0 oscillation frequencies
allows precise determination of CKM elements‣ Δmd measured to high precision‣ Δms not been measured until now
∆ms
∆md
=mBs
mB0
ξ2|Vts|2
|Vtd|2
t!
t(c, u)
(c!, u!)W+ W"
s!
b
b!
s
Bs Bs
Vts
Vts
∆mq ∝ |Vtq|2
➠
N. Leonardo, MIT ANL Seminar, June 2006
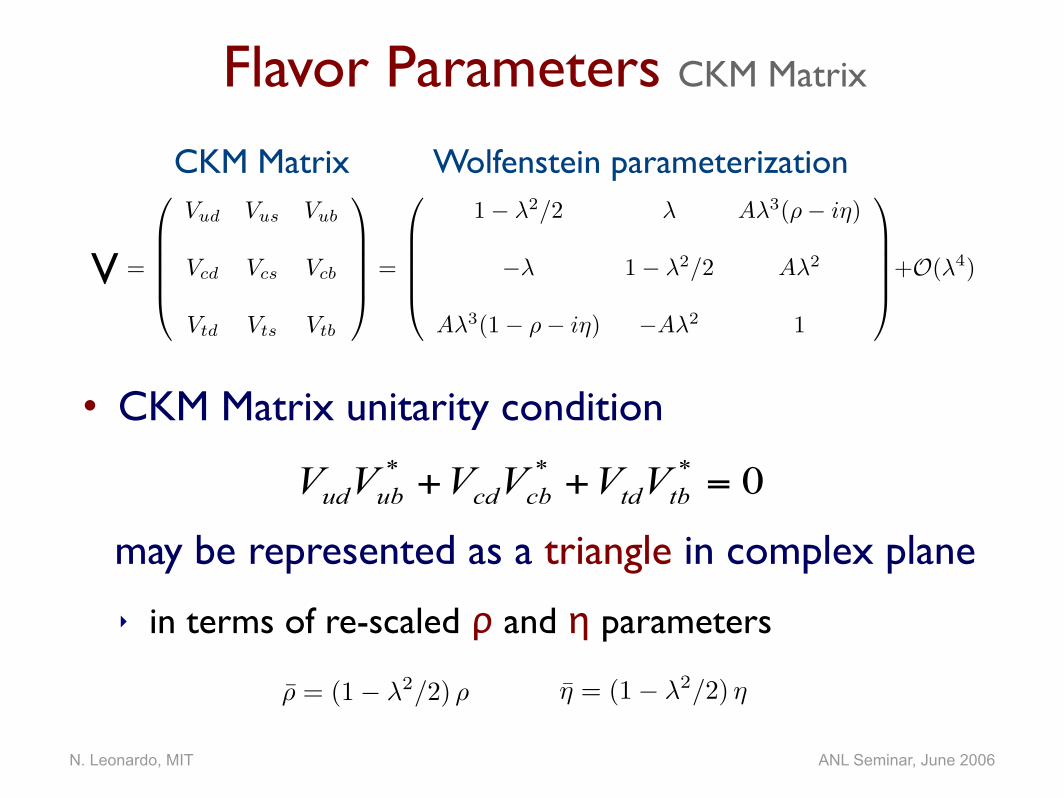
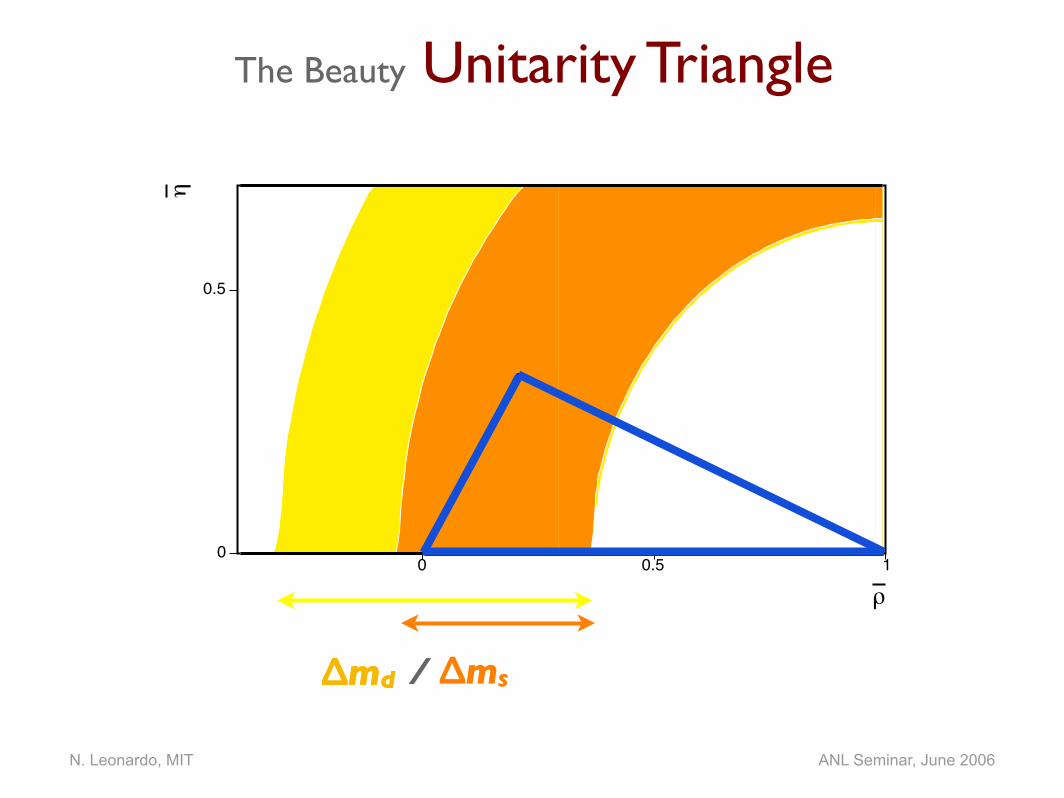
η̄ = (1 − λ2/2) ηρ̄ = (1 − λ2/2) ρ
Flavor Parameters CKM Matrix
• CKM Matrix unitarity condition
may be represented as a triangle in complex plane
‣ in terms of re-scaled ρ and η parameters
0*** =++ tbtdcbcdubud VVVVVV
CKM Matrix Wolfenstein parameterization
V =
Vud Vus Vub
Vcd Vcs Vcb
Vtd Vts Vtb
=
1 − λ2/2 λ Aλ3(ρ − iη)
−λ 1 − λ2/2 Aλ2
Aλ3(1 − ρ − iη) −Aλ2 1
+O(λ4)
N. Leonardo, MIT ANL Seminar, June 2006
!
0 0.5 1
"
0
0.5
Δmd
!
0 0.5 1
"
0
0.5
The Beauty Unitarity Triangle
!
0 0.5 1
"
0
0.5
/ ΔmsΔmd
N. Leonardo, MIT ANL Seminar, June 2006
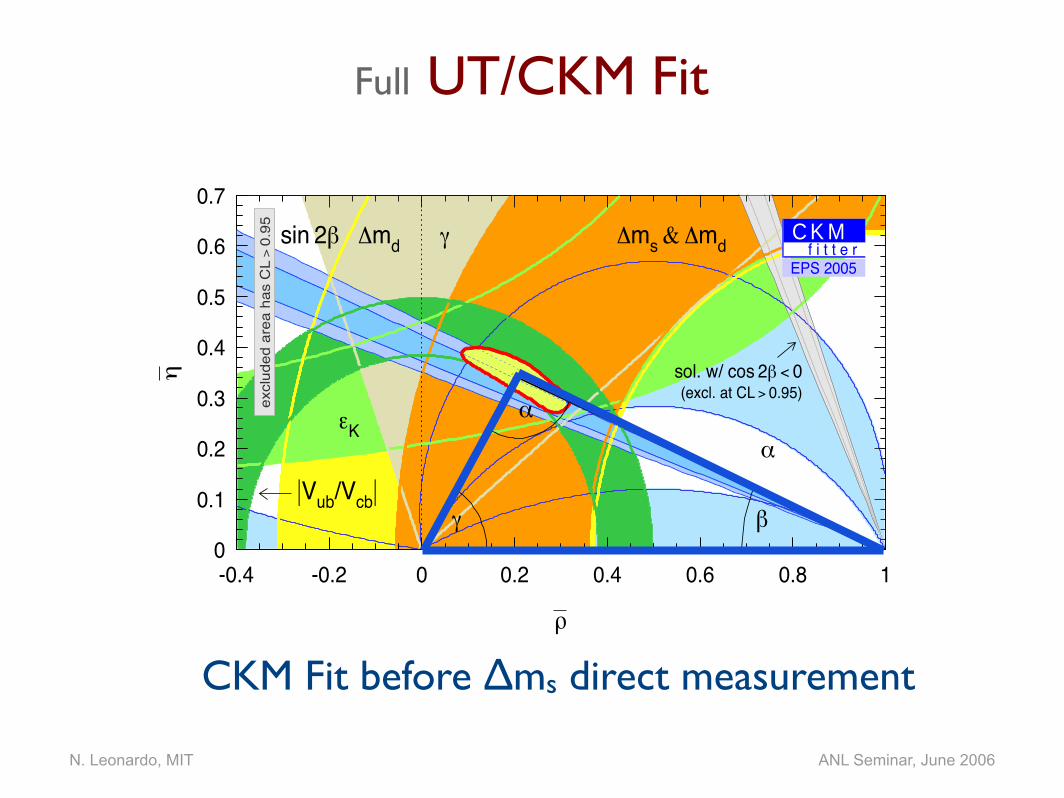
Full UT/CKM Fit
0
0.1
0.2
0.3
0.4
0.5
0.6
0.7
-0.4 -0.2 0 0.2 0.4 0.6 0.8 1
!
"md
#K
$ "ms & "md
|Vub/Vcb|
sin 2%
sol. w/ cos 2% < 0(excl. at CL > 0.95)
!
%$
&
'
excl
uded
are
a ha
s C
L > 0.
95 C K Mf i t t e r
EPS 2005
CKM Fit before Δms direct measurement

N. Leonardo, MIT ANL Seminar, June 2006
Probe of New Physics
• Additional virtual particles change Δms from SM expected value
• Measured value can be used to restrict model parameters
∝ tanβ4
[Phys. Rev. D 69 0904024 (2004)] [hep-ph/0605177 (2006)] [Eur. Phys. J. C 24 275 (2002)]
Examples:
N. Leonardo, MIT ANL Seminar, June 2006
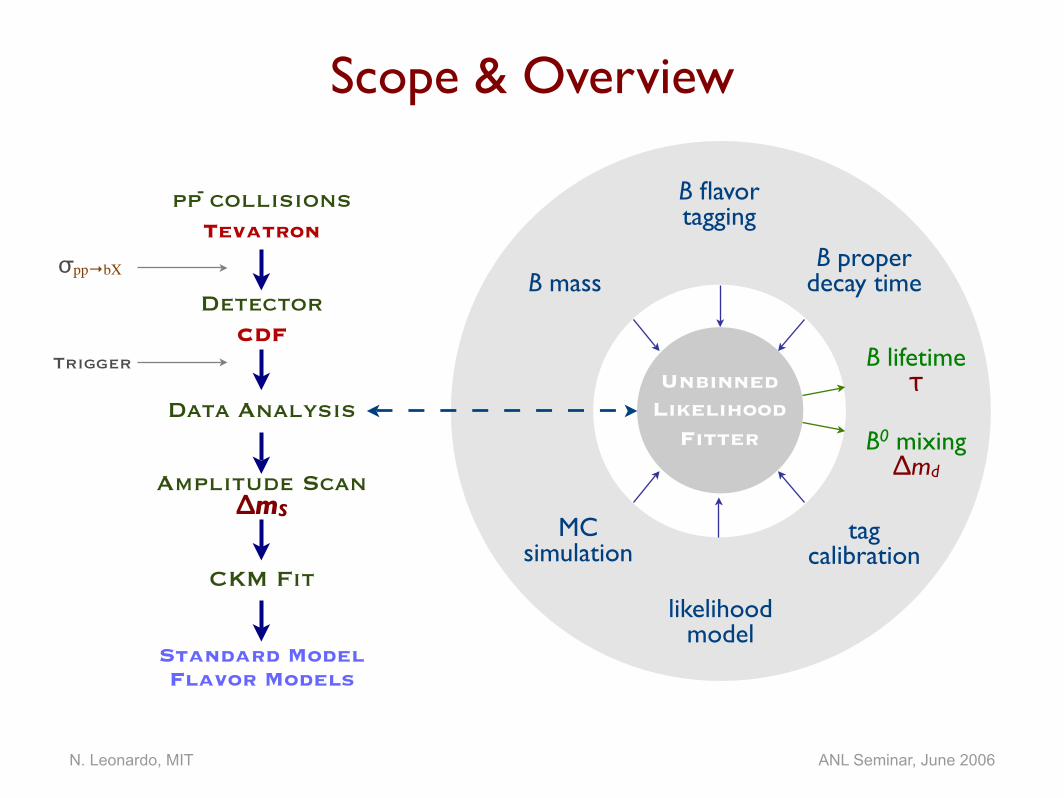
Scope & Overview
pp collisionsTevatron
DetectorCDF
Data Analysis
Amplitude ScanΔmS
CKM Fit
Standard ModelFlavor Models
-
Trigger
σpp→bX
Unbinned Likelihood
Fitter
B flavor tagging
B proper decay timeB mass
B lifetime τB0 mixing Δmd
tag calibration
likelihood model
MCsimulation
N. Leonardo, MIT ANL Seminar, June 2006
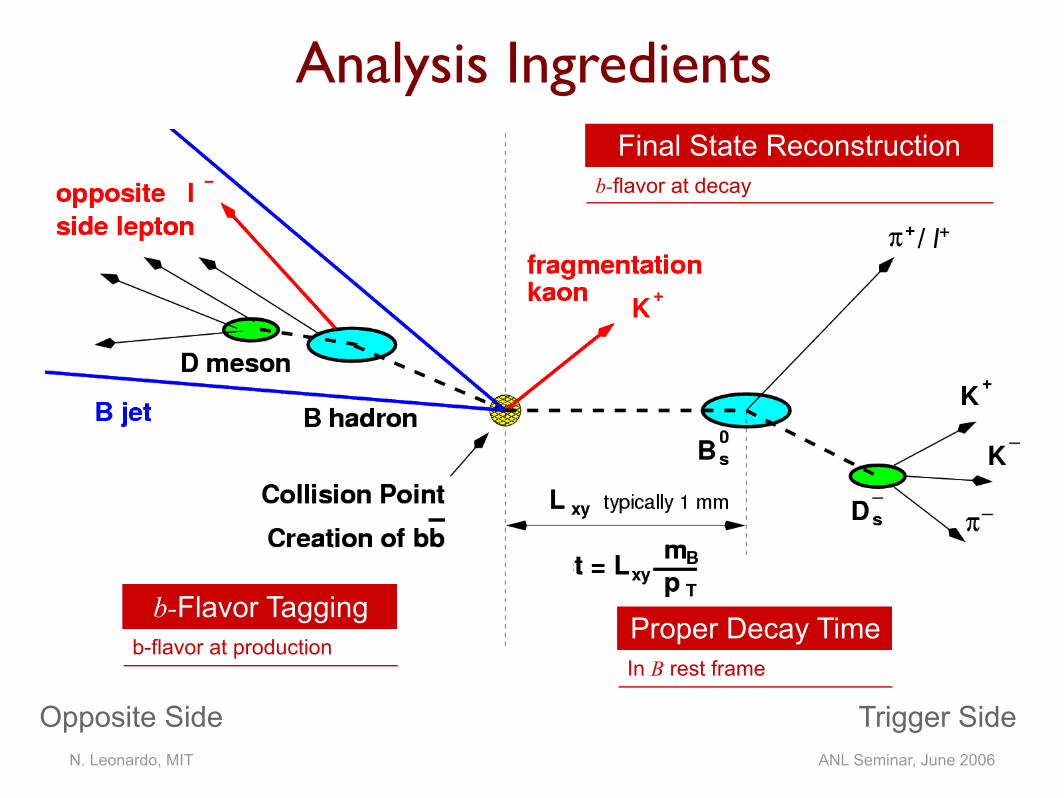
Final State Reconstructionb-flavor at decay
Proper Decay TimeIn B rest frame
Trigger SideOpposite Side
Analysis Ingredients
b-Flavor Taggingb-flavor at production
/ l+
N. Leonardo, MIT ANL Seminar, June 2006
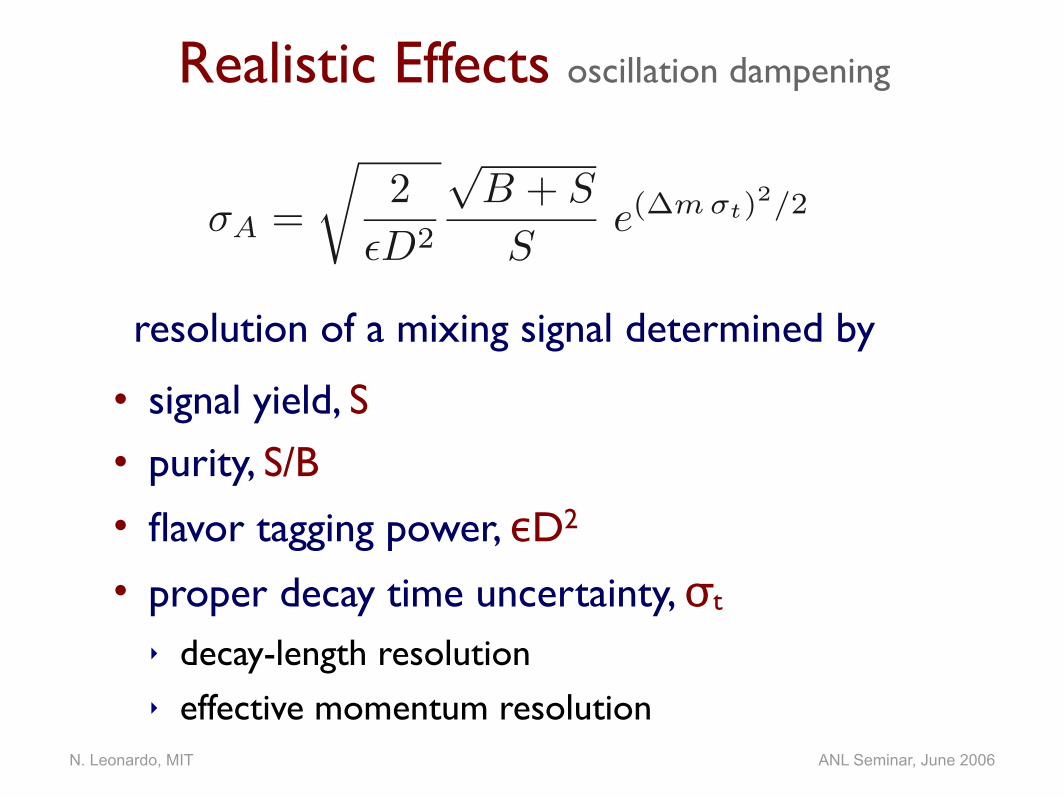
Realistic Effects oscillation dampening
resolution of a mixing signal determined by
• signal yield, S
• purity, S/B
• flavor tagging power, εD2
• proper decay time uncertainty, σt
‣ decay-length resolution‣ effective momentum resolution
σA =
√2
εD2
√B + S
Se(∆m σt)
2/2

Getting the Bs samples
N. Leonardo, MIT ANL Seminar, June 2006
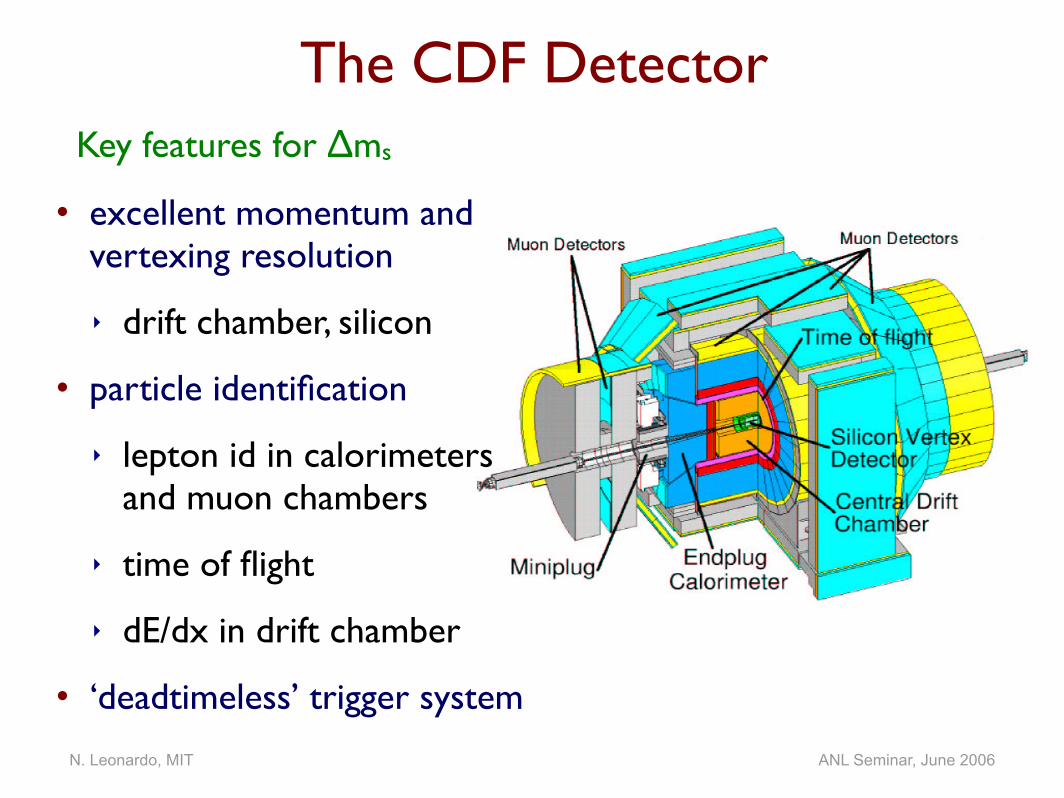
The CDF DetectorKey features for Δms
• excellent momentum and vertexing resolution
‣ drift chamber, silicon
• particle identification
‣ lepton id in calorimeters and muon chambers
‣ time of flight
‣ dE/dx in drift chamber
• ‘deadtimeless’ trigger system
N. Leonardo, MIT ANL Seminar, June 2006
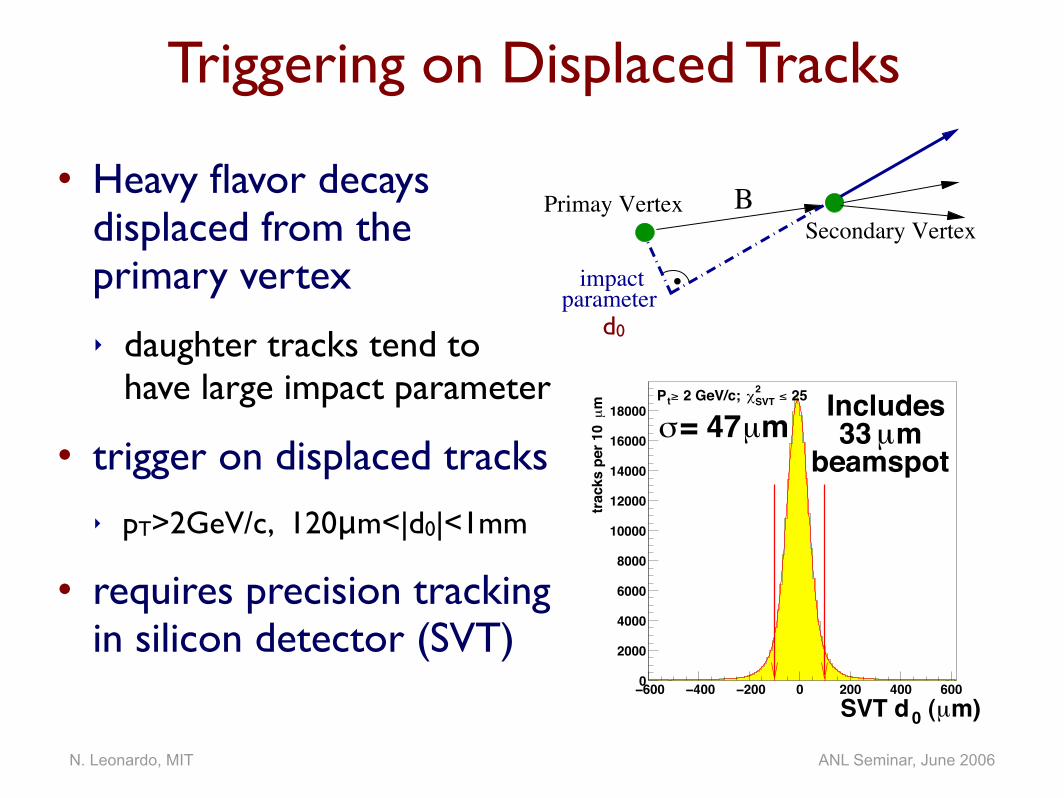
Triggering on Displaced Tracks
• Heavy flavor decays displaced from the primary vertex
‣ daughter tracks tend to have large impact parameter
• trigger on displaced tracks‣ pT>2GeV/c, 120μm<|d0|<1mm
• requires precision tracking in silicon detector (SVT)
!600 !400 !200 0 200 400 6000
2000
4000
6000
8000
10000
12000
14000
16000
18000
m)µ (0SVT d
25!SVT2" 2 GeV/c; #tP
m Includes
beamspot33 mµ µ = 47 $
mµ
track
s pe
r 10
Secondary VertexPrimay Vertex B
.impactparameter
d0
N. Leonardo, MIT ANL Seminar, June 2006
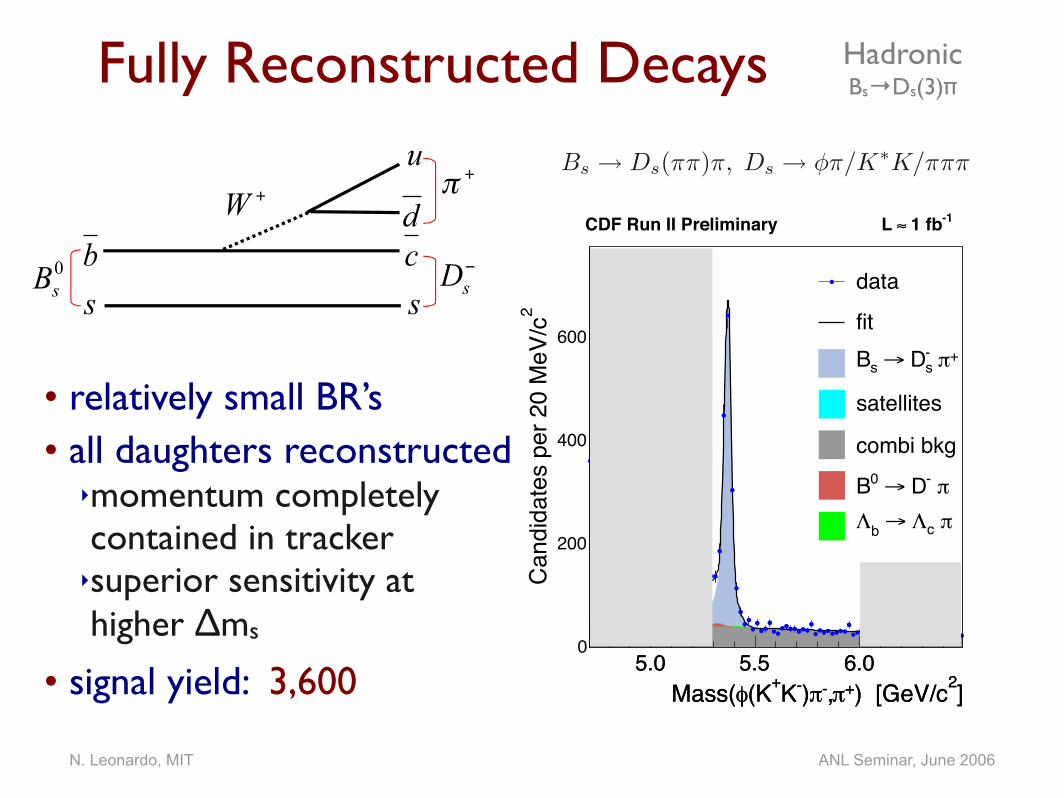
Fully Reconstructed Decays
• relatively small BR’s• all daughters reconstructed
‣momentum completely contained in tracker‣superior sensitivity at higher Δms
• signal yield: 3,600
HadronicBs→Ds(3)π
]2) [GeV/c+!,-!)-K+(K"Mass(5.0 5.5 6.0
2Ca
ndid
ates
per
20
MeV
/c
0
200
400
600
data
fit+! -
s D# s B
satellites
combi bkg
! - D# 0 B! c$ # b$
]2) [GeV/c+!,-!)-K+(K"Mass(5.0 5.5 6.0
-1 1 fb%CDF Run II Preliminary L
Bs → Ds(ππ)π, Ds → φπ/K∗K/πππ
0sB
−sD
+π+W
b cd
s
u
s
N. Leonardo, MIT ANL Seminar, June 2006]2lepton-D mass [GeV/c3 4 5
2Ca
ndid
ates
per
18
MeV
/c
0
1000
2000
3000
4000
Xs l D! sB
Data Fit
Signals B Physics Background Combinatorial + False Lepton
]2lepton-D mass [GeV/c3 4 5
CDF Run II Preliminary -1 1 fb"L
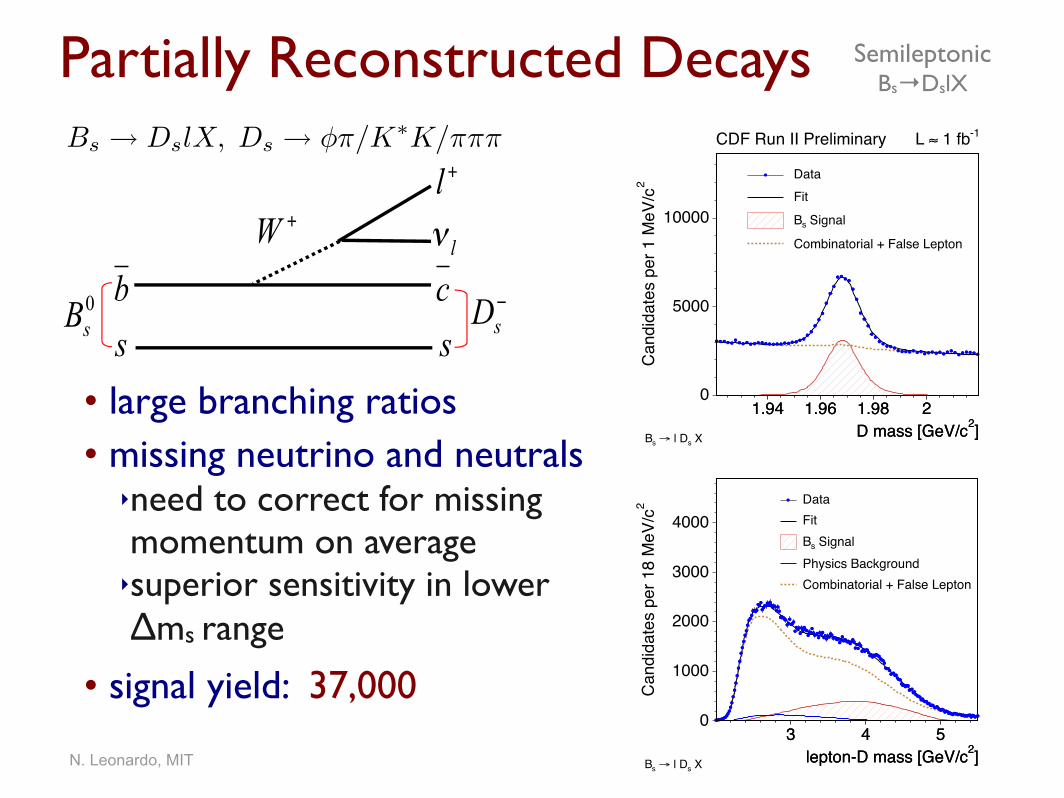
• large branching ratios• missing neutrino and neutrals
‣need to correct for missing momentum on average‣superior sensitivity in lower Δms range
• signal yield: 37,000
Partially Reconstructed Decays SemileptonicBs→DslX
]2D mass [GeV/c1.94 1.96 1.98 2
2Ca
ndid
ates
per
1 M
eV/c
0
5000
10000
Xs l D! sB
Data Fit
Signals B
Combinatorial + False Lepton
]2D mass [GeV/c1.94 1.96 1.98 2
CDF Run II Preliminary -1 1 fb"L
0sB
−sD
+W
b clν
s
+l
s
Bs → DslX, Ds → φπ/K∗K/πππ
Proper Decay Time B Lifetime measurement
N. Leonardo, MIT ANL Seminar, June 2006
Proper Decay Time
Life
time
effic
ienc
y
0
0.5
1
1.5
21!1f1"
2!2f2"3!3f3"
4!4f4"
0.00179 0.00150 0.06806 0.01322 0.08388 0.02725 0.01218 0.68894 0.00757 0.00755 0.22568 0.00839
/ NDF = 105.02 / 107, Prob = 56.34%2#
Proper decay length [cm]0 0.1 0.2 0.3 0.4
$(d
ata
- fit)
/
-2
0
20.20 0.4
proper decay distance [cm]
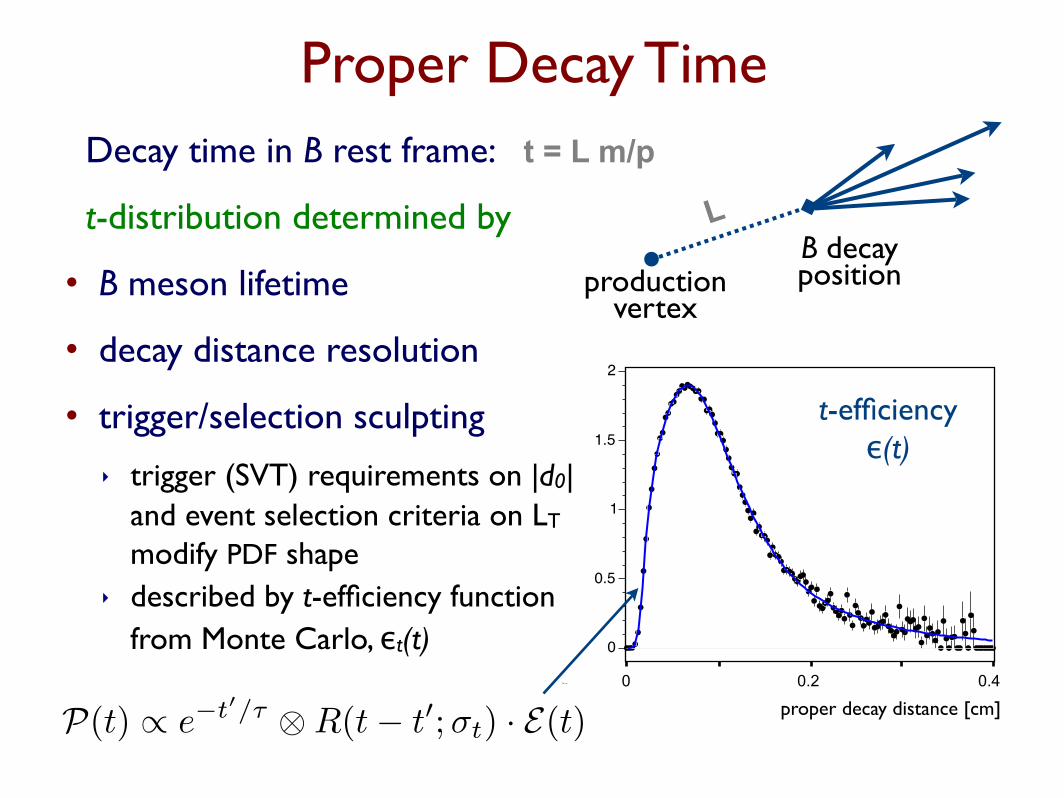
Decay time in B rest frame: t = L m/p
t-distribution determined by
• B meson lifetime
• decay distance resolution
• trigger/selection sculpting
‣ trigger (SVT) requirements on |d0| and event selection criteria on LT
modify PDF shape‣ described by t-efficiency function
from Monte Carlo, εt(t)
production vertex
B decay position
t-efficiency ε(t)
L
P(t) ∝ e−t′/τ ⊗ R(t − t
′;σt) · E(t)

N. Leonardo, MIT ANL Seminar, June 2006
proper time [cm]-0.2 -0.1 0.0 0.1 0.2
mµ
cand
idat
es /
20
10
210
310
410 data+! - D
fit+ f
++ f prompt
proper time [cm]-0.2 -0.1 0.0 0.1 0.2
CDF Run II Preliminary
proper time, ct [cm]
Calibrating Resolution in Data
• use large prompt D meson sample to construct B-like topologies of prompt D+track
• compare reconstructed decay point to interaction point• calibrate t-resolution by fitting prompt t-distribution
prompt track
Ds- vertex
P.V.“Bs” vertex
N. Leonardo, MIT ANL Seminar, June 2006
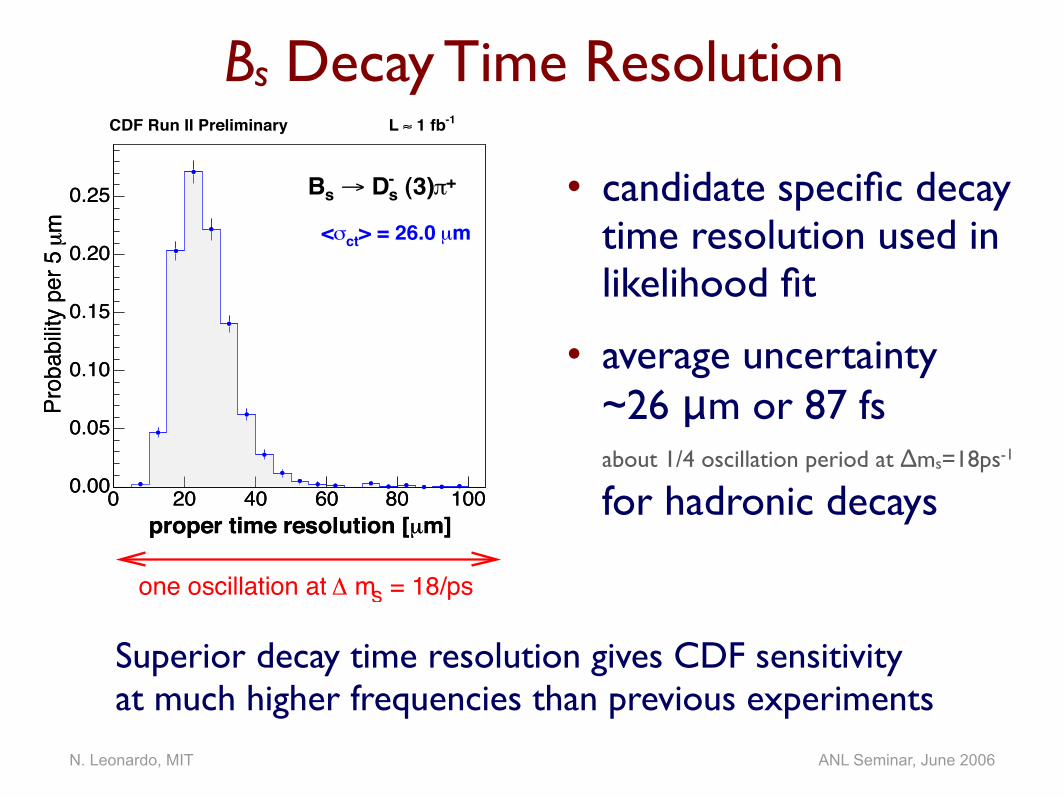
Bs Decay Time Resolution
• candidate specific decay time resolution used in likelihood fit
• average uncertainty ~26 μm or 87 fs about 1/4 oscillation period at Δms=18ps-1 for hadronic decays
m]µproper time resolution [0 20 40 60 80 100
mµPr
obab
ility
per 5
0.00
0.05
0.10
0.15
0.20
0.25
m]µproper time resolution [0 20 40 60 80 100
mµPr
obab
ility
per 5
0.00
0.05
0.10
0.15
0.20
0.25 +! (3)-s D" sB
mµ> = 26.0 ct# <
-1 1 fb$CDF Run II Preliminary L
one oscillation at m = 18/ps% s
Superior decay time resolution gives CDF sensitivity at much higher frequencies than previous experiments
N. Leonardo, MIT ANL Seminar, June 2006
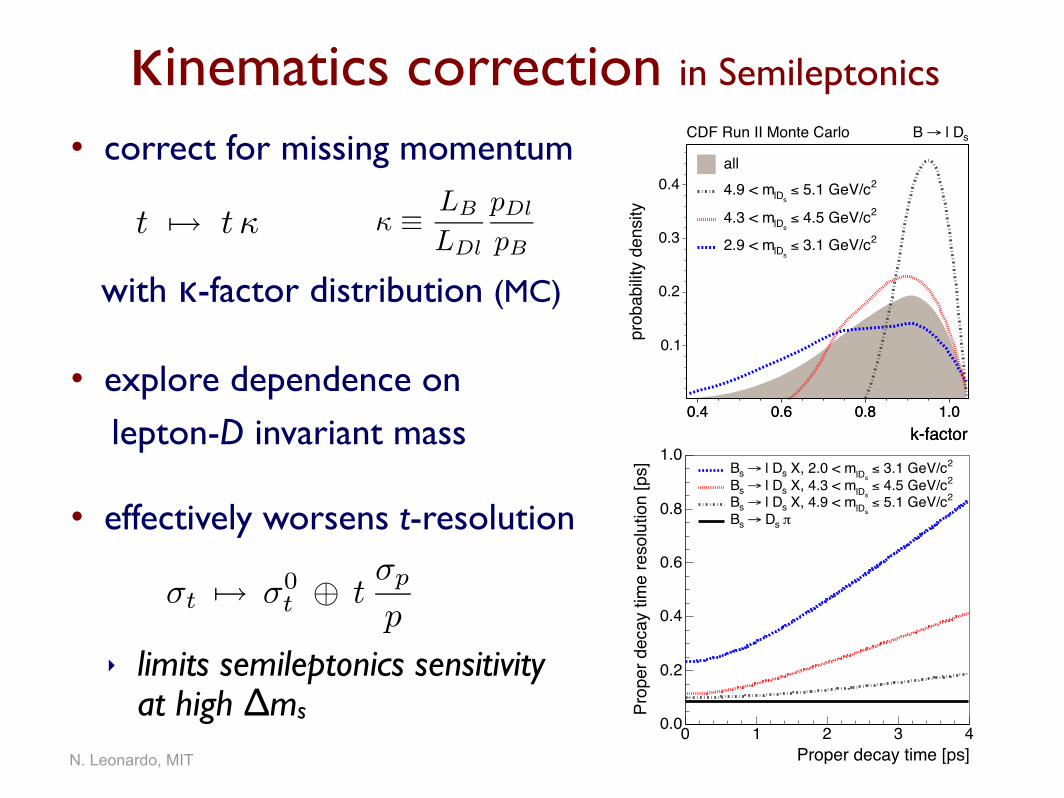
• correct for missing momentum
with κ-factor distribution (MC)
• explore dependence on lepton-D invariant mass
• effectively worsens t-resolution
‣ limits semileptonics sensitivity at high Δms
κinematics correction in Semileptonics
Proper decay time [ps]0 1 2 3 4
Prop
er d
ecay
tim
e re
solu
tion
[ps]
0.0
0.2
0.4
0.6
0.8
1.0
! s D" sB2 5.1 GeV/c#
slD X, 4.9 < ms l D" sB2 4.5 GeV/c#
slD X, 4.3 < ms l D" sB2 3.1 GeV/c#
slD X, 2.0 < ms l D" sB
k-factor0.4 0.6 0.8 1.0
prob
abilit
y de
nsity
0.1
0.2
0.3
0.4 all
2 5.1 GeV/c! slD 4.9 < m
2 4.5 GeV/c! slD 4.3 < m
2 3.1 GeV/c! slD 2.9 < m
CDF Run II Monte Carlo s l D"B
k-factor0.4 0.6 0.8 1.0
σt !→ σ0
t ⊕ tσp
p
κ ≡
LB
LDl
pDl
pB
t !→ t κ
N. Leonardo, MIT ANL Seminar, June 2006
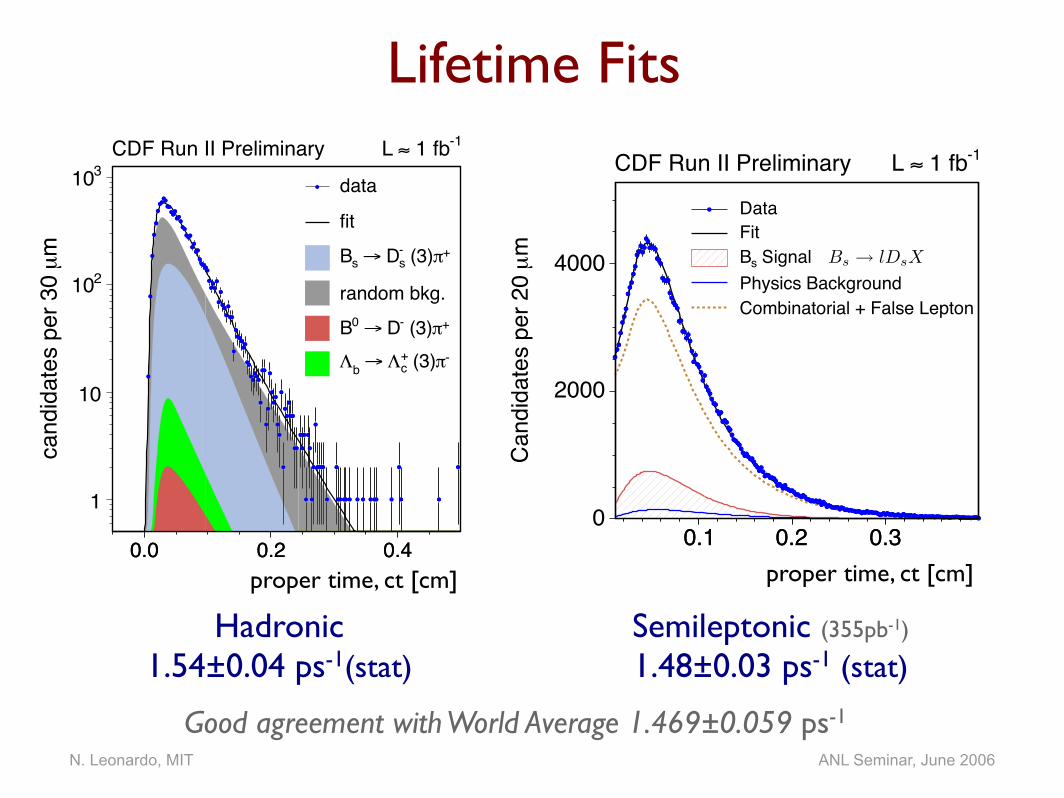
proper decay-length [cm]0.1 0.2 0.3
mµ
Cand
idat
es p
er 2
0 0
2000
4000
Xs l D! sB
Data Fit
Signals B Physics Background Combinatorial + False Lepton
proper decay-length [cm]0.1 0.2 0.3
CDF Run II Preliminary -1 1 fb"L
Bs → lDsX
proper time, ct [cm]
Lifetime Fits
Good agreement with World Average 1.469±0.059 ps-1
Hadronic 1.54±0.04 ps-1(stat)
Semileptonic (355pb-1) 1.48±0.03 ps-1 (stat)
proper time [cm]0.0 0.2 0.4
mµ
cand
idat
es p
er 3
0
1
10
210
310 data
fit+! (3)-
s D" s B
random bkg.+! (3)- D" 0 B-! (3)+
c# " b#
proper time [cm]0.0 0.2 0.4
CDF Run II Preliminary -1 1 fb$L
proper time, ct [cm]
b Flavor Tagging Δmd measurement
N. Leonardo, MIT ANL Seminar, June 2006
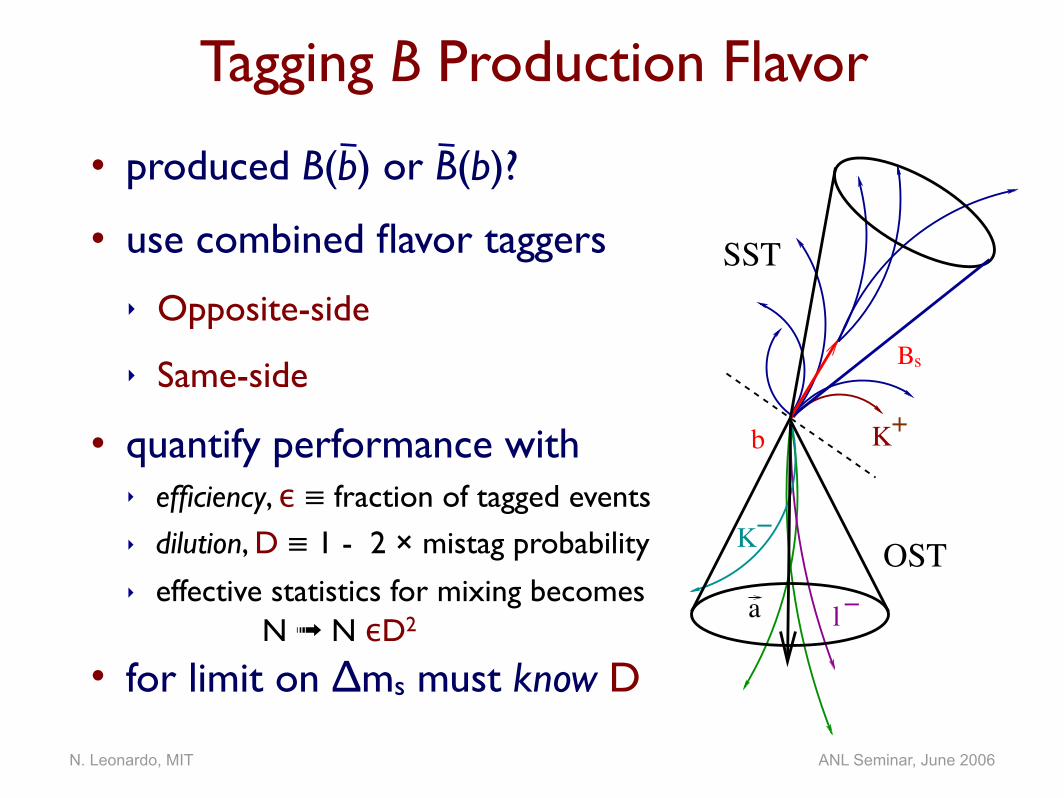
Tagging B Production Flavor
• produced B(b) or B(b)?
• use combined flavor taggers
‣ Opposite-side
‣ Same-side
• quantify performance with‣ efficiency, ε ≡ fraction of tagged events‣ dilution, D ≡ 1 - 2 × mistag probability‣ effective statistics for mixing becomes
N ➟ N εD2
• for limit on Δms must know D
K!
Bs
SST
OSTa l!
b K+
N. Leonardo, MIT ANL Seminar, June 2006
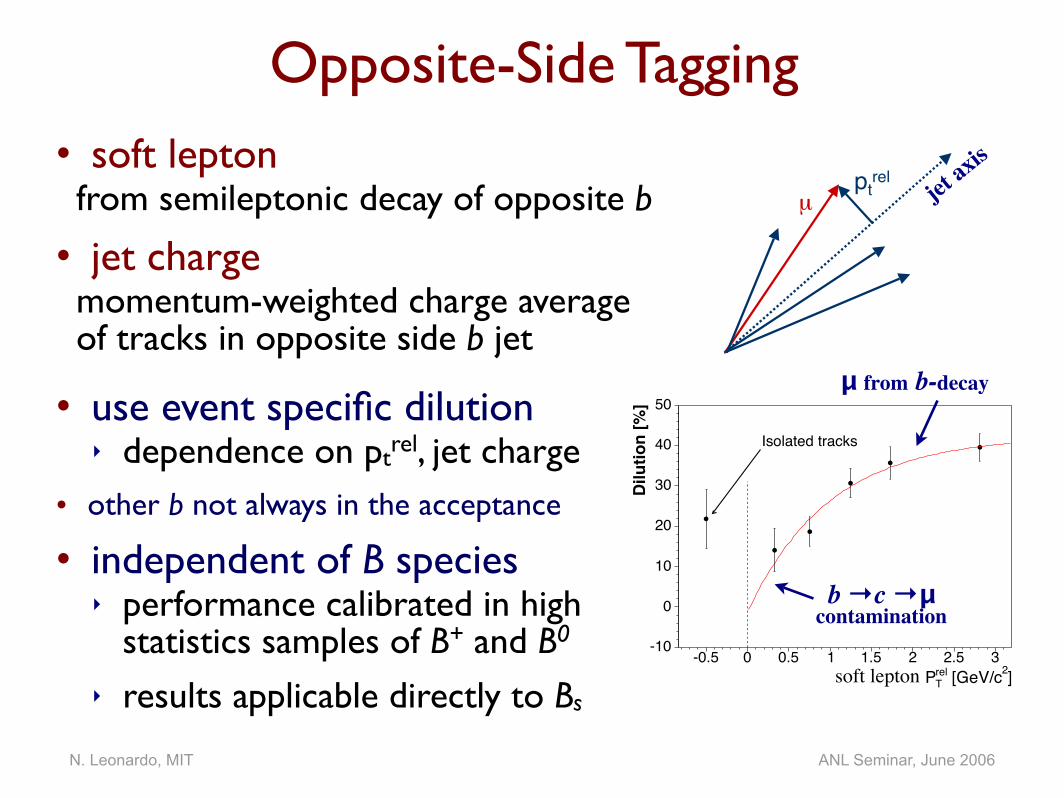
Opposite-Side Tagging
µptrel
• soft leptonfrom semileptonic decay of opposite b
• jet chargemomentum-weighted charge average of tracks in opposite side b jet
• use event specific dilution ‣ dependence on ptrel, jet charge
• other b not always in the acceptance
• independent of B species‣ performance calibrated in high
statistics samples of B+ and B0
‣ results applicable directly to Bs
jet axis
]2 [GeV/crelTP
-0.5 0 0.5 1 1.5 2 2.5 3Di
lutio
n [%
]-10
0
10
20
30
40
50
Isolated tracks
CMUP
CDF Run II Preliminary
b →c →μcontamination
μ from b-decay
soft lepton
N. Leonardo, MIT ANL Seminar, June 2006
proper decay-length [cm]0.05 0.1 0.15 0.2
asym
met
ry
-0.3
-0.2
-0.1
0
0.1
0.2
0.3
CDF Run II Preliminary
D Xµ e/!B
Soft Lepton Taggers
-1 355 pb"L
proper decay-length [cm]0.05 0.1 0.15 0.2
asym
met
ry
-0.3
-0.2
-0.1
0
0.1
0.2
0.3
data fit projection
contribution0 B contribution+ B
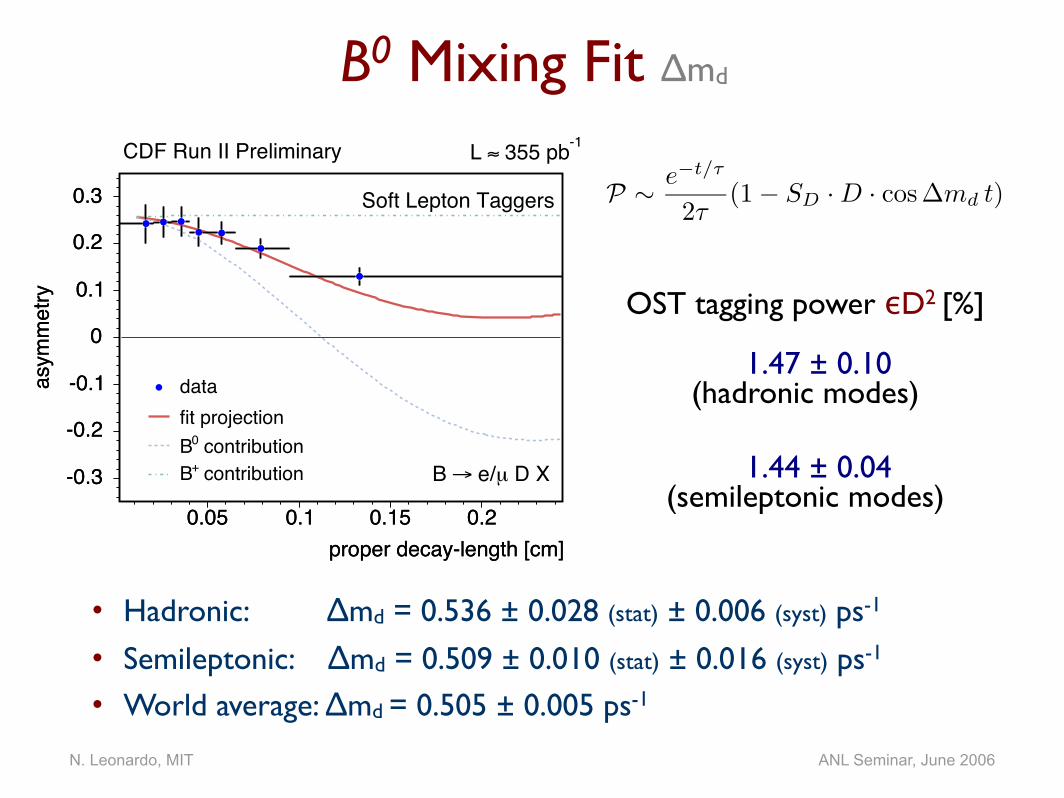
B0 Mixing Fit Δmd
• Hadronic: Δmd = 0.536 ± 0.028 (stat) ± 0.006 (syst) ps-1
• Semileptonic: Δmd = 0.509 ± 0.010 (stat) ± 0.016 (syst) ps-1
• World average: Δmd = 0.505 ± 0.005 ps-1
P ∼e−t/τ
2τ(1 − SD · D · cos ∆md t)
OST tagging power εD2 [%]
1.47 ± 0.10 (hadronic modes)
1.44 ± 0.04 (semileptonic modes)
N. Leonardo, MIT ANL Seminar, June 2006
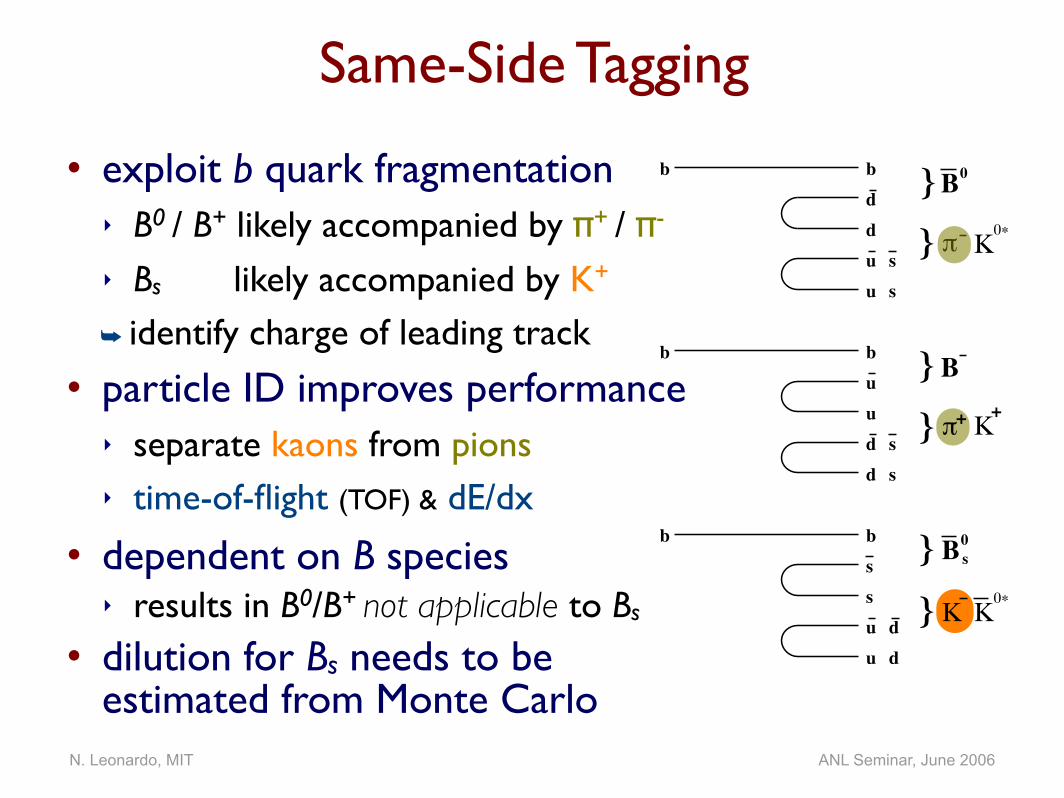
Same-Side Tagging
• exploit b quark fragmentation‣ B0 / B+ likely accompanied by π+ / π-
‣ Bs likely accompanied by K+
➥ identify charge of leading track
• particle ID improves performance‣ separate kaons from pions‣ time-of-flight (TOF) & dE/dx
• dependent on B species‣ results in B0/B+ not applicable to Bs
• dilution for Bs needs to be estimated from Monte Carlo
+
b b
b b
b b
d
u s
u
s
d s
u d
B0
B0
B
!+
0"!
!0"
!
d
u s
d s
u
s
u d
}}
}}
}}
s
#
#
N. Leonardo, MIT ANL Seminar, June 2006
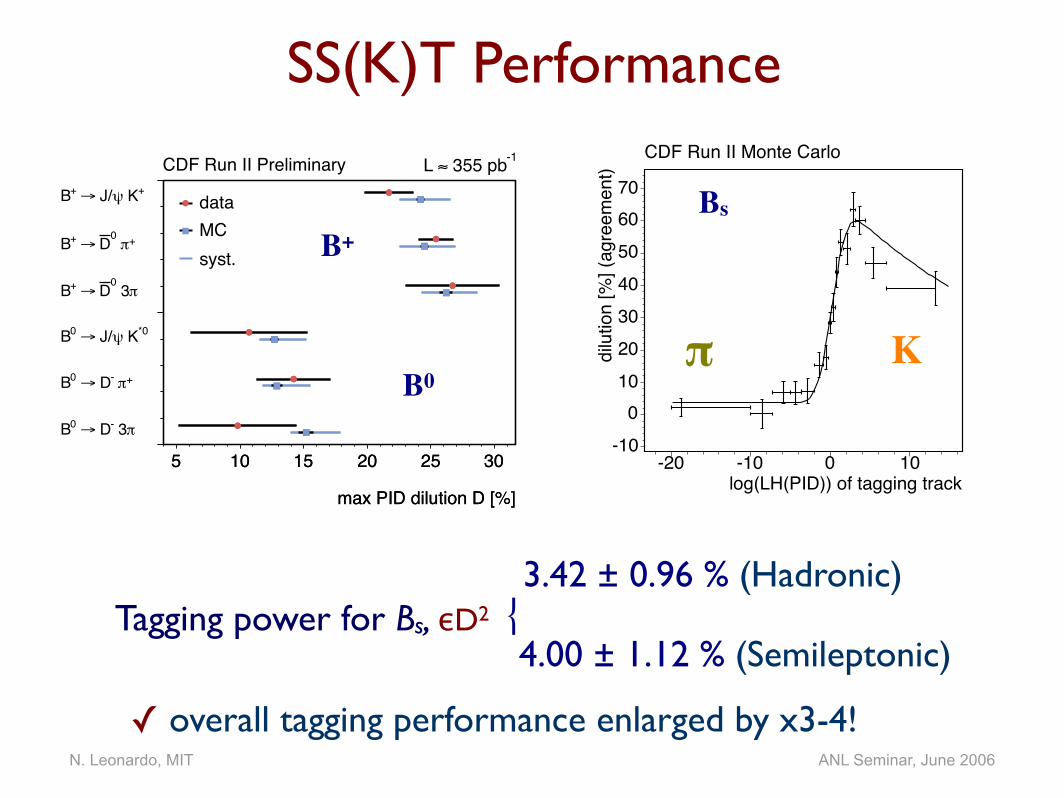
SS(K)T Performance
3.42 ± 0.96 % (Hadronic) Tagging power for Bs, εD2 ⎨
4.00 ± 1.12 % (Semileptonic)
✓ overall tagging performance enlarged by x3-4!
max PID dilution D [%]
5 10 15 20 25 30
max PID dilution D [%]
5 10 15 20 25 30
CDF Run II Preliminary -1 355 pb!L + K" J/# +B
+$ 0D # +B
$ 30D # +B
*0 K" J/# 0B
+$ - D# 0B
$ 3- D# 0B
data MC syst.
+!s- -> DsB
log(LH(PID)) of tagging track-20 -10 0 10
dilu
tion
[%] (
agre
emen
t)
-100
10203040506070
CDF Run II Monte Carlo
π K
Bs
B0
B+

Fit Procedure
N. Leonardo, MIT ANL Seminar, June 2006
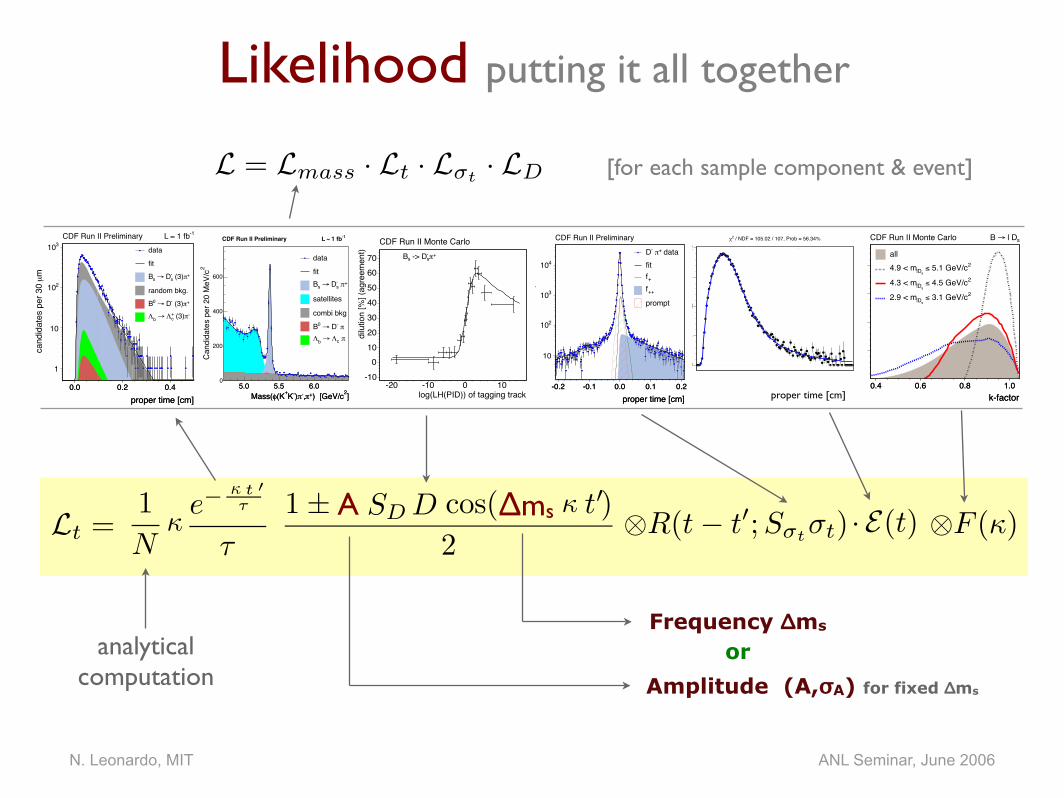
Likelihood putting it all together
1
NLt =
SD D′
′
⊗R(t − t′;Sσt
σt) · E(t)κ
κ
κ
⊗F (κ)
L = Lmass · Lt · Lσt· LD
Δms1 ± cos( t )
2A
[for each sample component & event]
analytical computation
k-factor0.4 0.6 0.8 1.0
prob
abilit
y de
nsity
0.1
0.2
0.3
0.4 all
2 5.1 GeV/c! slD 4.9 < m
2 4.5 GeV/c! slD 4.3 < m
2 3.1 GeV/c! slD 2.9 < m
CDF Run II Monte Carlo s l D"B
k-factor0.4 0.6 0.8 1.0
Life
time
effic
ienc
y
0
0.5
1
1.5
21!1f1"
2!2f2"3!3f3"
4!4f4"
0.00179 0.00150 0.06806 0.01322 0.08388 0.02725 0.01218 0.68894 0.00757 0.00755 0.22568 0.00839
/ NDF = 105.02 / 107, Prob = 56.34%2#
Proper decay length [cm]0 0.1 0.2 0.3 0.4
$(d
ata
- fit)
/
-2
0
2
proper time [cm]proper time [cm]-0.2 -0.1 0.0 0.1 0.2
mµ
cand
idat
es /
20
10
210
310
410 data+! - D
fit+ f
++ f prompt
proper time [cm]-0.2 -0.1 0.0 0.1 0.2
CDF Run II Preliminary
+!s- -> DsB
log(LH(PID)) of tagging track-20 -10 0 10
dilu
tion
[%] (
agre
emen
t)
-100
10203040506070
CDF Run II Monte Carlo
e−
t
τ
τ
proper time [cm]0.0 0.2 0.4
mµ
cand
idat
es p
er 3
0
1
10
210
310 data
fit+! (3)-
s D" s B
random bkg.+! (3)- D" 0 B-! (3)+
c# " b#
proper time [cm]0.0 0.2 0.4
CDF Run II Preliminary -1 1 fb$L
]2) [GeV/c+!,-!)-K+(K"Mass(5.0 5.5 6.0
2Ca
ndid
ates
per
20
MeV
/c
0
200
400
600
data
fit+! -
s D# s B
satellites
combi bkg
! - D# 0 B! c$ # b$
]2) [GeV/c+!,-!)-K+(K"Mass(5.0 5.5 6.0
-1 1 fb%CDF Run II Preliminary L
Frequency Δms
Amplitude (A,σA) for fixed Δms
or
N. Leonardo, MIT ANL Seminar, June 2006
decay time, ps0.0 0.5 1.0 1.5 2.0
prob
abili
ty d
ensi
ty
0.00.1
0.20.30.4
0.50.6
0.70.8
time domain analysis
totalunmixedmixed
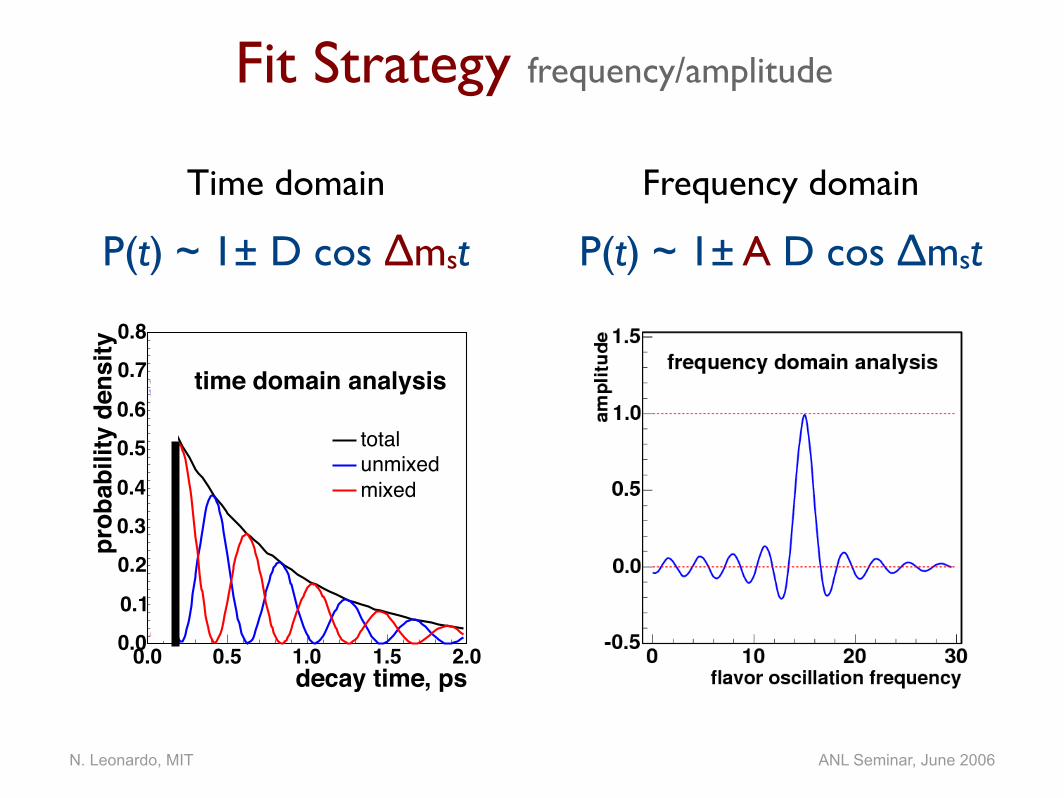
Fit Strategy frequency/amplitude
Time domain
P(t) ~ 1± D cos Δmst
Frequency domain
P(t) ~ 1± A D cos Δmst
N. Leonardo, MIT ANL Seminar, June 2006
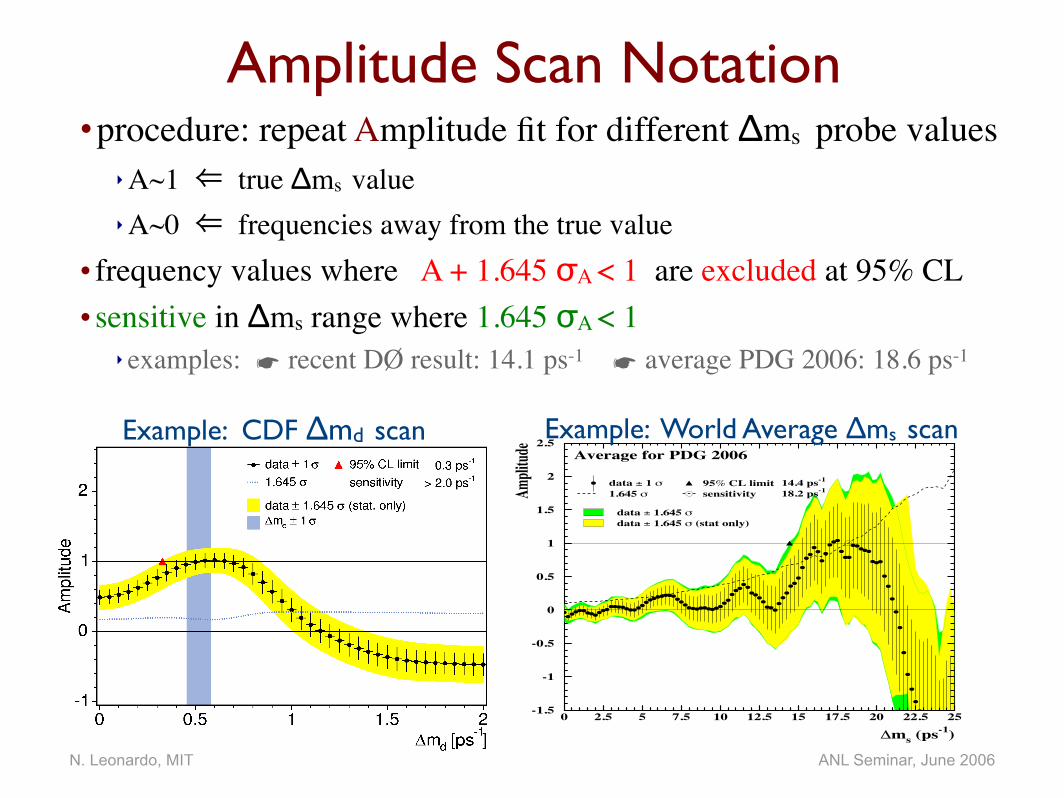
Amplitude Scan Notation•procedure: repeat Amplitude fit for different Δms probe values
‣A~1 ⇐ true Δms value‣A~0 ⇐ frequencies away from the true value
• frequency values where A + 1.645 σA < 1 are excluded at 95% CL• sensitive in Δms range where 1.645 σA < 1
‣ examples: ☛ recent DØ result: 14.1 ps-1 ☛ average PDG 2006: 18.6 ps-1
-1.5
-1
-0.5
0
0.5
1
1.5
2
2.5
0 2.5 5 7.5 10 12.5 15 17.5 20 22.5 25
!ms (ps-1)
Ampli
tude
data ± 1 " 95% CL limit 14.4 ps-1
1.645 " sensitivity 18.2 ps-1
data ± 1.645 "data ± 1.645 " (stat only)
Average for PDG 2006Example: World Average Δms scanExample: CDF Δmd scan

The Δms Results

N. Leonardo, MIT ANL Seminar, June 2006
]-1 [pssm!0 10 20 30
Ampl
itude
-2
0
2
" 1 ± data " 1.645
" 1.645 ± data (stat. only)" 1.645 ± data
95% CL limitsensitivity
-116.7 ps-125.4 ps
-# +# +# _ s D$ 0
s, B+# _ s D$ 0
sB
CDF Run II Preliminary -1L = 1.0 fb
Amplitude Scan: Hadronic Decays
N. Leonardo, MIT ANL Seminar, June 2006
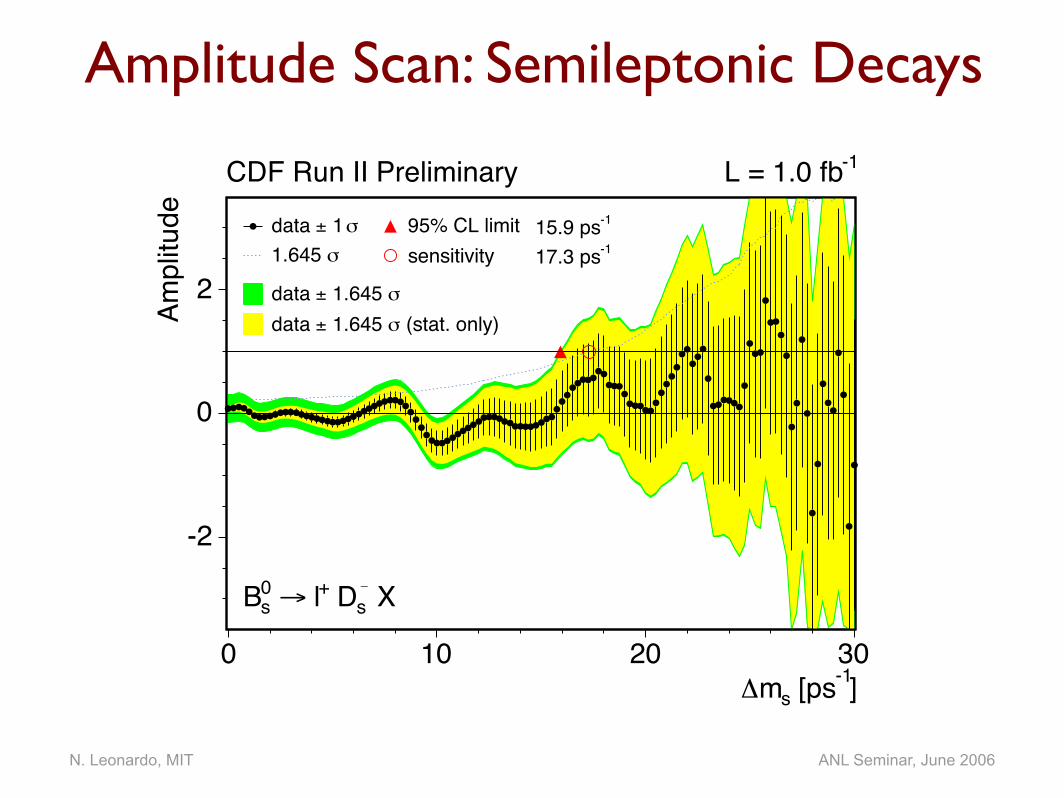
]-1 [pssm!0 10 20 30
Ampl
itude
-2
0
2
" 1 ± data " 1.645
" 1.645 ± data (stat. only)" 1.645 ± data
95% CL limitsensitivity
-115.9 ps-117.3 ps
X_ s D+ l# 0
sB
CDF Run II Preliminary -1L = 1.0 fb
Amplitude Scan: Semileptonic Decays
N. Leonardo, MIT ANL Seminar, June 2006
]-1 [pssm!0 10 20 30
Ampl
itude
-2
0
2
" 1 ± data " 1.645
" 1.645 ± data (stat. only)" 1.645 ± data
95% CL limitsensitivity
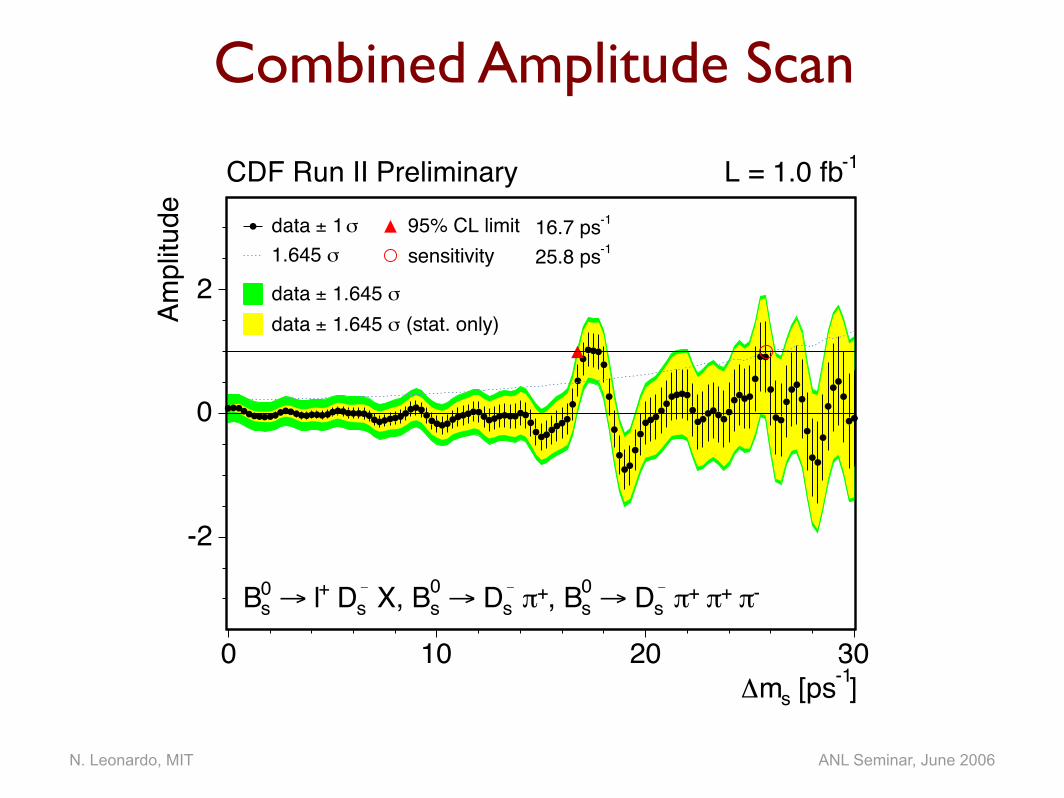
-116.7 ps-125.8 ps
-# +# +# _ s D$ 0
s, B+# _ s D$ 0
s X, B_ s D+ l$ 0
sB
CDF Run II Preliminary -1L = 1.0 fb
Combined Amplitude Scan

N. Leonardo, MIT ANL Seminar, June 2006
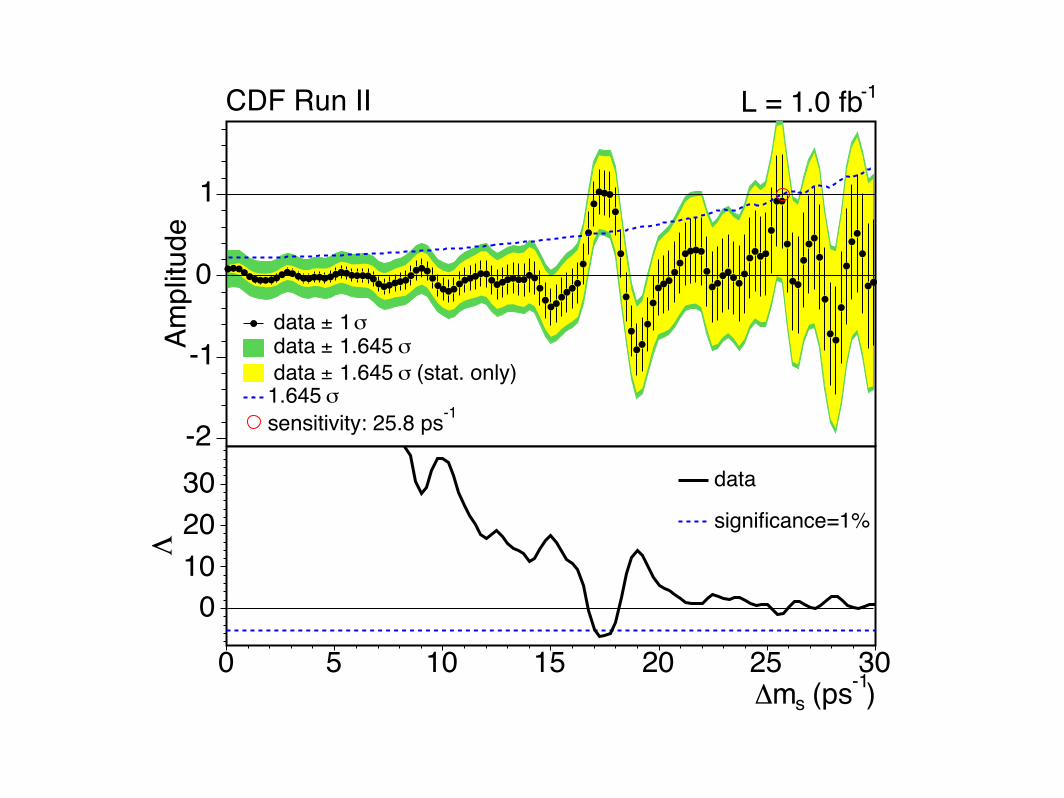
Results: Amplitude Scan
]-1 [pssm!0 10 20 30
Ampl
itude
-2
-1
0
1
2" 1 ± data
-# +# +# _ s D$ 0
s, B+# _ s D$ 0
s X, B_ s D+ l$ 0
sB
CDF Run II Preliminary -1L = 1.0 fb
A/σA=3.7
[1 fb-1]Sensitivity 25.8 ps-1
N. Leonardo, MIT ANL Seminar, June 2006
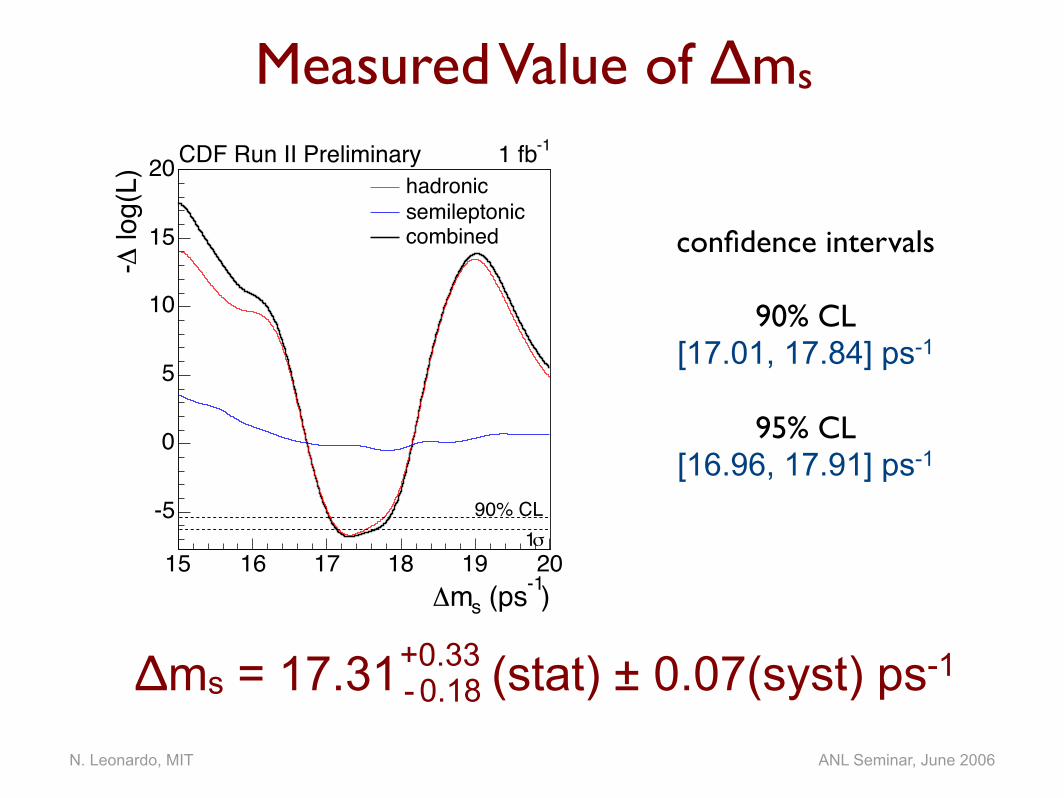
Measured Value of Δms
)-1 (pssm!15 16 17 18 19 20
log(
L)!-
-5
0
5
10
15
20hadronicsemileptoniccombined
CDF Run II Preliminary -11 fb
"190% CL
confidence intervals
90% CL[17.01, 17.84] ps-1
95% CL[16.96, 17.91] ps-1
Δms = 17.31 (stat) ± 0.07(syst) ps-1- 0.18+0.33
N. Leonardo, MIT ANL Seminar, June 2006
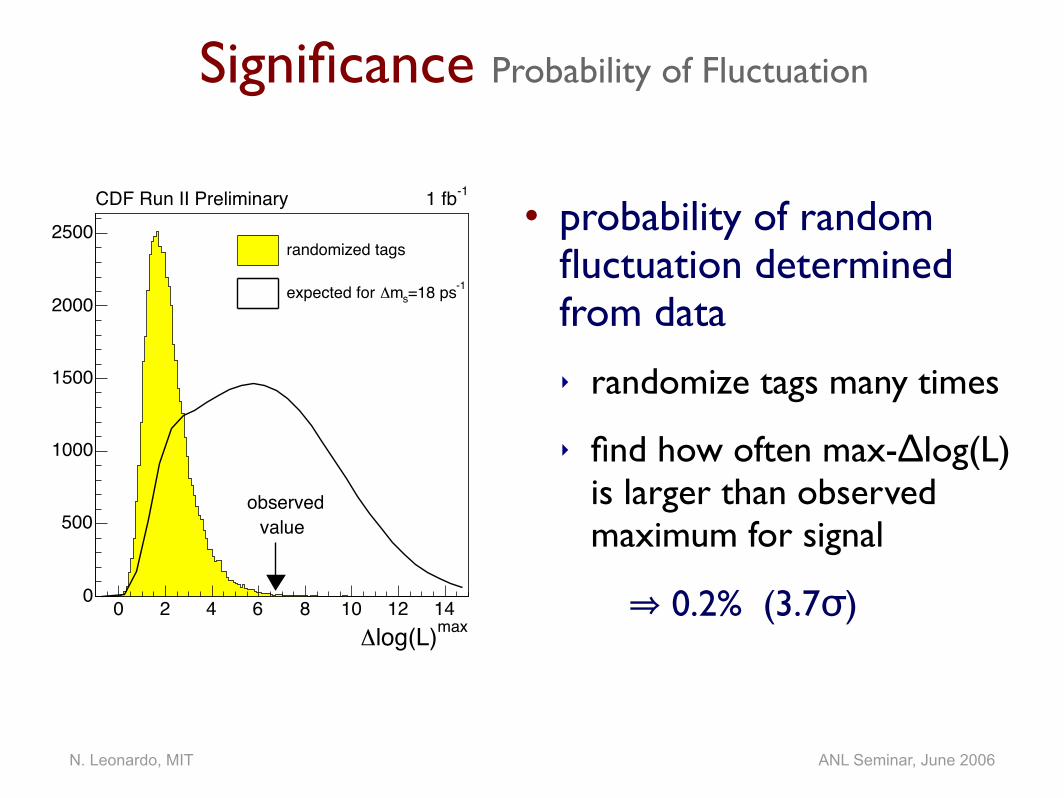
maxlog(L)!0 2 4 6 8 10 12 140
500
1000
1500
2000
2500
observedvalue
CDF Run II Preliminary -11 fb
randomized tags
-1=18 pssm!expected for
Significance Probability of Fluctuation
• probability of random fluctuation determined from data
‣ randomize tags many times
‣ find how often max-Δlog(L) is larger than observed maximum for signal
⇒ 0.2% (3.7σ)
Impact on CKMmatrix elements determination
N. Leonardo, MIT ANL Seminar, June 2006
!
0 0.5 1
"
0
0.5
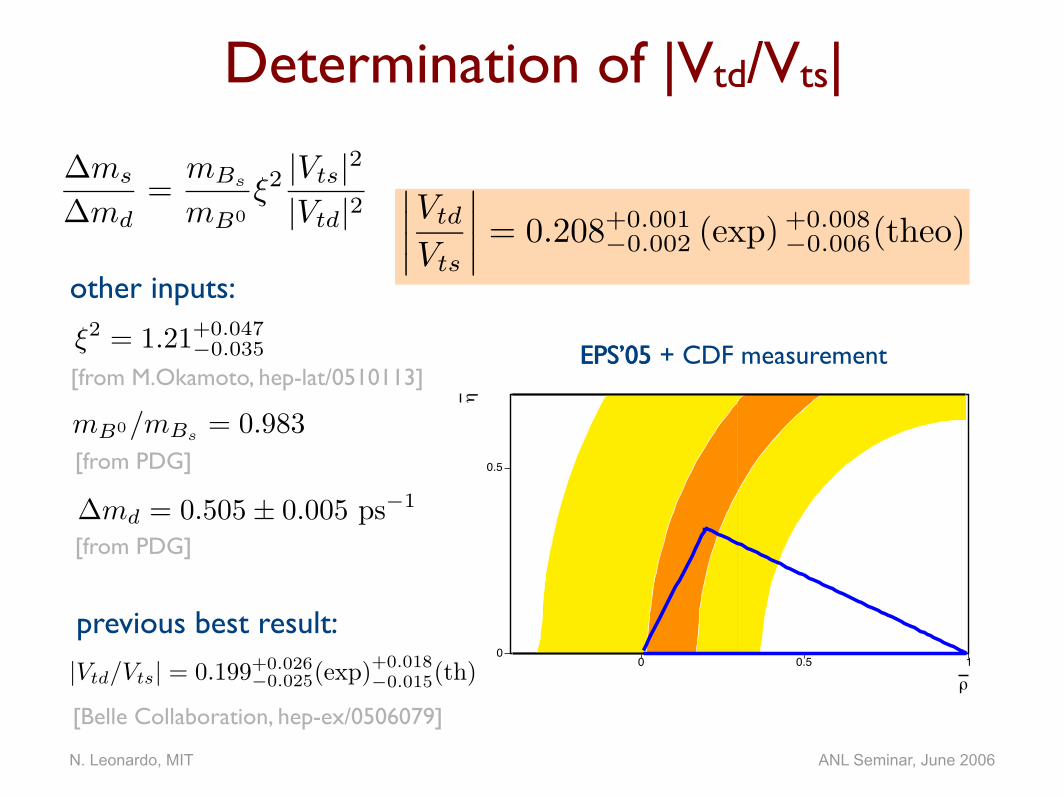
EPS’05EPS’05 + CDF measurement
!
0 0.5 1
"
0
0.5
Determination of |Vtd/Vts|
∆ms
∆md
=mBs
mB0
ξ2|Vts|2
|Vtd|2
∆md = 0.505 ± 0.005 ps−1
mB0/mBs= 0.983
ξ2= 1.21
+0.047−0.035
∣∣∣∣
Vtd
Vts
∣∣∣∣ = 0.208+0.001
−0.002 (exp) +0.008−0.006(theo)
[from M.Okamoto, hep-lat/0510113]
[from PDG]
[from PDG]
other inputs:
previous best result:
[Belle Collaboration, hep-ex/0506079]
|Vtd/Vts| = 0.199+0.026−0.025(exp)+0.018
−0.015(th)

N. Leonardo, MIT ANL Seminar, June 2006
CKM Fit, without CDF measurement
!-1 -0.5 0 0.5 1
"-1
-0.5
0
0.5
1#
$
%
dm&
K'
cbVubV
!-1 -0.5 0 0.5 1
"-1
-0.5
0
0.5
1
UT Fit, without Δms constraint
beforeafter
!-1 -0.5 0 0.5 1
"-1
-0.5
0
0.5
1#
$
%
sm&dm& dm&
K'
cbVubV
!-1 -0.5 0 0.5 1
"-1
-0.5
0
0.5
1
UT Fit, with CDF measurement
-1.5
-1
-0.5
0
0.5
1
1.5
-1 -0.5 0 0.5 1 1.5 2
sin 2!
sol. w/ cos 2! < 0(excl. at CL > 0.95)
excluded at CL > 0.95
"
"
#
#
$md
$ms & $md% = 1.21 +0.047
– 0.035 (hep-lat/0510113)
&K
&K
|Vub/Vcb|
sin 2!
sol. w/ cos 2! < 0(excl. at CL > 0.95)
excluded at CL > 0.95
#
!"
'
(
excluded area has CL > 0.95
C K Mf i t t e r
EPS05+CDF
CKM Fit, with CDF measurement
Impact on Unitarity Triangle Fit

N. Leonardo, MIT ANL Seminar, June 2006
Measurement vs SM Expectation
]-1[pss m!0 10 20 30 40
Prob
abili
ty d
ensi
ty
0
0.0005
0.001
0.0015
]-1[pss m!0 10 20 30 40
Prob
abili
ty d
ensi
ty
0
0.0005
0.001
0.0015
]-1[pss m!0 10 20 30 40
Prob
abili
ty d
ensi
ty
0
0.0005
0.001
0.0015
CKM/UT Fit (SM) without Δms constraint&
CDF Δms Measurement
0
0.2
0.4
0.6
0.8
1
1.2
12.5 15 17.5 20 22.5 25 27.5 30 32.5 35
CKM fit w/o !msCDF measurement
!ms
1 –
CL
CK Mf i t t e r
FPCP 06
N. Leonardo, MIT ANL Seminar, June 2006
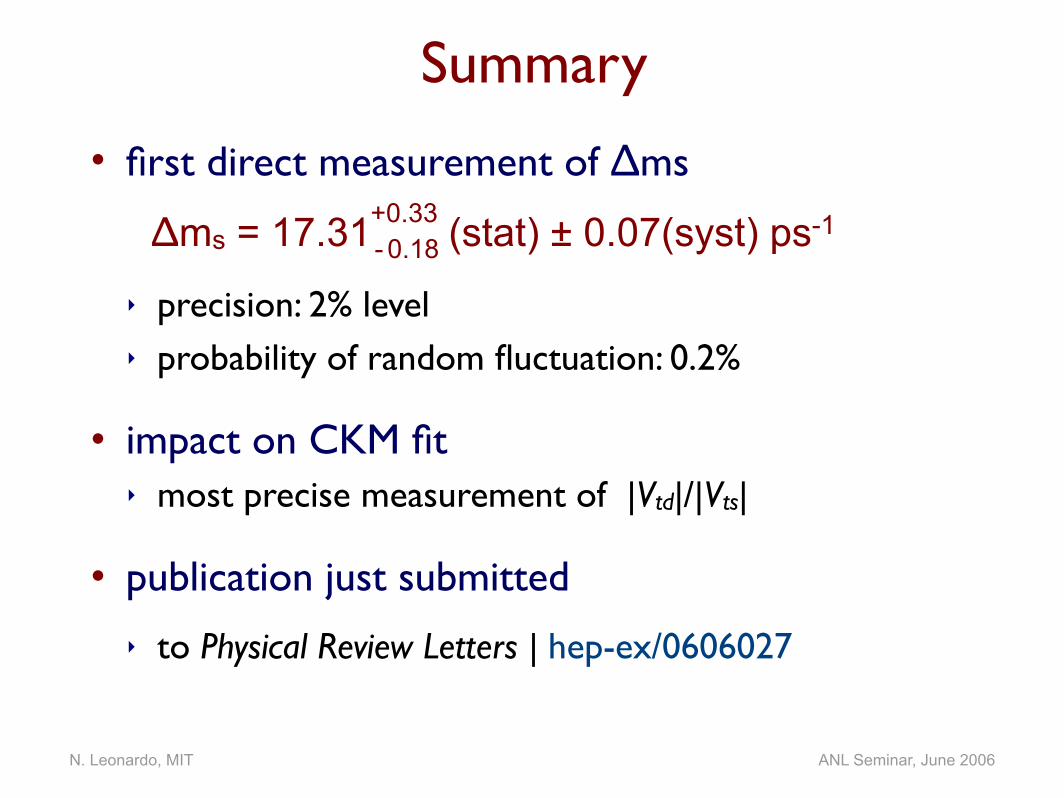
Summary
• first direct measurement of Δms
‣ precision: 2% level‣ probability of random fluctuation: 0.2%
• impact on CKM fit‣ most precise measurement of |Vtd|/|Vts|
• publication just submitted
‣ to Physical Review Letters | hep-ex/0606027
Δms = 17.31 (stat) ± 0.07(syst) ps-1- 0.18+0.33

]-1 [pssm!0 10 20 30
Ampl
itude
-2
-1
0
1
2" 1 ± data
-# +# +# _ s D$ 0
s, B+# _ s D$ 0
s X, B_ s D+ l$ 0
sB
CDF Run II Preliminary -1L = 1.0 fb
Ampl
itude
-2
-1
0
1
! 1 ± data ! 1.645 ± data
(stat. only)! 1.645 ± data !1.645
-1sensitivity: 25.8 ps
CDF Run II -1L = 1.0 fb
)-1 (pssm"0 5 10 15 20 25 30
#
0102030 data
significance=1%

Additional Slides for Reference
N. Leonardo, MIT ANL Seminar, June 2006
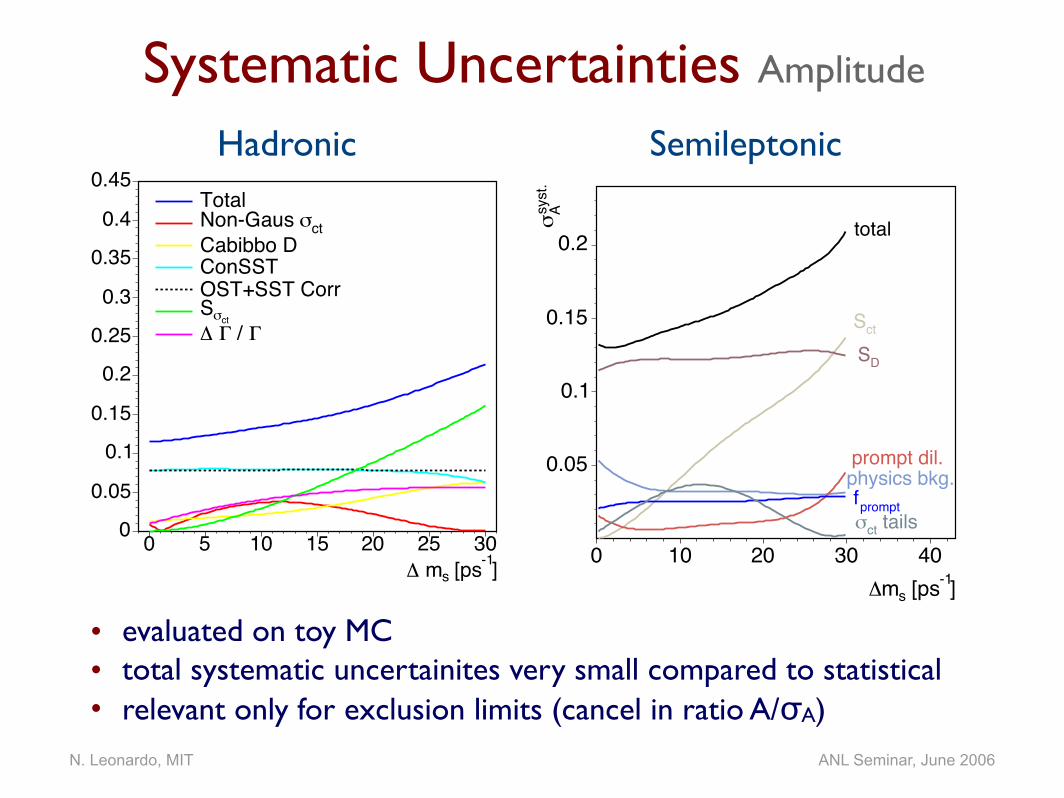
Systematic Uncertainties Amplitude
• evaluated on toy MC• total systematic uncertainites very small compared to statistical• relevant only for exclusion limits (cancel in ratio A/σA)
]-1 [pss m!0 5 10 15 20 25 300
0.05
0.1
0.15
0.2
0.25
0.3
0.35
0.4
0.45Total
ct"Non-Gaus Cabibbo DConSSTOST+SST Corr
ct"S# / # !
]-1 [pssm!0 10 20 30 40
syst
.A
"
0.05
0.1
0.15
0.2
physics bkg.
ctS
DS
prompt dil.
promptf tailsct"
total
Hadronic Semileptonic
N. Leonardo, MIT ANL Seminar, June 2006
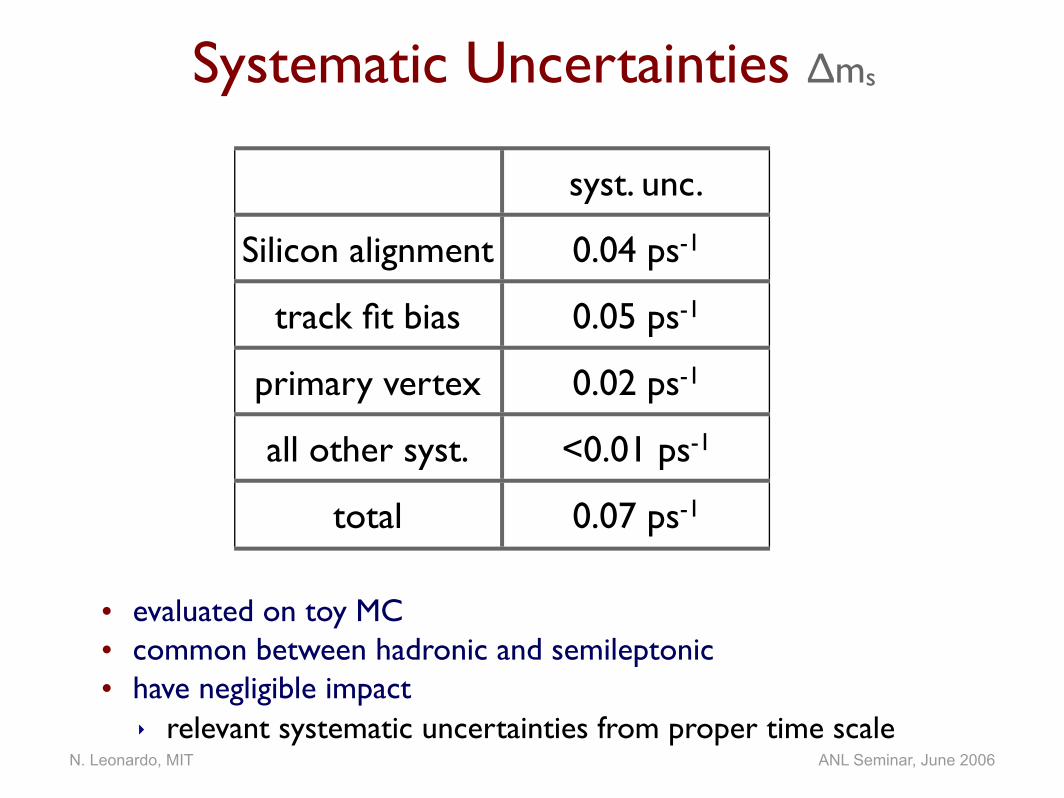
Systematic Uncertainties Δms
• evaluated on toy MC• common between hadronic and semileptonic• have negligible impact
‣ relevant systematic uncertainties from proper time scale
syst. unc.
Silicon alignment 0.04 ps-1
track fit bias 0.05 ps-1
primary vertex 0.02 ps-1
all other syst. <0.01 ps-1
total 0.07 ps-1
N. Leonardo, MIT ANL Seminar, June 2006
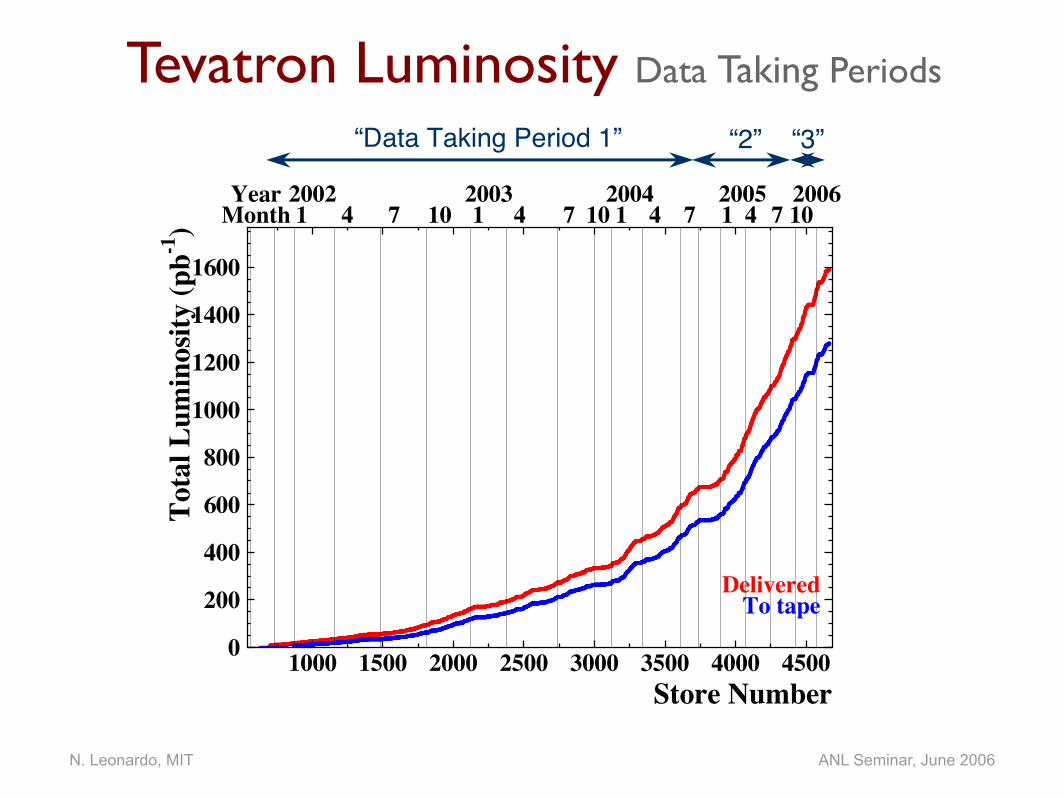
Tevatron Luminosity Data Taking Periods
Store Number
Tot
al L
umin
osity
(pb-1
)
0
200
400
600
800
1000
1200
1400
1600
1000 1500 2000 2500 3000 3500 4000 4500
1 4 7 10 1 4 7 10 1 4 7 1 4 7 102002 2003 2004 2005 2006Year
Month
DeliveredTo tape
“Data Taking Period 1” “2” “3”
N. Leonardo, MIT ANL Seminar, June 2006
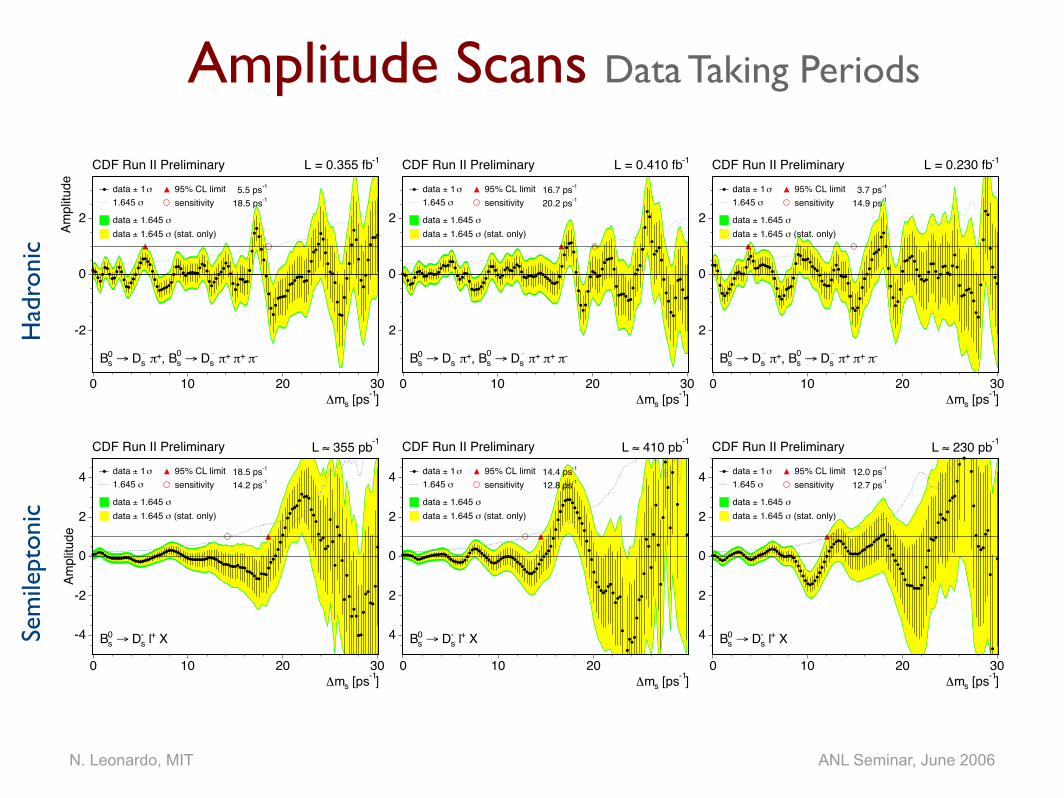
Amplitude Scans Data Taking Periods
]-1 [pssm!0 10 20 30
Ampl
itude
-2
0
2
" 1 ± data " 1.645
" 1.645 ± data (stat. only)" 1.645 ± data
95% CL limitsensitivity
-13.7 ps-114.9 ps
-# +# +# _ s D$ 0
s, B+# _ s D$ 0
sB
CDF Run II Preliminary -1L = 0.230 fb
]-1 [pssm!0 10 20 30
Ampl
itude
-2
0
2
" 1 ± data " 1.645
" 1.645 ± data (stat. only)" 1.645 ± data
95% CL limitsensitivity
-116.7 ps-120.2 ps
-# +# +# _ s D$ 0
s, B+# _ s D$ 0
sB
CDF Run II Preliminary -1L = 0.410 fb
]-1 [pssm!0 10 20 30
Ampl
itude
-2
0
2
" 1 ± data " 1.645
" 1.645 ± data (stat. only)" 1.645 ± data
95% CL limitsensitivity
-15.5 ps-118.5 ps
-# +# +# _ s D$ 0
s, B+# _ s D$ 0
sB
CDF Run II Preliminary -1L = 0.355 fb
Had
roni
c
]-1 [pssm!0 10 20 30
Ampl
itude
-4
-2
0
2
4 " 1 ± data " 1.645
" 1.645 ± data (stat. only)" 1.645 ± data
95% CL limitsensitivity
-112.0 ps-112.7 ps
-1 230 pb#L CDF Run II Preliminary
X+ l-s D$ 0
sB
]-1 [pssm!0 10 20
Ampl
itude
-4
-2
0
2
4 " 1 ± data " 1.645
" 1.645 ± data (stat. only)" 1.645 ± data
95% CL limitsensitivity
-114.4 ps-112.8 ps
-1 410 pb#L CDF Run II Preliminary
X+ l-s D$ 0
sB
]-1 [pssm!0 10 20 30
Ampl
itude
-4
-2
0
2
4 " 1 ± data " 1.645
" 1.645 ± data (stat. only)" 1.645 ± data
95% CL limitsensitivity
-118.5 ps-114.2 ps
-1 355 pb#L CDF Run II Preliminary
X+ l-s D$ 0
sBSem
ilept
onic
N. Leonardo, MIT ANL Seminar, June 2006
log(LH(PID))-20 -10 0 10 20
entri
es p
er b
in0
50
100
150 Pythia Data
log(LH(PID))-20 -10 0 10 20
entri
es p
er b
in0
50
100
150
CDF Run II Preliminary -1 355 pb!L
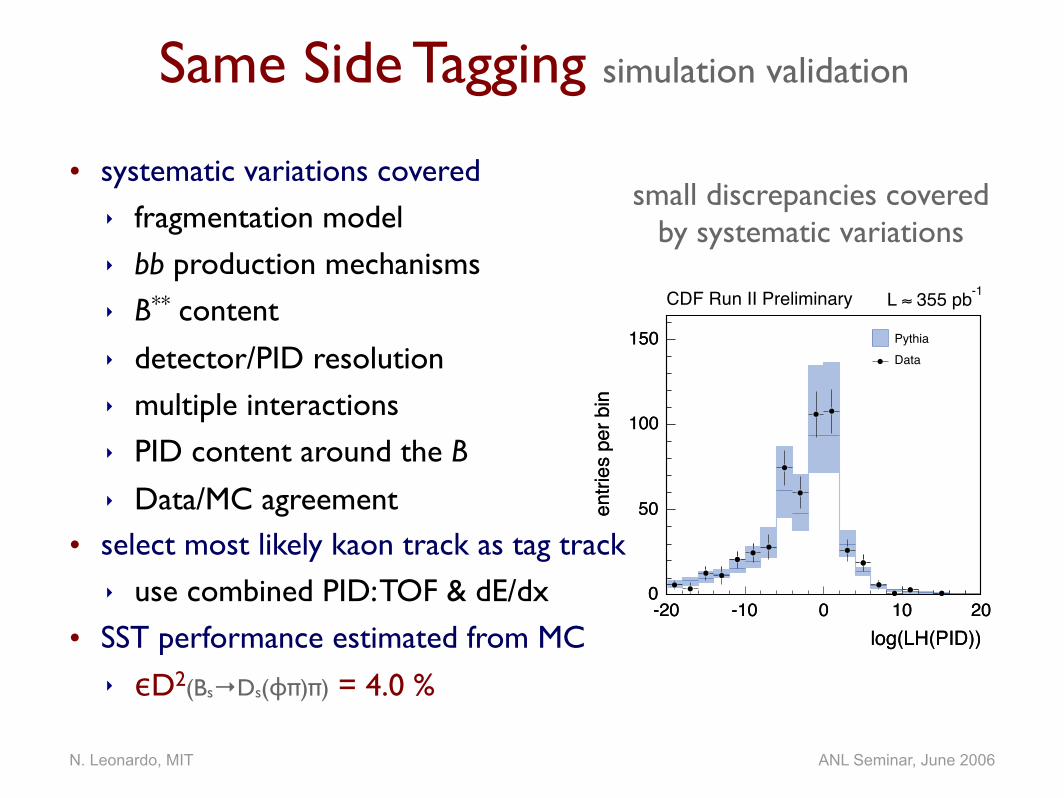
Same Side Tagging simulation validation
• systematic variations covered‣ fragmentation model‣ bb production mechanisms‣ B** content‣ detector/PID resolution‣ multiple interactions‣ PID content around the B‣ Data/MC agreement
• select most likely kaon track as tag track‣ use combined PID: TOF & dE/dx
• SST performance estimated from MC‣ εD2(Bs→Ds(ϕπ)π) = 4.0 %
small discrepancies covered by systematic variations
N. Leonardo, MIT ANL Seminar, June 2006
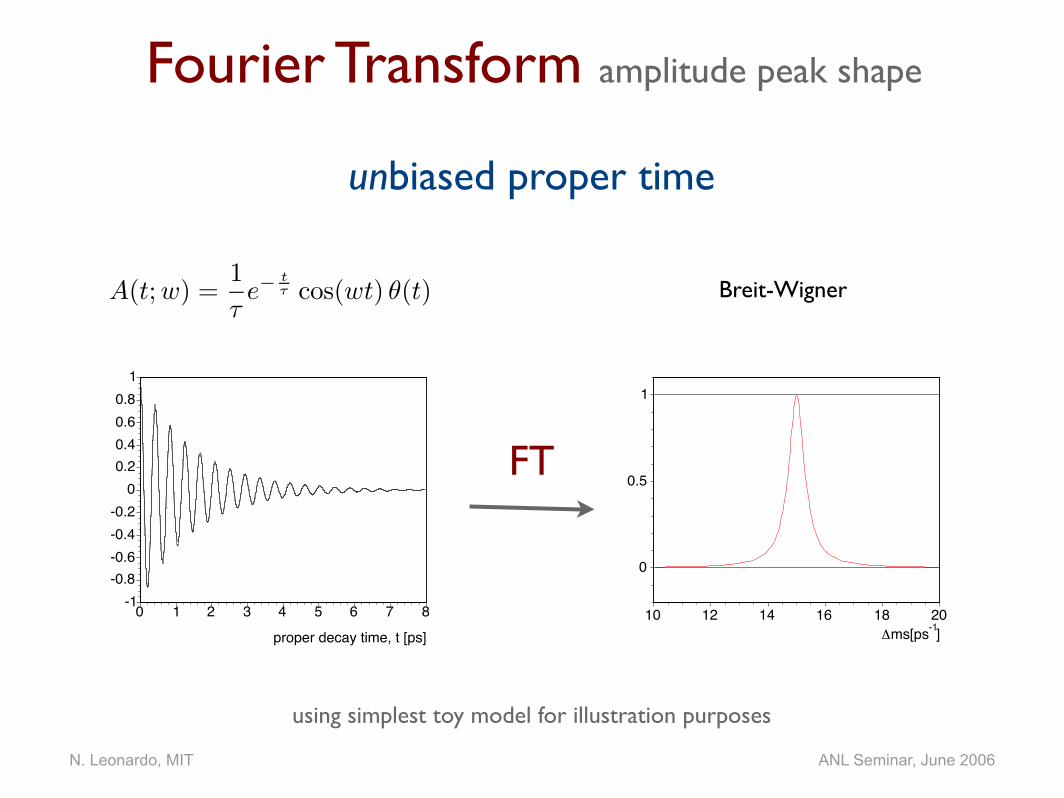
Fourier Transform amplitude peak shape
proper decay time, t [ps]0 1 2 3 4 5 6 7 8-1
-0.8-0.6-0.4-0.2
00.20.40.60.8
1
]-1ms[ps!10 12 14 16 18 20
0
0.5
1
unbiased proper time
using simplest toy model for illustration purposes
FT
Breit-WignerA(t;w) =1
τe−
t
τ cos(wt) θ(t)
N. Leonardo, MIT ANL Seminar, June 2006
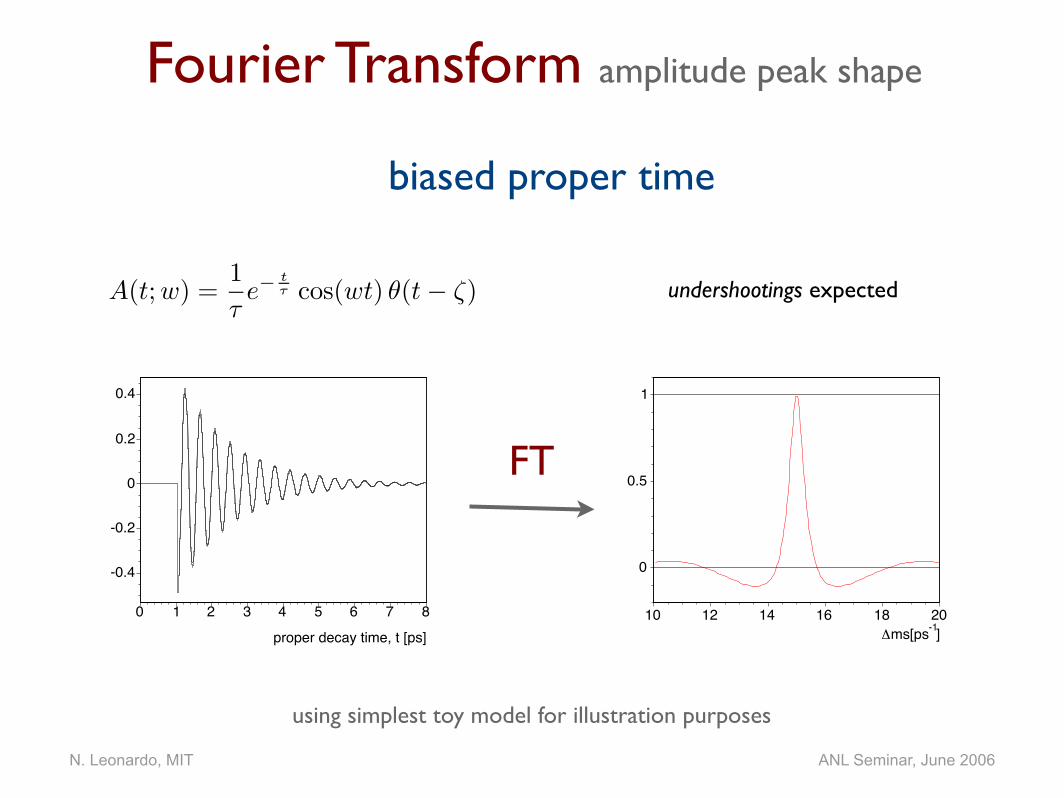
A(t;w) =1
τe−
t
τ cos(wt) θ(t − ζ)
]-1ms[ps!10 12 14 16 18 20
0
0.5
1
proper decay time, t [ps]0 1 2 3 4 5 6 7 8
-0.4
-0.2
0
0.2
0.4
Fourier Transform amplitude peak shape
using simplest toy model for illustration purposes
FT
undershootings expected
unbiased proper time