Embed Size (px)
Citation preview

Measurement of Sediment Release from a Grab Dredge in the River Tees, UK, for the Calibration of Turbidity Prediction Software
Neville Burt1, John Land2 and Hans Otten 3
ABSTRACT
The Dutch Dredging Industry and the Rijkswaterstaat have been engaged in a long term research programme aimed developing reliable, field-calibrated Turbidity Assessment Software (TASS) that can be used to predict rates of sediment release from grab, bucket chain, backhoe, cutter suction and trailing suction hopper dredges. The initial software was produced in Phase 1 of the work, based on reasonably well established concepts and formulations. One of several aims of Phase 2 was to develop and test field measurement protocols that could be used to collect the detailed observational data needed to calibrate the software. The first field test of the protocols was undertaken in the River Tees in May 2000. Measurements were made of the rate of sediment release from the Seal Sands, a small self-propelled grab hopper dredger owned and operated by the Tees and Hartlepool Port Authority Ltd (THPAL). The site was located at the side of the main shipping channel where an accumulation of mud needed to be removed. The measurements were undertaken in several series each of which lasted typically one to two hours and were intended to represent periods during which hydrodynamic conditions and the dredging operation were reasonably consistent. Unfortunately, the thickness of mud was limited and the grab was often filled with a mixture of soft mud and the underlying stiff clay in varying proportions that were impossible to determine. In addition, the site was located on the channel slope with varying water depths and was constrained on one side by a training wall which occasionally prevented the survey boat passing through the plume into clear water. It was also the case that the dredger was not fitted with modern instrumentation that enabled the position of each grab cycle to be recorded. Thus, in several respects, both the dredger and the site were less than ideal for undertaking calibration measurements. However, these deficiencies were not considered to be ‘fatal’ to the trial as the primary objective was to test the efficacy of the protocol. The difficulties that arose from working in a less than ideal site simply served to demonstrate the need for the protocol. Despite the problems, valuable data were obtained and the ‘characteristic’ rate of sediment release that was measured is believed to be reasonably reliable. This paper describes the measurements and reviews the results in the context of other measurements of sediment release from grab dredges.
INTRODUCTION Sediment release from dredging operations, and the potential adverse impacts arising from excessive release, have long been a cause for concern amongst regulatory agencies. In the absence of a detailed understanding of the real impacts of turbidity and suspended solids concentration on the marine environment (John et al, 2000; Burt and Hayes, 2004) there is a tendency in some dredging contracts to impose somewhat arbitrary and unrealistically low limits on suspended sediment concentrations close to the working dredgers. The Dutch Dredging Industry together with the Rijkswaterstaat has been engaged in a long term research programme aimed at determining how much sediment is released during dredging operations. In 1998, VBKO (Vereniging van Waterbouwers in Bagger- kust en Oeverwerken) of the Netherlands commissioned HR Wallingford Ltd and Dredging Research Ltd of the UK to develop models to predict the rate of release of sediment from grab, bucket chain, backhoe, cutter suction and trailing suction hopper dredges. The objective is to develop software (Turbidity Assessment Software - TASS) capable of predicting with confidence the sediment release rate for dredgers working in various soils and hydrodynamic conditions. The software and its components have been described by Burt et al, 2000.
1 HR Wallingford Ltd, Howbery Park, Wallingford, Oxon, OX10 8BA, UK 2 Dredging Research Ltd, 3 Godalming Business Centre, Godalming, Surrey GU7 1XW, UK 3 Rijkswaterstaat, North Sea Directorate, Lange Kleiweg 34, 2288GK Rijswijk ZH, The Netherlands
1173

A preliminary version of the software was developed during Phase 1 of the study, based on reasonably well established concepts and formulations. In Phase 2 the aim was to obtain field measurements to verify, and where appropriate to improve the models through improved understanding of the physical processes and the establishment of meaningful empirical coefficients. It was realised at an early stage that existing data on sediment release from dredging equipment was inadequately documented and often insufficient to be useful for calibration, so a major effort was put into developing a protocol for obtaining measurements that would be useful for this purpose. The draft protocol was widely circulated for review, resulting in an improved version that is now available for general use (HR Wallingford/Dredging Research Ltd, 2003). A summary version is also available on the US Army Corps of Engineers Web Site (http://el.erdc.usace.army.mil/dots/accord/index.html.) under an international agreement known as ACCORD (Advice and Consultation Committee on Resuspension by Dredging). The Protocol is seen as a living document that is to be continually updated as new experience is gained. The first field trial using the Protocol for the measurement of sediment losses from grab (US = bucket or clamshell) dredgers was held on the River Tees in May 2000 with the assistance of the Tees and Hartlepool Port Authority Ltd (THPAL). A summary account of the trial, and of a later trial of the procedures for measuring sediment release from trailing suction hopper dredgers, was presented at WODCON XVII (Land et al, 2004).
THE MEASUREMENT PROTOCOL The Protocol is a substantial document that describes a wide range of measurement techniques designed to obtain data from different types of dredger and it is not possible to describe these in full here. However, copies of the Protocol can be obtained from the authors. The description given here is restricted to a summary of the general principles of measurement embodied in the Protocol.
An important part of the Protocol is the definition of sediment release. Figure 1 is a schematic illustration of sediment plume development, identifying a dredging zone in the immediate vicinity of the dredger where measurement is not possible (for reasons of safety and practicality), a near-field zone where the plume is initially dynamic and becomes progressively less so over time, and a far-field zone in which the plume is essentially passive. The closest point to the dredger at which measurements of sediment flux, away from the dredger, can be made has been defined as the practical source. If several measurements of sediment flux are made at locations further away from the dredger, a curve can be defined that, when extrapolated back to the location of the dredger, can be used to estimate a virtual release rate. This virtual release rate is the sediment release rate that is input to numerical models of dynamic and passive plume development.
Dredging Zone Near-field Plume Far-field Plume
Mass of sediment in suspension
Turbulence due to dredging equipment
'Fall-out' of large lumps
Initially dynamic, tending to passive with time
Progressive settling of coarse particles
Essentially passive plume
Fine sediment remains in suspensionuntil quiescent water is encountered
Seconds Minutes Hours
True source
Practical source
Virtual release
Practical range offield measurement
Figure 1. Stages and processes of plume development.
1174

With the exception of sediment release from the overflow of trailing suction hopper dredgers, which can be measured directly in the overflow, the adoption of this definition leads to a requirement for measurements of sediment flux in flowing water at several distances down-current of the working dredger. Knowledge of the age of the plume at the point of measurement is a critical component of the measurement procedure. The measurements necessarily require detailed ‘mapping’ of both currents and solids concentrations over the full cross-sectional area of the plume as it moves away from the dredger. The project team realised at an early stage that only two methods would be likely to provide the required data:
1) simultaneous acoustic measurement of sediment concentration and water current using acoustic Doppler current profilers (ADCPs) (eg. Land & Bray, 1998)
2) measurement of sediment concentration using rapid- profiling turbidity meters in combination current data obtained with ADCPs.
There are three basic principles embodied in the measurement protocol:
1) measure as much as possible as close as possible to the ‘Practical Source’ and at varying distances from it; 2) measurements must be supported by full details of the dredging operation, and the site and soil conditions; 3) measurements will be more reliable if made at open, unobstructed locations with uniform soil conditions
and low background sediment concentrations. The first requirement follows from the definition illustrated in Figure 1. The second requirement was identified when the research team examined earlier reports on sediment release measurements. In many cases, these provided so little data about the dredger, its method of operation, soil conditions and the nature of the measurement site that the measurement results were rendered almost worthless. The third requirement makes measurements relatively easy to undertake and interpret.
THE MEASUREMENTS The Dredger and the Site
The dredger was the Seal Sands (Figure 2), a self-propelled grab hopper dredger with a hopper capacity of 500m3 and equipped with an open 3m3 mud grab. She is 48m long with a breadth of 12.35m and a loaded draft of 4.25m.
Figure 2. The self-propelled grab hopper dredge Seal Sands. The measurements were undertaken over a period of three days during a spring tide during which the tidal range varied between 4.4m and 5.0m. The water depth in the maintained channel adjacent to the test site varied between 11.3m and 6.1m during the trial period. As the site was on the edge of the maintained channel the maximum and minimum depths where dredging took place were generally less than these values.
1175

The tidal currents were not greatly affected by fresh water flow, except that, due to density stratification at certain stages of the tide, there was a reversal of flow direction between the surface and the bed. This was particularly noticeable during the early stages of the flood tide when near-bed water began to flow upriver whilst the surface fresh water continued to flow in the ebb direction. Typical current speeds during the observations were in the range 0.1 - 0.3 m/s. The soil
Small bed samples were taken using a hand-held 1 litre Van Veen grab deployed by hand from the Seal Sands. In addition two bulk samples were taken. These were obtained by securing a 50 litre barrel on the deck of the Seal Sands and opening the grab directly over the barrel. Eight samples were analysed to establish their particle size distribution. The results of the analyses are presented in Figure 3.
Particle size (mm)
% p
assi
ng
100
80
60
40
20
00.001 0.01 0.1 1.0 10.0 100.0
Figure 3. Particle size distributions of eight samples obtained during the trial. The same samples were also tested to determine bulk density, specific gravity, water content, Atterberg limits and loss on ignition (organic content). Six samples were subjected to hand vane tests (on board the Seal Sands immediately after recovery) to determine their shear strength. The test results are presented in Table 1. In addition to the tests shown in Table 1, sample SS1 was vane tested and yielded a shear strength of 2 kPa.
Table 1. Summary of geotechnical tests on soil samples.
Sample Sample Sample Sample Sample Sample Sample Sample Parameter SS 2 SS 3 SS 4 SS 5 SS 6 SS 7 SS 9 SS 11 Visual description (see below) BC BC BC DC DC BOC BOC BMC Hand vane shear strength, kPa 3 1 1 1 1.5 Bulk density (g/cm3) 2.10 1.38 1.67 1.42 1.49 1.42 1.38 1.80 Specific gravity (g/cm3) 2.29 2.48 2.47 2.10 2.25 2.30 2.24 2.46 d10 (µm) 1.4 2.1 1.8 1.8 1.9 1.8 1.7 1.6 d50 (µm) 26 16 32 10 10 10 10 22 d90 (µm) 1050 200 1600 125 125 125 125 2900 %Moisture 20.69 73.12 49.67 96.35 102.89 107.78 119.78 41.11 % Loss on ignition 8.74 13.22 9.15 13.57 14.67 15.14 13.87 8.64 Plastic Limit (PL) 19 26 20 27 29 41 19 20 Liquid Limit (LL) 37 68 40 75 82 81 78 36 Plasticity Index (PI) 18 42 20 48 53 40 59 16 Water content % 21 88 53 120 117 108 137 24 BC: Brown CLAY DC: Dark grey organic CLAY BOC: Brown organic CLAY BMC: Brown mottled grey CLAY
1176

The Dredger Operation
Each grab cycle was timed by an on-board observer. The example record shown in Figure 4 covers a period of 45 minutes and shows the overall time for each cycle, a detailed breakdown of every fifth cycle and a subjective estimate of the amount of leakage from each grab. Note the frequency with which ‘substantial’ grab leakage was observed which, in some cases, amounted to almost all of the grab contents and was caused by non-closure due to debris.
Slewing In water Lowering Grabbing Raising
12:55 13:01 13:07 13:19 13:25 13:31 13:3713:13
80
60
40
20
0
Time (4th May 2000)
Cyc
le ti
me,
sec
onds
Operator changeand sampling
Substantial grab leakageSignificant grab leakageMinor/no grab leakage
Cleaning deck
100
80
60
40
20
0
% o
f tot
al c
ycle
tim
e
Figure 4. Example record of dredging activity during the Tees trial. Plume Monitoring
Measurements of current and solids concentrations in the plumes were undertaken from THPAL’s 46-metre buoy tender Wilton. Although unusually large for survey work, the Wilton has the advantage that it is equipped with three 360o-azimuthing propellers, two aft and one forward, which enable it to move very slowly sideways (typically 0.1 m/sec) across the plume with the bow pointing into the current. This very slow traversing speed was essential in order to obtain as many turbidity meter profiles as possible in the narrow sediment plume. The plumes were monitored using an ADCP and a profiling turbidity meter (Rapid Drop Profiler – RDP). The ADCP was a 600 kHz instrument manufactured by RDI (now Teledyne RDI). It was mounted over the middle of the square bow of the Wilton with the transducers at a depth of 0.48m. The ADCP was operated using Transect software from a small cabin located on the deck of the Wilton. The RDP was mounted over the port side of the bow, about 4 metres away from the ADCP, and was raised and lowered manually at a speed of about 1 m/sec as the Wilton passed slowly backwards and forwards across the sediment plume at varying distances down-current of the Seal Sands. The RDP data were recorded on a laptop computer located in the deck cabin. The RDP was fitted with three water samplers to obtain samples for calibration of the ADCP and the turbidity meter. Sensors were also fitted to obtain the temperature and salinity profile data that are required for processing of the ADCP acoustic backscatter data. When a water sample was needed, the RDP was paused at the required depth and the water sampler was triggered electrically. The times when the sampler was at the surface and on the bed were ‘tagged’ to the ADCP data so that the track of the RDP could later be fitted to the processed ADCP data.
1177

Due to a combination of time restrictions, various delays and the very slow traversing speed demanded by the need to obtain numerous RDP profiles, only 23 plume transects were obtained, two of which had to be discarded due to equipment problems. The transects were made in plumes that were estimated to be between 110 and 450 seconds old. The Air Bubble Experiment
During initial data processing, it was suspected that some of the ADCP data had been corrupted by air bubbles created during dredging. This suspicion was prompted by unexpectedly high apparent solids concentrations in the near-surface part of the water column, sometimes extending well beyond the main body of the plume below the surface. The main potential causes of contamination in this case were:
• biogenic gas released during and after excavation; • air bubbles created by the grab as it descended through the water column; • bubbles formed by water flow around the hull of the dredger.
Biogenic gas release from the recently-dredged river bed may have occurred but it is thought unlikely. This is because they would be expected to have been visible, on occasions, in the ADCP records in areas separated from the main body of the plume cause by the Seal Sands. No such instances are apparent in the data. Field experiments were conducted after the main measurements in order to investigate the possibility that bubbles may have formed either by the grab or by the flow of water around the hull of the Seal Sands. The Seal Sands was anchored in the dredging area and ‘rested’, without any dredging activity, for about 15 minutes in order to permit dissipation of any sediment plumes or air bubbles plumes created during positioning. A survey boat was equipped with a 1200 kHz workhorse ADCP deployed from a simple over-the-side bracket mounting with the transducers at a depth of 1 metre. The first part of the experiment was to determine if air bubbles were being formed by the water current moving against the hull of the anchored Seal Sands. The survey boat was sailed several times across the current flow close to (ie. within about 10 metres) the Seal Sands. No increase of backscatter intensity was observed. The second part of the experiment comprised a series of transects, sailed across the current as the Seal Sands simulated dredging, but without touching the river bed. The dredger was anchored in about 9 metres of water. The crane operator was asked to simulate dredging by lowering the open bucket to just above the bed, close it, raise it to the normal slewing height above the surface and then to release the water contained in the bucket. This was done for about 40 minutes. The survey boat sailed transects at increasing distances from the dredger. After each transect, the survey boat waited for a few minutes to permit its wake to dissipate so that successive transects would not be contaminated. Air bubbles were clearly visible in the records. On completion of the experiment, each record was examined to establish the depth to which air bubble contamination extended and the maximum observed backscatter intensity above the background. The background intensity was rather constant at about 58 dB. Figure 5 shows the results of the analysis. The age of the air bubble plume has been derived by dividing the distance between the Seal Sands and each measurement transect by the depth-averaged current velocity at the time of the experiment. When the bubble plume was approximately 30 seconds old, very close to the Seal Sands, bubbles were observed to extend almost to the bed. The maximum observed backscatter intensity was about 30 dB above background in the near-surface zone and the backscatter elevation diminished rapidly with depth. With increasing plume age (= distance from the dredger) the maximum depth at which elevated backscatter was observed reduced as the bubble plume rose to the surface. The data show that after about 300 seconds, the bubbles had risen above the highest ADCP measurement bin. At the same time, the maximum backscatter elevation above background (which was always observed near the surface) reduced. The value of zero dB shown in Figure 5 is nominal because no backscatter elevation was observed during the 300-second transect.
1178

0 50 100 150 200 250 300 350
Age of bubble plume, seconds
0
1
2
3
4
5
6
7
8
9
Max
imum
obs
erve
d de
pth
of b
ubbl
es, m
10
0
20
30
40
5
15
25
35
45
Max
imum
obs
erve
d re
lativ
e ba
cksc
atte
r int
ensi
ty, d
B
Fig 5. Results of bubble experiment. The experiment clearly showed that air bubbles were formed by the descending grab but that none were generated by the flow of water along the hull of the anchored Seal Sands. The bubbles observed during the experiment caused an increase of backscatter intensity of about 30 dB very close to the dredger, which gradually reduced to zero when the plume was about 300 seconds old. The effect of bubble contamination on concentration estimates will vary depending on the total magnitude of the measured backscatter intensity, including the sediment. In order to assess the potential effects, the measured near-surface backscatter intensities at the core of each sediment plume from the Seal Sands were extracted from the data files. For each plume, the 16 individual beam backscatter measurements in the uppermost 1 metre measurement interval (where the bubbles may be expected to be concentrated) of a single data ensemble were averaged. These were compared with the maximum backscatter intensities observed during the bubble experiment for bubble plumes of similar age. Indicative percentage errors have been calculated based on the difference. The results are summarised in Table 2.
Table 2. Indicative estimates of maximum errors due to air bubbles in the computation of near-surface concentrations.
Transect No
Estimated age of plume, secs
Potential error near-surface concentration
estimate, %
Transect No
Estimated age of plume, secs
Potential error near-surface concentration
estimate, % B1 231 0.7 B12 186 0.9 B2 112 8.6 B13 345 0 B3 201 1.4 B14 376 0 B4 121 22.2 B16 408 0 B5 275 0.7 B17 348 0 B6 182 1.9 C1 345 0 B7 154 1.6 C2 248 0.7 B8 174 1.4 C3 229 0.5 B9 116 6.2 C6 255 0.5
B10 150 10.2 C7 430 0 B11 134 4.6
1179

The estimated ages of the plumes measured during the loss measurements varied between about 110 seconds and 430 seconds. Six of the plumes were estimated to be more than 300 seconds old and, on the basis of the bubble experiment, are thus unlikely to have been contaminated by air bubbles. Most of the potential errors are either nil or very small. The maximum potential error is about 22%. However, it should be noted that the cross sectional area of each plume that is influenced by these errors is very small and the overall errors in the total estimate of sediment flux would therefore be very much smaller than those indicated in Table 6.
EQUIPMENT CALIBRATION Turbidity Meter
There were three stages in the turbidity meter calibration:
1) pre-survey laboratory formazin calibration; 2) on-site calibration checks were carried out at the beginning of each day of measurements; 3) post-survey calibration using 500ml water samples collected during the field measurements.
The pre survey calibration was undertaken by immersing the turbidity sensor in de-ionised water and laboratory-prepared Formazin standard suspensions over the range 0-4000FTU and the output recorded. The formazin suspensions were diluted from 4000 FTU stock suspension prepared from analytical grade reagents. The calibration procedure adopted for the on-site calibration was the same as that adopted in the laboratory but with a reduced number of Formazin standard suspensions. A fresh set of calibration solutions was used daily to eliminate contamination / dilution errors. About 75 water samples were collected using the sampling array fitted to the RDP. The post-survey calibration, which was preceded by a calibration check with Formazin standard suspensions, was carried out in the HR Sedimentation Laboratory on 8 May 2000. The transmissometer was immersed in each water sample and the sensor output noted. The total mass of suspended particulate matter within each water sample was then derived using a filtration and dry weight analysis method. Because of the limited number of high concentration water samples collected the calibration range was extended by use of additional samples made up in the laboratory. Figure 6 shows the results of the calibration.
Fig 6. Post-survey turbidity meter calibration
1180

Acoustic Doppler Current Profiler
The ADCP data were processed using DRL-Sediview software. Sediview computes solids concentrations using a set of processing parameters that include environmental data (water temperature and salinity profiles and derived parameters such as water density and kinematic viscosity), instrument performance parameters (mainly concerning the unique performance characteristics of the four ADCP transducers) and sediment characteristics. The latter are derived within the software’s calibration module and comprise the ‘basic backscatter relationship’ that describes the relationship between backscatter intensity and solids concentration (after correction for all forms of acoustic attenuation) and a sediment attenuation coefficient. Both the basic backscatter relationship and the sediment attenuation coefficient can only be derived by calibration against water samples. When the water sample ADCP data were analysed it was immediately apparent that the distance between the ADCP and the sampler had been too great to permit sensible comparison due to the very steep concentration gradients which are present within newly-formed sediment plumes. The separation between the instruments at deck level was about four metres and this was often greatly increased when the RDP was deployed because of drag as the Wilton moved through the water. The separation was comparable, in some cases, to the width of the plume cores and prevented a meaningful direct comparison between the water sample concentrations and the ADCP data and thus the derivation of an ADCP calibration in the normal manner. An alternative approach was therefore adopted which is described under Data Processing below.
DATA PROCESSING The sediment flux through the measurement transects was estimated using two methods. The first was based on a combination of ADCP current measurements and RDP concentration measurements. The second combined the ADCP current data with estimates of solids concentration derived from the acoustic backscatter data using an intuitive Sediview calibration. ADCP Current Data and RDP Solids Data
The ADCP record of each transect was imported into Sediview and the ranges to the measurement bins were recomputed using the temperature and salinity profiles obtained by the RDP during the transect. Because there was no interface between the ADCP and the ship’s positioning system, it was necessary to input to Sediview the known start coordinates of each transect and use the ADCP bottom track data to reconstruct the ADCP track in earth coordinates. The overall average current direction along the full length of the transect was then computed and the current data projected onto a straight line oriented perpendicular to the current direction. The horizontal dimensions of each ADCP measurement cell were thus adjusted in order to derive values of discharge through the projected measurement line in the direction of the current. This procedure ensured that errors due to the variable course of the Wilton were eliminated and that the discharge estimates represented the shortest route across the plume. The discharges in the uppermost and lowermost parts of the water column, where the ADCP is unable to obtain valid data, were computed using a standard power function to extrapolate from the measured data. The discharge data were then exported to a spreadsheet. Typically, each spreadsheet contained 4-6,000 individual measurements of discharge. Each turbidity meter profile was then analysed to derive the average solids concentration in each depth interval corresponding to the measurement depth increments of the ADCP (approximately 0.25 m). If any depth intervals were found not to have turbidity meter data, these were filled by linear interpolation between the measurements above and below the missing data. The turbidity meter data were then inserted in the spreadsheet to correspond to those parts of the ADCP record obtained when the profiles were obtained. For each profile, the sediment flux was computed by summing the ADCP discharge data in each vertical measurement interval spanning the period of time taken to obtain the turbidity meter profile. In most cases, this time was represented by about 10 ADCP data ensembles. The discharges were then multiplied by the corresponding turbidity meter concentrations in order to derive the sediment flux in each depth increment. The total sediment flux perpendicular to the projection line was obtained by summing all of the individual flux estimates.
1181
The turbidity meter profiles in background conditions beyond each side of the plume were then analysed to derive two average solids concentration profiles. The difference between the profiles was linearly distributed over all of the intervening profiles to derive a new set of turbidity meter profiles representing the estimated background conditions. The ‘background’ turbidity meter profiles were then combined with the discharge data, in the same manner as that described above, to derive the estimated background sediment flux through the projection line. The background flux was subtracted from the total flux in order to derive the sediment flux due only to sediment released by the dredger. Sediview Calibration of the ADCP
The intuitive Sediview calibration was developed by trial and error so that, for each transect through the plume, Sediview yielded a similar range of solids concentrations to that measured using the RDP and the water samples. The estimated solids concentrations were then combined with the measured current speeds to produce for each measurement cell an estimate of total solids flux (g/sec) through the transects. The solids flux in the near-bed and near-surface parts of the water column (where the ADCP cannot obtain measurement data) were estimated by combining current speeds derived from a power curve fitted through the measurement data with solids concentrations extrapolated from the measurement data. The total solids flux was adjusted for background flux by subtracting from the flux estimate the total discharge multiplied by the background concentration observed at the ends of each transect, beyond the sediment plume.
RESULTS The results of the plume observations are summarised in Table 3.
Table 3. Summary of results of plume observations.
Sediment flux, kg/sec Series & Transect No.
Plume age, seconds Sediview RDP
Cycle time, seconds
Dredging rate, m3/min
Grab leakage
1/B1 231 0.847 40 3.00 1 1/B2 112 1.107 0.413 35 3.43 1.5 1/B3 201 0.542 0.145 35 3.43 1 1/B4 121 0.754 0.265 40 3.00 1.5 2/B5* 275 0.408 40 3.00 2 2/B6 182 1.438 0.929 45 2.67 1.5 2/B7 154 1.854 1.195 60 2.00 3 2/B8 174 2.338 1.440 50 2.40 3 3/B9 116 1.475 0.809 50? 2.40 ?
3/B10 150 2.541 1.803 55 2.18 2.5 3/B11 134 1.684 1.713 50? 2.40 3 3/B12 186 4.093 1.397 35 3.43 3 4/B13 345 0.823 0.330 40 3.00 1.5 4/B14 376 1.197 1.519 45 2.67 2 5/B16 408 0.621 0.510 45 2.67 2 5/B17 348 1.060 0.943 40 3.00 1.5 6/C1 345 0.544 0.239 55 2.18 1 6/C2 248 0.828 0.418 60 2.00 1.5 6/C3 229 1.432 0.350 60 2.00 1 7/C6 255 0.750 0.551 50 2.40 1 7/C7 430 0.518 0.375 55 2.18 1.5
*RDP data not available for Transect 2/B2 due to malfunction
1182

The plume ages, cycle times, dredging rates and grab leakage observations were derived using a combination of the measured current speed in the centre of the plume, the distance between the grab and the measurement transect and the detailed records of dredger operation. In some cases, e.g. where the location of the grab was not accurately known or when the data indicated the plume was formed approximately midway between two grab cycles, this necessitated the averaging of data from two or more grab cycles. The leakage from the grab has been ‘rated’ as follows:
Minor/no grab leakage: 1 Significant leakage: 2 Substantial leakage: 3
This is a somewhat subjective assessment based on visual observation. ‘Minor’ was defined as sediment laden water flowing from a grab that appeared to be fully closed. ‘Substantial’ leakage was recorded when the grab was clearly not fully closed and when large lumps of material were falling back into the water. By way of illustration, the loss of material shown in Figure 7 would have been described as minor leakage. The grab is clearly fully closed.
Figure 7. Loss of sediment-laden water from the open grab. Although the Sediview and RDP flux estimates are of a similar order of magnitude, Sediview yields higher estimates in all but two cases, as illustrated in Figure 8.
5000
4000
3000
2000
1000
00 500 1000 1500 2000
RDP estimate, gm/sec
Sed
ivie
w e
stim
ate,
gm
/sec
1:1
Figure 8. Comparison of Sediview and RDP flux estimates.
1183

During the planning stages of the work, it was recognised that the profiling turbidity meter might not be able to provide sufficient data to characterise accurately the narrow plumes but it was hoped that, if enough plume transects could be obtained, the overall data set would be sufficient. In order to investigate the discrepancy between the RDP and Sediview estimates of flux, the approximate track of the RDP through the plume cross section was superimposed on the ADCP data records using the times at which the profiler was known to be at the surface and on the bed. Three examples are shown in Figure 9. In several places, corruption of the ADCP data by the RDP can be seen.
Transect C3
Transect B3
Transect B2
Figure 9. Reconstructions of the approximate tracks of the RDP through ADCP sections. (The steps in the central profiles of Transects B2 and C3 are where the RDP was
stopped to obtain water samples).
1184

In almost all cases, it was apparent that the RDP had failed to pass through critical high-concentration areas of the plume thus leading to an underestimate of the total sediment flux. This was partly due to the limited speed at which profiles could be obtained, even from the slowly-moving Wilton. However, it was also apparent that the need to periodically interrupt profiling to obtain water samples (see the ‘steps’ in the profiles of Transects B2 and C3 in Figure 9) exacerbated the problem. On this basis it was concluded that the Sediview flux estimates were more reliable. As noted previously, it was at first feared that some of the near-surface ADCP data were corrupted by air bubbles but the later bubble experiment showed that this was most unlikely to have been the case. Figure 10 shows an example of one of the records which gave rise to concern. The wide, near-surface plume that was suspected to represent air contamination was eventually recognised to be the plume formed when the leaking grab was slewed towards the hopper of the Seal Sands.
SOUTHNORTH
10 20 30 40 50 75 100 150 2000 >200Solids concentration, mg/L
Dep
th, m
Projected distance, m
Figure 10. Example of near-surface plume caused by grab leakage during slewing (Plume approximately 450 seconds old, sediment flux 0.518 kg/sec).
Several of the transects exhibited this type of ‘slewing’ plume. In contrast, others did not, and a ‘main water column’ plume was observed which is interpreted to be the sediment lost as the grab was hauled to the surface. Figure 11 shows one example, and includes a high concentration area close to the surface which is interpreted to be a surge of leakage caused by water pressure differential as the grab was raised out of the water.
SOUTHNORTH
Dep
th, m
10 20 30 40 50 75 100 150 2000 >200Solids concentration, mg/L
Projected distance, m
Figure 11. Example of plume created during raising grab to surface and lifting from water (Plume approximately 200 seconds old, sediment flux 0.542 kg/sec).
1185
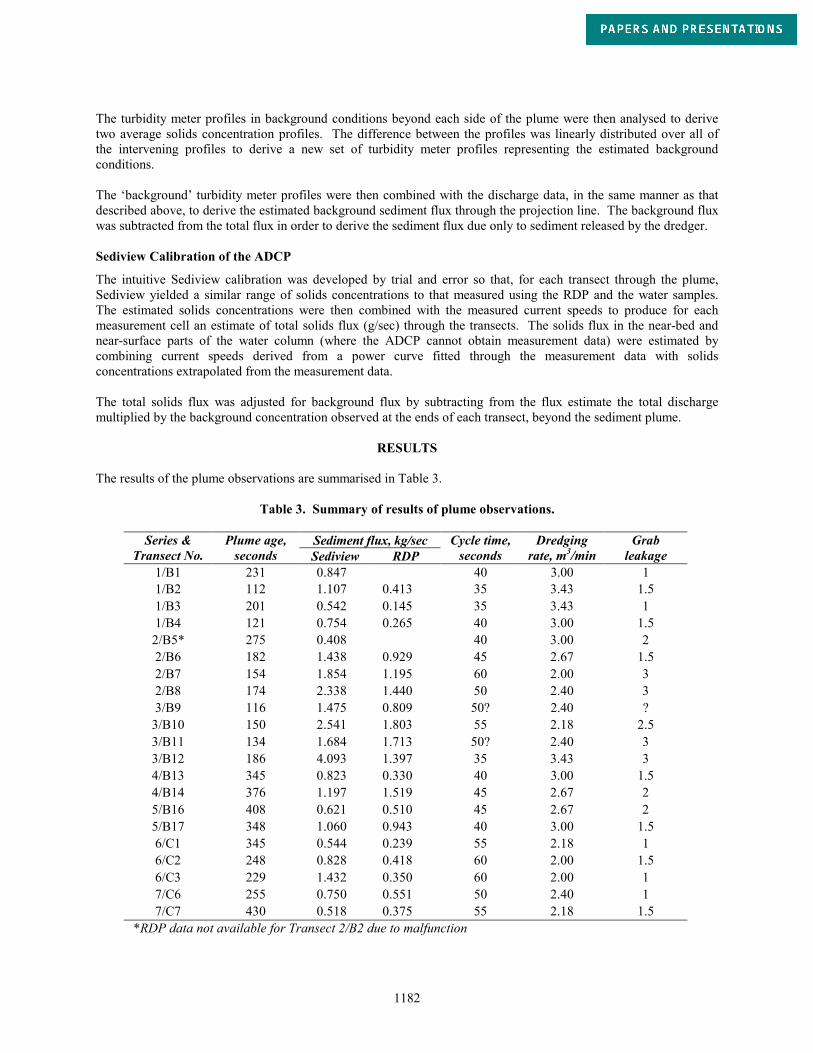
Other transects showed relatively little sediment in the water while some showed a variety of combinations of plume components representing the various stages of the grab cycle. As expected, there is considerable variation of observed sediment flux due to the discontinuous nature of the grab dredging process. It follows that a large number of measurements are required if a reliable ‘characteristic’ rate of release is to be established and, particularly, if the various sub-components of the turbidity prediction models (representing the different stages of the cycle) are to be calibrated successfully. Numerical modelling was undertaken in order to further investigate and understand the formation and development of the near-surface ‘slewing plume’. Typical sediment losses were estimated to be about 5-6% of the dry mass dredged (see ‘Comparison with other measurements’ below). For the modelling, an assumption was made that 2.5% of the dry mass (equivalent to 37.5 kg) was released over a period of 10 seconds as a ‘slewing plume’ extending over a nominal water surface area of 50m2. The model showed that over a period of 200-300 seconds the width of the plume doubled. If it is therefore assumed that its area quadrupled and its average thickness increased to 2m due to turbulent mixing and differential settling of the sediment particles, the resulting average concentration is found to be about 100 mg/L. This is in close agreement with the field observations. The modelling indicated that the plume sank in the water column by about 3m over a period of 300 second and that gravitational acceleration was rapidly reduced by stratification of the water column. Figure 12 shows a record of an RDP turbidity meter profile through a slewing plume. Note that although the plume is approximately two metres thick, high concentrations in excess of 100 mg/L are restricted to a thin basal component at a depth of 3.3-3.8m. The clusters of readings at 3.7m, 5.4m and 7.4m were obtained when the ascent of RPD was paused to obtain water samples.
0 50 100 150 200 2500
1
2
3
4
5
6
7
8
9
Suspended solids concentration (mg/L)
Dep
th b
elow
sur
face
(m)
Figure 12. Example RDP solids concentration profile showing a high-level sediment plume caused by leakage from the grab as it was slewed toward towards the hopper.
1186

Figure 13 shows the acoustic sediment flux measurements plotted against plume age and it can be seen that they appear to be closely related to the observed leakage of the grab as it was raised out of the water and slewed towards the hopper.
4500
4000
3500
3000
2500
2000
1500
1000
500
00 50 100 150 200 250 300 350 400 450 500
Estimated age of plume, seconds
Sedi
view
flux
est
imat
e, g
m/s
ec
B12
B10
B8
B7B11
B9B6
C3B2
B4B1 B3
C1
C2 C6
B5
B16B13
B17 B14
C7
32.521.51Grab leakage losses
Low High
Significant 'slewing'plume visible in record
Figure 13. Influence of grab leakage on measured solids flux. Although the flux estimates for ‘low to significant’ leakage (rating 1-2) appear to fall into the same general trend, it is clear that those for ‘significant to substantial’ (rating 2-3) leakage lie well above the general trend and that grab leakage is therefore a major factor in the overall rate of loss during dredging. The transects that included very prominent slewing plumes (ie. high-concentration, near-surface and much wider that the sub-vertical plume in the main part of the water column) are indicated by grey squares. This further reinforces the impression that leakage from the grab is one of the most important variables, because, with the exception of B14 and possibly B13, all of the relatively high solids fluxes (for any given plume age) are included in this group. It was agreed by many of those present that the manner in which the grab was operated was conducive to substantial losses and the observer on board the Seal Sands reported significant or substantial grab leakage for much of the time that the dredger was operating. The data presented here suggest that leakage from the grab (other than ‘normal’ minor leakage) increases sediment release rates by a factor of two to four. If the five transects that encountered ‘significant to substantial’ leakage are excluded (ie. all those with solids fluxes in excess of 1500 gm/sec), there remains a weak trend showing reducing solids flux with increasing plume age. There is, as might be expected, considerable scatter. A linear regression through the data has an r2 of just 0.1 but indicates an average loss at time = 0 of about 1.15 kg/sec. The weakness of the trend is at least partly due to the fact that much of the sediment was released at the surface and therefore was unable to settle to the bed within the time span covered by the measurements (plume ages of 110- 450 seconds). It had been hoped that trends in the measurement losses could be related to other factors such as water depth and cycle time (mainly hoisting speed). However, the limited number of transects in combination with variable soil conditions, positioning uncertainty, the lack of instrumentation on the dredger (grab) and the inevitable variation of instantaneous sediment release rates even when conditions are uniform, prevent correlation of sediment flux with the manner of operation of the Seal Sands. All of these difficulties underscore the requirement to adhere strictly to the Measurement Protocol. It is also evident that the number of flux measurements required to adequately characterise the loss from a particular operation (ie. combination of site and operating parameters) needs to be greater than was achieved during the Tees trial.
1187

COMPARISON WITH OTHER MEASUREMENTS
Several workers have undertaken field measurements of sediment release from dredging plant but, until now, none have been undertaken mobile acoustic methods that permit detailed current- and concentration-profiling of the plumes. Because of the significant differences of methodology and differences in the way that ‘sediment release’ was defined, considerable care is required when comparing the results of the Tees measurements with earlier work. One of the most systematic investigations of sediment release was undertaken in the Netherlands in the 1980’s and 1990’s. The measurements involved intensive water sampling and turbidity measurement on a grid around a working dredger to characterise the quasi-static plumes that developed after a few hours of dredging in, in most cases, quiescent water. The results of the measurements were expressed in terms of the mass of sediment released per cubic metre dredged (kg/m3), termed the ‘S-parameter’. Because some of the sediment will have settled in the immediate vicinity of the dredge, where concentrations could not be measured, the results of the measurements are likely to have been underestimates of the true rate of release. Four sets of measurements are directly relevant to the work described here because they involved small grab dredgers working in soft, fine grained, recently deposited harbour sediments with no enclosing silt curtains. The results of the measurements are summarised in Table 4.
Table 4. S-parameter data for grabs working without silt curtains.
Location Grab volume / type S-parameter Reference Hollandsche Ijssel 2.5 m3 open 19 kg/m3 WL Report Bagt-421 Oude Haven, ‘t Sas te Zierikzee 1.3 m3 closed 11 kg/m3 WL Report J-492 Merwedehaven, Rotterdam 1.1 m3 open 3 kg/m3 Terra et Aqua, 42 & 64 1e Petroleumhaven, Rotterdam ? 13 kg/m3 Terra et Aqua, 64
The Tees flux data indicate a characteristic release rate of the order of 1.15 kg/sec when leakage of the grab is slight to significant. The average rate of dredging was 2.64 m3/min. This yields an approximately equivalent S-parameter of 26 kg/m3. This is about 37% higher than the 19 kg/m3 that was measured in the Hollandsche Ijssel with a slightly smaller grab. The Seal Sands was working aggressively and this probably resulted in greater losses of sediment than might otherwise have been the case. This, in combination with its larger grab and the fact that, using the methods described here, we would expect higher values of the S-parameter than were obtained during the original S-parameter measurements, leads us to conclude that the Tees data are broadly consistent with the earlier work undertaken in the Netherlands. Sediment release has sometimes been described in terms of the percentage of the dry mass of the soil that is released. It is also the case that, when release limitations are imposed on dredging operations, the limit is sometimes expressed in percentage terms. As noted previously, one of the difficulties arising from the chosen site was that the soil type was not consistent. However, the majority comprised soft mud with an average bulk density of about 1.5 t/m3. Assuming saturation, this indicates a dry density of about 0.775 t/m3. The estimated release rate of 26 kg/m3 for ‘normal’ leakage therefore represents about 3.35% of the dredged mass. However, the data clearly show that leakage was very variable and the average, or characteristic, release might be about 5-6% while substantial leakage might result in transient ‘spikes’ or 10% or more. These figures are in line with measurements made in Providence, Rhode Island (Land et al, these proceedings) where estimated characteristic release rates from a 30 m3 grab were 4.91% and 7.44%, equivalent to 24.56 kg/m3 and 37.19 kg/m3 respectively.
LESSONS LEARNED The Tees experiment was the first attempt to apply the newly-developed TASS Measurement Protocol and, inevitably, not everything went exactly as planned. The lack of modern instrumentation on the Seal Sands has led to some uncertainty concerning the distance between the grab and the measurement transects which might account for some amount of the scatter in the results. The site was not ideal, being partially constrained by a training wall and having a variable thickness of soft sediments overlying soils which sometimes resulted in a mixture of soils being dredged. As the main objective of the experiment was to test the Measurement Protocol and this was the only available opportunity at the time, these problems were accepted but they undoubtedly made the experiment more difficult than would otherwise have been the case.
1188
In terms of basic methodology, it was learned that profiling turbidity meters are most unlikely to fully characterise the narrow sediment plumes formed by grab dredges. Even when deployed from a vessel that had the ability to move through the plume at fraction of the speed of a conventional survey boat, insufficient data were obtained. It would appear that acoustic methods are the only realistic option in this type of plume but it is anticipated that profilers might be applicable to the much larger plumes generated, for example, by trailing hopper suction dredgers. The narrow plumes with irregular sediment distribution and steep concentration gradients also clearly demonstrated the need to ensure that the ADCP and water sampling equipment are close together, and preferably in same streamline, if there is to be any chance of obtaining matching data. The separation on the Wilton prevented any meaningful comparison between the ADCP and water sample data. The protocol has since been changed so that ADCP calibration water samples are obtained using a sampler located on the same side of the survey boat as the ADCP so that the sampler and ADCP are lying in the same streamline. With respect to the manner in which sediment is released during grab dredging, the data indicate that release as the grab leaves the water, and as it is slewed towards the barge, is more important than was previously thought. The number of transects that were measured was insufficient to allocate release rates to the sub-components of the release model but the data, in combination with numerical modelling of the near-surface plume, suggests that it might account for 50% or more of the total release. The complex character of the plumes was evident from the measurements, with a wide range of sediment flux illustrating the discontinuous nature of the grab dredging process. In future measurement campaigns, it will be necessary to undertake far more measurements than were possible during the Tees experiment.
CONCLUSIONS There is inevitably some doubt concerning the accuracy of the sediment flux estimates. However, they appear to indicate generally reasonable loss rates and it is encouraging to note that trends in the sediment flux data can be related to the amount of grab leakage and the presence or absence of slewing plumes in individual transects. When the highest fluxes (resulting from incomplete closure) are excluded from the analysis there appears to be a trend of decreasing sediment flux with increasing plume age. A more detailed analysis of the data is not possible because of the variability of the material which was dredged and uncertainties concerning the position of the dredger (and hence the age of the plumes) and the depths at which it was dredging. Analysis is also hindered by the fact that there were an insufficient number of transects to investigate the variation of sediment release during dredging. It was expected that sediment flux would vary considerably about a mean value ‘characteristic’ of the dredging operation (ie. different water depths, materials, cycle times etc). The limited number of Transects obtained during each series of measurements precludes meaningful assessment of sediment release rates related to the manner of operation of the dredger. However, taken overall, the data suggest that the release rate for the Seal Sands was of the order of 1.15 kg/sec for ‘normal’ working without excessive grab leakage. The characteristic release rate was estimated to about 1.9 kg/sec, equivalent to 5-6% of the dry mass dredged. It is stressed that the results presented here must not be assumed to be typical of grab dredging operations and should not be applied in an arbitrary manner to other projects. The rate of release observed during these measurements is specific to the Tees site, the soil and hydrodynamic conditions and the dredger and its manner of operation. Authors Note: The TASS research programme is no longer funded by VBKO. Since the Tees work was undertaken, the programme has been split into two parts. Sediment release from trailing suction hopper dredgers is being studied under a programme led by Stichting Speurwerk Baggertechniek (SSB) which is a joint research effort of Royal Boskalis Westminster and Van Oord. Release from cutter suction, bucket ladder, backhoe and grab dredgers is being studied under the guidance of ACCORD (Advice and Consultation Committee on Resuspension by Dredging - http://el.erdc.usace.army.mil/dots/accord/index.html.)
1189

REFERENCES Burt T.N., Roberts W., and Land J., (2000). “Assessment of sediment release during dredging: a new initiative called
TASS.” Proceedings of the Western Dredging Association Twentieth Technical Conference (WEDA XX) and Thirty-Second Annual Texas A&M Dredging Seminar (TAMU 32), Warwick, Rhode Island, USA June 25 – 28, 2000. Pub Texas A&M University, Texas 77843 – 3136 (CDS Report No 372).
Burt T.N. and Land J., (2003). “Re-suspension of sediment by dredging processes.” Proc. 2nd International Seminar on Dredging, Aviles, Spain 19-20 June 2003.
Burt T.N. and Land J., (2003). “Protocols for the Field Measurement of Sediment Release from Dredgers.” Proc. International Conference on Remediation of Contaminated Sediments, Venice 30 Sep –3 Oct 2003, Pub Battelle.
Burt TN and Hayes DF (2004). “Framework for research leading to improved assessment of dredge generated plumes.” Proceedings of the Western Dredging Association Twenty-Fourth Technical Conference (WEDA XXIV) and Thirty-Sixth Annual Texas A&M Dredging Seminar (TAMU 36), Orlando, 6 – 9 July 2004.
HR Wallingford/Dredging Research Ltd, (2003). “Protocol for the field measurement of sediment release from dredgers”, Issue 1, August 2003.
John S.A., Challinor S.L., Simpson M., Burt T.N., Spearman J., (2000). “Scoping the assessment of sediment plumes from dredging.” CIRIA Report C547, London 2000.
Land J.M., and Bray R.N., (1998). “Acoustic Measurement of Suspended Solids for Monitoring of Dredging and Dredged Material Disposal”. Proc. 15th World Dredging Conference, Las Vegas, USA. WODA.
Land J.M., Burt T.N. and Otten H., (2004). “Application of a new international protocol to measurement of sediment release from dredgers.” Proc. 17th World Dredging Conference, Hamburg, Sept 2004.
Land J.M., Clarke, D., Reine, K., Dickerson, C., (2007). “Acoustic Determination of Sediment loss terms for mechanical dredging operations at Providence, RI, USA.” Proc. 18th World Dredging Conference, Orlando, May 2007.
Pennekamp JGS, and Quaak MP (1990). “Impact on the environment of turbidity caused by dredging.” Terra et Aqua, 42, pp 10-20.
Pennekamp JGS, Epskamp RJC, Rosenbrand WF, Mullie A, Wessel GL, Arts T and Deibel, IK (1996). “Turbidity caused by dredging; viewed in perspective”. Terra et Aqua, 64, pp 10-17.
Waterloopkundig Laboratorium (1989). “Troebelheidsmetingen bij Draadgrijperkraan en Slibscherm in de Hollandsche Ijssel.” Report No. Bagt-421 for CSB. (Not in public domain)
Waterloopkundig Laboratorium (1990). “Troebelheidsmetingen Rond een Draadgrijperkraan in de Oude Haven, ‘t Sas te Zierikzee.” Report No. J492 for Rijkswaterstaat, Dienst Binnenwateren/Riza. (Not in public domain)
1190