Embed Size (px)
Citation preview
Preprint typeset in JINST style - HYPER VERSION
Measurement of Optical Attenuation in Acrylic LightGuides for a Dark Matter Detector
M. Bodmera, N. Phana, M. Golda, D. Loombaa, J.A.J. Matthewsa and K. Rielagea,b∗
aUniversity of New Mexico, Department of Physics and Astronomy,Albuquerque, NM 87131, USA
bLos Alamos National Laboratory,Los Alamos, NM 87545, USAE-mail: [email protected]
ABSTRACT: Acrylic is a common material used in dark matter and neutrino detectors for lightguides, transparent vessels, and neutron shielding, creating an intermediate medium between thetarget volume and photodetectors. Acrylic has low absorption within the visible spectrum and hasa high capture cross section for neutrons. The natural radioactivity in photodetectors is a majorsource of background neutrons for low background detectors making the use of acrylic attractivefor shielding and background reduction. To test the optical properties of acrylic we measured thetransmittance and attenuation length of fourteen samples of acrylic from four different manufactur-ers. Samples were evaluated at five different wavelengths between 375 nm and 632 nm. We foundthat all samples had excellent transmittance at wavelengths greater than 550 nm. Transmittance wasfound to decrease below 550 nm. As expected, UV-absorbing samples showed a sharp decrease intransmittance below 425 nm compared to UV-transmitting samples. We report attenuation lengthsfor the three shortest wavelengths for comparison and discuss how the acrylic was evaluated foruse in the MiniCLEAN single-phase dark matter detector.
KEYWORDS: acrylic, neutron shielding, light guides, dark matter, neutrinos.
∗Corresponding author.
arX
iv:1
310.
6454
v2 [
phys
ics.
ins-
det]
15
Jan
2014

Contents
1. Introduction 1
2. Experimental Set-up 42.1 Acrylic Samples 42.2 Acrylic Rod Preparation 42.3 Lasers and Power Meter 5
2.3.1 Positional Dependence of the Power Meter 52.4 Method 6
3. Calculating Transmittance Through Acrylic 83.1 Reflection at Acrylic Faces 83.2 Transmittance with Respect to Position 93.3 Transmittance Independent of Position 9
4. Calculating the Attenuation Length 10
5. Conclusion 13
1. Introduction
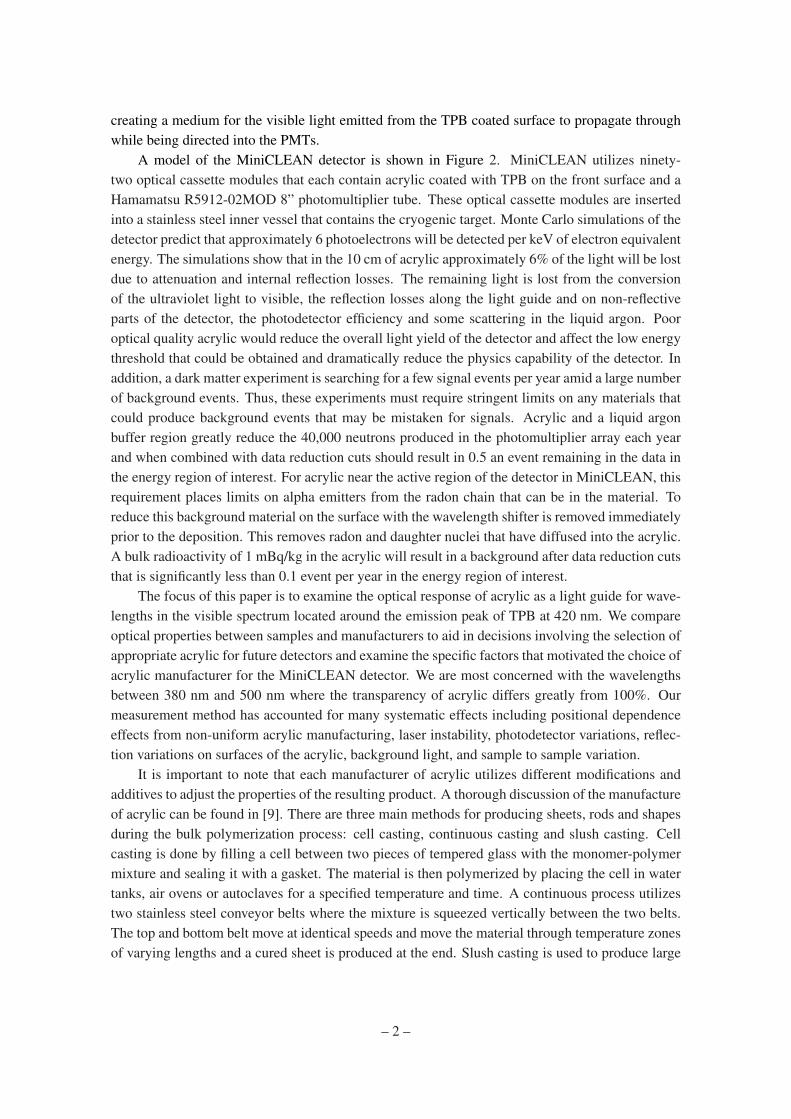
Acrylic, or polymethyl methacrylate (PMMA), is often used by neutrino and dark matter detectorsas an inexpensive light guide (e.g., LBNE [1]), transparent containment vessels (e.g., SNO [2]and Daya Bay [3][4]), and for neutron shielding (e.g., DEAP-3600 [5]). Acrylic is often chosenbecause it is a strong material and can be manufactured with low bulk radioactivity [6] and highoptical transmission. The acrylic samples in this paper were tested for use in the MiniCLEANexperiment [7]: a single-phase noble liquid WIMP dark matter detector. The purpose of acrylicin MiniCLEAN is threefold. First, acrylic acts as a neutron absorber, capturing neutrons fromnatural radioactivity in the detector components before they reach the central detection volume.This is important for MiniCLEAN since the natural radioactivity of the borosilicate glass in thephotomultiplier tubes (PMTs), used to detect the scintillation light signals, generates approximately40,000 neutrons per year. Second, the scintillation light produced by interactions in the liquid argon(LAr) and liquid neon (LNe) target is strongly peaked at 128 nm and 80 nm, respectively. Acrylicprovides a surface that can be coated with a wavelength shifter to convert the VUV scintillationlight into the visible spectrum. This surface defines the central active volume of the target. ForMiniCLEAN, tetraphenyl butadiene (TPB) has been selected as the wavelength shifter since its re-emission spectrum peaks at about 420 nm (shown in Figure 1) and is well matched to the responseof the bialkali photocathode on the PMTs. The third function of the acrylic is as a light guide,
– 1 –
creating a medium for the visible light emitted from the TPB coated surface to propagate throughwhile being directed into the PMTs.
A model of the MiniCLEAN detector is shown in Figure 2. MiniCLEAN utilizes ninety-two optical cassette modules that each contain acrylic coated with TPB on the front surface and aHamamatsu R5912-02MOD 8” photomultiplier tube. These optical cassette modules are insertedinto a stainless steel inner vessel that contains the cryogenic target. Monte Carlo simulations of thedetector predict that approximately 6 photoelectrons will be detected per keV of electron equivalentenergy. The simulations show that in the 10 cm of acrylic approximately 6% of the light will be lostdue to attenuation and internal reflection losses. The remaining light is lost from the conversionof the ultraviolet light to visible, the reflection losses along the light guide and on non-reflectiveparts of the detector, the photodetector efficiency and some scattering in the liquid argon. Pooroptical quality acrylic would reduce the overall light yield of the detector and affect the low energythreshold that could be obtained and dramatically reduce the physics capability of the detector. Inaddition, a dark matter experiment is searching for a few signal events per year amid a large numberof background events. Thus, these experiments must require stringent limits on any materials thatcould produce background events that may be mistaken for signals. Acrylic and a liquid argonbuffer region greatly reduce the 40,000 neutrons produced in the photomultiplier array each yearand when combined with data reduction cuts should result in 0.5 an event remaining in the data inthe energy region of interest. For acrylic near the active region of the detector in MiniCLEAN, thisrequirement places limits on alpha emitters from the radon chain that can be in the material. Toreduce this background material on the surface with the wavelength shifter is removed immediatelyprior to the deposition. This removes radon and daughter nuclei that have diffused into the acrylic.A bulk radioactivity of 1 mBq/kg in the acrylic will result in a background after data reduction cutsthat is significantly less than 0.1 event per year in the energy region of interest.
The focus of this paper is to examine the optical response of acrylic as a light guide for wave-lengths in the visible spectrum located around the emission peak of TPB at 420 nm. We compareoptical properties between samples and manufacturers to aid in decisions involving the selection ofappropriate acrylic for future detectors and examine the specific factors that motivated the choice ofacrylic manufacturer for the MiniCLEAN detector. We are most concerned with the wavelengthsbetween 380 nm and 500 nm where the transparency of acrylic differs greatly from 100%. Ourmeasurement method has accounted for many systematic effects including positional dependenceeffects from non-uniform acrylic manufacturing, laser instability, photodetector variations, reflec-tion variations on surfaces of the acrylic, background light, and sample to sample variation.
It is important to note that each manufacturer of acrylic utilizes different modifications andadditives to adjust the properties of the resulting product. A thorough discussion of the manufactureof acrylic can be found in [9]. There are three main methods for producing sheets, rods and shapesduring the bulk polymerization process: cell casting, continuous casting and slush casting. Cellcasting is done by filling a cell between two pieces of tempered glass with the monomer-polymermixture and sealing it with a gasket. The material is then polymerized by placing the cell in watertanks, air ovens or autoclaves for a specified temperature and time. A continuous process utilizestwo stainless steel conveyor belts where the mixture is squeezed vertically between the two belts.The top and bottom belt move at identical speeds and move the material through temperature zonesof varying lengths and a cured sheet is produced at the end. Slush casting is used to produce large
– 2 –
Wavelength [nm]350 400 450 500 550 600
]-1
Pro
babi
lity
Den
sity
[nm
0
0.002
0.004
0.006
0.008
0.01
0.012
0.014Illumination Wavelength:
128 nm 160 nm175 nm 250 nm
Figure 1. The re-emission spectrum of TPB at four different excitation wavelengths. All spectra have amean emission at approximately 440 nm with a maximum at 420 nm. From [8].
LAr/LNe
OpticalModule
InnerVessel
OuterVessel
CalibrationPorts
TargetVolume
Top Hat
PMT
Light Guide
Acrylic Plug
Figure 2. A cutaway model of the MiniCLEAN detector and an optical cassette module.
or unusual shapes. The polymer-catalyzed monomer mixture is poured into a mold and allowedto cure. The mold can be stationary or rotary. For this work, samples from cell casting and slushcasting were tested.
One of the primary purposes of the additives in the monomer mixture is to tune the amount ofultraviolet light (below 380 nm) that is transmitted through the acrylic. Material can be classified asultra-violet absorbing (UVA), ultra-violet transmitting (UVT), or even super-ultra-violet transmit-ting (SUVT) depending on the mixture. The samples in this study were limited to UVA and UVTbut two samples that were a result of mixing an incomplete set of additives creating a UVA/UVTmix are included for the comparison.
– 3 –
2. Experimental Set-up
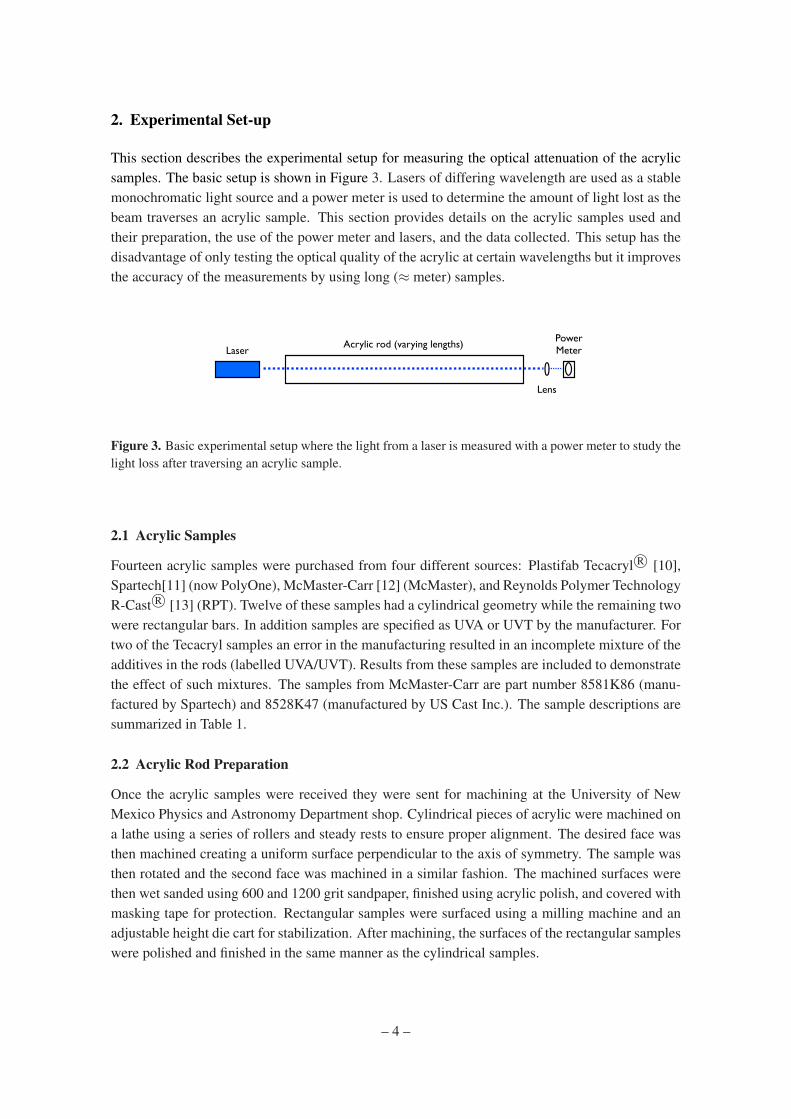
This section describes the experimental setup for measuring the optical attenuation of the acrylicsamples. The basic setup is shown in Figure 3. Lasers of differing wavelength are used as a stablemonochromatic light source and a power meter is used to determine the amount of light lost as thebeam traverses an acrylic sample. This section provides details on the acrylic samples used andtheir preparation, the use of the power meter and lasers, and the data collected. This setup has thedisadvantage of only testing the optical quality of the acrylic at certain wavelengths but it improvesthe accuracy of the measurements by using long (≈ meter) samples.
Acrylic rod (varying lengths)Laser
Lens
PowerMeter
Figure 3. Basic experimental setup where the light from a laser is measured with a power meter to study thelight loss after traversing an acrylic sample.
2.1 Acrylic Samples
Fourteen acrylic samples were purchased from four different sources: Plastifab Tecacryl R© [10],Spartech[11] (now PolyOne), McMaster-Carr [12] (McMaster), and Reynolds Polymer TechnologyR-Cast R© [13] (RPT). Twelve of these samples had a cylindrical geometry while the remaining twowere rectangular bars. In addition samples are specified as UVA or UVT by the manufacturer. Fortwo of the Tecacryl samples an error in the manufacturing resulted in an incomplete mixture of theadditives in the rods (labelled UVA/UVT). Results from these samples are included to demonstratethe effect of such mixtures. The samples from McMaster-Carr are part number 8581K86 (manu-factured by Spartech) and 8528K47 (manufactured by US Cast Inc.). The sample descriptions aresummarized in Table 1.
2.2 Acrylic Rod Preparation
Once the acrylic samples were received they were sent for machining at the University of NewMexico Physics and Astronomy Department shop. Cylindrical pieces of acrylic were machined ona lathe using a series of rollers and steady rests to ensure proper alignment. The desired face wasthen machined creating a uniform surface perpendicular to the axis of symmetry. The sample wasthen rotated and the second face was machined in a similar fashion. The machined surfaces werethen wet sanded using 600 and 1200 grit sandpaper, finished using acrylic polish, and covered withmasking tape for protection. Rectangular samples were surfaced using a milling machine and anadjustable height die cart for stabilization. After machining, the surfaces of the rectangular sampleswere polished and finished in the same manner as the cylindrical samples.
– 4 –
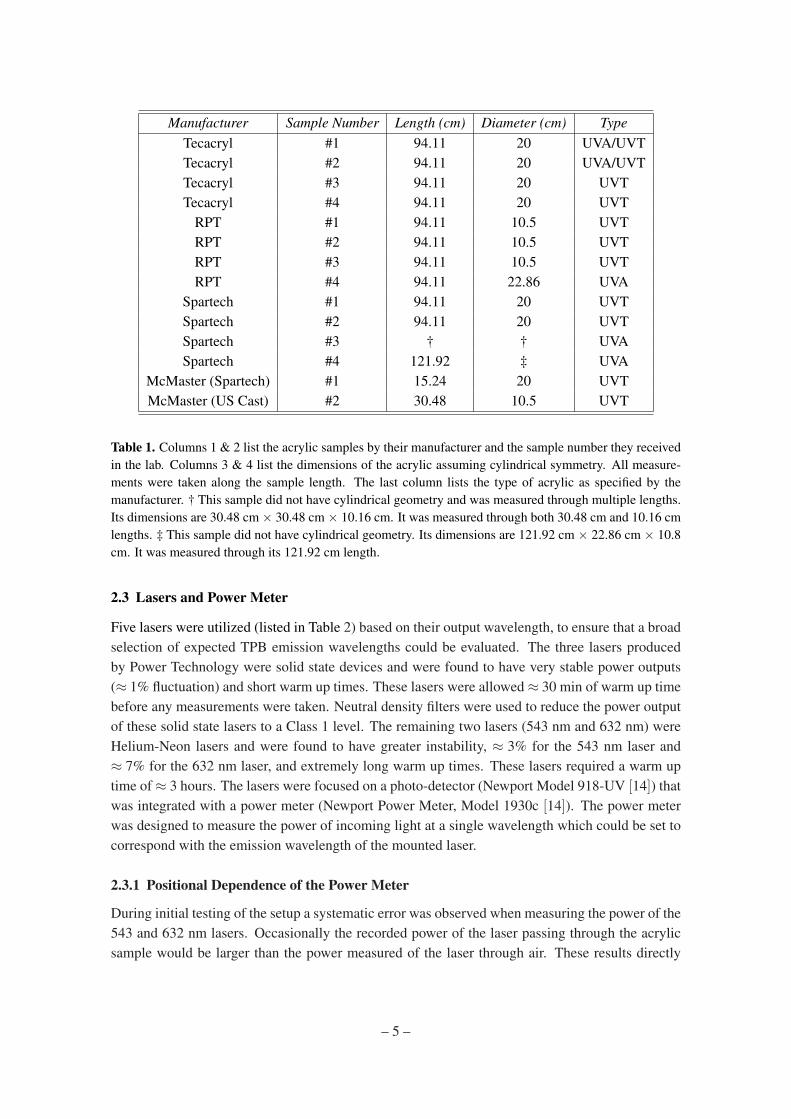
Manufacturer Sample Number Length (cm) Diameter (cm) TypeTecacryl #1 94.11 20 UVA/UVTTecacryl #2 94.11 20 UVA/UVTTecacryl #3 94.11 20 UVTTecacryl #4 94.11 20 UVT
RPT #1 94.11 10.5 UVTRPT #2 94.11 10.5 UVTRPT #3 94.11 10.5 UVTRPT #4 94.11 22.86 UVA
Spartech #1 94.11 20 UVTSpartech #2 94.11 20 UVTSpartech #3 † † UVASpartech #4 121.92 ‡ UVA
McMaster (Spartech) #1 15.24 20 UVTMcMaster (US Cast) #2 30.48 10.5 UVT
Table 1. Columns 1 & 2 list the acrylic samples by their manufacturer and the sample number they receivedin the lab. Columns 3 & 4 list the dimensions of the acrylic assuming cylindrical symmetry. All measure-ments were taken along the sample length. The last column lists the type of acrylic as specified by themanufacturer. † This sample did not have cylindrical geometry and was measured through multiple lengths.Its dimensions are 30.48 cm × 30.48 cm × 10.16 cm. It was measured through both 30.48 cm and 10.16 cmlengths. ‡ This sample did not have cylindrical geometry. Its dimensions are 121.92 cm × 22.86 cm × 10.8cm. It was measured through its 121.92 cm length.
2.3 Lasers and Power Meter
Five lasers were utilized (listed in Table 2) based on their output wavelength, to ensure that a broadselection of expected TPB emission wavelengths could be evaluated. The three lasers producedby Power Technology were solid state devices and were found to have very stable power outputs(≈ 1% fluctuation) and short warm up times. These lasers were allowed ≈ 30 min of warm up timebefore any measurements were taken. Neutral density filters were used to reduce the power outputof these solid state lasers to a Class 1 level. The remaining two lasers (543 nm and 632 nm) wereHelium-Neon lasers and were found to have greater instability, ≈ 3% for the 543 nm laser and≈ 7% for the 632 nm laser, and extremely long warm up times. These lasers required a warm uptime of ≈ 3 hours. The lasers were focused on a photo-detector (Newport Model 918-UV [14]) thatwas integrated with a power meter (Newport Power Meter, Model 1930c [14]). The power meterwas designed to measure the power of incoming light at a single wavelength which could be set tocorrespond with the emission wavelength of the mounted laser.
2.3.1 Positional Dependence of the Power Meter
During initial testing of the setup a systematic error was observed when measuring the power of the543 and 632 nm lasers. Occasionally the recorded power of the laser passing through the acrylicsample would be larger than the power measured of the laser through air. These results directly
– 5 –
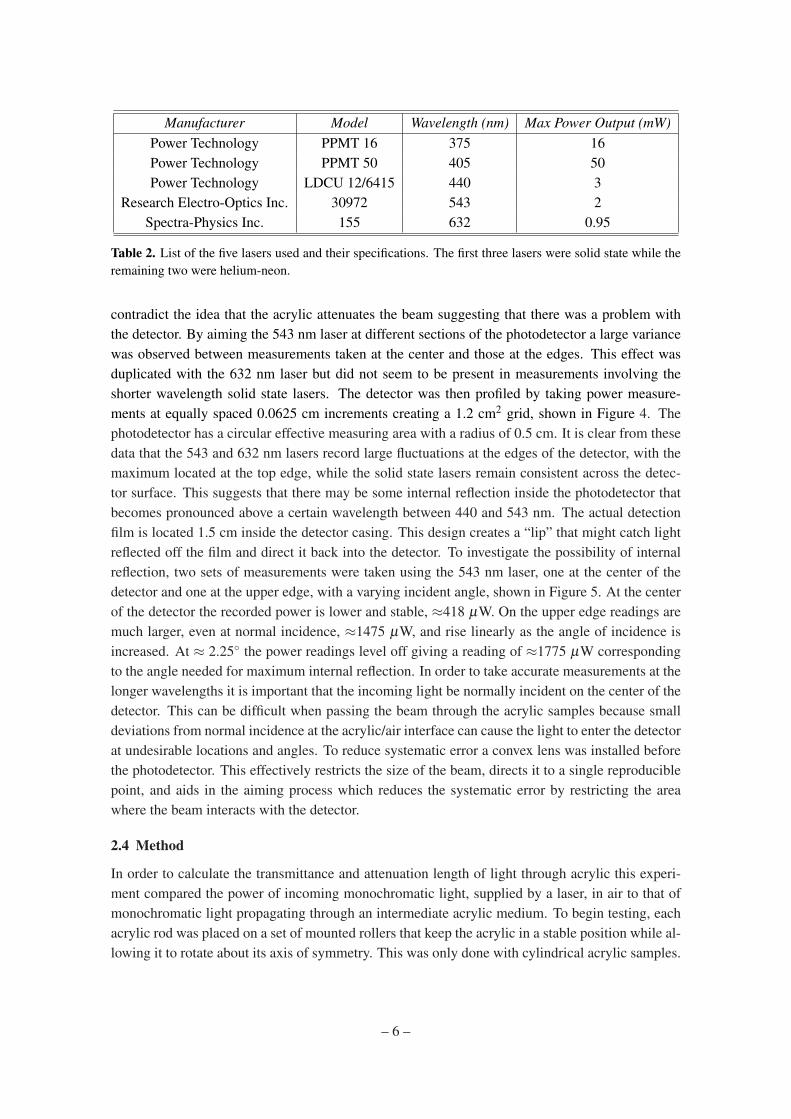
Manufacturer Model Wavelength (nm) Max Power Output (mW)Power Technology PPMT 16 375 16Power Technology PPMT 50 405 50Power Technology LDCU 12/6415 440 3
Research Electro-Optics Inc. 30972 543 2Spectra-Physics Inc. 155 632 0.95
Table 2. List of the five lasers used and their specifications. The first three lasers were solid state while theremaining two were helium-neon.
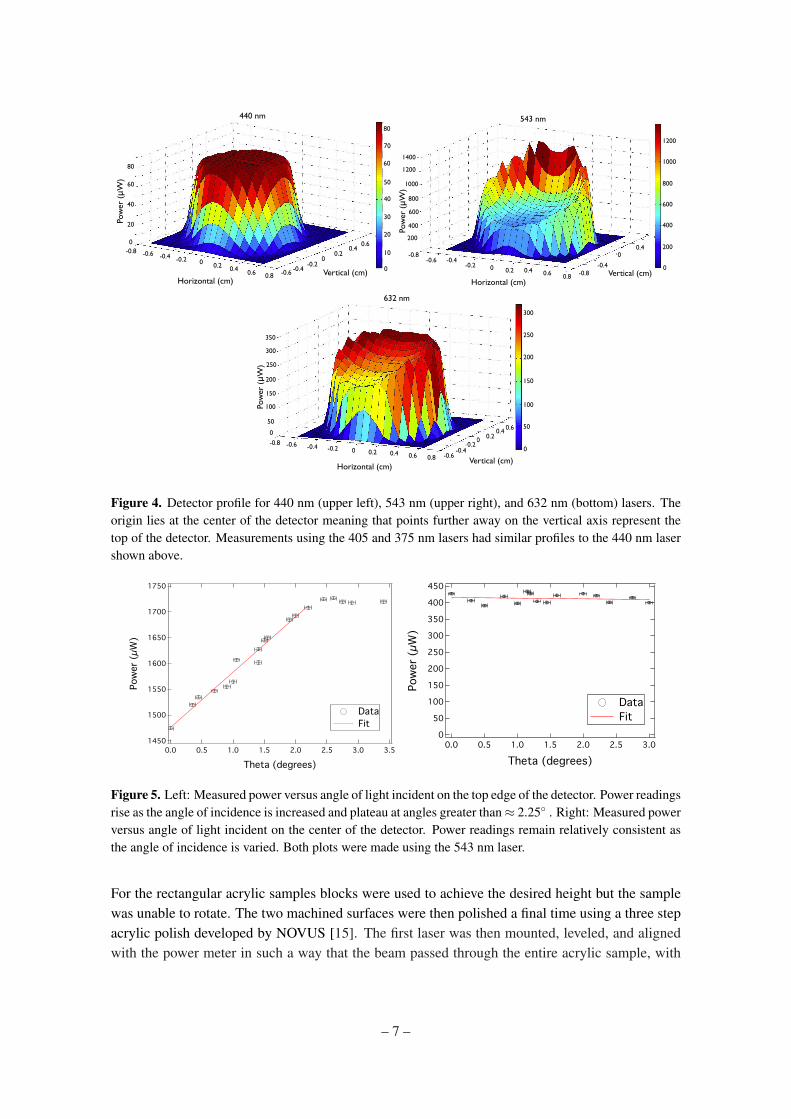
contradict the idea that the acrylic attenuates the beam suggesting that there was a problem withthe detector. By aiming the 543 nm laser at different sections of the photodetector a large variancewas observed between measurements taken at the center and those at the edges. This effect wasduplicated with the 632 nm laser but did not seem to be present in measurements involving theshorter wavelength solid state lasers. The detector was then profiled by taking power measure-ments at equally spaced 0.0625 cm increments creating a 1.2 cm2 grid, shown in Figure 4. Thephotodetector has a circular effective measuring area with a radius of 0.5 cm. It is clear from thesedata that the 543 and 632 nm lasers record large fluctuations at the edges of the detector, with themaximum located at the top edge, while the solid state lasers remain consistent across the detec-tor surface. This suggests that there may be some internal reflection inside the photodetector thatbecomes pronounced above a certain wavelength between 440 and 543 nm. The actual detectionfilm is located 1.5 cm inside the detector casing. This design creates a “lip” that might catch lightreflected off the film and direct it back into the detector. To investigate the possibility of internalreflection, two sets of measurements were taken using the 543 nm laser, one at the center of thedetector and one at the upper edge, with a varying incident angle, shown in Figure 5. At the centerof the detector the recorded power is lower and stable, ≈418 µW. On the upper edge readings aremuch larger, even at normal incidence, ≈1475 µW, and rise linearly as the angle of incidence isincreased. At ≈ 2.25◦ the power readings level off giving a reading of ≈1775 µW correspondingto the angle needed for maximum internal reflection. In order to take accurate measurements at thelonger wavelengths it is important that the incoming light be normally incident on the center of thedetector. This can be difficult when passing the beam through the acrylic samples because smalldeviations from normal incidence at the acrylic/air interface can cause the light to enter the detectorat undesirable locations and angles. To reduce systematic error a convex lens was installed beforethe photodetector. This effectively restricts the size of the beam, directs it to a single reproduciblepoint, and aids in the aiming process which reduces the systematic error by restricting the areawhere the beam interacts with the detector.
2.4 Method
In order to calculate the transmittance and attenuation length of light through acrylic this experi-ment compared the power of incoming monochromatic light, supplied by a laser, in air to that ofmonochromatic light propagating through an intermediate acrylic medium. To begin testing, eachacrylic rod was placed on a set of mounted rollers that keep the acrylic in a stable position while al-lowing it to rotate about its axis of symmetry. This was only done with cylindrical acrylic samples.
– 6 –
440 nm
Horizontal (cm)Vertical (cm)
Pow
er (μW
)
0
20
40
60
80
0 0.2 0.4 0.6 0.8
-0.2-0.4-0.6-0.80.6
0.40.2
0-0.2
-0.4-0.6
80
60
40
20
0
10
30
50
70
543 nm
Horizontal (cm)Vertical (cm)
Pow
er (μW
)
200
400
800
1200
1400
0 0.2 0.4 0.6 0.8
-0.2-0.4-0.6
-0.80.4
-0.4
0
-0.8
600
1000
1200
1000
800
600
400
200
0
632 nm
Horizontal (cm)Vertical (cm)
Pow
er (μW
)
0
50
100
150
300
0 0.2 0.4 0.6 0.8-0.2-0.4-0.6-0.8
0.60.40.20
-0.2-0.4
-0.6
200
250
350
300
250
200
150
100
50
0
Figure 4. Detector profile for 440 nm (upper left), 543 nm (upper right), and 632 nm (bottom) lasers. Theorigin lies at the center of the detector meaning that points further away on the vertical axis represent thetop of the detector. Measurements using the 405 and 375 nm lasers had similar profiles to the 440 nm lasershown above.
1750
1700
1650
1600
1550
1500
1450
Pow
er (
µW)
3.53.02.52.01.51.00.50.0
Theta (degrees)
Data Fit
450
400
350
300
250
200
150
100
50
0
Pow
er (
µW)
3.02.52.01.51.00.50.0
Theta (degrees)
Data Fit
Figure 5. Left: Measured power versus angle of light incident on the top edge of the detector. Power readingsrise as the angle of incidence is increased and plateau at angles greater than ≈ 2.25◦ . Right: Measured powerversus angle of light incident on the center of the detector. Power readings remain relatively consistent asthe angle of incidence is varied. Both plots were made using the 543 nm laser.
For the rectangular acrylic samples blocks were used to achieve the desired height but the samplewas unable to rotate. The two machined surfaces were then polished a final time using a three stepacrylic polish developed by NOVUS [15]. The first laser was then mounted, leveled, and alignedwith the power meter in such a way that the beam passed through the entire acrylic sample, with
– 7 –
normal incidence on the two polished surfaces, and no internal reflection. The beam was incidenton the acrylic at a location halfway between the center and the outer edge of the surface so thatsuccessive rotations of the samples by 90◦ provided four independent (unique) transmission mea-surements. Since the rectangular acrylic samples could not rotate, unique sections were marked outand the entire sample was moved so that the laser passed though them. All of these componentswere then covered by a black optical cloth to block stray light. In general, a dim room light was lefton to ease the testing process. It was found that measurements done with the room lights on but theblack cloth present fluctuated by < 1% compared to those done in complete darkness. A measure-ment of the power was then taken without the presence of acrylic by sliding the entire roller mountfrom the beam path. Moving the acrylic back into the beam path another measurement of the powerwas taken and the acrylic sample was rotated 90◦. This process was then repeated without acrylicand for four unique paths through the sample. Upon the completion of subsequent runs, a laser ofa different wavelength was mounted, aligned, and the process was repeated.
3. Calculating Transmittance Through Acrylic
As an intermediate step to calculating the attenuation length, we calculated the transmittance oflight through each acrylic sample. The simplest definition of transmittance, T , is the ratio of theintensities of incoming light in air Iair to that of light passing through a medium Iacrylic:
T =Iacrylic
Iair(3.1)
Iacrylic can be defined in terms of Iair, the coefficient of attenuation α , and the distance it travelsthrough the medium d:
Iacrylic = Iaire−αd (3.2)
and substituting Equation 3.1 into 3.2
T = e−αd (3.3)
3.1 Reflection at Acrylic Faces
A fraction of the incoming light is expected to be lost, due to reflection. This reflection is dependenton the polarization of the incoming light. For light with an electric field perpendicular to the planeof incidence (s polarization) the reflection coefficient Rs is given by:
Rs =
n1 cosθ −n2
√1− (n1
n2sinθ)2
n1 cosθ +n2
√1− (n1
n2sinθ)2
2
(3.4)
where n1 is the index of refraction of air (n1 = 1), n2 is the index of refraction of acrylic, andθ is the angle of incidence. For light with an electric field parallel to the plane of incidence (ppolarization) the reflection coefficient Rp is given by:
– 8 –
Rp =
n1
√1− (n1
n2sinθ)2 −n2 cosθ
n1
√1− (n1
n2sinθ)2 +n2 cosθ
2
(3.5)
The lasers used in this experiment all emitted unpolarized light which is by definition equalparts p and s polarized light
R =Rs +RP
2(3.6)
or
R =12
n1 cosθ −n2
√1− (n1
n2sinθ)2
n1 cosθ +n2
√1− (n1
n2sinθ)2
2
+12
n1
√1− (n1
n2sinθ)2 −n2 cosθ
n1
√1− (n1
n2sinθ)2 +n2 cosθ
2
(3.7)
Using the index of refraction value of acrylic (n2 = 1.5) we calculate the loss of light due toreflection to be ≈ 4% using θ = 0. This agrees well with the measurements of the reflected lightat different wavelengths while trying to minimize the angle of incidence. Light is reflected at bothacrylic surfaces giving a total loss of light due to reflection of ≈ 8%. Multiple reflections werecalculated to be a negligible effect. Since the transmittance is related to the reflection by
T = 1−R (3.8)
the maximum amount of light transmitted through two surfaces is T = 92%. We can thenmodify Equation 3.1 to get a final equation for calculating the transmittance
T =Iacrylic
(0.92)Iair(3.9)
3.2 Transmittance with Respect to Position
One variable that affects transmittance measurements are surface effects or inconsistencies in themanufacturing of the acrylic samples. To examine the transmittance dependence on orientation theexperiment was designed so that each acrylic sample could be measured at different positions. Oncea set of four positional measurements were completed and the expected value of the transmittancecalculated for each position, the difference between the position with the maximum value and theposition with the minimum value was calculated and are presented in Table 3. The table shows thatthe largest difference in transmittance is 6.2±2.4%, but in general differences are much lower withseveral measuring at < 1%. The largest variance in individual measurements is found in the higherwavelengths but greater differences as a function of orientation appear at lower wavelengths.
3.3 Transmittance Independent of Position
Given the low dependence on orientation of the acrylic samples used it is reasonable to calculatethe transmittance as a set of all positions. Here differences based on the position of the acrylicsample are included in the overall variance of the transmittance. The result for each sample can be
– 9 –

Sample Wavelength (nm)375 405 440 543 632
Difference (%)Tecacryl #1 0±0.1 0.4±0.5 0.7±2.0 0.7±1.8 2.8±2.1Tecacryl #2 0±0.1 0.7±0.1 4.3±0.8 2.3±1.2 1.2±2.4Tecacryl #3 1.5±0.8 1.3±0.4 1.0±1.0 3.0±1.1 1.3±2.5Tecacryl #4 1.8±1.1 1.2±1.8 1.1±1.2 2.0±1.7 0.8±3.8
RPT #1 3.0±0.4 2.8±0.3 0.8±1.0 1.9±1.7 0.5±3.4RPT #2 3.8±0.1 3.2±0.9 2.2±1.1 1.4±1.6 1.1±2.7RPT #3 2.9±0.1 4.1±0.3 2.4±0.8 1.5±0.6 1.1±2.7RPT #4 0±0.1 0.2±0.1 2.1±0.8 1.6±1.8 0.5±2.2
Spartech #1 1.5±0.9 4.2±1.8 3.9±1.1 1.1±1.1 1.8±1.8Spartech #2 0.9±0.9 1.1±2.5 1.0±1.4 0.9±1.4 0.9±3.5
Spartech #3 (short side) 1.0±0.6 1.1±1.1 1.0±1.8 1.9±1.1 0.3±2.3Spartech #3 (long side) 0±0.1 0.5±0.3 0.6±0.7 1.4±1.4 1.3±2.7
Spartech #4 0±0.1 0.2±0.1 6.2±2.4 1.0±1.2 1.3±4.1McMaster (Spartech) #1 0.5±2.3 1.4±0.8 0.4±0.9 0.1±0.9 0.4±2.9McMaster (US Cast) #2 0.1±0.3 0.7±0.4 0.1±2.0 0.2±0.9 0.4±1.6
Table 3. The difference between the minimum and maximum transmittance values reordered for the set offour unique positions of the acrylic sample. All values are measured as % of light transmitted.
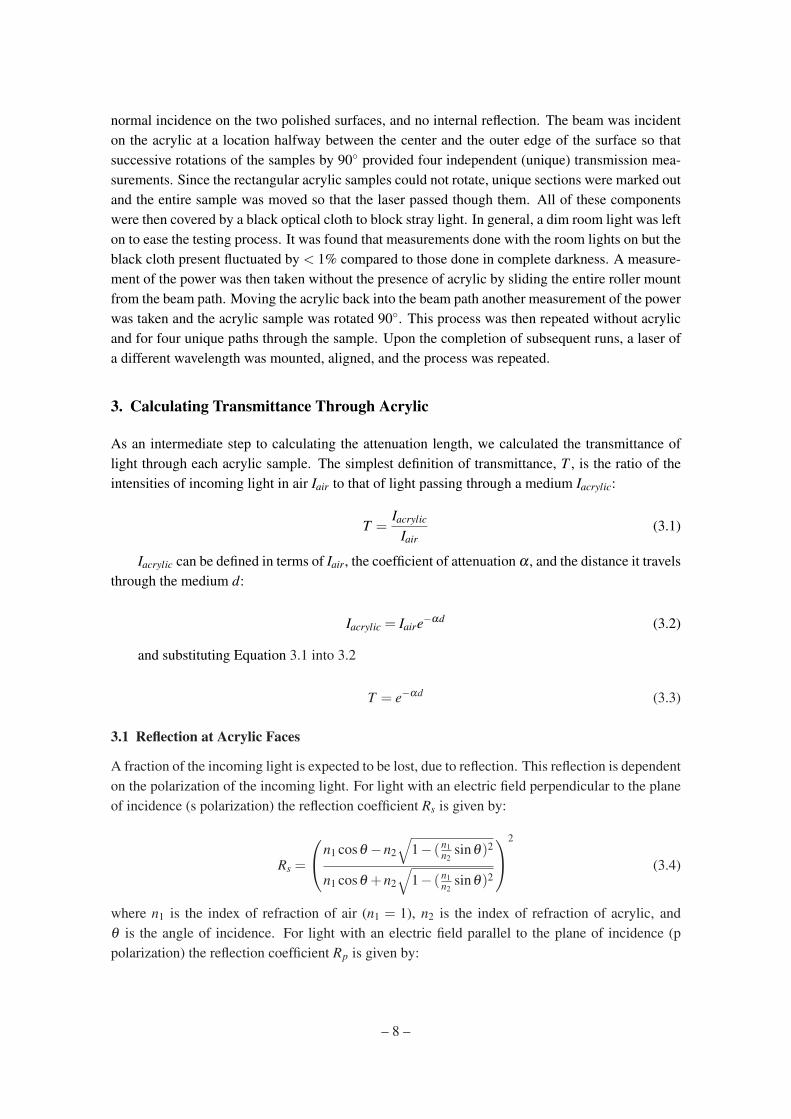
found in Table 4. It is important to remember that the transmittance is only useful to observe thegeneral dependence on wavelength of an individual piece of acrylic or to compare samples withequal lengths. Plots comparing the transmittance of the acrylic samples from each manufacturerare shown in Figure 6. From the table and accompanying plots it is clear that all the acrylic sam-ples have the same general trend. At larger wavelengths (543 and 632 nm) there is almost totaltransmittance even in relatively long samples such as Spartech #4. The transmittance then starts todiminish somewhere between 543 and 440 nm and rapidly decreases as we approach 375 nm. Asexpected, response at lower wavelengths is a function of the sample type (UVA vs. UVT). The un-certainty on the transmittance includes the variation between measurements at different positions,the uncertainty in the power meter reading, and the stability of the lasers during the measurementperiod.
4. Calculating the Attenuation Length
Since the transmittance is dependent on the length of the acrylic sample it is not useful to compareacross all acrylic samples. To remove the dependence on sample length it is necessary to calculatethe attenuation length. Attenuation length is defined as the length of material needed to reduce theincoming beam Intensity to 1
e or to have about 63% of the incoming particles stopped. Recall fromEquation 3.3:
T (d) = e−αd (4.1)
– 10 –
Sample Wavelength (nm)375 405 440 543 632
Transmittance (%)Tecacryl #1 0.1±0.3 20.1±0.3 88.2±1.4 92.3±1.1 97.5±1.9Tecacryl #2 0.1±0.0 7.1±0.3 58.0±1.7 91.3±1.4 91.9±1.7Tecacryl #3 51.2±0.8 79.7±0.6 85.1±0.9 100.0±1.4 97.1±1.8Tecacryl #4 48.5±1.0 79.0±1.1 82.9±1.0 100.0±1.3 96.4±2.8
RPT #1 4.9±1.3 54.9±1.1 69.4±0.7 99.8±1.2 94.3±2.3RPT #2 5.4±1.4 55.7±1.3 69.5±1.1 98.4±1.1 93.2±1.9RPT #3 4.4±1.2 55.3±1.5 70.5±1.1 97.3±0.7 94.6±1.8RPT #4 0.0±0.0 3.8±0.2 56.5±0.9 95.6±1.3 88.8±1.5
Spartech #1 27.1±0.8 48.2±2.0 55.3±1.5 94.8±0.8 95.9±2.1Spartech #2 19.7±0.6 46.3±1.7 55.0±0.9 95.6±0.9 94.6±2.2
Spartech #3 (short side) 22.5±0.6 64.8±0.8 95.9±1.5 100.0±1.0 99.6±1.5Spartech #3 (long side) 0.2±0.0 30.9±0.3 90.4±0.7 100.0±1.1 97.3±1.9
Spartech #4 0.0±0.0 1.2±0.1 64.1±3.4 99.5±0.9 95.7±2.9McMaster (Spartech) #1 73.0±1.4 90.4±0.6 91.9±0.6 100.0±0.6 100.0±1.9McMaster (US Cast) #2 19.1±0.2 80.1±0.3 88.3±1.1 100.0±0.6 100.0±1.0
Table 4. Transmittance values for all acrylic samples combining the data from all positions.
100
80
60
40
20
0
Tran
smitt
ance
(Per
cent
)
650600550500450400350Wavelength (nm)
Tecacryl #1 Tecacryl #2 Tecacryl #3 Tecacryl #4
100
80
60
40
20
0
Tran
smitt
ance
(Per
cent
)
650600550500450400350Wavelength (nm)
RPT #1 RPT #2 RPT #3 RPT #4
100
80
60
40
20
0
Tran
smitt
ance
(Pe
rcen
t)
650600550500450400350Wavelength (nm)
Spartech #1 Spartech #2 Spartech #3 (long side) Spartech #4
100
80
60
40
20
0
Tran
smitt
ance
(Per
cent
)
650600550500450400350Wavelength (nm)
McMaster (Spartech) #1 McMaster (US Cast) #2
Figure 6. Plots of transmittance as a function of wavelength for acrylic samples. Plotted points representthe mean value for the entire set of measurements over all orientations.
– 11 –
Sample Wavelength (nm)375 405 440 543 632
Attenuation Length (m)Tecacryl #1 0.14±0.01 0.57±0.01 7.30±0.93 11.4±1.7 36.7±28.5Tecacryl #2 0.12±0.00 0.35±0.01 1.68±0.09 10.1±1.7 10.8±2.3Tecacryl #3 1.36±0.03 4.03±0.14 5.65±0.38 – 30.6±19.6Tecacryl #4 1.26±0.04 3.87±0.22 4.89±0.30 – 24.9±19.7
RPT #1 0.30±0.03 1.52±0.05 2.50±0.07 492±3270 15.6±6.61RPT #2 0.31±0.02 1.56±0.06 2.51±0.11 56.2±39.4 2.9±3.7RPT #3 0.29± .03 1.55±0.07 2.61±0.11 33.6±8.80 16.5±5.6RPT #4 0.11±0.00 0.28±0.01 1.60±0.05 20.3±6.1 7.7±1.1
Spartech #1 0.70±0.02 1.25±0.07 1.54±0.07 17.1±2.8 22.0±11.8Spartech #2 0.56±0.01 1.19±0.06 1.53±0.04 20.1±4.4 16.5±6.9
Spartech #3 (short side) 0.07±0.00 0.23±0.01 2.41±0.92 – 24.9±95.0Spartech #3 (long side) 0.05±0.00 0.26±0.00 3.01±0.23 – 11.2±8.0
Spartech #4 0.15±0.00 0.28±0.01 2.74±0.33 230±379 27.8±19.3McMaster (Spartech #1 0.48±0.03 1.51±0.11 1.80±0.15 – –McMaster (US Cast) #2 0.18±0.00 1.38±0.03 2.46±0.25 – –
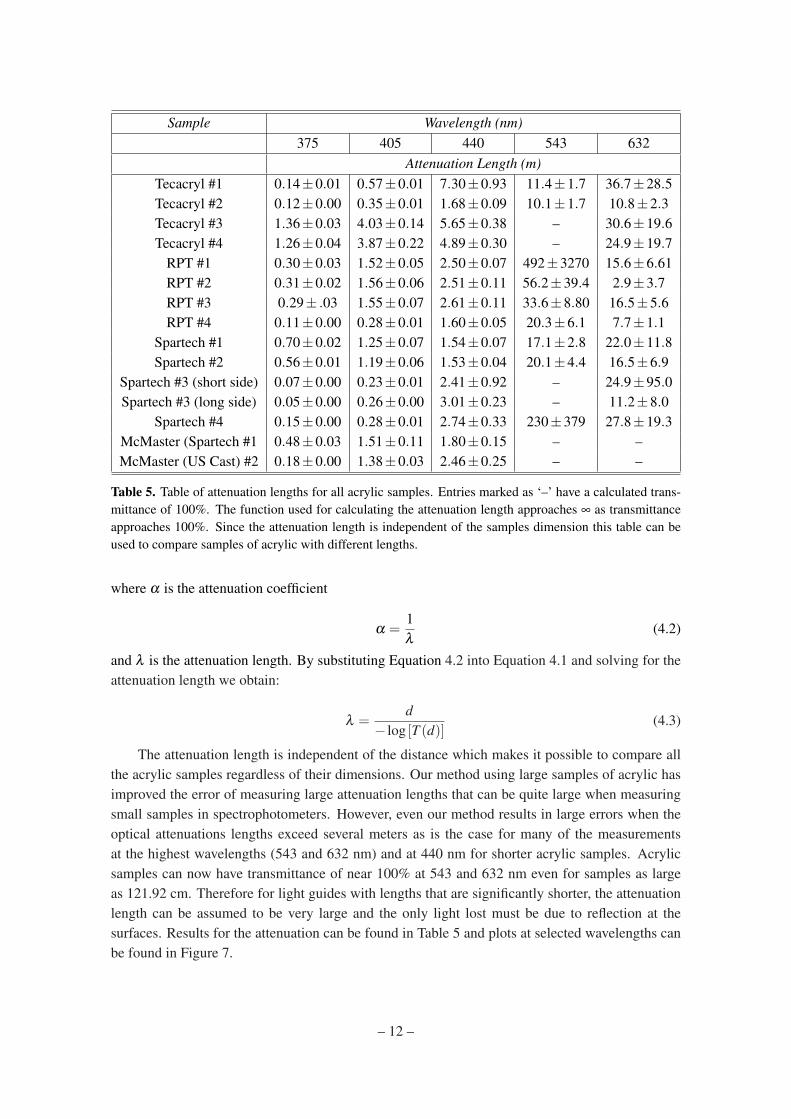
Table 5. Table of attenuation lengths for all acrylic samples. Entries marked as ‘–’ have a calculated trans-mittance of 100%. The function used for calculating the attenuation length approaches ∞ as transmittanceapproaches 100%. Since the attenuation length is independent of the samples dimension this table can beused to compare samples of acrylic with different lengths.
where α is the attenuation coefficient
α =1λ
(4.2)
and λ is the attenuation length. By substituting Equation 4.2 into Equation 4.1 and solving for theattenuation length we obtain:
λ =d
− log [T (d)](4.3)
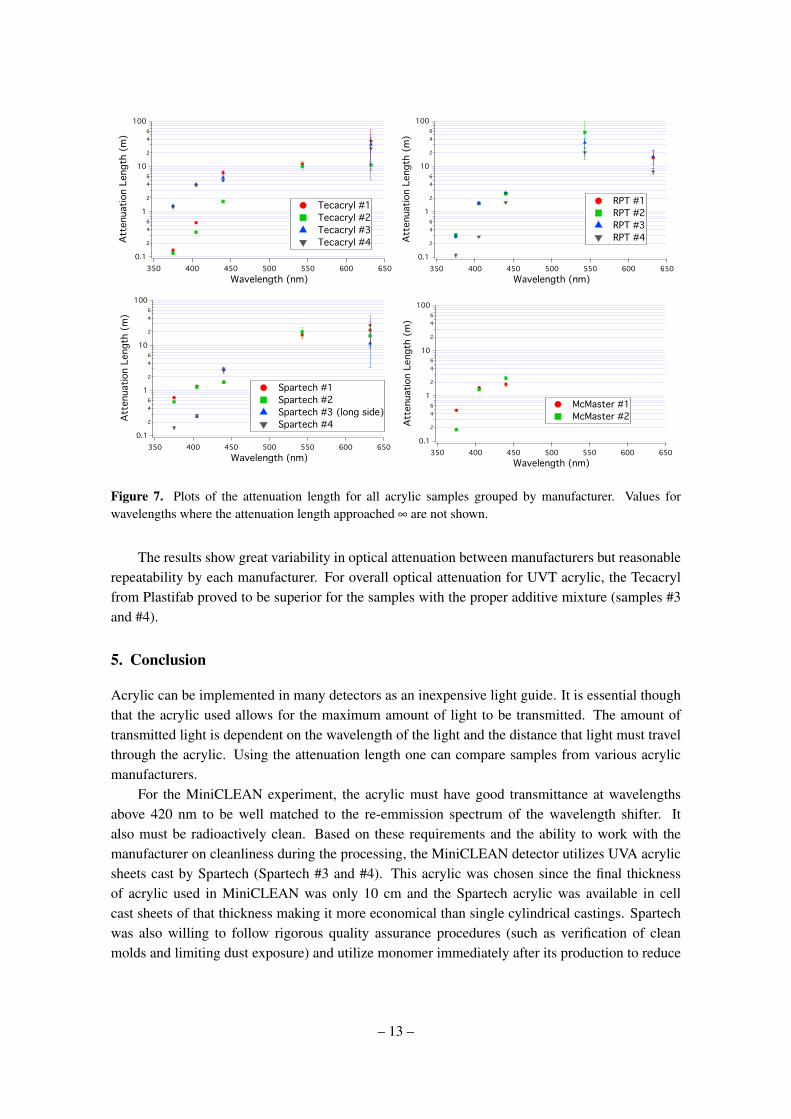
The attenuation length is independent of the distance which makes it possible to compare allthe acrylic samples regardless of their dimensions. Our method using large samples of acrylic hasimproved the error of measuring large attenuation lengths that can be quite large when measuringsmall samples in spectrophotometers. However, even our method results in large errors when theoptical attenuations lengths exceed several meters as is the case for many of the measurementsat the highest wavelengths (543 and 632 nm) and at 440 nm for shorter acrylic samples. Acrylicsamples can now have transmittance of near 100% at 543 and 632 nm even for samples as largeas 121.92 cm. Therefore for light guides with lengths that are significantly shorter, the attenuationlength can be assumed to be very large and the only light lost must be due to reflection at thesurfaces. Results for the attenuation can be found in Table 5 and plots at selected wavelengths canbe found in Figure 7.
– 12 –
0.1
2
46
1
2
46
10
2
46
100At
tenu
atio
n Le
ngth
(m
)
650600550500450400350Wavelength (nm)
Tecacryl #1 Tecacryl #2 Tecacryl #3 Tecacryl #4
0.1
2
46
1
2
46
10
2
46
100
Atte
nuat
ion
Leng
th (
m)
650600550500450400350Wavelength (nm)
RPT #1 RPT #2 RPT #3 RPT #4
0.1
2
46
1
2
46
10
2
46
100
Atte
nuat
ion
Leng
th (
m)
650600550500450400350Wavelength (nm)
Spartech #1 Spartech #2 Spartech #3 (long side) Spartech #4
0.1
2
46
1
2
46
10
2
46
100
Atte
nuat
ion
Leng
th (
m)
650600550500450400350Wavelength (nm)
McMaster #1 McMaster #2
Figure 7. Plots of the attenuation length for all acrylic samples grouped by manufacturer. Values forwavelengths where the attenuation length approached ∞ are not shown.
The results show great variability in optical attenuation between manufacturers but reasonablerepeatability by each manufacturer. For overall optical attenuation for UVT acrylic, the Tecacrylfrom Plastifab proved to be superior for the samples with the proper additive mixture (samples #3and #4).
5. Conclusion
Acrylic can be implemented in many detectors as an inexpensive light guide. It is essential thoughthat the acrylic used allows for the maximum amount of light to be transmitted. The amount oftransmitted light is dependent on the wavelength of the light and the distance that light must travelthrough the acrylic. Using the attenuation length one can compare samples from various acrylicmanufacturers.
For the MiniCLEAN experiment, the acrylic must have good transmittance at wavelengthsabove 420 nm to be well matched to the re-emmission spectrum of the wavelength shifter. Italso must be radioactively clean. Based on these requirements and the ability to work with themanufacturer on cleanliness during the processing, the MiniCLEAN detector utilizes UVA acrylicsheets cast by Spartech (Spartech #3 and #4). This acrylic was chosen since the final thicknessof acrylic used in MiniCLEAN was only 10 cm and the Spartech acrylic was available in cellcast sheets of that thickness making it more economical than single cylindrical castings. Spartechwas also willing to follow rigorous quality assurance procedures (such as verification of cleanmolds and limiting dust exposure) and utilize monomer immediately after its production to reduce
– 13 –

contamination by radon gas naturally present in the air. However, other experiments with differentrequirements and cleanliness concerns will find several excellent acrylic products available on themarket today.
Acknowledgments
We gratefully acknowledge the University of New Mexico Physics and Astronomy machine shopfor their assistance in machining and polishing the acrylic samples and constructing the rollerapparatus. This work was funded by the Los Alamos National Laboratory’s Laboratory DirectedResearch and Development program and the Department of Energy Office of Science High EnergyPhysics program.
References
[1] C. Adams et al., Scientific Opportunities with the Long-Baseline Neutrino Experiment,[hep-ex/1307.7335].
[2] J. Boger et al. (SNO Collaboration), The Sudbury Neutrino Observatory, Nucl. Instr. Meth. A 449(2000) 172.
[3] F.P. An, et al. (Daya Bay Collaboration), A side-by-side comparison of Daya Bay antineutrinodetectors, Nucl. Instr. Meth. A 685 (2012) 78.
[4] H.R. Band, et al., Acrylic Target Vessels for a High-Precision Measurement of theta13 with the DayaBay Antineutrino Detectors, JINST7 (2012) P06004.
[5] M.G. Boulay, (DEAP Collaboration), DEAP-3600 Dark Matter Search at SNOLAB,[astro-ph/1203.0604].
[6] M. Kuzniak, (DEAP Collaboration), Acrylic purification and coatings, AIP Conf. Proc. 1338 (2010)101.
[7] A. Hime,(MiniCLEAN Collaboration), The MiniCLEAN Dark Matter Experiment,[hep-ex/1110.1005].
[8] V.M. Gehman et al., Fluorescence Efficiency and Visible Re-emission Spectrum of TetraphenylButadiene Films at Extreme Ultraviolet Wavelengths, Nucl. Instr. Meth. A 654 (2011) 116[astro-ph/1104.3259v2].
[9] J.D. Stachiw, Handbook of Acrylics for Submersibles, Hyperbaric Chambers, and Aquaria, BestPublishing Company, (2003).
[10] Plastifab, http://www.plastifab.ca
[11] PolyOne, http://www.spartech.com
[12] McMaster-Carr, http://www.mcmaster.com/
[13] Reynolds Polymer Technology, Inc., http://www.reynoldspolymer.com/
[14] Newport Corporation, http://www.newport.com/
[15] NOVUS Plastic Polish, http://www.novuspolish.com/index.html
– 14 –